107 Day and night variability of atmospheric organic and elemental carbon during winter of 2011-12 in Agra, India 1 1 2 2 Atar Singh Pipal, Rohi Jan, Deewan Singh Bisht, Atul Kumar Srivastava, Suresh 2 1, Tiwari and Ajay Taneja * 1 Department of Chemistry Dr. B. R. Ambedkar University Agra 282002, India 2 Indian Institute of Tropical Meteorology New Delhi 110060, India Key Words: PM , carbonaceous aerosols, secondary organic aerosol, black carbon, India 2.5 *Corresponding author Email: [email protected]ABSTRACT INTRODUCTION The mass concentrations of organic carbon and elemental carbon (OC and EC) associated with PM were investigated at a traffic influenced site (roadside) Kandhari, U.P. India during winter of 2.5 2011-12 by semi-continuous carbon analyzer. Individual samples of PM were collected for different 2.5 time periods i.e., 24-h, day and night by medium volume air sampler and analyzed for OC and EC using thermal optical transmittance protocol. Average mass concentration of PM was 183 ± 114 μg 2.5 -3 -3 m and varied from 29 to 612 μg m . Carbonaceous analysis results showed that the average concen- -3 -3 -3 tration of OC varied from 39 to 96 μg m for 24-h, 71 to 89 μg m for day and 64-91 μg m for night -3 while EC varied from 3.4-9.3, 8.9-16.8, 12.4-18.2 μg m for 24-h, day and night samples respec- tively. The OC/EC was estimated which varied between 4.9-47, suggesting the presence of secondary organic aerosol. Carbonaceous aerosol account for 43% of the total PM mass in which the 38% OC 2.5 and 5% EC contributed to total PM concentration. Day and night variation of carbonaceous aerosol 2.5 was also studied and was found that the relative abundance of OC and EC was higher during day time. The high concentration of PM and its associated carbonaceous aerosol species at this site may 2.5 be due to vehicular activities, biomass and fossil fuel combustion. Strong correlation between OC, EC and PM (r = 0.83-0.97) was observed for 24-h samples. Average level of secondary organic 2.5 -3 -3 -3 carbon was 46 μg m for 24-h, 27 μg m for day and 35 μg m for night, accounting for 73, 34 and 46% for 24-h, day and night samples of total OC, respectively. This indicates that the source of OC is from primary emissions as well as secondary emissions in this region. . Carbonaceous aerosol is a matter of concern, due to its complex impacts on human health [1] and the environment [2]. As it is a major component of ambi- ent aerosols, it is important to know its contributions to total aerosol mass for the identification of aerosol sources and subsequently formulating effective control measures. The fine particles have high probability of deposition deeper into the respiratory tract and are likely to trigger or exacerbate respiratory diseases. These particles also have burdens of toxins, and can result in health consequences other than respiratory health effects. Künzli et al. [3] estimated the traffic particulate pollutants in Austria, France and Switzer- land were found to cause 40,000 premature deaths, 25,000 new cases of chronic bronchitis and many chronic bronchitis episodes and asthma attacks. More- over, health impact of assessment indicates that in developing countries 1-3 yr of life may be lost due to traffic particulate pollution [4]. Carbonaceous particles, usually classified as organic carbon (OC) and elemental carbon (EC) are most important constituents of the fine fraction of PM, especially in highly industrialized and urbanized areas [5]. OC represents a large variety of organic com- pounds that can be classified into aliphatic, aromatic compounds, acids, etc and is formed from various . Sustain. Environ. Res., 24(2), 107-116 (2014)
Transcript
107
Day and night variability of atmospheric organic and elemental carbon during winter of 2011-12 in Agra, India
The mass concentrations of organic carbon and elemental carbon (OC and EC) associated with PM were investigated at a traffic influenced site (roadside) Kandhari, U.P. India during winter of 2.5
2011-12 by semi-continuous carbon analyzer. Individual samples of PM were collected for different 2.5
time periods i.e., 24-h, day and night by medium volume air sampler and analyzed for OC and EC using thermal optical transmittance protocol. Average mass concentration of PM was 183 ± 114 µg 2.5
-3 -3m and varied from 29 to 612 µg m . Carbonaceous analysis results showed that the average concen--3 -3 -3tration of OC varied from 39 to 96 µg m for 24-h, 71 to 89 µg m for day and 64-91 µg m for night
-3while EC varied from 3.4-9.3, 8.9-16.8, 12.4-18.2 µg m for 24-h, day and night samples respec-tively. The OC/EC was estimated which varied between 4.9-47, suggesting the presence of secondary organic aerosol. Carbonaceous aerosol account for 43% of the total PM mass in which the 38% OC 2.5
and 5% EC contributed to total PM concentration. Day and night variation of carbonaceous aerosol 2.5
was also studied and was found that the relative abundance of OC and EC was higher during day time. The high concentration of PM and its associated carbonaceous aerosol species at this site may 2.5
be due to vehicular activities, biomass and fossil fuel combustion. Strong correlation between OC, EC and PM (r = 0.83-0.97) was observed for 24-h samples. Average level of secondary organic 2.5
-3 -3 -3carbon was 46 µg m for 24-h, 27 µg m for day and 35 µg m for night, accounting for 73, 34 and 46% for 24-h, day and night samples of total OC, respectively. This indicates that the source of OC is from primary emissions as well as secondary emissions in this region. .
Carbonaceous aerosol is a matter of concern, due to its complex impacts on human health [1] and the environment [2]. As it is a major component of ambi-ent aerosols, it is important to know its contributions to total aerosol mass for the identification of aerosol sources and subsequently formulating effective control measures. The fine particles have high probability of deposition deeper into the respiratory tract and are likely to trigger or exacerbate respiratory diseases. These particles also have burdens of toxins, and can result in health consequences other than respiratory health effects. Künzli et al. [3] estimated the traffic
particulate pollutants in Austria, France and Switzer-land were found to cause 40,000 premature deaths, 25,000 new cases of chronic bronchitis and many chronic bronchitis episodes and asthma attacks. More-over, health impact of assessment indicates that in developing countries 1-3 yr of life may be lost due to traffic particulate pollution [4]. Carbonaceous particles, usually classified as organic carbon (OC) and elemental carbon (EC) are most important constituents of the fine fraction of PM, especially in highly industrialized and urbanized areas [5]. OC represents a large variety of organic com-pounds that can be classified into aliphatic, aromatic compounds, acids, etc and is formed from various
.
Sustain. Environ. Res., 24(2), 107-116 (2014)
108
sources (e.g., combustion, industrial, and natural sources) and complex atmospheric processes (direct emission, homogenous gas-phase oxidation, gas-aerosol partitioning, heterogeneous oxidation, etc.). It also consists of water-soluble organic carbon (WSOC) and water-insoluble carbon compounds. WSOC is not only a major contributor to cloud condensation nuclei, but also probably involves in the complex and un-known aqueous phase chemistry of wet aerosol, fog, and clouds. WSOC is approximately 20-35% of OC fraction and 90% of it consists of oxygenated organic aerosol [6] within urban air. EC is a mixture of graphite-like particles and light-absorbing organic matter. Moreover, the surface of EC particles contains numerous adsorption sites that are capable of en-hancing catalytic processes. EC may involve in some important chemical reactions involving atmospheric sulfur dioxide (SO ), nitrogen oxides (NOx), ozone 2
and other gaseous compounds due to its catalytic properties [7]. Atmospheric OC and EC concentrations in developing countries have increased in recent decades with rapid economic growth. It is contributing 20-50% of atmospheric aerosol in heavy polluted atmosphere [8]. Carbonaceous particles are partly directly emitted into the atmosphere by combustion of fossil fuels and biomass burning, as well as by non-combustion proc-esses (these particles can be biological particles, plant fragments, soil derived humic material, etc.). The direct emission of carbonaceous particles from the source is called primary aerosol whereas another part of secondary organic aerosol (SOA) is formed from precursor gases by chemical reactions in the atmos-phere [9]. Ram and Sarin [10] have suggested that during the winter time (Dec-Feb) the entire Indo Gangetic Plain (IGP) in northern India provides an ideal site to study the role of primary pollutants and secondary aerosol formation due to fog haze weather conditions and reduction in visibility. Furthermore carbonaceous aerosol combustion accounts for 30-35% of the total suspended particulate (TSP) mass over IGP during the winter time [10]. The present study has been conducted at roadsidewhich is directly affected by heavy traffic on national highway (NH-2) - recognized as one of the major sources of particulate air pollution [11]. Therefore, to understand transport mainly from sources region i.e., IGP, and transformation characteristics of anthropo-genic air pollutants and their effect on various aspects of regional and global environment changes, it is important to measure carbonaceous species. It may play an important role in global climate change by ejecting radiative forcing [12]. Thus, the OC and EC measurements become more important when consider-ing personal exposure, local environmental effects, and effects on regional and global scales, such as radiative forcing effect. Therefore, the aim of the present study is (i) to characterize of PM in terms of carbonaceous 2.5
aerosol species, (ii) to assess their probable sources
.
.
and their trends during day and night, and (iii) the formation of SOA during different time periods at a roadside monitoring station in Northern part of India. .
MATERIALS AND METHODS
1. Site Description
Agra (27°10' N 78°02' E) is located in the North central part of the India, about 204 km of south of Delhi in the Indian state of Uttar Pradesh. It is one of the most famous tourist spots in India because of the presence of Taj Mahal, situated on the west bank of river the Yamuna. The climate during winter is cooled with moisture and the temperature ranges from 3.5 to 30.5 °C and downwind West-North-West i.e., WNW 9.4% and North-North-West 11.8%. The atmospheric pollution load was higher when wind blows from WNW because oil refinery at Mathura (50 km far from the centre of the city) is located there and pollutants may be transported. Agra has about 1.3 million inhab-itants and the population density is about 21,150
-2persons km with 386,635 vehicles registered and 32,030 generator sets. In Agra, 60% pollution is mainly due to vehicular emissions from three national high-ways (NH-2, NH-3 and NH-11) cross the city. Pipal et al. [11] have reported a high density of vehicular
5 -1traffic (10 vehicles d ) on these three highways.
2. Sampling Site
PM samples were collected from a roadside i.e., 2.5
Khandari site during winter season (2011-2012) (Fig. 1). The roadside is directly affected by heavy traffic emission on NH-2. This site is located about 200 m away from major national highway (NH-2) which is one of the busiest highways, connecting Delhi to
Kolkata via Agra. Sharma et al. [13] have also found that approximately 6000-7000 vehicles passes daily this highway to several public institutions, schools, University, colleges, shoe factories, and transport Nagar. Apart from this, Inter State Bus Terminal is situated approximately 2 km west of this site.
.
.
.
.
.
.
3. Sampling and Analysis
3.1. Sampling
Aerosol samples of PM were collected on the 2.5
roof of building at the roadside. The sampler was set up at the top (25 m above the ground) of the building roof. Aerosol samples were collected separately for 24-h (day-night), day (10 am to 5 pm) and night (6 pm to 6 am) respectively on quartz filter papers by a medium-volume sampler (model: APM 550,
-1Envirotech, New Delhi) at flow rate: 16.6 L min . Two samples were collected for 24-h and one sample each for day and night time in a week to follow the weekly trends of PM and its carbonaceous aerosols 2.5
Pipal et al., Sustain. Environ. Res., 24(2), 107-116 (2014)
109
Fig. 1. Map of Agra city showing sampling site.
viz. OC and EC. There is more chance in varying the PM mass and its carbonaceous species in winter due 2.5
to vehicular activities and local sources like wood, cow dung, and crop residue burning for space heating. The samples were put in polyethylene plastic bags immediately after sampling and then preserved in desiccators for subsequent measurements of mass concentrations and OC/EC concentrations.
3.2. Quality control
The sampler is designed to work at a constant flow -1rate of 16.7 ± 0.8 L min . Daily flow rate calculation
(gas meter reading/timer reading) was made to make sure that the fluctuation in flow rate was within the range. Chow and Watson [14] have suggested filter change in the Wins Impactor after 72 h of sampling, but in this study filter was changed after 48 h. Periodic cleaning of the sampler was done to make the sampler dust free.
3.3. Gravimetric analysis
Filter papers were weighed thrice before and after sampling by using microbalance (A&D, model GR-202, Japan). Before weighing, the samples were
.
.
.
.
desiccated at 20-30 °C and relative humidity (RH) of 30-40% in humidity controlled room for 24 h. The aerosol mass concentration of PM was ascertained 2.5
gravimetrically by weighing the full filters before and after the sampling.
3.4. OC/EC analysis
Exposed filter papers of PM were analyzed for 2.5
the concentrations of OC and EC by semi-continuous thermal/optical carbon analyzer (Sunset Laboratory Model 4L) using NIOSH 5040 (National Institute for Occupational Safety and Health) protocol [15]. Briefly,
2an aliquot of sample filter (2.1 cm ) is stepwise heated in a furnace up to 840 °C in a non-oxidizing atmosphere (100% He); furnace is then cooled to 550 °C and filter is stepwise heated to 850 °C in an oxi-dizing atmosphere (90% He, 10% O ), during each 2
temperature step, evolved carbon is converted to methane and detected by a flame ionization detector. A calibration is performed at the end of each analysis by introducing a known amount of methane gas into the oven and measuring its constant response. The carbon evolved before the split line is considered as OC, and that evolved after the split line is quantified as EC.
.
.
.
Pipal et al., Sustain. Environ. Res., 24(2), 107-116 (2014)
110
Fig. 2.
RESULTS AND DISCUSSION
1. Meteorological Parameters
Meteorological parameters like wind speed (WS); wind direction (WD), RH and air temperature were measured in an automatic weather station (Envirotech WM251) which is situated approximately at 2 km away from the site. Monthly average concentration of
-1WS was 2.5 ± 0.4 m s , WD 174 ± 28 degree, air tem-perature 16.8 ± 4.9 °C and RH 62 ± 9%. The day to day variations of meteorological parameters are shown in Fig. 2 which shows that the WD varied from 69-298 degree, RH between 48 and 87%, atmospheric temperature from 5.5-22.2 °C and WS varied from
-11.34-5.32 m s during the sampling periods. Higher -1WS (5.32 m s ) were observed in the month of January
2012 on (4/01/2012) with WD (298 degree) whereas higher atmospheric temperature (22.2 °C) was observed in a month of February (7/02/2012) while higher RH (87%) was observed on 18/1/2012 within sampling period. Detail discussions between meteorological parameters and aerosols mass concen-tration are covered in latter section.
1.1. Concentration of PM 2.5
The average mass concentration of PM over 2.5-3study period was 183 ± 144 µg m varying from 29 to
-3612 µg m during the winter season of 2011-2012. The mean value of present study is 3-4 times higher, comparing with the National Ambient Air Quality Standards [16] given by Central Pollution Control Board, India and 7-8 times higher than World Health Organization standards [17]. Higher concentrations of
-3PM were in the month of December (313 µg m ) and 2.5-3lower in the month of February (102 µg m ). In the
-1month of Feb. 2012, the WS was higher (3.02 m s ) and pollutants disperse quickly into the atmosphere. Apart from this the WD was also different in this month and was from SW direction. In December, due to low calm condition and lower temperature, higher concentration was observed. Overall higher concentrations of PM at this site may be mainly due 2.5
to vehicular activities, biomass, fossil fuels, road dust and industrial effects. Duan et al. and Hsieh et al. [18,
19] have suggested that in addition to this, the fine particles may also be emitted due to more volatile organic compounds (VOC) condensing into aerosol at lower ambient temperature and more residential combustion of coal and wood for space heating during winter. In the present study, the VOC analysis was not done. During the entire study period, the large variation in PM concentrations could be due to the 2.5
thermodynamic conditions in the planetary boundary layer, which either favors or adversely affects pollu-tants dispersion. Ambient atmospheric conditions, such as air temperature, RH and short wave radiation, could also influence the chemical reactions leading to
.
.
.
secondary aerosol formation. Stable atmospheric conditions with low mixing height may result in sig-nificantly enhanced particulate concentrations [20]. During winter, very frequent and persistent thermal inversion and foggy conditions at ground level cause a considerable amount of aerosols to accumulate in the lower layers of the atmosphere. Aerosol concen-trations during winter were also largely due to massive biomass burning over western part of India especially Haryana and Punjab states [21].
1.2. Concentrations of carbonaceous aerosols
The monthly average concentrations of OC and EC during different time period along with some statistical information are shown in Table 1. Average
-3 -3concentration of OC was 58 µg m for 24-h, 76 µg m -3 for day and 72 µg m for night while EC was 5.2, 13
-3 and 15 µg m for 24-h, day and night, respectively. -3Concentration of OC varied from 39-96 µg m for
-3 -3 24-h, 71-89 µg m for day and 64-91 µg m for night
.
.
Pipal et al., Sustain. Environ. Res., 24(2), 107-116 (2014)
Daily variations of meteorological parameters for different months. (a: Nov. 11; b: Dec. 11; C: Jan. 12 and D: Feb. 12) WS = Wind speed, RH = Relative humidity, AT = Atmospheric temperature, WD = Wind direction. .
WD
, RH
-1 WD Degree RH % WS m s AT °C
Sampling period
AT
, WS
a
b
c
d
X
111
Table 1. Average monthly concentration in terms of full day, during day and night separately of carbonaceous species in PM 2.5
-3 while EC between 3.4-9.3, 9-17, 12-18 µg m for 24-h, day and night, respectively (Fig. 3). The mass concen-tration of PM and its carbonaceous species viz. OC 2.5
and EC are different between 24-h samples and aggregate of day and night. These differences are observed as separate samples of PM were collected 2.5
in which the first two samples were taken for 24 h after that individual sample for day and night was taken per week. Higher concentration of carbonaceous aerosol species (OC and EC) at this site is due to emission from vehicular exhaust, coal combustion, biomass and fossil fuels burning, wood used in cooking, road dust [22]. The major variation in con-centration of carbonaceous aerosol species was ob-served during 24-h sampling than day and night because of the present study being conducted at the heavy traffic site during different time periods. These variations are due to variable sources which are of local use and transported during different time periods such as EC arises from the incomplete combustion of various kinds of organic material, including coal, oil, petrol, wood and other biomass [23]. Primary organic carbon has similar sources, but it also generated from resuspension of traffic related dust and primary biogenic particles like viruses, bacteria, pollens and their fragments, fungal spores and all kinds of vegeta-tion debris [24].
1.3. OC/EC ratios
Concentrations of carbonaceous species and theirratios over Agra along with comparison with other studies carried out in other parts of the world are shown in Table 2. The OC/EC ratio is more or less uniform with relatively high values during winter, due to the change in the relative strength of their sources. For comparison OC, EC and OC/EC ratios reported over a few urban (except roadside) cities of India and other countries are also presented in Table 2. The OC, EC values reported in this study are higher than those of all other studies [18,22,25-37], but significantly lower than those of Husain et al. [28] at Lahore and Singh et al. [34] at Delhi. The concentrations of OC
.
.
and EC done in Agra in 2010 by Satsangi et al. [33] in TSP were found to be almost similar to our study for PM . Carbonaceous aerosol represents a mixture of 2.5
various emission sources (EC and primary OC) and secondary OC formed by atmospheric reaction proc-esses, the ratios of OC to EC concentrations (OC/EC) can be used to evaluate emission and transportation characteristics. For example, diesel and gasoline powered vehicular exhaust exhibits OC/EC = 1-4.2 [38], residential coal smoke has OC/EC = 2.5-10.5 [39], and biomass burning with OC/EC = 7.7 [40]. In this study the average OC/EC ratios ranged from 4.9
SD = Standard deviation
Pipal et al., Sustain. Environ. Res., 24(2), 107-116 (2014)
Nov
Dec
Jan
Feb
Ave
SD
24 h
162
313
179
102
189
89
Day
75
239
90
136
135
74
Night
97
245
120
102
141
70
24 h
45
96
54
39
58
26
Day
71
89
72
72
76
8.7
Night
66
91
64
64
72
13
24-h
3.4
9.3
3.7
4.2
5.2
2.8
Day
14
17
8.9
13
13
3.2
Night
18
15
13
12
15
2.6
24-h
13
10
15
9.3
12
2.5
Day
5.2
5.3
8.0
5.7
6.1
1.3
Night
3.6
5.9
4.8
5.2
4.9
1.0
-3PM (ìg m )2.5
-3 OC (ìg m ) -3EC (ìg m ) OC/EC
Fig. 3. Concentration of carbonaceous species for different time periods.
C
once
ntra
tion
24
h
Con
cent
rati
on d
ay
Con
cent
rati
on n
ight
-3 OC ìg m -3EC ìg m
EC
a
b
c
OC
Samples
112
to 47 which suggests the presence of SOA. Figure 4 shows the variations in OC/EC ratios during different time periods such as 24 h, day and night respectively. It can be also concluded that the emission of OC and EC is from the variable sources in the study area, i.e., vehicular exhaust, residential coal smoke and biomass burning. The variation in the OC/EC ratios may in-dicate changes in emission sources, source process or source region, and EC may be considered as tracer for primary sources of carbonaceous species [9,23]. In this study much higher OC/EC ratios were observed in sample 3 for 24-h and sample 5 for night sampling (Fig. 4), probably due to the fact that sampling was done in winter during nighttime and people in this area burned wood, cow dung, and crop residue to keep warm.
1.4. SOA
Particulate OC has also a secondary origin from gas to particle conversion of VOCs in the atmosphere. Due to its primary character, atmospheric EC can be used as a tracer for primary OC in PM if the ratio of 2.5
(OC/EC) for each source and the contribution of primary
different sources at the measurement site are known [23]. The concentration of SOA in the PM can be 2.5
calculated as:
.
.
.
Fig. 4. OC/EC ratios during the study period.
Table 2. Concentration of carbonaceous species over Northern India and their comparison with the studies done in India -3 as well as other parts of the world (µg m )
City
Agra
Ahemdabad
Mumbai
Hisar
Dhaka
Lahore
Taiwan
Shanghai
Hong Kong
Italy
Beijing
Agra
Delhi
Seattle, USA
Nanjing
Amsterdam, Netherland
Height (m)
25
40
10
5
3
12
5
18
-
-
-
-
-
-
-
-
Site
Roadside
Urban
Urban
Urban
-
Urban
Urban
Road
-
-
Suburban
Urban
Urban
Hill
-
Urban
Period
24-h
Day
Night
-
-
-
-
-
-
-
-
-
24
24
-
-
-
24
OC
58
76
72
13
25
33
46
110
15
15
12
9.6
8.2
61
69
5.7
13
5.3
EC
5.2
13
15
2.1
13
3.8
22
18
6.1
6.8
3.4
1.4
4.9
7.5
39
0.9
3.7
1.8
OC/EC
11.7
6.1
4.9
8.3
2.0
8.5
2.1
5.6
2.4
2.3
3.5
6.9
8.1
2.2
6.1
3.6
2.9
Size
PM2.5
TSP
PM10
TSP
-
PM2.5
PM , PM2.5 10
PM2.5
PM2.5
PM2.5
TSP
PM10
PM2.5
PM2.5
PM2.5
Reference
Present study
[22]
[25]
[26]
[27]
[28]
[29]
[30]
[18]
[31]
[32]
[33]
[34]
[35]
[36]
[37]
OC = (OC/EC) *ECprimary primary
SOA = OC - Octotal primary
Where (OC/EC) is the average primary OC/EC primary
ratio. Depending on the nature of the measurement site, it is difficult to know the exact contribution of different primary sources without performing a detailed source analysis. However, several authors have used the OC/EC ratio to estimate the contribution of SOA to the total OC [10,27]. In this study the primary OC/EC ratio has been estimated from atmos-pheric data assuming either that the lowest observed OC/EC ratios represent primary aerosols [29]. Table 3 shows the month wise values of SOA and its average in the atmosphere which are calculated by using above
Pipal et al., Sustain. Environ. Res., 24(2), 107-116 (2014)
Samples
OC
/EC
val
ues
24 Day Night
113
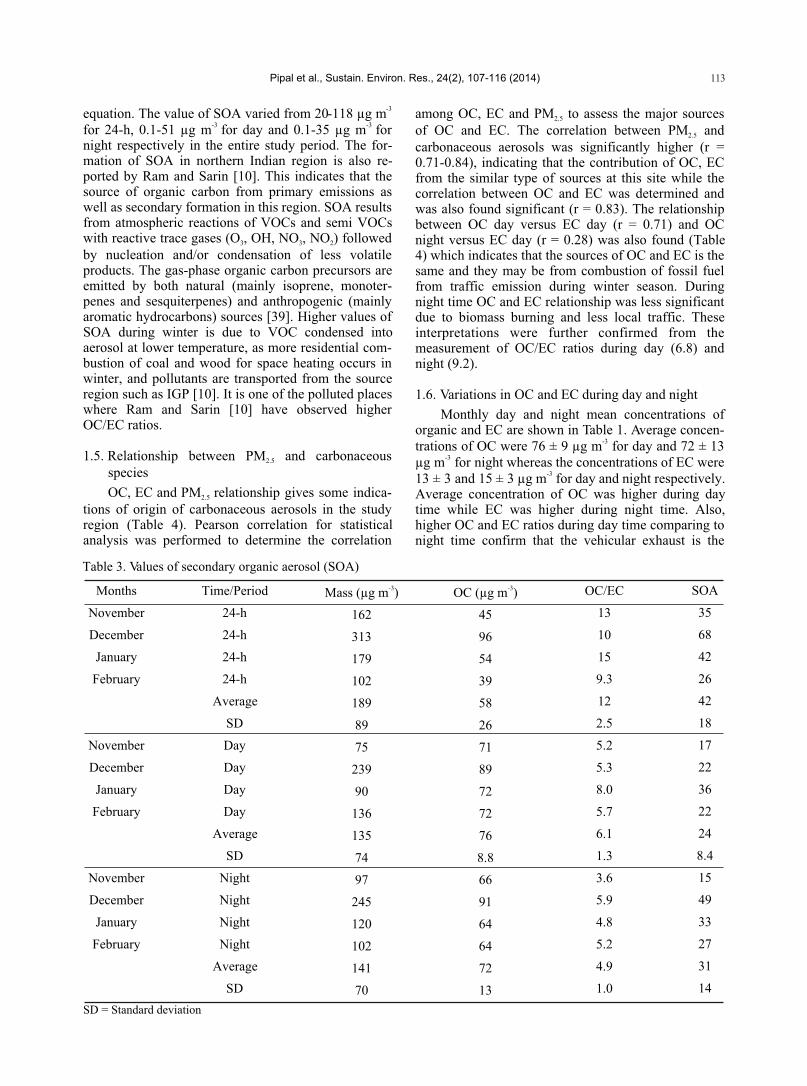
-3 equation. The value of SOA varied from 20-118 µg m-3 -3 for 24-h, 0.1-51 µg m for day and 0.1-35 µg m for
night respectively in the entire study period. The for-mation of SOA in northern Indian region is also re-ported by Ram and Sarin [10]. This indicates that the source of organic carbon from primary emissions as well as secondary formation in this region. SOA results from atmospheric reactions of VOCs and semi VOCs with reactive trace gases (O , OH, NO , NO ) followed 3 3 2
by nucleation and/or condensation of less volatile products. The gas-phase organic carbon precursors are emitted by both natural (mainly isoprene, monoter-penes and sesquiterpenes) and anthropogenic (mainly aromatic hydrocarbons) sources [39]. Higher values of SOA during winter is due to VOC condensed into aerosol at lower temperature, as more residential com-bustion of coal and wood for space heating occurs in winter, and pollutants are transported from the source region such as IGP [10]. It is one of the polluted places where Ram and Sarin [10] have observed higher OC/EC ratios.
1.5. Relationship between PM and carbonaceous 2.5
species
OC, EC and PM relationship gives some indica-2.5
tions of origin of carbonaceous aerosols in the study region (Table 4). Pearson correlation for statistical analysis was performed to determine the correlation
.
.
Table 3. Values of secondary organic aerosol (SOA)
Months
November
December
January
February
November
December
January
February
November
December
January
February
Time/Period
24-h
24-h
24-h
24-h
Average
SD
Day
Day
Day
Day
Average
SD
Night
Night
Night
Night
Average
SD
-3Mass (µg m )
162
313
179
102
189
89
75
239
90
136
135
74
97
245
120
102
141
70
-3OC (µg m )
45
96
54
39
58
26
71
89
72
72
76
8.8
66
91
64
64
72
13
OC/EC
13
10
15
9.3
12
2.5
5.2
5.3
8.0
5.7
6.1
1.3
3.6
5.9
4.8
5.2
4.9
1.0
SOA
35
68
42
26
42
18
17
22
36
22
24
8.4
15
49
33
27
31
14
SD = Standard deviation
Pipal et al., Sustain. Environ. Res., 24(2), 107-116 (2014)
among OC, EC and PM to assess the major sources 2.5
of OC and EC. The correlation between PM and 2.5
carbonaceous aerosols was significantly higher (r = 0.71-0.84), indicating that the contribution of OC, EC from the similar type of sources at this site while the correlation between OC and EC was determined and was also found significant (r = 0.83). The relationship between OC day versus EC day (r = 0.71) and OC night versus EC day (r = 0.28) was also found (Table 4) which indicates that the sources of OC and EC is the same and they may be from combustion of fossil fuel from traffic emission during winter season. During night time OC and EC relationship was less significant due to biomass burning and less local traffic. These interpretations were further confirmed from the measurement of OC/EC ratios during day (6.8) and night (9.2).
1.6. Variations in OC and EC during day and night
Monthly day and night mean concentrations of organic and EC are shown in Table 1. Average concen-
-3trations of OC were 76 ± 9 µg m for day and 72 ± 13 -3µg m for night whereas the concentrations of EC were
-313 ± 3 and 15 ± 3 µg m for day and night respectively. Average concentration of OC was higher during day time while EC was higher during night time. Also, higher OC and EC ratios during day time comparing to night time confirm that the vehicular exhaust is the
.
.
114
Table 4. Values of correlation coefficients (r) between OC, EC and other parameters
OC 24-h
OC day
OC night
EC 24-h
EC day
EC night
PM2.5
0.75
0.29
0.71
0.84
0.68
0.07
OC 24-h
-
-
0.15
-
-
-
OC day
-
-
-
-
-
-
OC night
-
0.15
-
-
0.25
-
EC 24-h
0.83
-
-
-
-
-
EC day
-
0.71
0.28
-
-
-
EC night
0.20
0.20
0.28
-
0.25
-
CONCLUSIONS
Characteristics of mass PM and carbonaceous 2.5
aerosol species were investigated at roadside in India during winter season of 2011-12. Average concentra-
-3tion of PM was 183 ± 114 µg m varied from 29-612 2.5 -3ìg m which is 3-4 times higher than National Ambient
Air Quality Standards given by Central Pollution Control Board, India and 7-8 times higher than World health Organization standards. Carbonaceous analysis results showed that the average concentration of OC
-3 -3 varied from 39 to 96 ìg m for 24-h, 71 to 89 ìg m for -3 day and 64 to 91 ìg m for night while EC varied from
-3 3.4-9.3, 9-17, 12-18 ìg m for 24-h, day and night respectively. The OC/EC ratios were observed between 4.9 and 47 which suggested the presence of SOA, SOA was higher during day time than night and 24-h
-3samples. Mean level of SOA was 46 µg m for 24-h, -3 -327 µg m for day and 35 µg m for night, accounting
for 73, 34 and 46% for 24-h, day and night samples of total OC. Carbonaceous aerosol account for 43% of the PM mass in which the emission of OC is 38% 2.5
with EC 5%. The relative abundance of OC and EC components was higher during day time. The higher concentration of PM and associated carbonaceous 2.5
aerosol species at this site is due to vehicular activities, biomass and fossil fuel combustion. There is high correlation of OC-EC with PM (r: 0.68-0.97) and OC 2.5
with EC (r: 0.71-0.83) for 24-h samples. This indicates the sources of organic carbon from primary emissions as well as secondary emissions in this region. The variations in OC and EC concentration are observed during different time periods due to local meteoro-logical conditions and transported sources. .
ACKNOWLEDGEMENTS
We are thankful to University Grant Commission (RGNF-2011-12) New Delhi for financial support for this work. We are also thankful to Indian Institute Tropical Meteorology (IITM) laboratory New Delhi for analyzing the carbonaceous aerosols. .
REFERENCES
Nel, A., Air pollution-related illness: Effects of particles. Science, 308(5723), 804-806 (2005). Ramanathan, V., P.J. Crutzen, J.T. Kiehl and D. Rosenfeld, Atmosphere - Aerosols, climate, and the hydrological cycle. Science, 294(5549), 2119-2124 (2001). Künzli, N., R. Kaiser, S. Medina, M. Studnicka, O. Chanel, P. Filliger, M. Herry, F. Horak, V. Puybonnieux-Texier, P. Quenel, J. Schneider, R. Seethaler, J.C. Vergnaud and H. Sommer, Public-health impact of outdoor and traffic-related air pollution: A European assessment. Lancet, 356(9232), 795-801 (2000). Hong, G.B., C.M. Ma, S.Y. Liou and C.T. Chang, PM particulate emissions from stack flue gas in 10
Taiwan. Sustain. Environ. Res., 22(3), 173-176
.
.
.
1.
2.
3.
4.
Pipal et al., Sustain. Environ. Res., 24(2), 107-116 (2014)
dominant sources of OC and EC during day time [37]. SOA was also determined and was higher during night time samples due to stagnant and low temperature which resulted in more SOA formation in winter [20]. It was found that insignificant correlation between day-night OC-EC except day OC-EC (Table 4) inferred that the emission of carbonaceous aerosol species was from different type of sources during day and night. These variations in OC and EC concentration are observed during different time periods due to local meteorological conditions and transportation sources. .
(2012). Chou, M.S. and Y.Y. Lo, Surface characteristics of particulate matter collected from industrial sources. Sustain. Environ. Res., 22(4), 225-236 (2012). Matsui, H., M. Koike, N. Takegawa, Y. Kondo, R.J. Griffin, Y. Miyazaki, Y. Yokouchi and T. Ohara, Secondary organic aerosol formation in urban air: Temporal variations and possible contributions from unidentified hydrocarbons. J. Geophys. Res. Atmos., 114(D4), 1-22 (2009). Gundel, L.A., N.S. Guyot-Sionnest and T. Novakov, A study of the interaction of NO with 2
carbon particles. Aerosol Sci. Tech., 10(2), 343-351 (1989). Rogge, W.F., L.M. Hildemann, M.A. Mazurek, G.R. Cass and B.R.T. Simoneit, Sources of fine organic aerosol. 3. Road dust, tire debris and organometallic brake lining dust: Roads as sources
.
.
.
.
5.
6.
7.
8.
115
Organization, Copenhagen, Denmark.
005). Duan, J.C., J.H. Tan, D.X. Cheng, X.H. Bi, W.J. Deng, G.Y. Sheng, J.M. Fu and M.H. Wong, Sources and characteristics of carbonaceous aerosol in two largest cities in Pearl River Delta Region, China. Atmos. Environ., 41(14), 2895-2903 (2007). Hsieh, L.T., H.H. Yang, Y.C. Lin and C.H. Tsai, Levels and composition of volatile organic compounds from the electric oven during roasting pork activities. Sustain. Environ. Res., 22(1), 17-24 (2012). Kaupp, H. and M.S. McLachlan, Atmospheric particle size distributions of polychlorinated dibenzo-p-dioxins and dibenzofurans (PCDD/Fs)and polycyclic aromatic hydrocarbons (PAHs) and their implications for wet and dry deposition.
Pipal et al., Sustain. Environ. Res., 24(2), 107-116 (2014)
and sinks. Environ. Sci. Technol., 27(9), 1892-1904 (1993). Turpin, B.J. and J.J. Huntzicker, Identification of secondary organic aerosol episodes and quantitation of primary and secondary organic aerosol concentrations during SCAQS. Atmos. Environ., 29(23), 3527-3544 (1995). Ram, K. and M.M. Sarin, Day-night variability of EC, OC, WSOC and inorganic ions in urban environment of Indo-Gangetic Plain: Implications to secondary aerosol formation. Atmos. Environ., 45(2), 460-468 (2011). Pipal, A.S., A. Kulshrestha and A. Taneja, Characterization and morphological analysis of airborne PM and PM in Agra located in north 2.5 10
central India. Atmos. Environ., 45(21), 3621-3630 (2011). Dominick, D., M.T. Latif, H. Juahir, A.Z. Aris and S.M. Zain, An assessment of influence of meteorological factors on PM and NO at 10 2
selected stations in Malaysia. Sustain. Environ. Res., 22(5), 305-315 (2012). Sharma, A., D. Massey and A. Taneja, Horizontal gradients of traffic related air pollutants near a major highway in Agra, India. Indian J. Radio Space, 38(6), 338-346 (2009). Chow, J.C. and J.G. Watson, Guidelines on Speculated Particulate Monitoring. US Environmental Protection Agency, Research Triangle Park, NC (1998). Birch, M.E. and R.A. Cary, Elemental carbon-based method for monitoring occupational exposures to particulate diesel exhaust. Aerosol Sci. Tech., 25(3), 221-241 (1996). CPCB, National Ambient Air Quality Standards. Central Pollution Control Board, New Delhi, India. http://cpcb.nic.in/National_Ambient_Air_Quality_Standards.php (2009). WHO, Air Quality Guidelines. World Health
.
.
.
.
.
.
.
.
.
9.
10.
11.
12.
13.
14.
15.
16.
17.
Atmos. Environ., 33(1), 85-95 (1999). Awasthi, A., R. Agarwal, S.K. Mittal, N. Singh, K. Singh and P.K. Gupta, Study of size and mass distribution of particulate matter due to crop residue burning with seasonal variation in rural area of Punjab, India. J. Environ. Monitor., 13(4), 1073-1081 (2011). Rastogi, N. and M.M. Sarin, Quantitative chemical composition and characteristics of aerosols over western India: One-year record of temporal variability. Atmos. Environ., 43(22-23), 3481-3488 (2009). Salma, I., X.G. Chi and W. Maenhaut, Elemental and organic carbon in urban canyon and background environments in Budapest, Hungary. Atmos. Environ., 38(1), 27-36 (2004). Hildemann, L.M., D.B. Klinedinst, G.A. Klouda, L.A. Currie and G.R. Cass, Sources of urban contemporary carbon aerosol. Environ. Sci. Technol., 28(9), 1565-1576 (1994). Venkataraman, C., C.K. Reddy, S. Josson and M.S. Reddy, Aerosol size and chemical characteristics at Mumbai, India, during the INDOEX-IFP (1999). Atmos. Environ., 36(12), 1979-1991 (2002). Rengarajan, R., M.M. Sarin and A.K. Sudheer, Carbonaceous and inorganic species in atmospheric aerosols during wintertime over urban and high-altitude sites in North India. J. Geophys. Res. Atmos., 112(D21), 1-16 (2007). Salam, A., H. Bauer, K. Kassin, S.M. Ullah and H. Puxbaum, Aerosol chemical characteristics of a mega-city in Southeast Asia (Dhaka-Bangladesh). Atmos. Environ., 37(18), 2517-2528 (2003). Husain, L., V.A. Dutkiewicz, A.J. Khan and B.M. Ghauri, Characterization of carbonaceous aerosols in urban air. Atmos. Environ., 41(32), 6872-6883 (2007). Lin, J.J. and H.S. Tai, Concentrations and distributions of carbonaceous species in ambient particles in Kaohsiung City, Taiwan. Atmos. Environ., 35(15), 2627-2636 (2001). Ye, B.M., X.L. Ji, H.Z. Yang, X.H. Yao, C.K. Chan, S.H. Cadle, T. Chan and P.A. Mulawa, Concentration and chemical composition of PM2.5
in Shanghai for a 1-year period. Atmos. Environ., 37(4), 499-510 (2003). Lonati, G., S. Ozgen and M. Giugliano, Primary and secondary carbonaceous species in PM 2.5
samples in Milan (Italy). Atmos. Environ., 41(22), 4599-4610 (2007). Pathak, R.K., T. Wang, K.F. Ho and S.C. Lee, Characteristics of summertime PM organic and 2.5
elemental carbon in four major Chinese cities: Implications of high acidity for water-soluble organic carbon (WSOC). Atmos. Environ., 45(2), 318-325 (2011). Satsangi, A., T. Pachauri, V. Singla, A. Lakhani and K.M. Kumari, Carbonaceous aerosols at a
.
.
.
.
.
.
.
.
.
.
.
.
.
21.
22.
23.
24.
25.
26.
27.
28.
29.
30.
31.
32.
33.
116
air pollution sources. 3. C-1-C-29 organic compounds from fireplace combustion of wood. Environ. Sci. Technol., 35(9), 1716-1728 (2001). Chen, Y.J., G.R. Zhi, Y.L. Feng, J.M. Fu, J.L. Feng, G.Y. Sheng and B.R.T. Simoneit, Measurements of emission factors for primary carbonaceous particles from residential raw-coal combustion in China. Geophys. Res. Lett., 33(20) (2006). Zhang, Y.X., M. Shao, Y.H. Zhang, L.M. Zeng, L.Y. He, B. Zhu, Y.J. Wei and X.L. Zhu, Source profiles of particulate organic matters emitted from cereal straw burnings. J. Environ. Sci.-China, 19(2), 167-175 (2007).
.
.
.
Discussions of this paper may appear in the discus-sion section of a future issue. All discussions shouldbe submitted to the Editor-in-Chief within six monthsof publication. .
Manuscript Received: Revision Received:
and Accepted:
February 20, 2013May 27, 2013June 10, 2013
37.
38.
39.
40.
Pipal et al., Sustain. Environ. Res., 24(2), 107-116 (2014)
35.
36.
34.
suburban site in Indo-Gangetic plain. Indian J. Radio Space, 39(4), 218-222 (2010). Singh, T., P.S. Khillare, V. Shridhar and T. Agarwal, Visibility impairing aerosols in the urban atmosphere of Delhi. Environ. Monit. Assess., 141(1-3), 67-77 (2008). Lewtas, J., Y.B. Pang, D. Booth, S. Reimer, D.J. Eatough and L.A. Gundel, Comparison of sampling methods for semi-volatile organic carbon associated with PM . Aerosol Sci. Tech., 34(1), 2.5
9-22 (2001). Yang, F., K. He, B. Ye, X. Chen, L. Cha, S.H. Cadle, T. Chan and P.A. Mulawa, One-year record of organic and elemental carbon in fine particles indowntown Beijing and Shanghai. Atmos. Chem. Phys., 5, 1449-1457 (2005). Viana, M., W. Maenhaut, H.M. ten Brink, X. Chi, E. Weijers, X. Querol, A. Alastuey, P. Mikuska and Z. Vecera, Comparative analysis of organic and elemental carbon concentrations in carbonaceous aerosols in three European cities. Atmos. Environ., 41(28), 5972-5983 (2007). Schauer, J.J., M.J. Kleeman, G.R. Cass and B.R.T. Simoneit, Measurement of emissions from