51
Day One Community Meeting Bikeshare Planning St. Petersburg, FL June 2, 2015 Don Kostelec, AICP – Kostelec Planning Whit Blanton, FAICP – Renaissance Planning Group
| Date post: | 11-Jul-2018 |
| Category: |
Documents |
| Upload: | nguyentruc |
| View: | 223 times |
| Download: | 0 times |

Day One Community Meeting Bikeshare Planning St. Petersburg, FL June 2, 2015 Don Kostelec, AICP – Kostelec Planning Whit Blanton, FAICP – Renaissance Planning Group

Since 1996, EPA’s Office of Sustainable Communities has been working to protect human health and the environment through smart growth development.
Changing the conversation
Partnering to change the rules
Working with the willing

• Changing the conversation
• Publications, conferences, national awards
• Partnering to change the rules
• HUD-DOT-EPA Partnership for Sustainable Communities
• Work with FEMA, USDA, NOAA—lots of Federal agencies
• Working with the willing
• Technical Assistance to state and local governments, nonprofits

Full Page Photo Big challenges + limited resources + a huge demand for new approaches:
Quick-hit technical assistance

Technical Assistance Includes…
• Self-assessment completed and reviewed
• Coordination calls to ID issues, confirm goals and set agenda for site visit
• Tailoring of materials to goals and site
• Identify attendees and partners, address logistical arrangements
Assess
• Site tour and informal stakeholder discussions
• Community Meeting
• Technical Workshop
Convene
•Documentation and discussion of key issues, opportunities, priority actions
Next Steps

Why Are We Here? St. Petersburg, Florida • Letter of Interest submitted to EPA
requesting technical assistance. • City issued a request for information
to move forward with bikeshare • Help determine most feasible working
model • Ensure equitable & seamless
transportation access • Challenges with charter language for
leased space along waterfront
• Empowering next steps within the community

What We’ll Cover
This evening: • What is Bikesharing? • Who is Bikesharing? • Benefits of Bikesharing • Bikesharing in St. Petersburg?

What is Bikesharing?

A network of bicycles distributed around an area that allows and encourages non-motorized trips from one location to another.

Full Page Photo
Source: Inventropolis
A relatively inexpensive and quick implementation extension to a city’s public transportation offerings.
~$10,000/bike set-up ~$1,500/bike set-up < $600/bike set-up

A cost‐effective mobility option.
Photo: The Goblin Chief

Photo: Seaside Historical Society
History of Bikeshare

Photos: Copenhagenzine
1965 1970 1975 1980 1985 1990 1995 2000 2005 2010 2015
1st Generation
2nd Generation
3rd Generation
4th
• Distinguished-looking bikes (e.g. paint color
• Subject to theft and poor organization
• La Rochelle; Amsterdam; Portland; Boulder; Austin*
• Locking mechanism and check-out deposit
• Minimal deposit not enough to significantly reduce theft
• Copenhagen; La Rochelle
• Credit card transactions and radio-frequency identification chips
• User identification and security deposit provide accountability against theft and vandalism
• Paris; Lyon; Rome, DC
• Solar-powered, wireless communication
• Modular systems (no excavation required)
• Tampa, Boise, Orlando *System still in operation

System Elements Photo Caption / Citation

Common goals that might drive bike system development
Promote biking for daily transportation
Encourage more healthy and active lifestyles
Take auto trips off the road
Expand the existing public transportation network
Provide better access in underserved neighborhoods
Are there others?

Low Technology
Characteristics • Low cost • Low ridership • Harder to find bikes • Less accountability • More theft
Examples • Menominee, WI • Collingswood, NJ • Nashville, TN
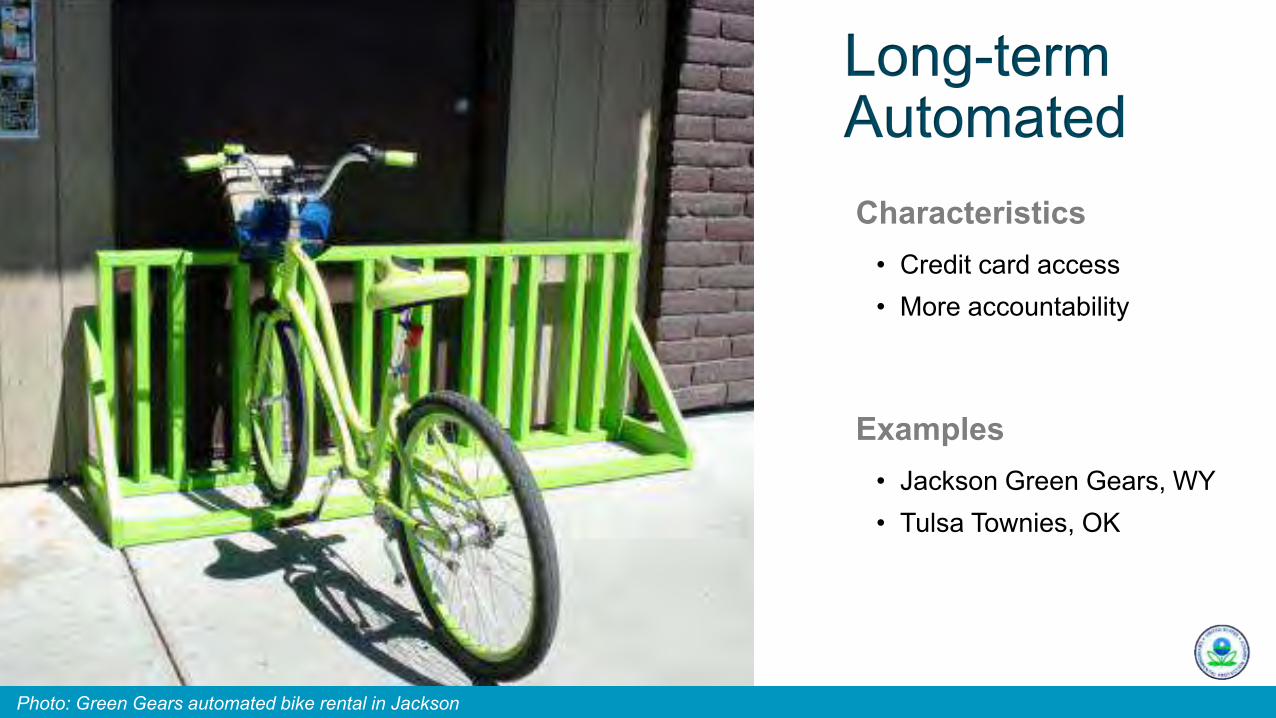
Long-term Automated
Characteristics • Credit card access • More accountability
Photo: Green Gears automated bike rental in Jackson
Examples • Jackson Green Gears, WY • Tulsa Townies, OK

Short-term Automated
Characteristics • High accountability • Little theft and vandalism • Modern design • Extremely visible
Examples • Minneapolis, MN • Chattanooga, TN • Greenville, SC

System Coverage and Station Location
Service / Coverage Area:
• High demand / high revenue • Equity considerations • Seasonal considerations
• Station locations • Station density • Bikes per station • Docks per bike
• Expansion versus infill • Satellite systems • Criteria for expansion
Station Siting: Phasing:
Photos: Hamilton Bike Share; NYC DOT, NYC Dept of City Planning

Photo: Copenhagenzine
System Elements
Bikes
• Automates transactions
• Tracks use and bike return
• Customize features such as different membership and fee structures
• Allows detailed reporting
• Customer service center
Software Back-end:
• Empty full stations and restock empty stations
Operations & Rebalancing

Operations
Photo: Don Kostelec
• Equipment maintenance • Station checking • Station / equipment cleaning • Rebalancing
• Moving bikes from full stations to empty stations
• Most challenging and costly part of operations
• Customer support • Outsource or internal
Must-have elements:
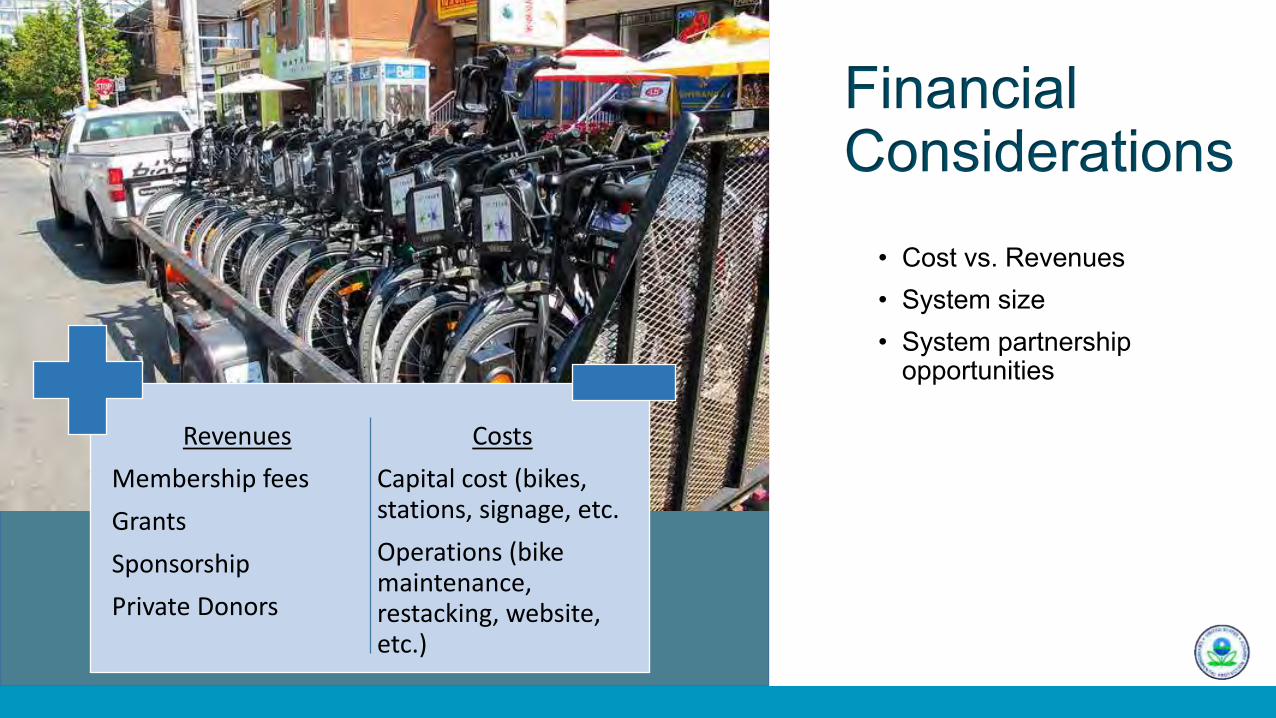
Financial Considerations
• Cost vs. Revenues • System size • System partnership
opportunities
Revenues
Membership fees
Grants
Sponsorship
Private Donors
Costs
Capital cost (bikes, stations, signage, etc.
Operations (bike maintenance, restacking, website, etc.)

Boulder, CO
Source: Bike Sharing in the United States (2012), Pedestrian and Bicycle Information Center
By the numbers
• Non-profit owned • 300 miles of bike lanes,
routes, designated shoulder and pathways.

Boise, Idaho
Source: Don Kostelec & Boise Greenbike
By the numbers
• Managed by regional transit authority
• 250 miles of bike lanes, routes, designated shoulder and pathways.
• $600,000 start-up cost • $250,000 budget
• $125k from 2 main sponsors • $110k from station sponsors • $15k from user fees (6%)

Program Considerations
Program Goals: • Prioritizes certain
objectives, e.g. revenue potential versus public service
• Determines success of the system
Funding: • Available resources may
dictate the size of the system
• Potential partnerships • User fees
Business Model: • Types of ownership
(public, private, etc) • Implementation specifics

Business Model Considerations
Ownership Type Likely Funding Benefits Shortcomings Examples
Jurisdiction owned and managed
Federal, state, local, and private as sponsorships
Greater local control over station planning and service delivery
Financial responsibility
Capital Bikeshare (Washington, DC) Hubway (Boston, MA)
Nonprofit owned and managed
Private, non profits/foundations, local/nat’l energy conservation, health grants, sponsorships
Reduced financial liability for local government More nimble/flexible service
Greater reliance on fundraising, which may reduce ability to expand
B-cycle (Boulder and Denver, CO; San Antonio, TX; Spartanburg, SC) Nice Ride (Minneapolis, MN)
For-profit business Private sources No public financing or liability Market responsive
Limited public service objectives
Deco Bike (Miami Beach, FL)

Who is Bikesharing?

Photos: BikeSharingMap www.bikesharemap.com
Bikesharing in the US
Construction

Minneapolis, MN
Photo: UCDA Design Conference
• Non‐Profit owned and operated
• Agencies (and others) represented on Board
Launched: June 2012
Size: 145 stations / 1,300 bikes (24 stations added in 2013)
Business Model:
Funding Strategies • Federal grants
• Public funding
• BlueCross / BlueShield presenting sponsor
• Station sponsorship
• Membership and usage fees

Video of Minneapolis System

Miami Beach, FL
Photos: DecoBike
• Privately owned and operated (and advertised)
• City provides support only
Launched: March 2012
Size: 105 Stations / 1,000 bikes
Business Model:
Funding Strategies • Private investment
• Membership and usage fees
• Advertising space

Denver, CO
Photo: Discover America: Denver
• Non‐Profit owned and operated
Launched: April 2010
Size: 84 stations / 700 bikes as of 2014
Business Model:
Funding Strategies • Federal grants
• State grants and tax distribution
• Private donations
• Membership and usage fees

Washington, DC
• Owned and managed by public agencies
• Private operator
Launched: September 2010
Size: 300 stations / 2,500 bikes as of 2014
Business Model:
Funding Strategies • Capital funded by federal CMAQ
grant and some local funding
• Operations sustained by user fees

Spartanburg, SC
• Non‐profit owned and operated
Launched: July 2011
Size: 2 stations / 14 bikes
Business Model:
Funding Strategies • Local Grants
• Private foundation funding
• JM Smith Corporation
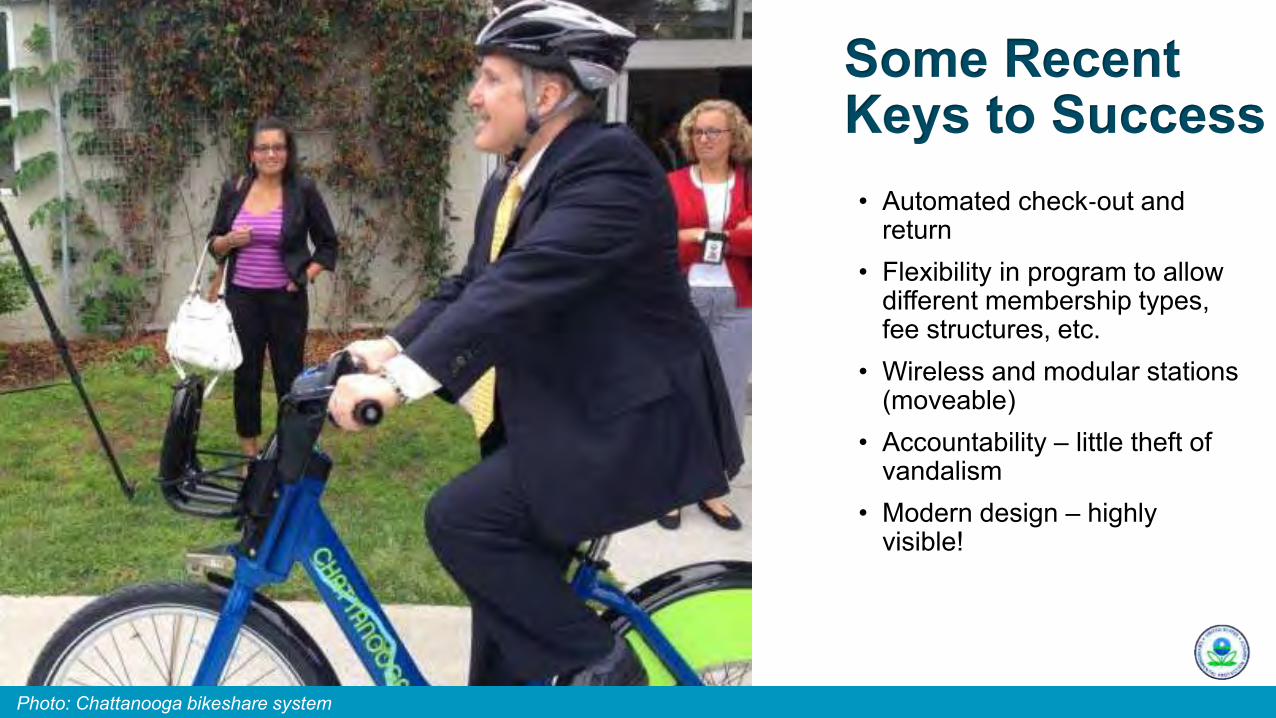
Some Recent Keys to Success
• Automated check‐out and return
• Flexibility in program to allow different membership types, fee structures, etc.
• Wireless and modular stations (moveable)
• Accountability – little theft of vandalism
• Modern design – highly visible!
Photo: Chattanooga bikeshare system

Benefits of Bikeshare

Attention-Grabbing & Transformative • No longer just for spandex-
lovers • Making its way into mainstream
culture • Cities directing funds to bike
infrastructure
Photo: Denver B-Cycle; PlanetGordon

Affordable
• Complement to transit • More cost-effective than driving • Eliminates need to pay for
parking • Membership fees allow 30-
minute trips between stations
Credit: Bay Area Bikeshare

Takes Cars off the Road • Can replace some walk trips
with a faster bike trip • More accessible than bus,
particularly in small cities • Cuts down on pollution and
emissions • Reduces noise • Reduces traffic congestion
Photo: State Transit Authority of New South Wales
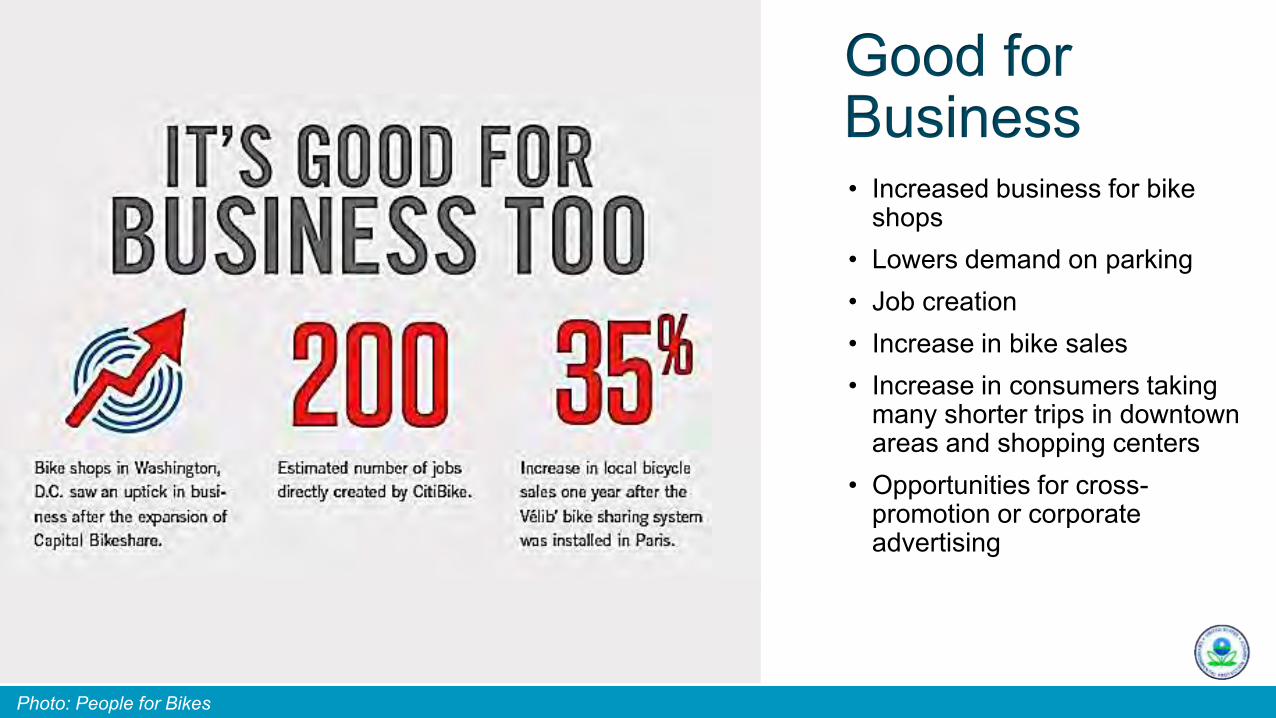
Good for Business • Increased business for bike
shops • Lowers demand on parking • Job creation • Increase in bike sales • Increase in consumers taking
many shorter trips in downtown areas and shopping centers
• Opportunities for cross-promotion or corporate advertising
Photo: People for Bikes

Health
• Natural synergy between health and bike sharing
• Funding (grant) opportunities • Health care industry
sponsorship • Greenway
planning/expansion • Hubway (Boston)
membership “prescribed” to patients
• Charlotte's title-sponsor is Blue Cross/Blue Shield of NC

Safety and Ease
Photo: Bay Area Bike Share
• Sturdy design that promotes low speed
• Simple, safe, easy to ride and comfortable to a wide range of users
• Slow speed (3‐5 gears) • Robust and reflective tires • Bell • Front and rear light activated
by pedaling • Bikes are regularly serviced
and maintained
Equipment Features
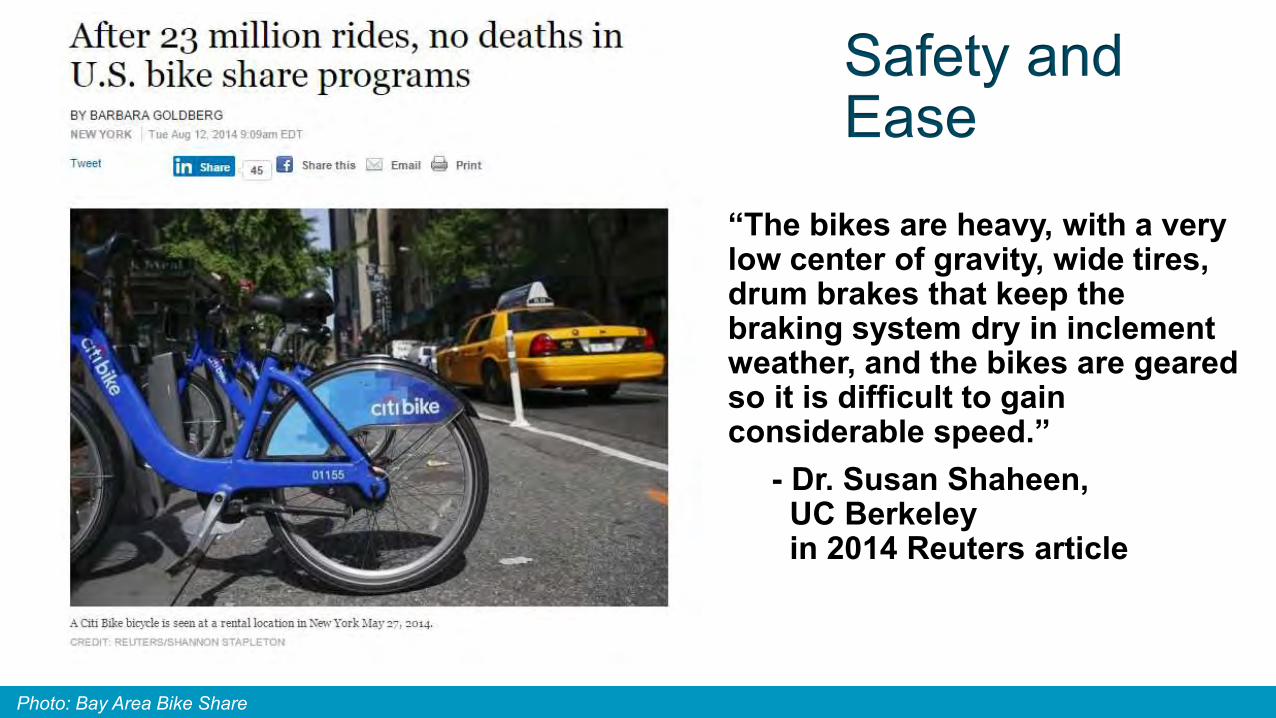
Safety and Ease
Photo: Bay Area Bike Share
“The bikes are heavy, with a very low center of gravity, wide tires, drum brakes that keep the braking system dry in inclement weather, and the bikes are geared so it is difficult to gain considerable speed.” - Dr. Susan Shaheen, UC Berkeley in 2014 Reuters article

Safety Programs
Photo: Nutcase Helmets; CitiBike NYC
• Learn‐to‐ride and bike safety courses
Programs
• Existing systems have no helmet requirements but encourage their use
• Refer people to local bike shops
• Sell at time of membership • Provide helmets at stations • Future development of
helmet vending machines
Helmet Programs

Social Equity
Photo: Boston Bikes
• Consider equity in defining coverage area
• Connecting neighborhoods and populations to other modes
• Overcome barriers (credit access, language, outreach, etc)
• Outreach and education • Job opportunities • Health benefits • Serving non-car populations

Supports Livability Goals
• Helps support transportation choices and active living
• Can be a core strategy in improving multi-modal transportation access in existing places
Excerpt FHWA “Bikesharing in the United States: State of the Practice and Guide to Implementation.” 2012

Bikesharing in St. Petersburg

Where are You Now?
• “City Trails” Plan (2003): • …a balanced transportation system
designed to move people safely and effectively.
• Increase level of bicycling.and reduce percentage of automobile use.
• 110 miles of bicycling facilities • Draft Complete Streets policy • “Best city for drawing Millennials” • Challenge crossing wide, high
speed roadways • Seeking funding strategies • Interest in other nearby cities
“Bicycling is still seen as exclusively a recreational activity by those that aren’t biking out of necessity.”

Focus Question:
How can St. Petersburg develop a bikeshare program, quickly and efficiently to provide transportation options and allow for bicycle travel between destinations and neighborhoods? Things that will: • Promote economic development; • Link existing trail networks • Maximize partnerships; • Serve low income populations; and • Create an economically viable model for
bikeshare.

What’s Next?
•Self-assessment completed and reviewed
•Coordination calls to ID issues, confirm goals and set agenda for site visit
•Tailoring of materials to goals and site
•Identify attendees and partners, address logistical arrangements
Assess
•Site tour and informal stakeholder discussions
•Community Meeting
•Technical Workshop
Convene
•Documentation and discussion of key issues, opportunities, priority actions
Next Steps

Thank You for Joining Us
Visit us on the web at http://www.epa.gov/smartgrowth.htm
St. Petersburg, FL June 2, 2015


