19
DBO Zooplankton: Biogeography, population genetics, production, functional diversity. John Nelson, Akash Sastri, Beatrix Beisner, Kelly Young, Moira Galbraith, Corinne Pomerleau

DBO Zooplankton: Biogeography, population genetics, production, functional
diversity.
John Nelson, Akash Sastri, Beatrix Beisner, Kelly Young, Moira Galbraith, Corinne Pomerleau

Zooplankton sampling in region since 2000.
This data is available as context for DBO


Nuts and Bolts.
Gear brought into international consensus as per the Circumpolar Biodiversity Monitoring Program–Marine Plan. 100m tows with 236 um nets changed to 153 um nets.
(From Circumpolar Biodiversity Monitoring Program–Marine Plan)
Plankton Stations CBMP-MP
JN developing short list of marine monitoring indicators for Canada


2011 Integrated C3O and DBO Zooplankton Analysis

Chukchi Bering Barrow Canyon
2011Integrated C3O and DBO Zooplankton Analysis

2011 Integrated C3O and DBO Zooplankton Sampling

Barrow Canyon - 2011

Biogeography Synopsis. Have collected samples in the region since 2000. Many yet to be analysed. Have 2007 to 2011 analysed (2 years of DBO dedicated samples). 2012 on deck. Working to establish description of zooplankton communities across the region with environmental determinants. Temporal stability of communities of interest Species specific and community abundance trends (limacina for example) are of interest.

Genetics

?
Three fronts of Pacific glacialis lineage penetration.

• PRODUCTION AND FUNCTIONAL DIVERSITY

(Sastri et al. 2012 J. Exp. Mar. Ecol. Biol. )
Chitobiase-based Crustacean Zooplankton Biomass production rates: Spatial Patterns (2008-2009)
0
2
4
BPR
(m
g C
m-3
d-1
)
July ‘08
Oct. ‘08
July ‘09
•Similar spatial pattern of BPR 2008 and 2009
•Spatial patterns of BPR meets with expectations from earlier studies:
•Bering Strait-S.Chukchi Shelf > Shelf Break > Outer-N. Middle Shelf

Log10 BPR =(0.0812 Temp)+(0.312 log10 PhytoMAX) −0.247, r2=0.67, p < 0.001
(Sastri et al. 2012 J. Exp. Mar. Ecol. Biol. )
log10 Developing biomass (mg dry weight m-3)
0.00 0.75 1.50 2.25 3.00B
PR r
esid
uals
(T
emp.
rem
oved
)log10 Phytoplankton biomass
(mg Chl a m-3)
-1.50 -0.75 0.00 0.75 1.50 2.25
Temperature (oC)
-2 0 2 4 6 8 10 12
log
BPR
(mg
C m
-3 d
-1)
-1.0
-0.5
0.0
0.5
r2 = 0.38, p < 0.001 NS r2 = 0.37, p < 0.001
Variation of Zooplankton Production Rates (BPR)
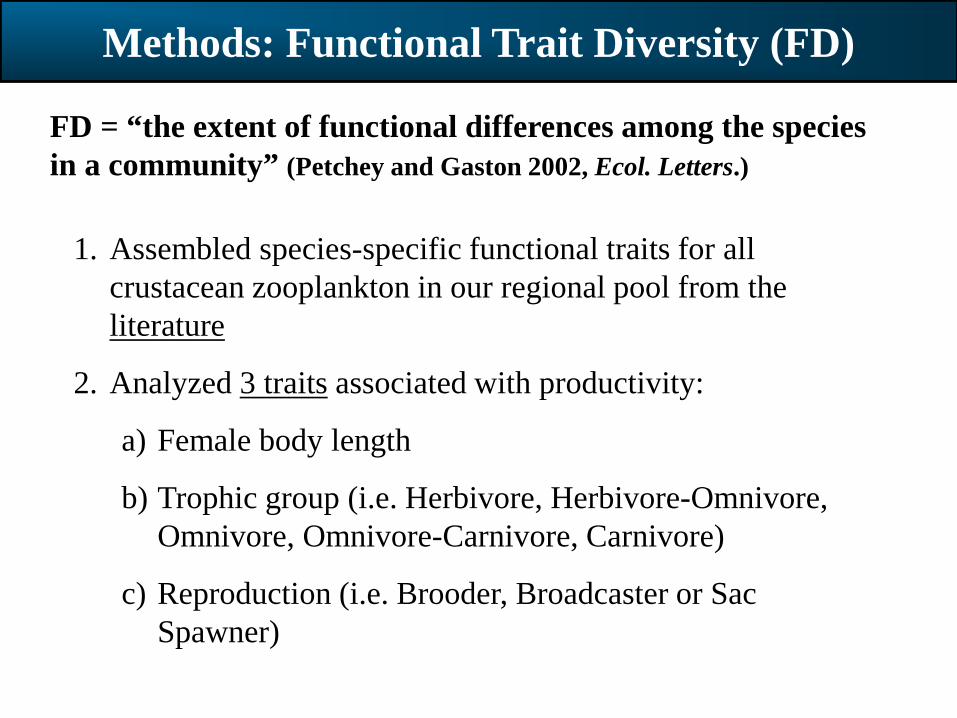
FD = “the extent of functional differences among the species in a community” (Petchey and Gaston 2002, Ecol. Letters.)
1. Assembled species-specific functional traits for all crustacean zooplankton in our regional pool from the literature
2. Analyzed 3 traits associated with productivity:
a) Female body length
b) Trophic group (i.e. Herbivore, Herbivore-Omnivore, Omnivore, Omnivore-Carnivore, Carnivore)
c) Reproduction (i.e. Brooder, Broadcaster or Sac Spawner)
Methods: Functional Trait Diversity (FD)

Spatial patterns of Functional Group Richness (FGR)
•FGR → “functional” analogue to species richness •Bering Strait-S. Chukchi>Shelf Break>Outer-N. Middle Shelf •FGR = 5.183 + (0.122 * T) + (0.777 * log ZB), r2 = 0.25, p < 0.001
July 2007 July 2008 July 2009 July 2010
• PLANS FOR FUTURE. – Biogeography – Genetics – Functional traits – Estimation of secondary production.


