26
May 2018 dbWatch Enterprise Manager 1 dbWatch v12: Enterprise Database Management

May2018dbWatchEnterpriseManager 1
dbWatch v12: Enterprise Database Management
May2018dbWatchEnterpriseManager 2
Content
C H A P T E R 1 Introduction ................................................................................................ 3
C H A P T E R 2 dbWatch for IT managers............................................................................ 5
C H A P T E R 3 dbWatch for the professional DBA ............................................................. 7
C H A P T E R 4 Architecture ................................................................................................. 9 Agent-less monitoring and management ....................................................................................................... 9 Distributed repository ................................................................................................................................... 9 Distributed and open platform ...................................................................................................................... 9 dbWatch Engines ........................................................................................................................................ 10 The dbWatch Server.................................................................................................................................... 12 UX Client ..................................................................................................................................................... 13
C H A P T E R 5 Functional Modules ................................................................................... 16 Monitoring .................................................................................................................................................. 16 Management .............................................................................................................................................. 16 Reporting .................................................................................................................................................... 16 SQL Worksheet ........................................................................................................................................... 17 Extensions / Connectors .............................................................................................................................. 17
C H A P T E R 6 Scalability and large datacenter features .................................................. 18
C H A P T E R 7 Advanced features .................................................................................... 18 Cluster management ................................................................................................................................... 18 Security ....................................................................................................................................................... 19 License control and optimization................................................................................................................. 19 Consolidation support ................................................................................................................................. 19
C H A P T E R 8 Customization and development ............................................................... 20
C H A P T E R 8 Release and version info ............................................................................ 21 New features .............................................................................................................................................. 21
C H A P T E R 9 Application specific versions ........................................................................ 22 dbWatch for UNIT4 Business ERP Solution (Agresso) ................................................................................... 22
C H A P T E R 10 Technical specifications .......................................................................... 23 Supported Database Platforms.................................................................................................................... 23 Technical Requirements .............................................................................................................................. 23
A P P E N D I X A Preconfigured monitoring procedures ................................................... 25 Oracle ......................................................................................................................................................... 25 MS SQL Server............................................................................................................................................. 25 Sybase ........................................................................................................................................................ 26 MySQL ........................................................................................................................................................ 26 PostgreSQL ................................................................................................................................................. 26

May2018dbWatchEnterpriseManager 3
C H A P T E R
1 Introduction
Today’s enterprises are driven by data, underlying all critical enterprise applications. The vast majority of these data are stored in SQL databases. This is often a complex mix of different version of Oracle, MS SQL Server or other relational databases. In today’s world we expect all enterprise systems to be available as close to 24x7 as possible and with acceptable response times. Downtime can directly affect revenue and ability to service customers. Loss of data is not acceptable. As criticality, volume and demands grows, so do the cost of keeping these databases up to the task. The task of managing these databases have become a balancing act, attempting to balance cost, performance, flexibility and risk. dbWatch Enterprise Manager is a complete database management solution designed for efficient proactive management and monitoring of large database environments, typically found in manufacturing, retail, government, healthcare, managed service providers or other industries. dbWatch allows database administrators to manage a large number of databases on different database platforms with a minimum of time and effort, and at the same time offer the flexibility, scalability and functionality required in enterprise environments. dbWatch give IT managers the complete overview and tools to manage resources optimally, plan ahead and produce all reports and statistics needed for internal reporting and planning. dbWatch is designed from the ground up to meet the challenges of todays service providers and IT departments, facing the challenge of managing a large number of old legacy and new database server instances running on multiple platforms and versions. The distributed architecture is designed to be maintenance-free, scale from monitoring a few instances to managing thousands, automate all routine tasks, provide full resource overview and control and make the DBA’s as efficient and productive as possible. dbWatch provides the insight and analysis required by managers to plan, report, consolidate and optimize hardware use and software license cost. Fewer tools means less cost and time spent on tools and training. By optimizing resources and making DBA’s more efficient, costs are kept under control. Full insight and control reduce risks for unwanted service interruption or degradation and simplifies and improves reporting. dbWatch offers:
• Complete solution for database management and monitoring on the most common platforms and cloud databases.

May2018dbWatchEnterpriseManager 4
• Increasing DBA efficiency up to 20% or more • Unique scalability. • Enable proactive management of complex database environments. • Oracle and MS SQL Server licensing control and optimization • Provide a flexible platform for customization to allow each enterprise to
extend and customize dbWatch to suit their specific requirements. Full source for all task and procedures included
• Fast ROI. dbWatch can be deployed in hours and is easy to learn so you can quickly start benefitting from improved performance and efficiency
• Offers role-based access controls and AD, Kerberos and encrypted connections for government, healthcare, financial and others who require stringent security
May2018dbWatchEnterpriseManager 5
C H A P T E R
2 dbWatchforITmanagers
Being responsible for operations, you are under constant pressure to increase productivity, control costs, improve quality while minimizing risks. You need solutions that will adapt to your business processes and be future proof, handling whatever may come. Increase efficiency. With dbWatch each of your database administrators can monitor and manage far more database instances and platforms, significantly and measurably increasing the efficiency of your department. Automation of routine tasks and ease-of-use improve DBA productivity. Using dbWatch, we see DBA’s managing 50 to 500+ instances each. Reduce risk. Full overview of all resources and real-time monitoring lets you see what is happening and prepare and prevent problems before they become an issue. Automation ensures all routine tasks are performed as scheduled every time, and never forgotten or ignored. Better overview. With many instances to manage it´s easy to loose overview, so we added extensive features to tag, sort, group and filter instances in all views and reports. This will allow you to better locate the instance(s) that most need your attention, be it lack of resources, poor performance, high growth or other reasons. Improve quality of operations. With dbWatch problem areas are discovered earlier and preventive actions can be initiated before critical situations arise. dbWatch gives a better overview of the total database situation as well as the tools the database administrators need to drill down and analyze the performance and health of individual database instances. Comprehensive, configurable reporting. With dbWatch you can instantly produce advanced reports on your key performance indicators – uptime, availability, load, response time and such. The dbWatch reporting engine is fully customizable to fit your specific requirements. Reporting can be per database instance, across clusters or any other way you choose. Full licensing reporting. dbWatch will give you a unique tool to investigate and report on your Oracle licensing usage and requirements so you can document and verify that that your licensing is optimal, and not exceeding your license terms resulting in license audit surprises. Future proof. dbWatch is fully cross-platform and cross-version. We support most major database technologies, both open source and commercial. Whether you are supporting a single or heterogeneous database environment, dbWatch provides a single monitoring framework for all your databases and a common solution for all your administrators.

May2018dbWatchEnterpriseManager 6
Now dbWatch also supports multiple versions of the same database platform in the same interface, making managing legacy solutions and transitions to new versions easier.
Integration. dbWatch is designed for easy and seamless integration with your existing management platforms and processes. dbWatch comes ready with extensions for IBM Tivoli, HP Operations Manager, Microsoft SCOM, WhatsUP Gold, Nagios, CA Nimsoft, Quest Big Brother, Autotask and others. By fully integrating dbWatch, you will be providing highly useful and relevant database monitoring information and reporting capabilities to whoever needs it, protecting your investment in systems management tools. Fully Customizable. Customization is the single dbWatch feature that will benefit you directly more than any other. With dbWatch you can fully customize your database monitoring procedures and alerts like no other solution allows. With a working knowledge of the native SQL procedure language, you can program dbWatch to monitor any database process, customized exactly to business processes and priorities. Apply this to the fully customizable Report Manager, and you have an extremely powerful reporting engine for creating fully customized business reports and IT reports. Fast Return on Investment. With dbWatch you can be up and running in less than a day and start benefitting from improved operations, better monitoring and enhanced reporting. dbWatch will give you instant return on your investment. Extensive security features, dbWatch provides a role-based access control, supports Active Directory and Kerberos and can be used with encrypted connections and certificates, providing enhanced security and control.
Sensible Licensing. If you need a database monitoring solution, dbWatch will likely be one of the most profitable investments you make. We have a no-nonsense, simple to understand licensing policy based on the number of database instances you actually use. In addition, the lightweight dbWatch architecture has minimal operating costs, it requires no new investments in hardware, database middleware or repository software, and it has low bandwidth consumption. You can install dbWatch in hours. You and your staff will have best practices monitoring, fully implemented on your databases, within the day so you can start capturing a return on your investment from day 1.

May2018dbWatchEnterpriseManager 7
C H A P T E R
3 dbWatchfortheprofessionalDBA
As a professional DBA you are expected to keep more and more systems running smoothly. You see complexity and workload increase every day and you are expected to manage it all without extra resources. How can you cope? The answer is better tool support, automation, simplification and flexibility. Tool support. With dbWatch you get all the functionality you need to manage all your instances in one single, easy to use solution. No longer will you need to install, manage and learn a large set of platform, version or function-specific tools. Fewer tools means less to learn and manage and a simpler, more productive environment. Automation. Routine tasks like checking status and log files, re-indexing, etc. can take considerable time. dbWatch will automate most routine tasks for you. It will automatically perform all database maintenance tasks, based on “best practices” learned from working with large enterprises through many years. Simplification. What can be simpler: one solution, one tool to learn. No more juggling between different tools. Switch from monitoring to management to performance analysis in the same solution – no need to switch anymore. Better overview. With many instances to manage it´s easy to loose overview, so we added extensive features to tag, sort, group and filter instances in all views and reports. This will allow you to better locate the instance(s) that most need your attention, be it lack of resources, poor performance, high growth or other reasons. Flexibility. If you have special requirements – and many have – you need the flexibility to modify or extend your tool to match your requirements. So we give you the platform and tools to do so. This is the single dbWatch feature that will change your work life more than any other—the ability to create, modify, and fully customize your own monitoring procedures exactly how you like and in a programming language you already know. To make this happen, we had to do a few things that no one else had done before:
1. Monitoring procedures are written in the native procedure language of each supported database (PL SQL for Oracle, T-SQL for MS SQL and Sybase, etc.).
2. All monitoring code is fully open for you to read, change, or modify—anyway that you like.
3. Users can create fully customized monitoring procedures from scratch, or modify the procedures we provide.

May2018dbWatchEnterpriseManager 8
4. The dbWatch Task Editor tool that lets you develop, edit, and manage your monitoring alerts, jobs, and SQL procedures in an easy to use graphical interface.
This design opens up possibilities that no other solution can offer the advanced DBA. With dbWatch you can monitor any database component, any state, or any process exactly the way you want to, limited only by the database programming language itself. If you can do it your native procedure language, you can do it with dbWatch! dbWatch is designed to quickly relieve the pressures you face as a DBA, with features that secure and automate your database management routines at the expert level. With dbWatch installed, you’ll be the authority, with documented control over all your databases and the reports to prove it! Out-of-the-box configurations. dbWatch comes with a complete set of monitoring alerts and tasks, preconfigured according to best practices for each supported database platform. The standard installation includes default thresholds and parameters that you can use to immediately start monitoring critical database components and processes, leaving you secure in the knowledge that your monitoring configuration will stand the test of any inspection. Easy to Use. With an intuitive and uncomplicated GUI, dbWatch provides a total overview of all your database instances in a single, cross-platform interface. Fancy graphics and distractions have been kept in check in order to give you the relevant information you need to get your job done, in a simple and efficient format, when and where you need it. With dbWatch fully installed in a few hours you are quickly up and running. Time-saving features. We constantly focus on building a better product that helps DBA’s stay productive and efficient. So we have features like database auto-discovery, which will help you discover all databases in your network and add them into the dbWatch management framework.
May2018dbWatchEnterpriseManager 9
C H A P T E R
4 Architecture
Agent-lessmonitoringandmanagement dbWatch supports two ways of monitoring and managing database servers:
• “standard mode”. No agents, software or files needs to be installed on the database server instance or underlying operating system or server.
• “Advanced mode”. A small schema is installed on the server instance.
DistributedrepositoryThe statistics collected are stored distributed on each monitored instance and automatic maintenance procedures ensures the log files and collected data are kept relevant and compact.
DistributedandopenplatformdbWatch is built on a unique architecture designed to provide the best possible capabilities for monitoring and managing heterogeneous database platforms. Our design provides the most precise and relevant database monitoring information possible. With dbWatch you can modify any of the included monitoring procedures to better suit your preferences. But we took it a step further—we designed dbWatch so you’ll have the power to design and develop your own monitoring procedures and jobs from scratch, fully customized to your own needs, your technical requirements, or your company’s business logic. This openness is not limited to the monitoring procedures, also the Management module and Reporting module provides customers with the flexibility to develop and customize the way they manage or report on their database systems. dbWatch is built on standard, three-tier client server architecture, with database monitoring agents inside the database (dbWatch Engines), the application server (dbWatch Server), and client GUI (dbWatch Monitor Client). In addition, dbWatch includes extensions to support integrating with third-party systems management solutions.

May2018dbWatchEnterpriseManager 10
Figure1:dbWatchEnterpriseManageroverview
dbWatchEnginesdbWatch uses an intelligent database schema inside the database, called dbWatch Engines, for monitoring each database instance. The dbWatch Engine employs two types of monitoring procedures – dbWatch Alerts for real-time alarms and warnings, and dbWatch Tasks for trend analysis and reporting. Each Engine is populated with a set of Alerts and Tasks, defined by you as relevant to monitoring your database instances. dbWatch comes with a broad range of advanced out-of-the-box Alerts and Tasks for each supported database platform. You can use these in their standard configurations, edit and modify them, or create your own fully customized Alerts and Tasks from scratch. Intelligent database schema. Instead of using external agents with proprietary code, installed at the operating system level, the dbWatch Engine is an intelligent database schema installed internally in the database instance being monitored, containing programmable logic, procedures, and routines for monitoring and data collection (at around 50 MB, they are completely non-intrusive and without any significant performance impact). This allows for rapid deployment without the hassle of installing software on each database server. Native support. The dbWatch Engines are programmed in the native programming language for each supported database (PL SQL for Oracle, T-SQL for MS SQL and

May2018dbWatchEnterpriseManager 11
Sybase, etc.). Since this is a language that you are already familiar with, you will not need new training or external consultants. This also makes the dbWatch Engine truly platform independent, and much easier to manage. Open and extensible. The dbWatch Engines code base is fully open. You can read, edit, or modify the code exactly the way you like. And most importantly, you can create your own monitoring procedures and jobs that are fully customized to your work needs or your business processes. The combination of the following features gives you a combination of advantages that no other database monitoring solution can:
• The most advanced monitoring possible—if you cannot do it in native procedure language, you cannot do it at all.
• Fully self- service—create and modify your monitoring activities exactly the way you want them to be!
May2018dbWatchEnterpriseManager 12
ThedbWatchServerThe dbWatch Server is the nerve center of the dbWatch infrastructure. dbWatch Server connects and manages all dbWatch Engines and is used for the following:
• Configuring and scheduling alerts and tasks • Alert Messaging—SMS, email, third-party tools • Reporting—configuring, creating, generating, and distributing reports • User administration, role based access controls • Security handling – encryption, certificates • Active Directory and Kerberos integration • Auto-scanning for new instances
Scheduling and triggering Alerts and Tasks. Each dbWatch Alert and Task comes with a default schedule. dbWatch Server lets you easily configure these schedules and triggers to fit your requirements and preferences (the crontab format may be new to MS users but explanatory text fields are included). Alert Messaging. DbWatch Server is used to specify alert messaging and routing. You can configure alarms to be sent to one or multiple destinations:
• dbWatch Client • Email • SMS • Third-party system management platform
dbWatch alert messaging is completely flexible, allowing you to configure different messaging rules depending on the day of the week, hour, calendar date, etc., to fully support the shift schedule of your IT management processes. Platform. While dbWatch comes complete with all the monitoring alerts, maintenance tasks and reports that most users need, we recognize the need for some users to adapt and extend the tools for unique requirements. That’s why dbWatch is delivered with an integrated development environment (IDE) and the source to all tasks and alerts so each DBA can easily modify, extend or create new tasks, procedures and reports. dbWatch also includes a command line interface (CLI) and query language (DBWQL) for querying across multiple instances and versions.
May2018dbWatchEnterpriseManager 13
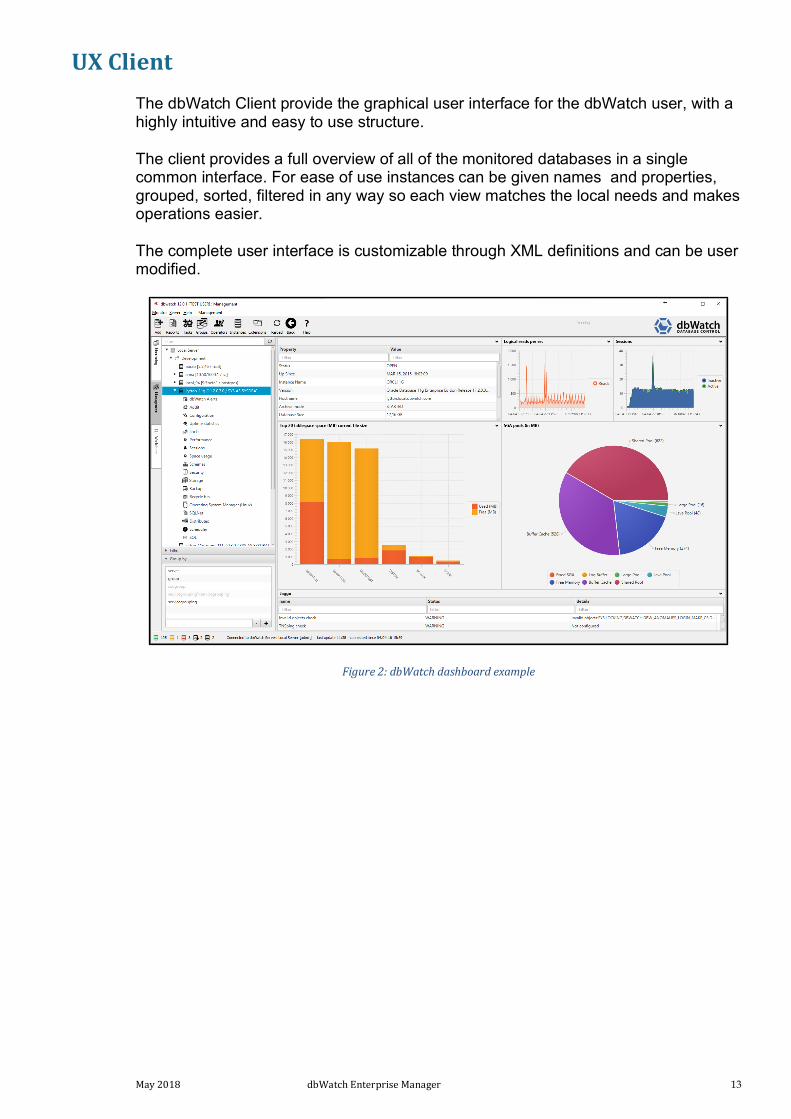
UXClientThe dbWatch Client provide the graphical user interface for the dbWatch user, with a highly intuitive and easy to use structure.
The client provides a full overview of all of the monitored databases in a single common interface. For ease of use instances can be given names and properties, grouped, sorted, filtered in any way so each view matches the local needs and makes operations easier.
The complete user interface is customizable through XML definitions and can be user modified.
Figure2:dbWatchdashboardexample

May2018dbWatchEnterpriseManager 14
Figure3:Performancedashboard
Figure4:Oracledatafilesanalysis-example

May2018dbWatchEnterpriseManager 15
s,Figure4:Globaloverviewofinstances,platformandactivity
Figure5:Statusboard–active/warnings/alarms

May2018dbWatchEnterpriseManager 16
C H A P T E R
5 FunctionalModules
The following chapter describes the unique dbWatch architecture and the relations between the individual components in the platform.
MonitoringThe dbWatch Monitoring module provides a wide range of monitoring tasks and alerts. Tasks provide statistics and growth rates for your database, which allows for better planning and performance analysis of how your system is behaving. Alerts provide alarms and warning that enables you to react to problems as quickly as possible. The Monitoring module provides an easy to use interface for configuring and controlling the individual monitoring tasks and alerts, and also provides an interface for changing and developing your own custom monitoring.
ManagementThe dbWatch Management module provides an administration GUI to do the day-to-day administration work for you (DBA’s). Unique to dbWatch we provide a set of different interfaces. This allows you to tailor the management interface depending on what work a certain user is allowed to do. You can give some, more sensitive and complex, administration privileges, and less complex interfaces with limited possibilities to others. You can even, if you have the privilege, edit your configuration to add new possibilities on your own.
ReportingReport module is a powerful reporting tool that lets you automatically generate and distribute reports in html or pdf formats to designated recipients. Report module comes with standard DBA reports for each platform. The real power of Report module lies in customization—the ability to create your own set of reports, fully customized to fit your needs, those of your organization, or even your external customers. With Report module, you can report on any data or any process that dbWatch monitors, with data presentation formats, default texts, logos, and graphics configured exactly according to each report’s needs. Report module automatically triggers reporting procedures, using data stored locally in the distributed dbWatch Engines. Data results are then centrally collected, processed, formatted, and distributed by dbWatch Server to designated recipients according to schedules defined by you. Report module automates the entire reporting process, eliminating the need for unnecessary manual reporting routines and activities.

May2018dbWatchEnterpriseManager 17
dbWatch includes a broad range of standard reports out-of-the-box. You can also create your own fully customized reports with your own logos, in-house default texts, charts, and tables. You can automatically generate and distribute reports electronically at pre-set schedules, in html or pdf formats.
SQLWorksheetThe dbWatch SQL Worksheet is a powerful, fully cross platform SQL tool that allows you to simultaneously execute commands or perform SQL queries across multiple databases, regardless of platform. With SQL Worksheet, you can easily compare query results across your database environment, no matter how large. Ingeniously simple, SQL Worksheet will relieve you of headaches and save you valuable time from unnecessary manual labor working in large environments.
Extensions/ConnectorsWhile dbWatch provides state-of-the-art monitoring and management for common database platforms, we know that integrating with third-party systems management tools are important to our customers. This is why we designed dbWatch Extensions for easy and seamless integration with your existing systems management platform and processes. dbWatch comes with ready extensions for the following:
• HP Operations Manager • Microsoft System Center Operations Manager (SCOM) • IBM Tivoli Framework • CA Nimsoft /Nimbus • Quest Big Brother • Autotask • Nagios • WhatsUp Gold • Huntsman • Email • SMS • Other systems through SNMP v1 and SNMP v3
We are constantly adding to the list of supported solutions so if you are presently using other common systems management solutions not on the list above, please inquire for the latest update to the list of supported solutions. By making database monitoring information available to all your people, tools, and processes, you will protect the investment on your existing systems management tools. dbWatch also provides a development SDK for developing customized extensions.

May2018dbWatchEnterpriseManager 18
C H A P T E R
6 Scalabilityandlargedatacenterfeatures
dbWatch is designed from the ground up to handle large environments. dbWatch is used to manage anything from a handful to more than one thousand database server instances at a time in the largest enterprise and service provider environments. To work efficiently in the largest environments dbWatch has several special features:
• Distributed, scalable architecture. Agents are distributed on each instance, and statistics are kept locally on each instance. This avoids building huge central repositories
• Each instance can have its own set of user-defined properties and tags. This makes it easy to attach meaningful information to each instance, so the DBA’s know the function and role of each instance, helping them understand the usage patterns and priorities of each.
• User-defined grouping of instances • Filters to select instances • Group actions. Perform a query, report or add/change agents and tasks on
selected groups of instances • Resource reports giving full in-depth overview of all instances, software
licenses, capacity, utilization etc. • Bulk import of instance information • Auto-scan for new instances • Ability to distribute dbWatch servers in subnets to obey firewall and security
rules in a secure, controlled manner •
C H A P T E R
7 Advancedfeatures
ClustermanagementdbWatch supports Oracle RAC and Microsoft AlwaysOn clustering technology

May2018dbWatchEnterpriseManager 19
SecuritydbWatch implements several technologies and methodologies to support use in secure environments like defense, police, hospitals and banking:
• Active Directory
• Role-based, fine grained access controls
• Encrypted connections using certificates
• Kerberos
LicensecontrolandoptimizationdbWatch can analyze license usage and advise on optimal licensing for both Oracle and MS SQL Server.
ConsolidationsupportdbWatch can analyze the complete set of instances and offer information and advice on server consolidation:
• Detect inactive databases
• Analyze server software, load, resource/capacity utilization
• Provide recommendations as to which instances are candidates for consolidation or should best be kept separate
May2018dbWatchEnterpriseManager 20
C H A P T E R
8 Customizationanddevelopment
While dbWatch is delivered complete and ready to use, and 90% of dbWatch users use it as delivered, we do recognize that sometimes there is a legitimate requirement for modifying, extending, or customizing dbWatch to local needs. For this reason, we offer a full and comprehensive set of development and customization tools and options:
• All tasks and alerts are written in native database programming language and delivered in source form. They can be modified or extended by developers or DBA’s in the native development environment
• All user-interface is defined in XML and may be modified by the customer • All standard reports are available in source form and may be modified or
extended. • There is command-line interface (CLI) available so most dbWatch functions
can be called from scripts. • The very powerful and flexible internal dbWatch query language dbWQL is
available for developers and DBA’s Basically, almost all you see in dbWatch can be modified, added to, or extended by competent users. For full information see the dbWatch support pages and Wiki database on www.dbwatch.com

May2018dbWatchEnterpriseManager 21
C H A P T E R
8 Releaseandversioninfo
The latest major release of dbWatch is version 12 which was first released in August 2016. The following is an overview of some of the new features and functionality in the latest dbWatch version.
Newfeatures• New and fresh User Interface • Customizable dashboards in Management module • Support for grouping, filtering and search for instances • Support for monitoring instances without installation • Improved Oracle RAC and Data-guard support • Improved Microsoft AlwaysOn support • Performance report for Oracle • Schedule reports with different users • Extension to the dbWatch development platform:
o DBWQL dynamic query language o Command line (CLI) support
+ many smaller performance and functionality improvements
May2018dbWatchEnterpriseManager 22
C H A P T E R
9Applicationspecificversions
dbWatchforUNIT4BusinessERPSolution(Agresso)Agresso is a set of Enterprise Resource Planning (ERP) solutions from Unit4. dbWatch has developed a set of modules specifically to address the needs of Agresso customers. The main purpose of the dbWatch Agresso module is to monitor and manage the critical database components of the Agresso database. This module simplifies technical maintenance of the specific Agresso database features, which need continued attention from the Database Administrator. The Agresso module helps the DBA to optimize database performance and to automate maintenance tasks. The dbWatch Agresso module consists of three main parts:
• Agresso Tasks and Alerts • Agresso Management • Agresso health-check report
Agresso Tasks and Alerts
The Agresso Task and Alert templates are a set of procedures, which can be installed into the dbWatch monitoring framework. Those procedures are responsible for collecting information related to the Agresso database (performance, growth rate, usage patterns, etc.), and for checking the critical parts of the Agresso database (indexes, reports, connections, etc.). Procedures responsible for collecting data are called Tasks, while procedures checking data are called Alerts. The Agresso Task and Alert procedures are the database monitoring package in the dbWatch context. Agresso Management The Agresso Management plugin is an extension to the dbWatch Management Module and is not dependent on the monitoring module (can be used without installing the Agresso Task and Alert procedures). This module enables you to manage the Agresso database in a more efficient and structured way.
Agresso health-check report The Agresso report is based on information collected by the Agresso Tasks and Alerts, and some of the standard dbWatch Tasks and Alerts. Therefore, it cannot be used without installing the Agresso monitoring module. This report template can be adjusted and modified to create advanced reports for capacity planning or SLA related needs.

May2018dbWatchEnterpriseManager 23
C H A P T E R
10Technicalspecifications
The following sections specify the technical prerequisites for using the dbWatch platform.
SupportedDatabasePlatformsdbWatch supports the following databases:
§ Oracle: 8i, 9i, 10g, 11g, 12c • Standard edition and Enterprise edition • Oracle RAC cluster • Oracle Dataguard • Note: only standard version required
§ MS SQL Server: 2000, 2005, 2008, 2012, 2014, 2016, 2017 • MS SQL Server AlwaysOn
§ Sybase: 12, 15
§ MySQL: 5.0 and later
§ MariaDB
§ PostgreSQL: 8.2 and later
§ Microsoft Azure
TechnicalRequirements
dbWatch Server • Windows, Apple OSX or Linux Server on I386 (VMWare virtual server
supported) • 8 GB RAM recommended • 1 GB HD Space • Installs in under 15 minutes
dbWatch Engine (per instance) • 500 Mb free space in each database instance recommended • Bulk install for large database environments • SA, SYS or other superuser password required for each engine installation • Installs in under 2 minutes per instance
dbWatch Client • Windows, Apple OSX or Linux operating system for use with graphical
interface

May2018dbWatchEnterpriseManager 24
• 500 Mb hard drive space • Java support • 2 Gb memory • Client - Server communication requires single port only

May2018dbWatchEnterpriseManager 25
A P P E N D I X
A Preconfiguredmonitoringprocedures
dbWatch delivers pre-configured monitoring procedures based on best practices for each supported database platform.
OracleBlocking detector Buffer cache statistics Memory statistics Redo statistics Session load Wait statistics File I/O statistics Open cursors check Disk read statistics Latch statistics SQL Statements statistics Undo statistics DML Performance RAC Monitoring Flash recovery area usage Free extents check Segment size collector Segment size status Tablespace check
ASM disk statistics ASM diskgroup check Job scheduler Availability check Alert log check RMAN Backup check CPU Load Network statistics Top user memory usage User memory statistics Oracle License information Auto extensible data files Temp tablespace usage Backup log check Export log check File status check Listener log check Listener status check Data Guard archive check
MSSQLServerBlocking detector Data hit ratio Session load SQL statements statistics Index usage statistics External fragmentation File I/O stats DML Performance DB growth rates Disk space check Filegroups growth rate Transaction log size Transaction log space usage
Agent jobs check DB uptime SQL Server agent status Database disk space usage Internal fragmentation Memory object statistics Transaction log backup check Backup all databases task Datafile size check Database mirroring Log shipping monitor Database status Database backup check

May2018dbWatchEnterpriseManager 26
Sybase
Data cache monitor Disk activity monitor Engine CPU monitor System monitor collector Procedure cache check Session load
Database space check Database growth rate Database uptime
MySQL
Memory setup Session load Temporary table check Binlog cache check Innodb buffer pool check Database load Lock statistics
Database growth rate Key buffer check Network traffic Query cache Thread cache Temp table check Database uptime
PostgreSQL
Analyze check Disk block hit rate Locks held Index block hit rate Database growth rate Log size statistics Tablespace Vacuum check
Database uptime Daily analyze job Schema growth and info Session load Table and index statistics Transaction statistics Backup check (pg_dump)
Go to http://wiki.dbwatch.com/ for detailed information about each procedure.
dbWatchASKongensgate15N-0153OsloNorwayTel+4722331420Email:[email protected]


