DOCUMENT RESUME ED 101 880 RC 008 307 AUTHOR Noland, John, Jr. TITLE Some Social Structural Correlates of Anomia Among Rural Blacks of Louisiana. SPONS AGENCY Cooperative State Research Service (DOA), Washington, D.C. REPORT NO USDA(CSRS)-216-1519 PUB DATE Feb 75 NOTE 15p.; Paper presented at the Rural Sociology Section of the Southern Association of Agricultural Scientists, New Orleans, Louisiana, February 1975 EDRS PRICE MF-$0.76 MC-$1.58 PLUS POSTAGE DESCRIPTORS *Citizen Participation; Correlation; *Disadvantaged Groups; Education; Group Membership; Income; Morale; Negative Attitudes; *Negroes; Organizations (Groups); *Rural Areas; *Social Attitudes; Socioeconomic Status; Tables (Data); Voter Registration ILINTIFIERS *Anomia; Louisiana ABSTRACT The purpose of this study was to test the hypothesis that anomia as defined by the Stole scale (a measurement of despair, hopelessness, and retreatism) is inversely related to socio-economic status (as measured by occupation, income, and education) and the amount of informal and formal group participation. Data were collected via random sample surveys (personal interviews with head of honsl:uold or their substitutes) in 3 rural black parishes of Louisiana. The 594 respondents were asked to respond to the following Stole items: In spite of what people say, the lot of the average man is getting worse; It's hardly fair to bring children into the world with the way things look for the future; Nowadays a person has to live pretty much for today and let tomorrow take care of itself; These days a person doesn't really know who can count on; There's little use writing to public officials because often they aren't interested in the problems of the average man. Nearly two thirds of the respondents were classified in the high anomia scale category and significant inverse relationships were found in feelings of anomia as related to education, income, voter registration, and number of organizational affilations (pessimism was lower among those who participated in secondary associations and/or the political process). (JC)
Transcript
DOCUMENT RESUME
ED 101 880 RC 008 307
AUTHOR Noland, John, Jr.TITLE Some Social Structural Correlates of Anomia Among
Rural Blacks of Louisiana.SPONS AGENCY Cooperative State Research Service (DOA), Washington,
D.C.REPORT NO USDA(CSRS)-216-1519PUB DATE Feb 75NOTE 15p.; Paper presented at the Rural Sociology Section
of the Southern Association of AgriculturalScientists, New Orleans, Louisiana, February 1975
EDRS PRICE MF-$0.76 MC-$1.58 PLUS POSTAGEDESCRIPTORS *Citizen Participation; Correlation; *Disadvantaged
ABSTRACTThe purpose of this study was to test the hypothesis
that anomia as defined by the Stole scale (a measurement of despair,hopelessness, and retreatism) is inversely related to socio-economicstatus (as measured by occupation, income, and education) and theamount of informal and formal group participation. Data werecollected via random sample surveys (personal interviews with head ofhonsl:uold or their substitutes) in 3 rural black parishes ofLouisiana. The 594 respondents were asked to respond to the followingStole items: In spite of what people say, the lot of the average manis getting worse; It's hardly fair to bring children into the worldwith the way things look for the future; Nowadays a person has tolive pretty much for today and let tomorrow take care of itself;These days a person doesn't really know who can count on; There'slittle use writing to public officials because often they aren'tinterested in the problems of the average man. Nearly two thirds ofthe respondents were classified in the high anomia scale category andsignificant inverse relationships were found in feelings of anomia asrelated to education, income, voter registration, and number oforganizational affilations (pessimism was lower among those whoparticipated in secondary associations and/or the political process).(JC)
4'
,
S DEPARTMENT OF NEALTH.EDUCATION& VI/ELOARENATIONAL INSTITUTE OF
EDUCATION*H. DC:UMENT HA'. BEEN Pk°Om. ED EXACTLY AS NEceiNeo Nomt45 PeRSONORORGAN124tt7NOkIf
. iNAT ING It potoesof NIEW OR OPINIONSstAtED DO NOT NECESSARILY REPREsE OXXICIAL NATIONAL INstetutE OtI DoCAttON POSITION
OR POI. Ic
SOME SOCIAL STRUCTURAL CORRELATES OF ANOMIAAMONG RURAL BLACKS OF LOUISIANA
John Noland, Jr.Southern University, Baton Rouge
Paper presented at the Rural Sociology Section of the SouthernAssociation of Agricultural Scientists New Orleans, LouisianaFebruary, 1975. This report contributes to USDA - CSRS projects#216-1519 and 016-1530 Rural Community Problems and LeadershipResearch.
0002
SOME SOCIAL STRUCTURAL CORRELATES OF AliOntAAMONG RURAL BLACKS OF LOUISIANA
John Mbland, Jr.
Abstract
Low income people, especially blacks in some rural areas, experience
dehumanization, discrimination and denial of basic rights. Such conditions
including rural living, minority status, low income and poverty are reportedto bring about that state of alienation associated with powerlessness,
normlessness hopelessness and despair. The Srole scale of "anomie hasbeen referred to as a measure of despair, hopelessness, and retreatism.An examination of the literature suggests that anomie as defined by the
Srole scale is inversely related to socio - economic status (as measured
by occupation, income and education) and the amount of informal and formal
group participation.
Data from a systematic random sample of blacks in rural communities
of three parishes in Louisiana revealed a coefficient of reproducibility
of .9163 when the Guttman scaling technique was applied to the five Srole
items. Nearly two-thirds of the respondents were classified in the high
anomie scale category thereby indicating the presence of strong feelings
of hopelessness and despair among respondents. No significant differencesexisted among respondents by sex, age, and occupation.
Significant inverse relationships were found, however, with respect
to feelings of anomie as related to education, income, voter registration
and number of organizational affiliations. With respect to social partici-
pation involving organizational membership and voter registration there
is some support for the hypothesis that the greater the participation in
secondary associations and in the ?411;.14a1 process the lower the feelings
of pessimism, hopelessness and despair. The implication of these findings
is the need to promote, among the rural population considered here,
greater civic involvement with emphasis on the political process. Such
involvement may have positive effects for community problems and thereby
reducing the presence of anomie.
This research project was supported by CSRS Grant Funds #8-1519.
0003
SOME SOCIAL STRUCTURAL COSARLAISS OF AMNIAAMONG RUM Lit= OF LOUISIANA
John Nolaad, Jr.Southern University, Baton Rouge OSA
tort 00.1.
Blacks in the rural delta South have been characterized as living in afeudal social structure in which they have no control over the decisions thatgovern their daily activities (Coleman, 1964). The implication is that theblack man in the rural South has been limited not only in his choice of culturalgoals but also in the means available to him for achieving goals once they havebeen selected. In addition, once selected goals have been partially achievedor even fully achieved blacks in some rural areas have been denied the mesas toconsummate these coals and/or experience the satisfaction of their attainment.The evidence includes numerous denials of opportunities to secure employment,land, loans. material goods and equipment for house and farm, and the right tovote (including the application of pressure not to vote once registered). Taus,
it is concluded that black and low-income people in some rural area experiencedehumanization, discrimination and denial of basic rights (Ginsberg, 1969).
Conditions of low income and poverty, minority status, ghetto living, andrural life are often mentioned in association with stroag feelings of alienation(Bell, 1957, Mier and Bell, 1959, Bullough, 1967, Killian and Wigs, 1962). It
is presumed that living under the conditions described above brings about thatstate of alienation, associated with feelingh of powerlesenean, normleasness,hopelessness and despair. In view of black experiences is the rural Souththese feelings of alienation are viewed as being more prevalent amon6 ruralthan urban blacks, among older than younger blacks, and amona, those of lowersocial economic status than among those of higher status as measured by occu-pation, income, and education. Amonifthe several purported measures of nom-lessness the best known is the Srole's scale of "anomie" (Scale, 1956) .This scale has been widely used in research investigations and is frequentlyreferred to as a general index of alienation. Investigators have noted,however, that Srole's scale of "anomie appears not to be a measure of norm-lessneas so much as a measure of despair and retreatism (Rushing, 1972;Meier and Bell, 1959; Bryan end Bertrand, 1970; Brbe, 1964). Meier and Bell(1959) write "we are convinced that these questions for the moat part measuredespair, that is, utter hopelessness and discouragement... We have adoptedthe term 'anomie' to refer to the Srole scale but other terms such as'despair', 'hopelessness', 'discouragement', 'personal disorganization','demoralization' (especially in the sense of disheartenment) and other termsmight he used at this point in our understanding of the phenomenon beingmeasured." Brbe (1964) has referred to this scale as measuring retreatistalienation, characterized "In detachment and despair, in the feeling thatthe world promises nothing in the way of comfort or support." Somewhat inthis sense the Srole scale has been used as a measure of fatalism by Bryanand Bertrand (1970). They used the word "fatalism" to avoid confusion andbecause it seems most accurately to depict the single dimension meaning ofthe scale (p. 7).
According to Srole (1956, p. 711), his scale refers to the individualeunomia-anomia continuum representing "the individual's generalized pervasivesense of self-to-others belongingness at one extreme compared with self-to-others distance and self-to-others alienation at the other pole of the con-tinuum." The scale consists of the following five items with which therespondent may either agree or disagree.
0004
203 04 WOO
1. In spite of what some people say, the lot of the average man
is getting worse.2. It's hardly fair to bring children into the world with the way
things look for the future.3. Nowadays a person has to live pretty much for today and let
tomorrow take care of itself.4. These days a person doesn't really know who he can count on.
5. There's little use writing to public officials because oftenthey aren't really interested in the problems of the average
man.
2
These five items "represent internalized counterparts or reflections in the
individual's life situation of conditions of social dysfunction" in the societycharacterized in a sociological sense as "anomie" (Srole 1956, p4 712). The
aaomia scale has been taken as a psychological measurement of "anomie" as
subjectively experienced and reflected in personal beliefs, perceptions, ororientations of the individual.
The anomie components of the five items have been stated by Srole as
follows: The first item reflects the individual's view that he and people
like him are retrogressing from the goals they have already reached. The
second item, perhaps most closely approximating Durkheim's particular
definition of anomie, is the deflation or loss of internalized social norms
and values, reflected in extreme form in the individual's sense of the mean-
ingless of life itself. A third element of anomie (see Item 3) is theindividual's perception of the social order as essentially fickle and unpre-
dictable, i.e., orderless, including the sense that under such conditions he
can accomplish little toward realizing future life goals. The individual's
perception that his framework of immediate personal relationships, the very
rock of his social existence, is no longer predictive or supportive, isexprassed by the fcurth item. The last item of the five listed above reflects
the individual's feeling that community leaders are detached from and
indifferent to his needs reflecting severance of the interdependent bondwithin the social system between leaders and those they should represent and
serve (Srole, 1956, pp. 712-713).
In this investigation, anomie as measured by the Srole scale is used
as a fairly generalized view or perspective of society held at largely the
conscious level and describing the individual's appraisal of life conditions
as problematic or non-problematic insofar as personal management is concerned
for him and for people like himself. The concern is not with measuring anomieprimarily as a psydlological manifestation of expressions of normlessness,hopelessness, despai and discouragement but also as reflecting the respon-dents' perception of reality as a state or condition of society affecting his
general life situation. In other words, one's responses to items in the Srole
scale are viewed as reflecting what he, the respondent, perceives as being the
nature of social conditions as they affect him and others like himself.
Based upon the investigator's examination of the literature it ishypothesized that anomie as defined by the kola scale is inversely relatedto individual economic status as measured by occupation, income and education
as well as the amount of informal and formal group participation (Bell, 1957;
Meier sad Bell, 1959; Rushing, 1972).
0006
3
Methodology
Data for this study were collected by means of sample surveys conducted
in the rural black communities of three parishes in Louisiana--West Feliciana,West Baton Rouge, and East Baton Rouge. Through the use of maps and census
reports, wards in each parish were identified and the number of black house-
holds was determined. After determining in a proportional manner the numberof households from each ward to be included in the sample, they were chosenby means of systematic random sampling. In most cases, interviews were
conducted with the head of the household or with the wife of the bead When
he was not present. The total sample of 564 respondents included 191 respon-dents from rural communities of East Baton Rouge Parish, 173 from WestFeliciana Parish, and 200 respondents from the rural areas of West BatonRouge Parish.
Included in the questionnaire used in this investigation were the five
Srole items on anomie. The response categories for these items were strongly
agree, agree, disagree, and strongly disagree. From the systematic randomsample previously described those respondents not answering each of the fiveitems (43 in number) were excluded. The Guttman scaling technique was applied
to the five Srole items and the unique scale types ware collapsed to form
three scale groups--low, moderate, and high anomie.
Table 1 presents the distribution of respondents by scale type followingthe application of the Guttman scaling technique to Srole items. After
adjustments were made for errors the items were found to scale with a
Table 1
Guttman Scale - Srole Items
Lots Write Live for Number of
Scale Type Children Worse Offs. _Ada Count On Respondents
6 1 1 3 1 1 330
5 0 1 1 1 1 89
4 0 0 1 1 1 44
3 0 0 0 1 1 21
2 0 0 0 0 1 16
1 0 0 0 0 0 21
521
Coefficient of Reproducibility = .9163
coefficient of reproducibility of .9163. This finding indicates the presenceof an acceptable degree of validity and reliability in the scale for differen-tiation among respondents in terms of feelings of anomie. It is revealed inTable 2 that nearly two-thirds of the respondents (63 percent) fall in thehigh anomie scale group while the remaining one-third are divided between themoderate (26 percent) and low (11 percent) scale groups.
0006
Table 2
Anomie Scale Groups
4
Degree of Anomie Number of Respondents Percent
High 330 63
Moderate 133 26
Low 58 11
Total 521 100
Findings
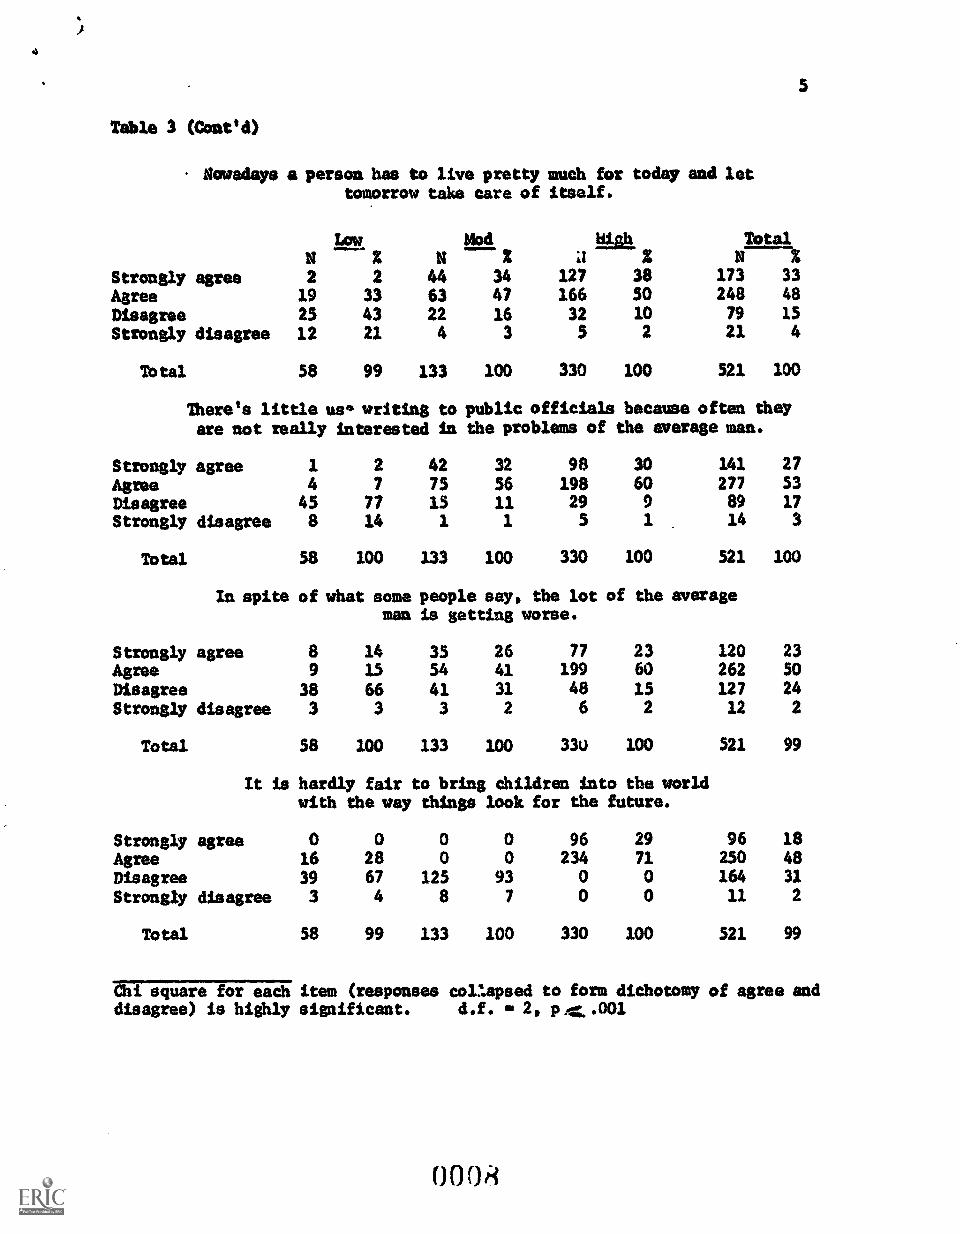
The application of the Guttman scaling technique to the Srole itemscaptures the degree and extent of feelings of hopelessness and despair among
respondents. As revealed in Table 3, when agree and strongly agree arecombined, from two-thirds to 90 percent of all respondents agree with each
of the five items in the scale. It is observed that 90 percent of the respon-dents feel that "these days a person doesn't really know who he can count on."
Nearly 50 percent of all respondents "strongly agree" with this item. Four-
fifths or more of all respondents agree with the first three items which
suggest that one cannot depend on others and the future is unpredictable and
bleak. High agreement is also given to the fourth and fifth items whichinvolve the feeling that things are getting worse and the future is toouncertain for bringing children into the world.
The differences found among scale grdups on the five items are extremelysignificant as revealed by the chi square values. Thus, those respondents
who are high on the scale perceive cenditiuns as wore difficult .md expressgreater pessimism, despair, and hopelessness toward the realities of their
Table 3
Responses to Srole's Anomie Items
These days a person doesn't really know who he can count on.
ResponseN
letz
7 12
24 4124 413 5
58 99
NWA
2
68 5159 446 5
0 0
133 100
NRaiz
167 51147 44
15 5
1 0
330 100
Total
Strongly agreeAgreeDisagreeStrongly disagree
Total
N Z
242 46230 44
45 94 1
521 100
0 0 1
I4
Table 3 (Coned)
Nowadays a person has to live pretty much for today and lettomorrow take care of itself.
Um ModN
4111 Nia
TotalN
5
Strongly agree 2 2 44 34 127 38 173 33
Agree 19 33 63 47 166 50 248 48
Disagree 25 43 22 16 32 10 79 15
Strongly disagree 12 21 4 3 5 2 21 4
Total 58 99 133 100 330 100 521 100
There's little us' writing to public officials because often theyare not really interested in the problems of the average man.
Strongly agree 1 2 42 32 9$ 30 141 27
Agree 4 7 75 56 198 60 277 53
Disagree 45 77 15 11 29 9 89 17
Strongly disagree 8 14 1 1 5 1 14 3
Total 58 100 133 100 330 100 521 100
In spite of what some people say, the lot of the averageman is getting worse.
Strongly agree 8 14 35 26 77 23 120 23
Agree 9 15 54 41 199 60 262 50
Disagree 38 66 41 31 48 15 127 24
Strongly disagree 3 3 3 2 6 2 12 2
Total 58 100 133 100 330 100 521 99
It is hardly fair to bring children into the worldwith the way things look for the future.
Chi square for each item (responses collapsed to form dichotomy of agree anddisagree) is highly significant. d.f. 2, P4L.001
0 0 0
6
life situation. The sharpest difference among scale groups is found inthe fifth item--"It is hardly fair to bring children into the world withthe way things look for the future." Here, it is observed that all respon-dents in the high scale group agree with the item while all respondents inthe moderate group and 71 percent of those in the low group disagree withthe item.
Generally speaking, in view of the high anomie score among nearly two-thirds of the respondents, it is safe to conclude that feelings of despair,distrust, and hopelessness are strongly evidenced among these respondents.
Table 4
Sex of Respondents
Scale Group Male FemaleN 2 N
High 89 61 241 64
Mbderate 46 31 87 23Low 12 8 46 12
Total 147 100 374 99X2- 4.53, 2 d.f. insignificant
Table 4 indicates that there is no significant difference between male andfemale respondents with respect to high feelings of anomie. It has beensuggested by other investigators that anomie may be typical of the poor ingeneral and that poverty is "a climate of discouragement and despair." Thepoor have been characterized by Oscar Lewis (1961) as having a "sense ofresignation and fatalism based upon the realities of their difficult lifesituation."
No significant difference was found among the three scale groups interms of age (see Table 5). While a slightly larger percentage of thosein the high anomie group as compared with those in the moderate and lowgroup are under 35 years of age, the difference is small and statisticallyinsignificant.
Slightly above one-fifth of all respondents (22 percent) had completedless than five years of schooling (see Table 6). Nearly half of all respon-dents (46 percent) have less than eight years of schooling. Only aboutone-fourth (24 percent) had completed 12 years or more of formal education.Findings from other studies previously mentioned in this paper suggest thatthose persons with higher levels of education will be less anomie than thosewith lower levels of education. Respondents with 12 or more years ofeducation are less anomie than those with lees than 12 years of schooling.The chi square value for this comparison with 2 d.f. is significant at the.05 level.
(X2 gm 6.31, 2 d. f. significant at .05 level after collapsing gradesbelow 12.)
No significant difference is obtained by scale group when respondentsare compared in terms of occupation (see Table 7). Even when grouped interms of white collar, blue collar (craftsmen and operative), serviceworkers and laborers (including farm laborers) no significant differenceis found among the three scale groups. Over 50 percent of the respondentsin each scale group are laborers.
0010
Occupation
Table 7
Occupation of Respondents
Professional WorkersSemi-Professional
WorkersProprietors, Managers
and OfficialsClerical, Sales and
Kindred WorkersCraftsmen, Foremen,
Kindred WorkersOperative and Kindred
WorkersDomestic Service WorkersProtective Service WorkersService Workers except
domestic and protectiveLaborers (farm laborers,
croppers, and foremen)None, not given
Total
N
50
0
o
3
2
1o4
34
9
58
Scale Group
Low Moderate High
2 N 2 N 2
9 8 6 11 3
0 1 1 4 1
0 5 4 14 4
0 1 1 2 1
5 7 5 21 6
3 14 10 14 4
2 6 4 21 6
0 0 0 1 0
7 8 6 25 8
59 72 55 185 56
15 11 8 32 10
100 133 100 330 99
Table 8
Monthly Family Income By Scale Group
Scale Groups
8
Low Moderate Total
Income N N 2 NHigZ N 2
$700 and above 16 32 25 20 38 13 79 17
500 - 699 8 16 20 16 40 13 68 14
300 - 499 6 12 24 20 74 25 104 22
0 - 299 20 40 54 44 146 49 220 47
Total SO 100 123 100 298 100 471 100
Chi Square 15.98, d.f. = 6, p (.02
Table 8 presents income by scale group. Inspection of this table reveals
that 32 percent of those in the low scale group have monthly family incomes
of $730 or more as compared to only 13 percent of those in the high scalegroup. Nearly three-fourths of the respondents in the high scale group have
0011
I
9
family incomes of less than $500 per month as compared to about 50 percentof those respondents in the low scale group. The chi square value obtainedfor this table (15.98) is significant at the .02 level. Income is notIndependent of scale group. Those respondents with higher incomes areless anomie than those with lower incomes. Thus, income is a significantvariable for differentiating among the scale groups.
Other studies have suggested an inverse relationship between feelingsof anomie and membership in secondary associations. Inspection of Table 9reveals that nearly half of the respondents in the high and moderatescale groups belong to no organization (exclusive of church membership)as compared to only one-third of the respondents in the low group. Whilethere is not much difference among the three scale groups in terms ofmembership in one organisation, 22 percent of low anomie group belong tothree or)more organizations as compared to 8 percent of the moderatesand only 5 percent of the high anomie' group. When respondents belonging
Table 9
Number of Organizations to Which RespondentsBelong By Scale Group
Scale Groupe.Number of Low Nod HighOrganizations N X N % N %
Total 58 99.9 133 100.0 330 99.9X2 = 12.52, 2 d.f. significant at .01 level for three or more.
less than three organizations are compared with those belonging to threeor more organizations the obtained chi square value is significant at the.01 level. Thus, a larger percentage of respondents in the low scalegroup than those in the moderate and high groups belong to three organi-zations or more.
During the past decade blacks in many rural communities havebecome registered voters for the first time. This is especially the casein West Paliciana parish where no blacks were registered to vote prior to1964. It is very likely that registering to vote and participation in localpolitics tend to reduce the feelings of despair, hopelessness, and power-lessness.
0012
eff
10
Table 10 presents by scale group responses to the question, "Areyou registered to vote?" Here, it is noted that 86 percent of the respon-dents in the low scale group gave an affirmative response as compared to80 percent of the moderates and only 71 percent of the high scale group.Only 14 percent of the respondents in the low scale group answered "no"
while twice as many (29 percent) in the high scale group answered "no".The chi square value obtained for this distribution is significant at the.01 level. Thus, there is a highly significant relationship between the
scale groups and voter registration. Those respondents with low anomie
scores are more likely to be registered voters than those respondents with
high anomie scores.
Table 10
Registered and Non-Registered Votersby Scale Group
Low Mod High Total
Response N Z. N Z N 2 N 2
Yes 50 86 107 80 233 71 390 75
No 8 14 26 20 97 29 131 25
Total 58 100 133 100 330 100 521 100
Chi Square: 9.345 d.f. IN 2, pef..01
Summary.
The analysis of the anomie scale scores revealed that nearly two-thirdsof that respondents fell in the high anomie scale category and one-fourth inthe .Aoderately anomie scale group while only about one-tenth of the respon-dents exhibited low feelings of anomie. The presence of such strong feelingsof hopelessness, despair, and pessimism among the respondents suggest thepresence of a climate of discouragement, despair, and pessimism within the
community insofar as the residents being able to effect significant changesin their circumstance and condition.
About half of all respondents had less than an eighth grade educationand about one-fourth had less than five years of schooling. In an age of
automation and emphasis on obtaining at least a high school education, theserespondents may find themselves at a distinct disadvantage. Thus, as ruralpeople in a setting where mechanized farming is increasingly replacing manuallabor, they may feel themselves locked in a hopeless situation without thepower to bring about needed changes. It should also be noted, however, thatwhile respondents with 12 years or more of education were less anomie thanthose with less than 12 years of education, still 54 percent of them (thosewith 12 years or more of education) were in the high anomie scale group.
Contrary to expectations, there was no difference between white collarworkers (those positions which usually require higher levels of education)and other workers with respect to position on the scale. A significantinverse relationship was obtained, however, between income and anomie. Those
with higher incomes tended to be less anomie egan those with lower incomes.
0013
Jr
11
With respect to social participation involving organizational member-
ship and voter registration there is some support for the hypothesis that
the greater the participation in secondary associations and in the political
process the lower the feelings of pessimism, hopelessness, and despair.
The implication of these findinggs is the need to promote, among the rural
populations involved, greater civic involvement including involvement in
the political process. Such involvement may not only reduce the coLiition
of anomie but also aid in bringing solutions to the problems of housing,
unemployment, and poverty (McManus, 1973; Means, 1973; Noland, 1972).
40,00'4.0
0014
-1
References
Bell, Wendell1963 "Anomie, Social Isolation, and the Class Structure.' Sociometry
20 (aune)1105-116.
Bryan, Hobson C. and Alvin L. Bertrand1970 "Propensity for Change Among the Rural Poor in the Mississippi
Delta: A Study of the Roots of Social Mobility." Agricultural
Economic Report No. 185. Washington, D. C.: U. S. Government
Printing Office.
Bullough, Bonnie1967 "Alienation in the Ghetto." American Journal of Sociology 72
(March) 469-478.
Coleman, James1964 "Implications of the Findings on Alienation." American Journal
of Sociology, 70 (July):76-78.
Erba, William1964 "Social Involvement and Political Activity: A Replication and
Elaboration." American Sociological Review 29 (April):198-215.
Ginsberg, Leon H.1969 "Social Problems in Rural America." Social Work Practice.
New York: Columbia University Press, 176-186.
Killian, Lewis M. and Charles M. Grigg1962 "Urbanism, Race, and Anomie." American Journal of Sociology 67
(May):661-665.
Lewis, Oscar1961 The Children of Sanchez. New York: Random Rouse.
McManus, Delilah A.1973 "Rural Community Needs and Problems as Perceived by Indigenous
Leaders and ion-Leaders in West Feliciana and East Baton Rouge