24

Who is DCANZ
• Association of dairy processors & exporters
• Formed in 2003
• 11 members
• Membership accounts for 98% of milk
processed in NZ
• Members exporting interests:
– span more than 100 markets

Our Role
To work in the best interests of the New Zealand dairy industry as a
whole,
and in particular,
to represent the collective position of New Zealand dairy
manufacturing and exporting companies on industry wide policy
issues, both within New Zealand and internationally.

DCANZ activities
• Provide a platform for discussing and
formulating industry-wide positions
• Engage in Government policy processes
• Point of contact for media and general public
• Work with other industry bodies on areas of
shared interest
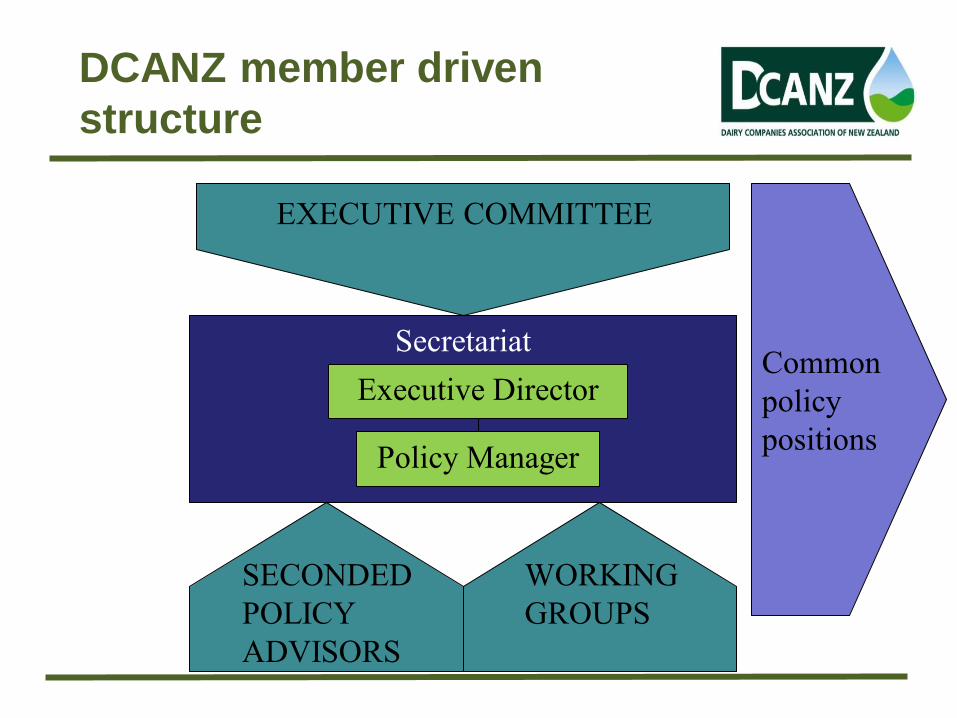
DCANZ member driven
structure
SECONDED
POLICY
ADVISORS
WORKING
GROUPS
EXECUTIVE COMMITTEE
Secretariat Common
policy
positions
Executive Director
Policy Manager

DCANZ works in support of the
dairy industry having good policy
frameworks
Animal Welfare – Robust evidence-based, outcome-
focused frameworks
Food Safety – Robust evidence- based, outcome-
driven frameworks
Biosecurity – Frameworks that mitigate risk and
promote rapid response
Trade Policy – Open markets without
domestic support- related distortions
Environment – policy that solves the
problem with the lightest regulatory touch necessary
DCANZ – Policy engagement
mechanisms
• Regular dialogue with Ministers
• Technical level engagement with MPI via:
– DPSAC (focused on manufacturing standards)
– DITAG (focused on raw milk quality standards)
– Animal sector biosecurity group
• Joint engagement with Government in the NZ
national committee for the International Dairy
Federation

• 4.8M cows compared to 4.5M people
• 11,891 herds
• 1.6M hectares used for dairy farming – 6% of NZ’s land
• Producing 3% of the world’s milk – 20 billion litres
• 95% of milk produced is exported
• Pasture grazing farm model
• No Government Subsidies
Scene-setter: New Zealand Dairy
Industry
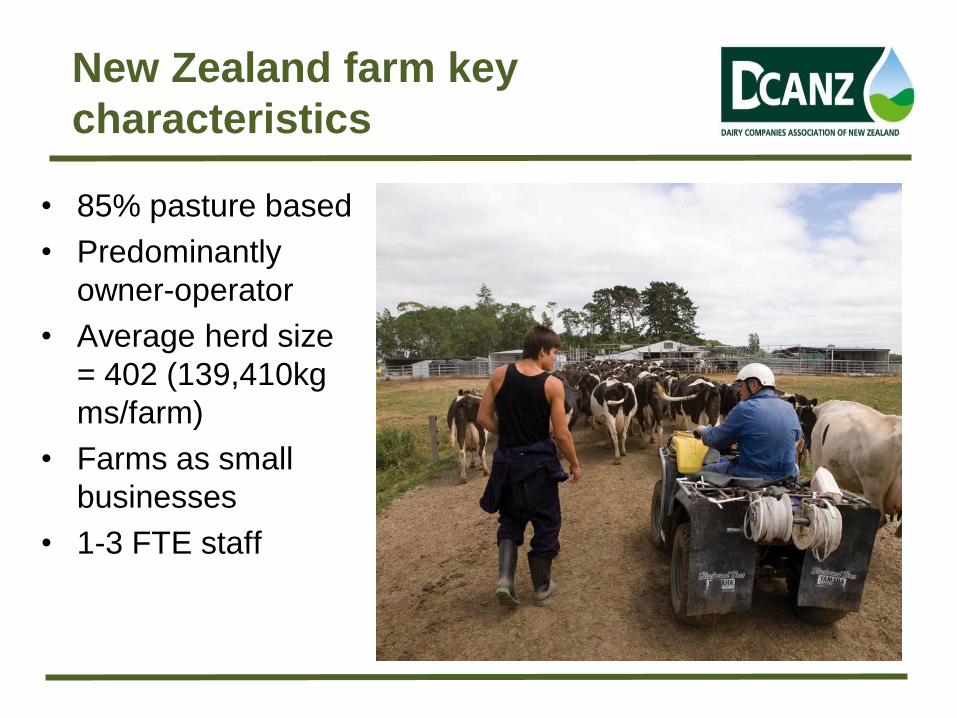
New Zealand farm key
characteristics
• 85% pasture based
• Predominantly
owner-operator
• Average herd size
= 402 (139,410kg
ms/farm)
• Farms as small
businesses
• 1-3 FTE staff
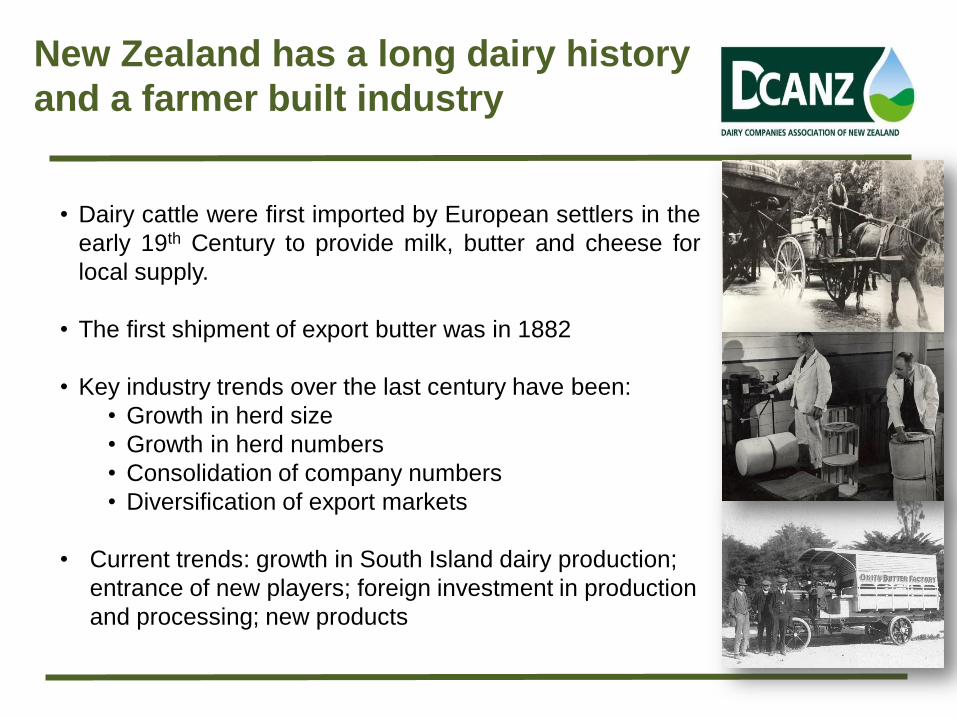
New Zealand has a long dairy history
and a farmer built industry
• Dairy cattle were first imported by European settlers in the
early 19th Century to provide milk, butter and cheese for
local supply.
• The first shipment of export butter was in 1882
• Key industry trends over the last century have been:
• Growth in herd size
• Growth in herd numbers
• Consolidation of company numbers
• Diversification of export markets
• Current trends: growth in South Island dairy production;
entrance of new players; foreign investment in production
and processing; new products
Key Success factors
• Good Soils
• Temperate climate
• Pasture based production
• Lack of subsidies
• Natural ‘island based’ biosecurity protection
• Exporting history
• Focus on innovation

0
10
20
30
40
50
60
70
80
Pasture Growth
Feed Demand
Calving
Mating Conserved Silage
Drying
Off
Seasonal production maximises
pasture use, and the costs of
production
Jun Jul Aug Sep Oct Nov Dec Jan Feb Mar Apr May

Productivity gains
Drought
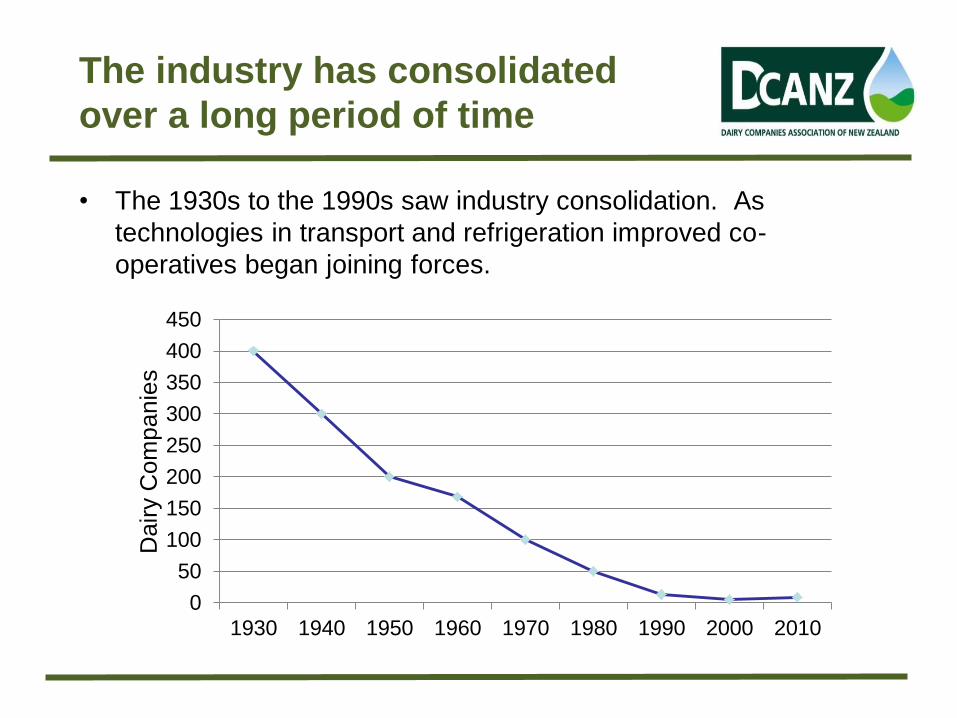
The industry has consolidated
over a long period of time
• The 1930s to the 1990s saw industry consolidation. As
technologies in transport and refrigeration improved co-
operatives began joining forces.
0
50
100
150
200
250
300
350
400
450
1930 1940 1950 1960 1970 1980 1990 2000 2010
Dair
y C
om
pa
nie
s

Key milestone: Dairy Industry
Restructuring Act 2001
• Merger of the NZ Dairy Board and two
largest companies to create Fonterra
• Regulation for a contestable, efficient
market

Raw Milk Regulations
• Fonterra must make available up to 5% of
raw milk supply to independent processors at
an agreed or regulated price.
• Objective to provide an entrance pathway for
independent processors.
• Restricts how much milk can be taken (from
Fonterra by other companies) in different
months of the season. Monthly limits reflect
the typical New Zealand seasonal supply
curve.

Impact of DIRA
• In 2001, Fonterra collected 96% of milk; this
has now fallen to 88%
• There has been an increase in dairy
processors – from 5-10
• High interest in foreign investment in dairy
(mainly from China)

Industry Strategy for Sustainable Dairy
farming
Scene-setter: an export-
focused industry
Dairy is an export-focused industry in New
Zealand.
There is significant potential for policy to impact on
our competiveness.
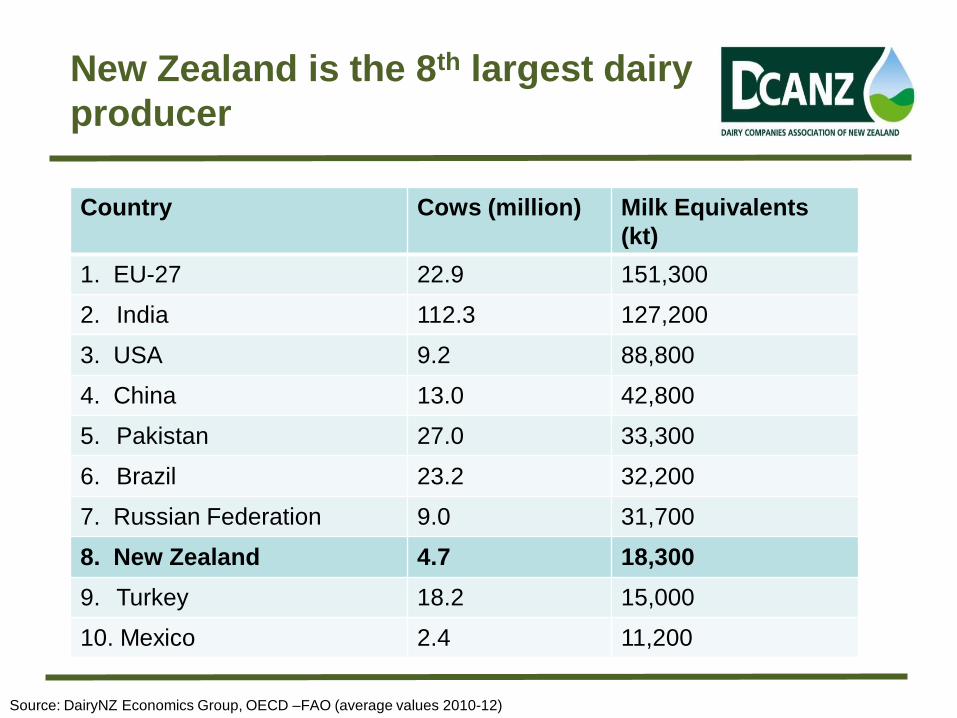
Country Cows (million) Milk Equivalents
(kt)
1. EU-27 22.9 151,300
2. India 112.3 127,200
3. USA 9.2 88,800
4. China 13.0 42,800
5. Pakistan 27.0 33,300
6. Brazil 23.2 32,200
7. Russian Federation 9.0 31,700
8. New Zealand 4.7 18,300
9. Turkey 18.2 15,000
10. Mexico 2.4 11,200
Source: DairyNZ Economics Group, OECD –FAO (average values 2010-12)
New Zealand is the 8th largest dairy
producer

New Zealand has also developed a
diverse dairy export profile of over
100 markets

New Zealand’s milk production
growth will be overshadowed by
global demand growth going forward
New Zealand
(4m MT)
Rest of Asia
(19m MT)
China
(36m MT)
India
(45m MT)
Rest of
Africa
(8m MT)
EU 27
(6m MT)
Sources: Fonterra analysis. Milk Equivalent (ME) basis.
Latin
America
(18m MT)
USA/Canada
(11m MT)
New Zealand Production
Demand
Middle East
& North
Africa
(13m MT)
Estimated global demand growth (2009-2019) - billion litres

Russia and NZ Dairy Trade
• A long history of trade in dairy products
between New Zealand and Russia
• Russia continues to be an important market
for New Zealand dairy products
• A priority for DCANZ is for this trade to
continue on a stable basis