27
DCF Analysis Kelvin Xu Slides prepared by: Asthon Wu, Garrett Kuhlmann UofT Engineering Finance Association Finance 101
| Date post: | 01-Jan-2016 |
| Category: |
Documents |
| Upload: | vernon-wiggins |
| View: | 50 times |
| Download: | 2 times |
DCF Analysis
Kelvin Xu Slides prepared by: Asthon Wu, Garrett
Kuhlmann
UofT Engineering Finance AssociationFinance 101
2
Introduction
► Need to learn theory of DCF before learning how to use the spreadsheet
► The Forecasting Period & Forecasting Revenue Growth
► Forecasting Free Cash Flows► Calculating the Discount Rate► The Fair Value
UTEFA
3
Background UTEFA
► Projects how much money a company will make in the future
► Determines a fair price based on this projection
► “Time value of money”► Several approaches: free cash flow
to equity, dividend discount model, cash flow to firm
4
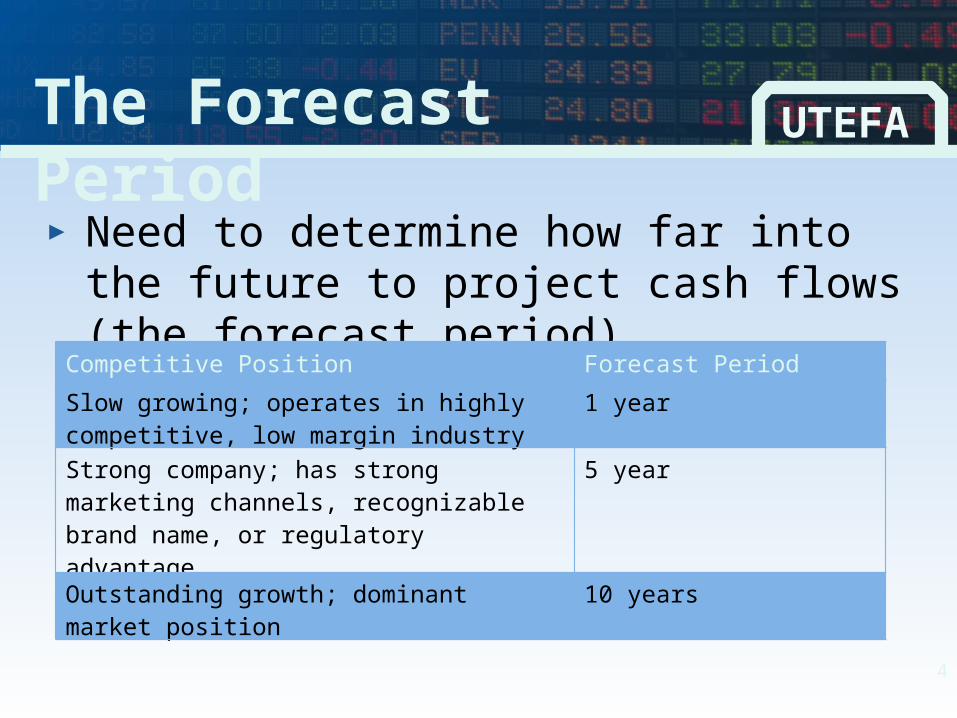
The Forecast Period
UTEFA
► Need to determine how far into the future to project cash flows (the forecast period)
Competitive Position Forecast Period
Slow growing; operates in highly competitive, low margin industry
1 year
Strong company; has strong marketing channels, recognizable brand name, or regulatory advantage
5 year
Outstanding growth; dominant market position 10 years
5
Revenue Growth Rate
UTEFA
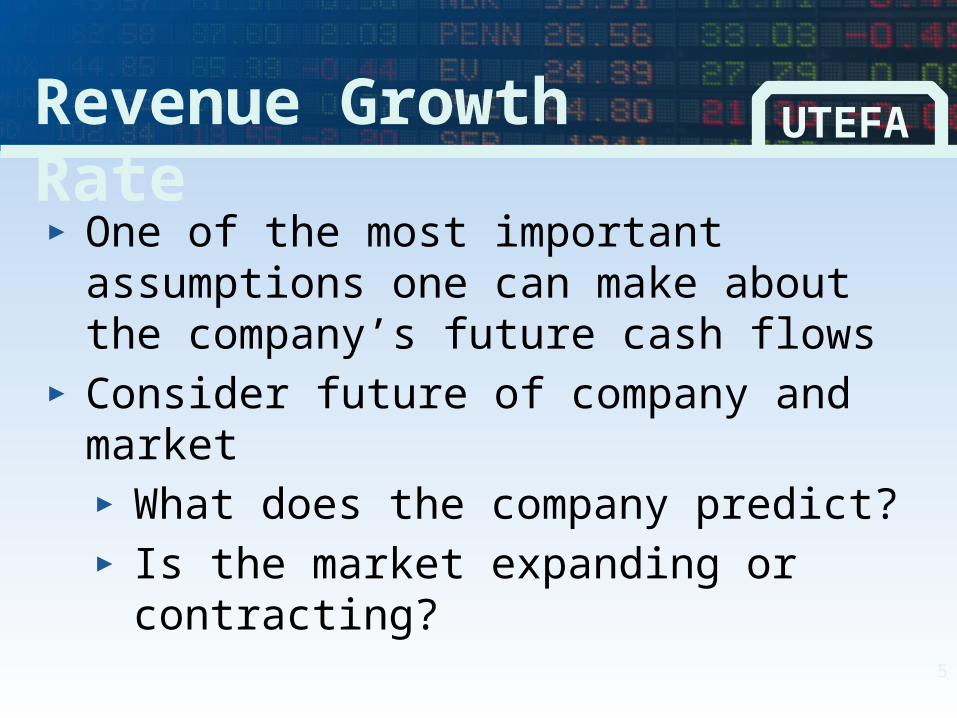
► One of the most important assumptions one can make about the company’s future cash flows
► Consider future of company and market► What does the company predict?► Is the market expanding or
contracting?
6
Example UTEFA
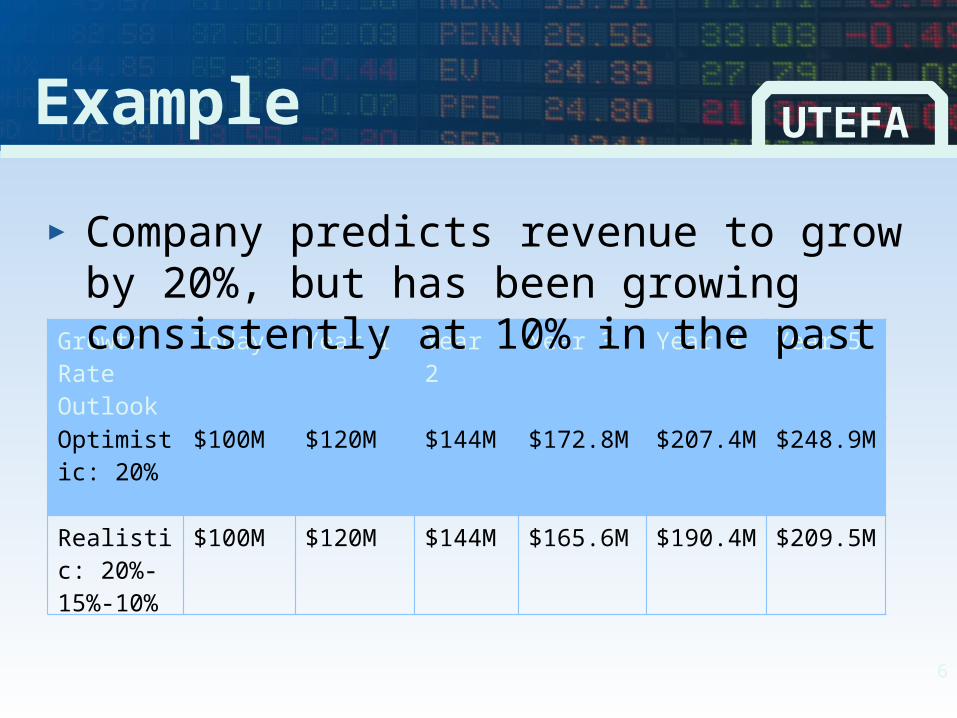
Growth Rate Outlook
Today Year 1 Year 2 Year 3 Year 4 Year 5
Optimistic: 20%
$100M $120M $144M $172.8M $207.4M $248.9M
Realistic: 20%-15%-10%
$100M $120M $144M $165.6M $190.4M $209.5M
► Company predicts revenue to grow by 20%, but has been growing consistently at 10% in the past
7
Free Cash Flow UTEFA
► The actual amount of cash a company has left from its operations to enhance shareholder value► Development of new products, or
paying dividends
8
Alternate Formula UTEFA
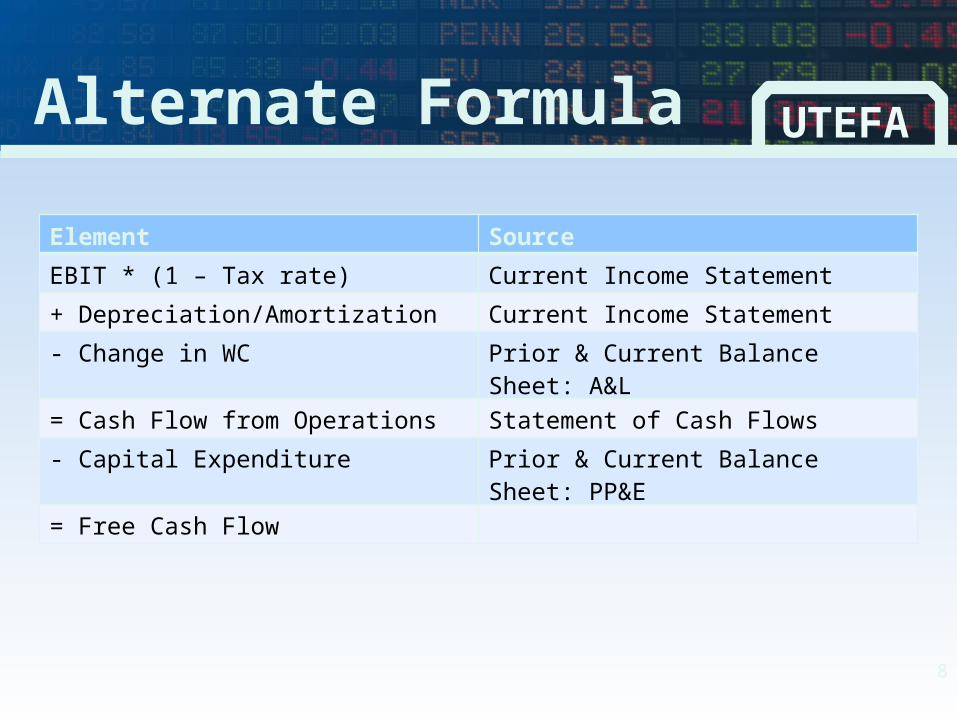
Element Source
EBIT * (1 – Tax rate) Current Income Statement
+ Depreciation/Amortization Current Income Statement
- Change in WC Prior & Current Balance Sheet: A&L
= Cash Flow from Operations Statement of Cash Flows
- Capital Expenditure Prior & Current Balance Sheet: PP&E
= Free Cash Flow
9
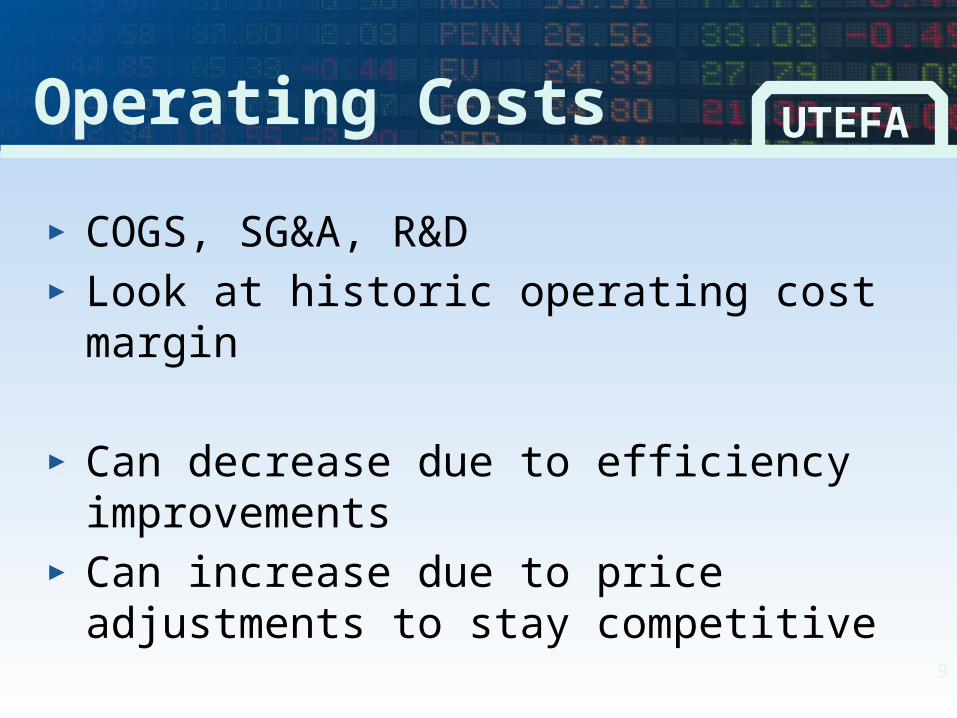
Operating Costs UTEFA
► COGS, SG&A, R&D► Look at historic operating cost margin
► Can decrease due to efficiency improvements
► Can increase due to price adjustments to stay competitive
10
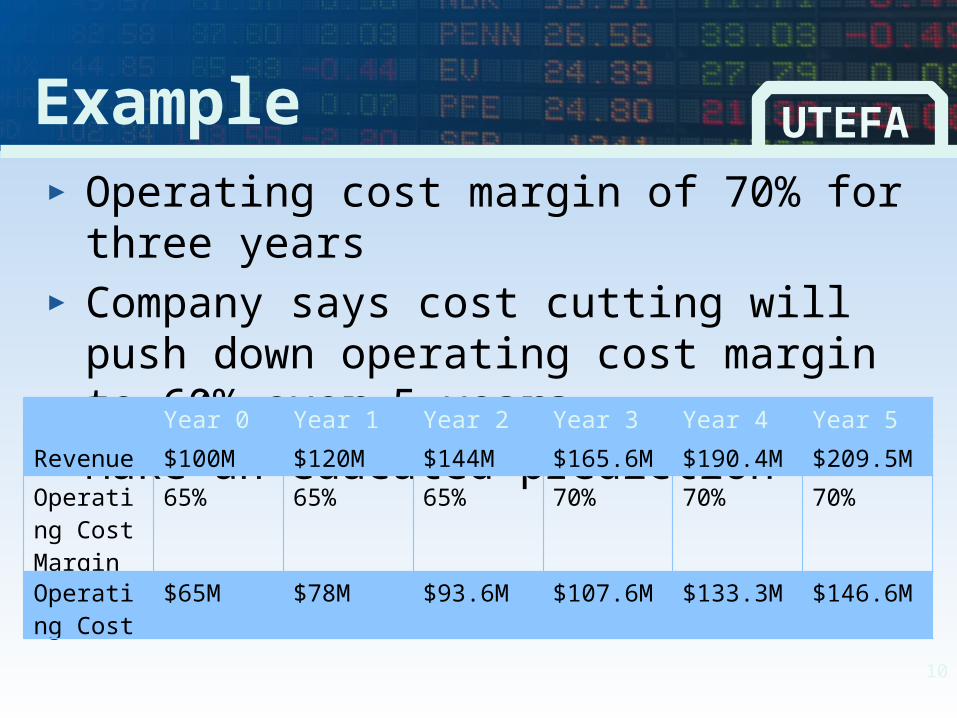
Example UTEFA
► Operating cost margin of 70% for three years
► Company says cost cutting will push down operating cost margin to 60% over 5 years
► Make an educated predictionYear 0 Year 1 Year 2 Year 3 Year 4 Year 5
Revenue $100M $120M $144M $165.6M $190.4M $209.5M
Operating Cost Margin
65% 65% 65% 70% 70% 70%
Operating Cost
$65M $78M $93.6M $107.6M $133.3M $146.6M
11
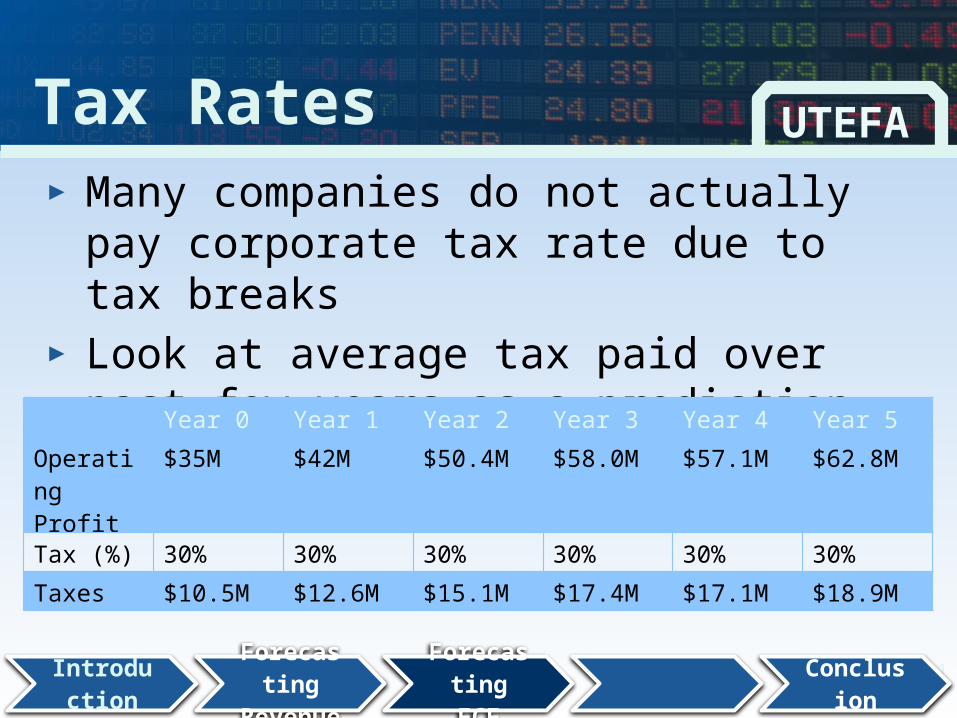
Tax Rates
Introduction
Forecasting
Revenue
Forecasting FCF
Conclusion
UTEFA
► Many companies do not actually pay corporate tax rate due to tax breaks
► Look at average tax paid over past few years as a prediction for future tax ratesYear 0 Year 1 Year 2 Year 3 Year 4 Year 5
Operating Profit
$35M $42M $50.4M $58.0M $57.1M $62.8M
Tax (%) 30% 30% 30% 30% 30% 30%
Taxes $10.5M $12.6M $15.1M $17.4M $17.1M $18.9M
12
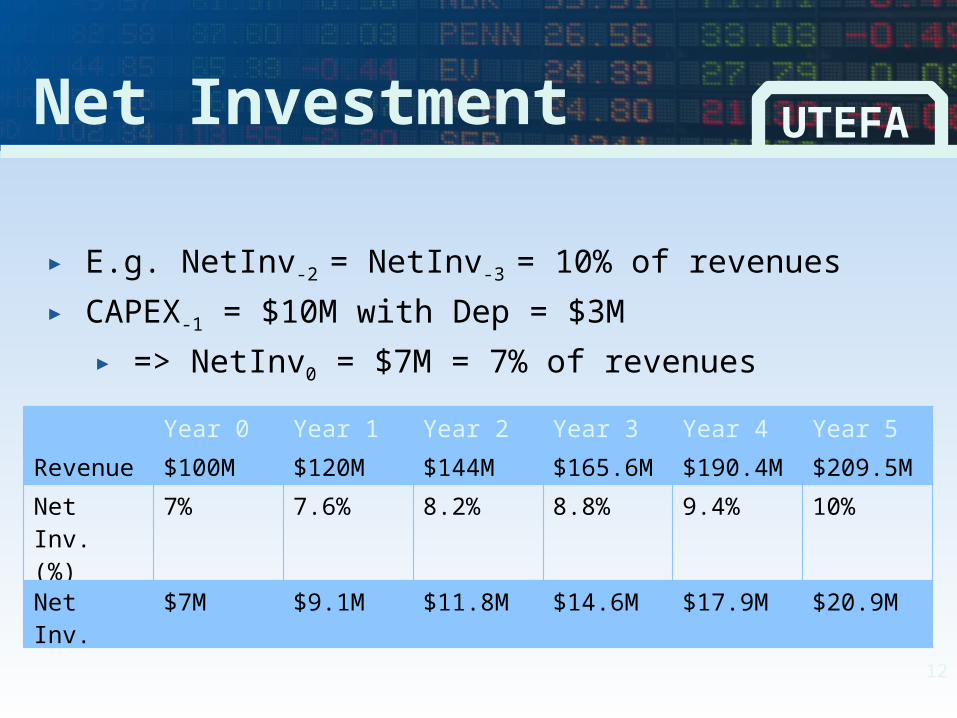
Net Investment UTEFA
► E.g. NetInv-2 = NetInv-3 = 10% of revenues► CAPEX-1 = $10M with Dep = $3M
► => NetInv0 = $7M = 7% of revenues
Year 0 Year 1 Year 2 Year 3 Year 4 Year 5
Revenue $100M $120M $144M $165.6M $190.4M $209.5M
Net Inv. (%)
7% 7.6% 8.2% 8.8% 9.4% 10%
Net Inv. $7M $9.1M $11.8M $14.6M $17.9M $20.9M
13
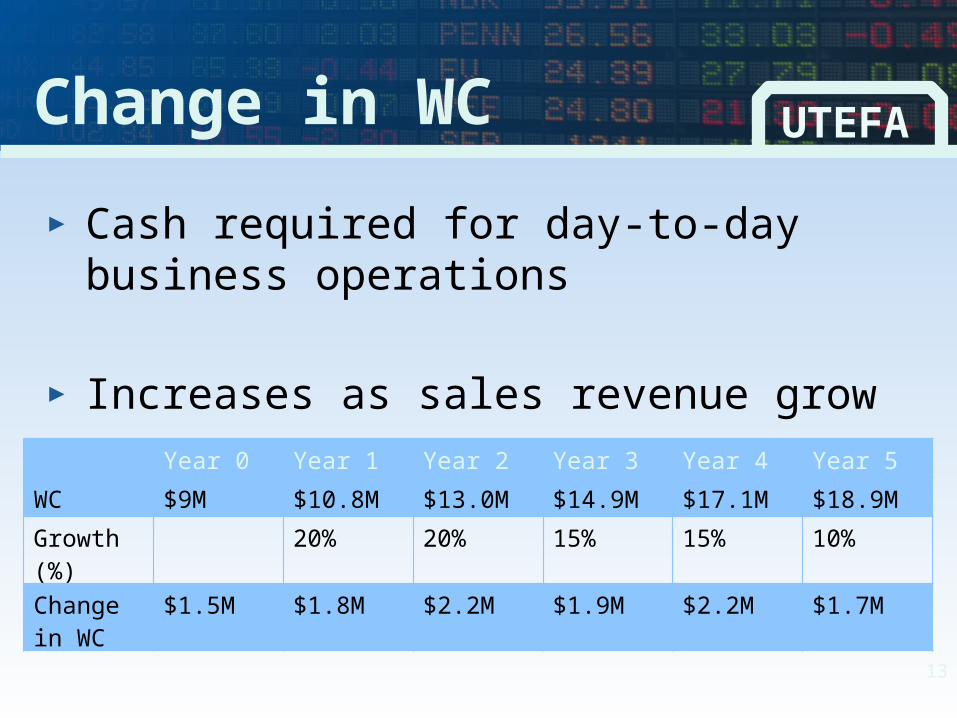
Change in WC UTEFA
► Cash required for day-to-day business operations
► Increases as sales revenue growYear 0 Year 1 Year 2 Year 3 Year 4 Year 5
WC $9M $10.8M $13.0M $14.9M $17.1M $18.9M
Growth (%)
20% 20% 15% 15% 10%
Change in WC
$1.5M $1.8M $2.2M $1.9M $2.2M $1.7M
14
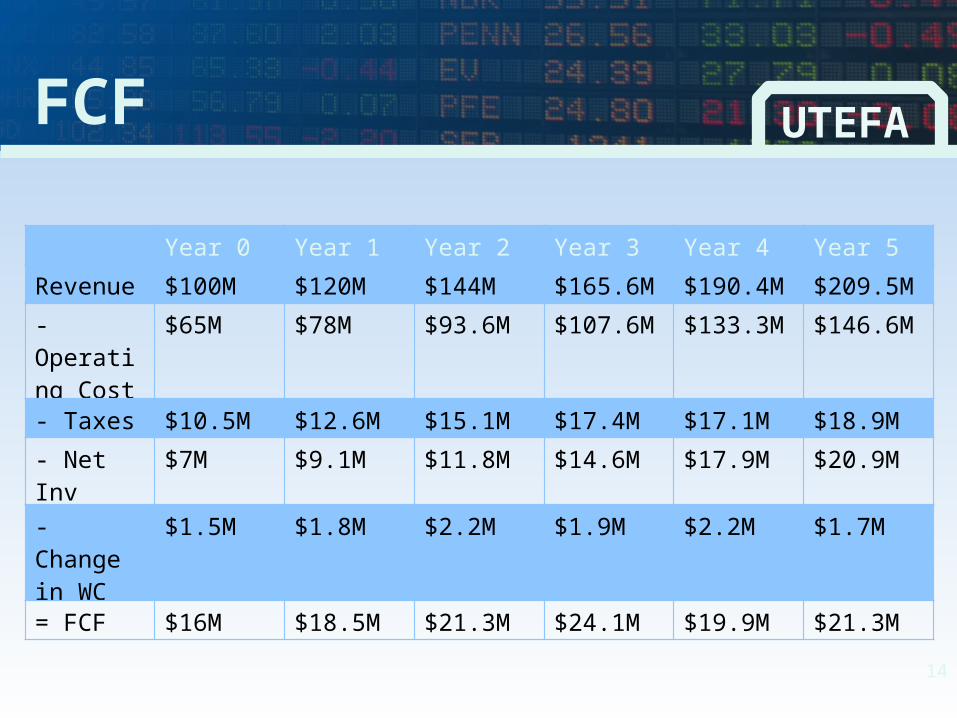
FCF UTEFA
Year 0 Year 1 Year 2 Year 3 Year 4 Year 5
Revenue $100M $120M $144M $165.6M $190.4M $209.5M
- Operating Cost
$65M $78M $93.6M $107.6M $133.3M $146.6M
- Taxes $10.5M $12.6M $15.1M $17.4M $17.1M $18.9M
- Net Inv $7M $9.1M $11.8M $14.6M $17.9M $20.9M
- Change in WC
$1.5M $1.8M $2.2M $1.9M $2.2M $1.7M
= FCF $16M $18.5M $21.3M $24.1M $19.9M $21.3M
15
Discount Rate UTEFA
► We need to discount the projected free cash flows to find out what they are worth today
► This discount rate is different for every company
► We discount the cash flows at the Weighted Average Cost of Capital (WACC)
16
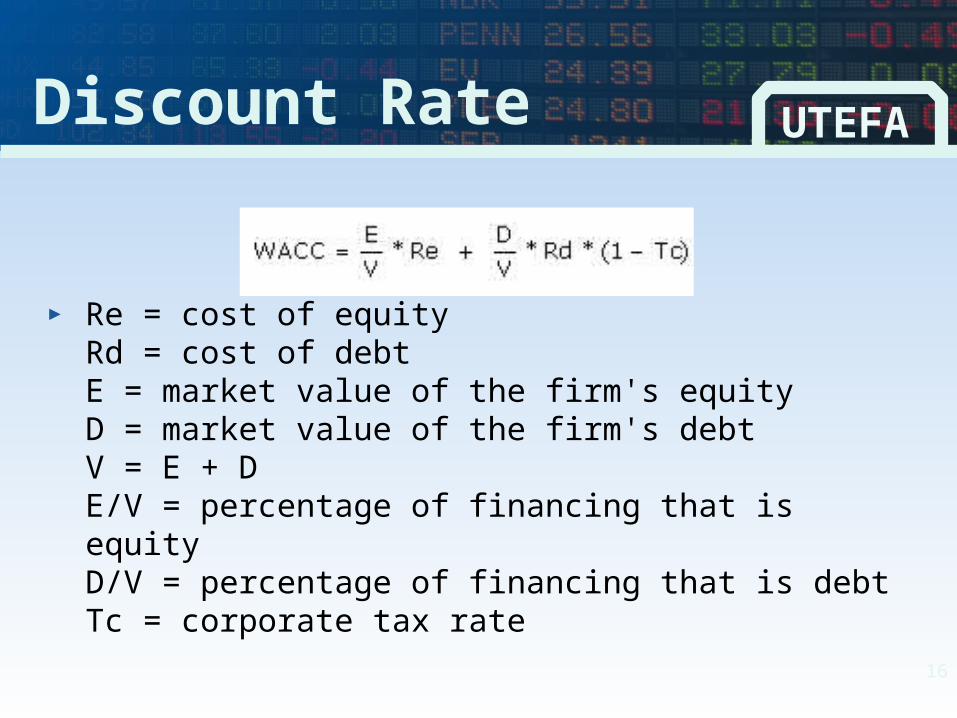
Discount Rate UTEFA
► Re = cost of equity Rd = cost of debt E = market value of the firm's equity D = market value of the firm's debt V = E + D E/V = percentage of financing that is equity D/V = percentage of financing that is debt Tc = corporate tax rate
17
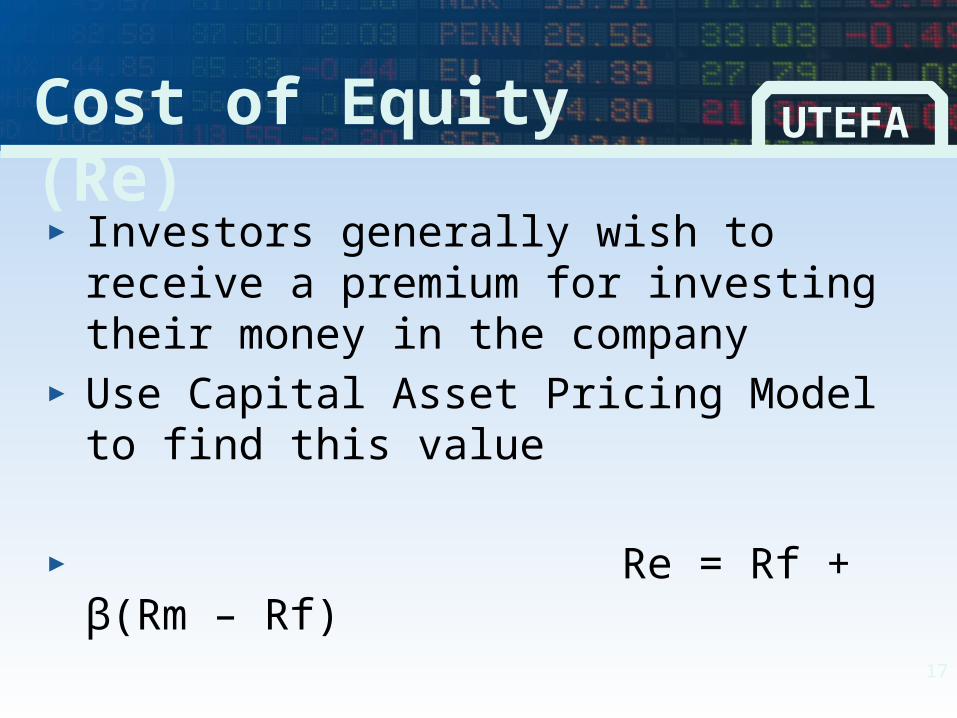
Cost of Equity (Re) UTEFA
► Investors generally wish to receive a premium for investing their money in the company
► Use Capital Asset Pricing Model to find this value
► Re = Rf + β(Rm – Rf)
18
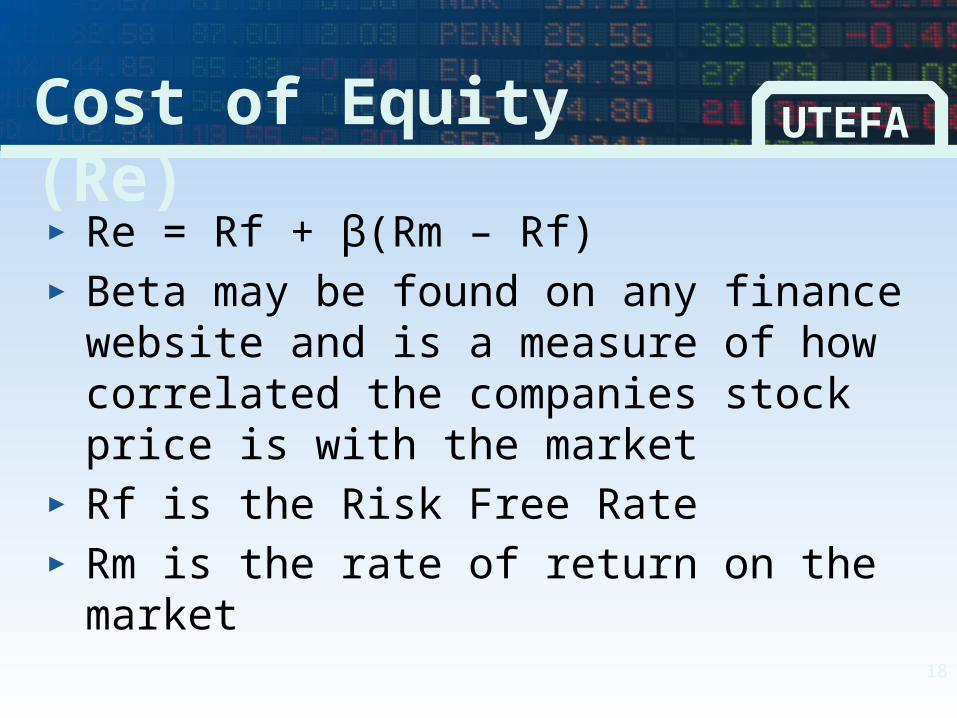
Cost of Equity (Re) UTEFA
► Re = Rf + β(Rm – Rf)► Beta may be found on any finance
website and is a measure of how correlated the companies stock price is with the market
► Rf is the Risk Free Rate► Rm is the rate of return on the market
19
Cost of Debt (Rd) UTEFA
► Rd may usually be found on a companies financial statements
► Tells the investor what rate the company borrows at
► If it is not in the financial statements, it may be estimated from similar companies
20
WACC UTEFA
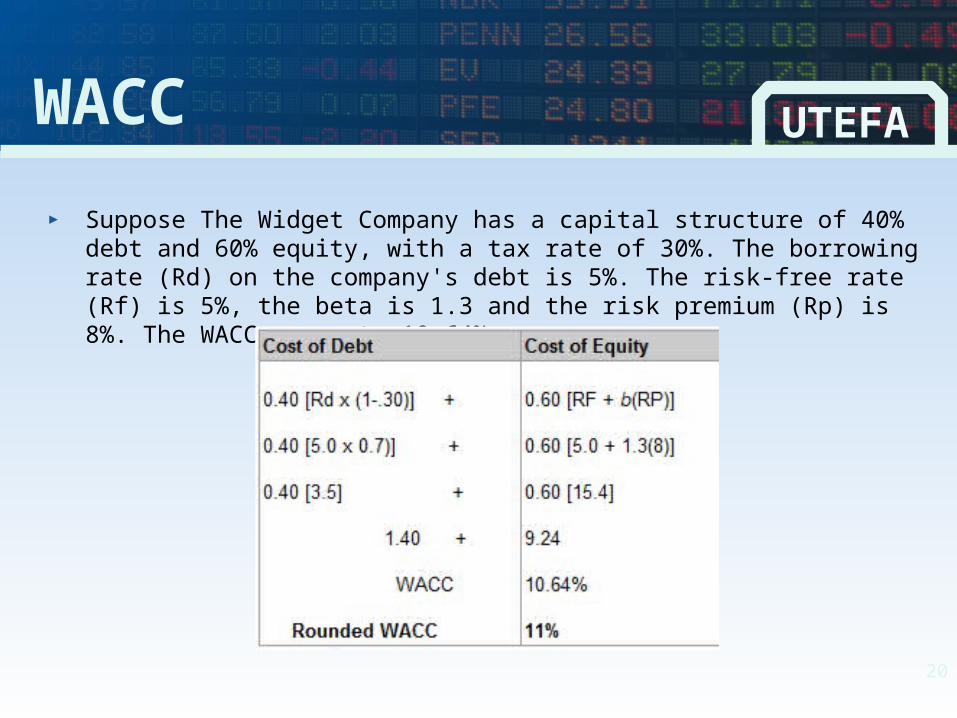
► Suppose The Widget Company has a capital structure of 40% debt and 60% equity, with a tax rate of 30%. The borrowing rate (Rd) on the company's debt is 5%. The risk-free rate (Rf) is 5%, the beta is 1.3 and the risk premium (Rp) is 8%. The WACC comes to 10.64%.
21
Terminal Value UTEFA
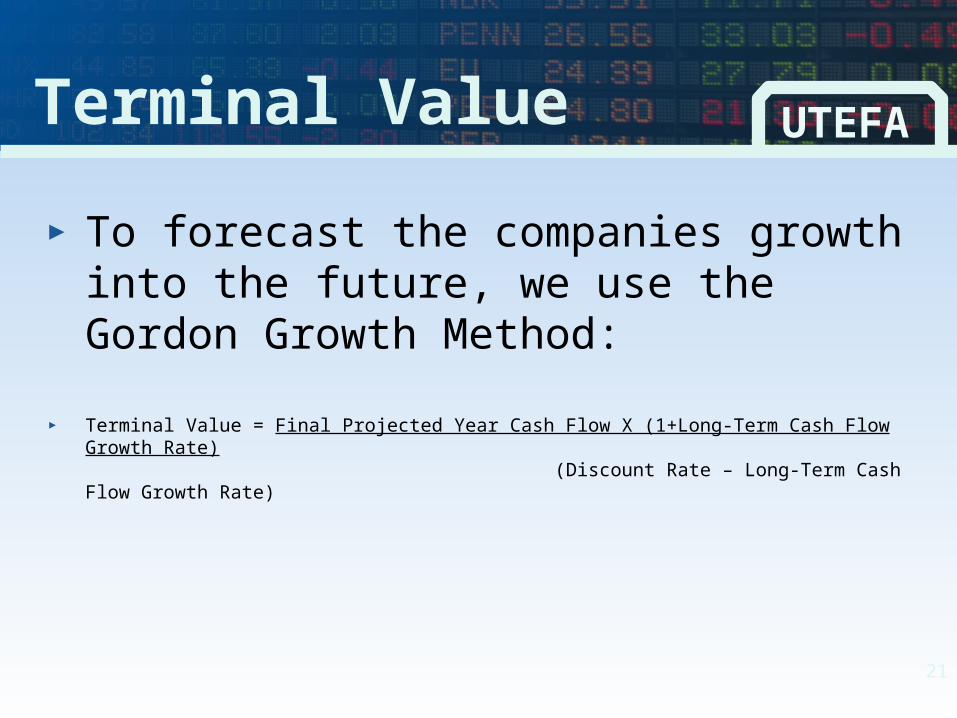
► To forecast the companies growth into the future, we use the Gordon Growth Method:
► Terminal Value = Final Projected Year Cash Flow X (1+Long-Term Cash Flow Growth Rate) (Discount Rate – Long-Term Cash Flow Growth Rate)
22
Terminal Value UTEFA
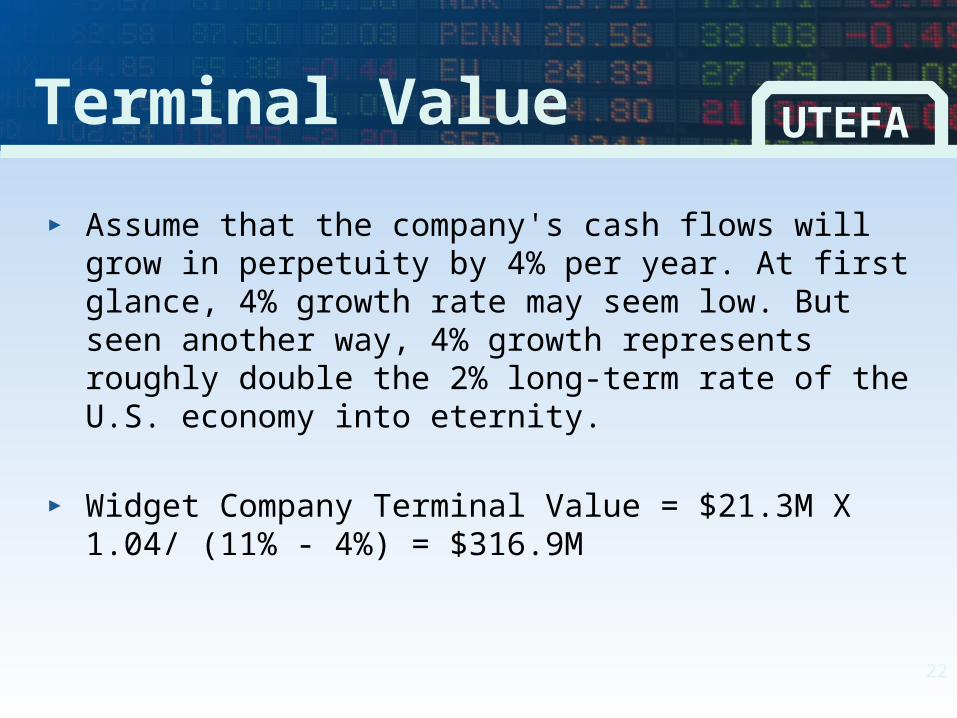
► Assume that the company's cash flows will grow in perpetuity by 4% per year. At first glance, 4% growth rate may seem low. But seen another way, 4% growth represents roughly double the 2% long-term rate of the U.S. economy into eternity.
► Widget Company Terminal Value = $21.3M X 1.04/ (11% - 4%) = $316.9M
23
Enterprise Value UTEFA
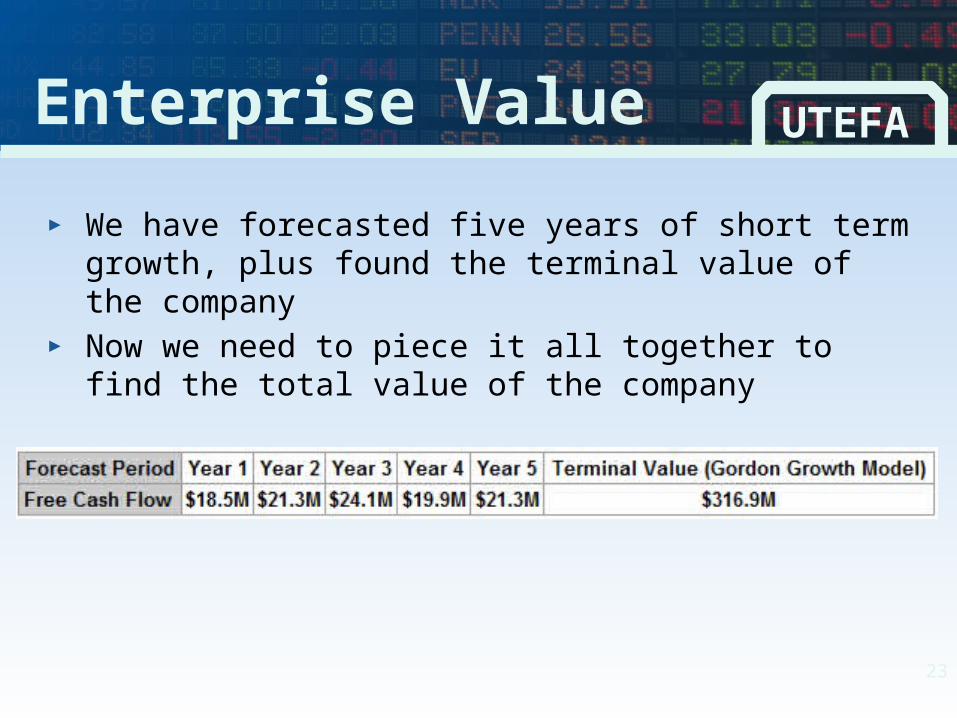
► We have forecasted five years of short term growth, plus found the terminal value of the company
► Now we need to piece it all together to find the total value of the company
24
Enterprise Value UTEFA
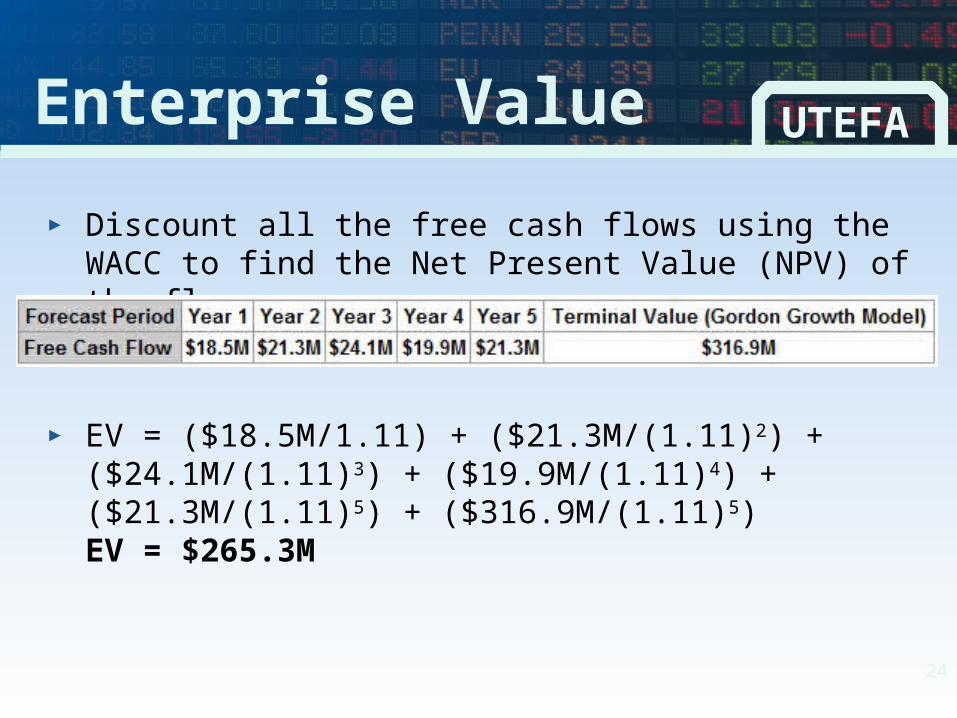
► Discount all the free cash flows using the WACC to find the Net Present Value (NPV) of the flows
► EV = ($18.5M/1.11) + ($21.3M/(1.11)2) + ($24.1M/(1.11)3) + ($19.9M/(1.11)4) + ($21.3M/(1.11)5) + ($316.9M/(1.11)5) EV = $265.3M
25
Fair Value UTEFA
► Need to account for the debt that a company has► As investors, we are only purchasing equity of a
company so we subtract the debt that the company has on its balance sheet
► Fair Value of Widget Company Equity = Enterprise Value – Debt
26
Fair Value UTEFA
► After we find the fair value for the company, divide that number by the amount of shares outstanding to find the share price
► Say the Widget Company had no debt, and 2 million shares outstanding:
► 265.3 M/2 M = 132.65$ per share fair value

27
Any Questions or Comments?


![Valuation and Discounted Cash Flow (DCF) Analysis … and Discounted Cash Flow (DCF) Analysis Case Study: Jazz Pharmaceuticals [JAZZ] Detailed Stock Pitch Note that this is a lengthy](https://static.documents.pub/doc/80x56/5aea3a637f8b9a90318b5be8/valuation-and-discounted-cash-flow-dcf-analysis-and-discounted-cash-flow-dcf.jpg)


