26
1 Q2 & H1 FY18 - Results Presentation DCM Shriram Ltd. Nov 7, 2017
1
Q2 & H1 FY18 - Results Presentation
DCM Shriram Ltd.
Nov 7, 2017

DCM Shriram Ltd. – Q2 & H1 FY18 Results Presentation
Safe Harbour
Certain statements in this document may be forward-looking statements. Such forward-looking
statements are subject to certain risks and uncertainties like government actions, local political or
economic developments, technological risks, and many other factors that could cause our actual
results to differ materially from those contemplated by the relevant forward looking statements.
DCM Shriram Ltd. will not be in any way responsible for any action taken based on such statements
and undertakes no obligation to publicly update these forward-looking statements to reflect
subsequent events or circumstances.
All figures are consolidated unless otherwise mentioned
2

DCM Shriram Ltd. – Q2 & H1 FY18 Results Presentation
Table of Content
3
Title Slide No.
Q2 FY18 Key Highlights 4
Q2 FY18 Financial Snapshot 5
Q2 FY18 Segment Performance 6
H1 FY18 Financial Snapshot 7
H1 FY18 Segment Performance 8
Q2 FY 18 Performance Overview & Outlook 9-11
Balance Sheet Abstract 12
Management’s Message 13
Chloro-Vinyl Businesses 15-17
Sugar 18
Agri Input Businesses 20-22
Other Businesses 24-25
About Us & Investor Contacts 26

DCM Shriram Ltd. – Q2 & H1 FY18 Results Presentation
1. Net Revenues at Rs 1,605 crore vs Rs 1,366 crore over same period last year:
a. Chemicals – Volumes were up 24% led by capacity from the expansion at Bharuch, commissioned in phases during
last year. Prices have also improved. The expanded capacity operating at 90%.
b. Sugar – Volumes were up 35% led by higher capacity utilisation in the last season
c. Shriram Farm Solutions and Hariyali (Fuel sales) witnessed decline in revenue
2. PBDIT stood at Rs 306 crores vs Rs.132 crore over same period last year:
a. Chemicals - Higher volumes and better margins led by higher prices.
b. Sugar – Led by higher volumes
c. Other businesses also performed better
4. PAT up by 88% YoY to Rs 172 crores. EPS for the quarter at Rs 10.6 up from Rs 5.6 in Q2 FY’17
5. Gross Debt as on Sep 30, 2017 stood at Rs. 673 crores vs. Rs 737 crore as on Sep 30, 2016. Cash and Cash
equivalents stood at Rs.717 crore vs Rs 30 crore for the same period.
6. Projects underway at investment of ~Rs. 350 crore - Sugar(Distillery) to be completed by Jan’18 and Chemicals (Kota
capacity expansion and Aluminum Chloride) to be completed by Q2 FY’19,
7. New Projects - The Board has approved following projects at a total investment of ~~Rs. 848 crore
a. Expansion of Sugar Capacity (5000 TCD) incl Distillery (100 KLD) and Co-gen (34 MW) at an investment of ~Rs. 500
crs. Sugar and Co-gen to be completed by Q3’ FY19 and Distillery by Q3’ FY20
b. New 66 MW Power plant at Kota in replacement of old 50 MW plants at an investment of ~Rs. 240 crs. Completion
by Q3’ FY’20
c. Capacity expansion of Chlor-Alkali at Kota (84 TPA) and Bharuch (146 TPA) at an investment of ~Rs. 98 crs.
Bharuch Expansion to be completed by Q1’FY ‘20 and Kota by Q2‘ FY’20
8. Dividend – The board has declared an interim dividend of 200% (LY: 110%) amounting to Rs 78.19 crores
Q2 FY’18 – Key Highlights
4
DCM Shriram Ltd. – Q2 & H1 FY18 Results Presentation 5
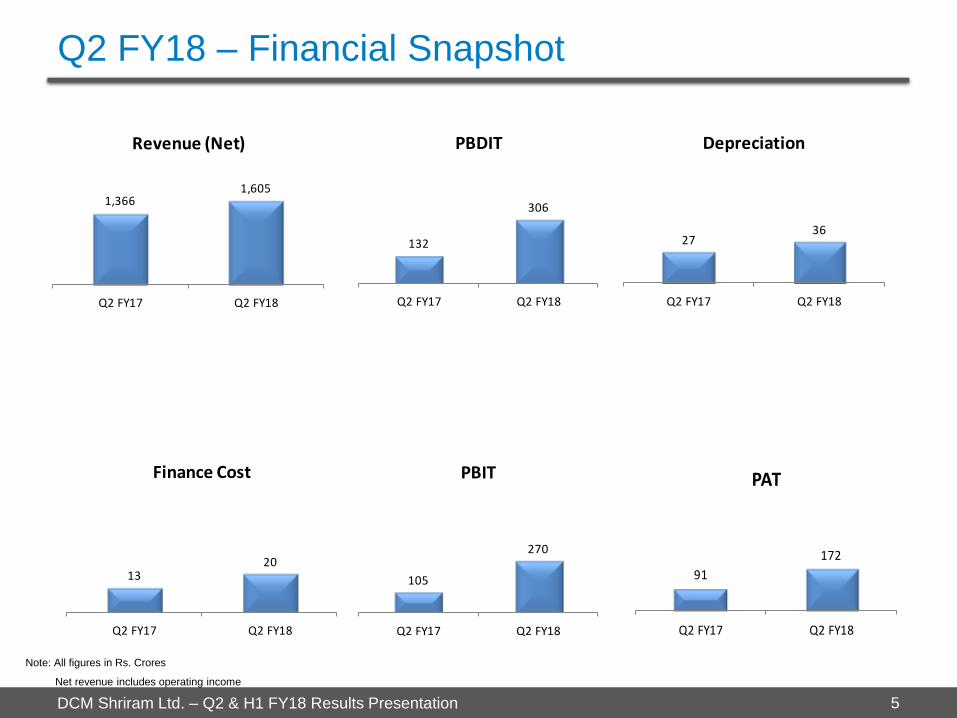
Note: All figures in Rs. Crores
Net revenue includes operating income
Q2 FY18 – Financial Snapshot
1,3661,605
Q2 FY17 Q2 FY18
Revenue (Net)
132
306
Q2 FY17 Q2 FY18
PBDIT
2736
Q2 FY17 Q2 FY18
Depreciation
1320
Q2 FY17 Q2 FY18
Finance Cost
105
270
Q2 FY17 Q2 FY18
PBIT
91
172
Q2 FY17 Q2 FY18
PAT
DCM Shriram Ltd. – Q2 & H1 FY18 Results Presentation
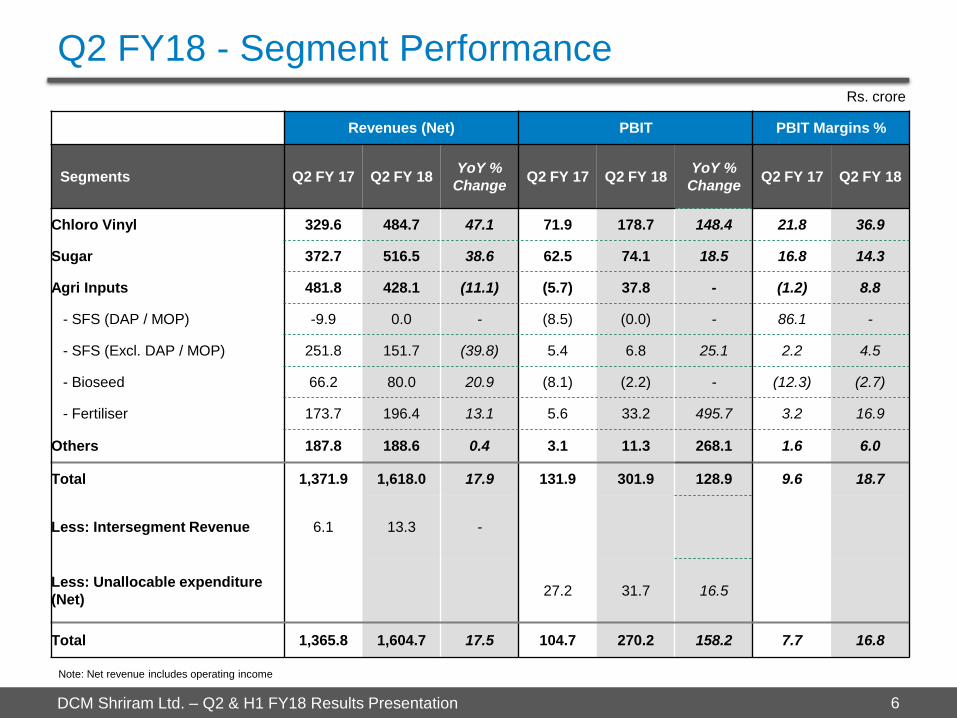
Rs. crore
Q2 FY18 - Segment Performance
6
Revenues (Net) PBIT PBIT Margins %
Segments Q2 FY 17 Q2 FY 18 YoY %
Change Q2 FY 17 Q2 FY 18
YoY %
Change Q2 FY 17 Q2 FY 18
Chloro Vinyl 329.6 484.7 47.1 71.9 178.7 148.4 21.8 36.9
Sugar 372.7 516.5 38.6 62.5 74.1 18.5 16.8 14.3
Agri Inputs 481.8 428.1 (11.1) (5.7) 37.8 - (1.2) 8.8
- SFS (DAP / MOP) -9.9 0.0 - (8.5) (0.0) - 86.1 -
- SFS (Excl. DAP / MOP) 251.8 151.7 (39.8) 5.4 6.8 25.1 2.2 4.5
- Bioseed 66.2 80.0 20.9 (8.1) (2.2) - (12.3) (2.7)
- Fertiliser 173.7 196.4 13.1 5.6 33.2 495.7 3.2 16.9
Others 187.8 188.6 0.4 3.1 11.3 268.1 1.6 6.0
Total 1,371.9 1,618.0 17.9 131.9 301.9 128.9 9.6 18.7
Less: Intersegment Revenue 6.1 13.3 -
Less: Unallocable expenditure
(Net) 27.2 31.7 16.5
Total 1,365.8 1,604.7 17.5 104.7 270.2 158.2 7.7 16.8
Note: Net revenue includes operating income
DCM Shriram Ltd. – Q2 & H1 FY18 Results Presentation 7
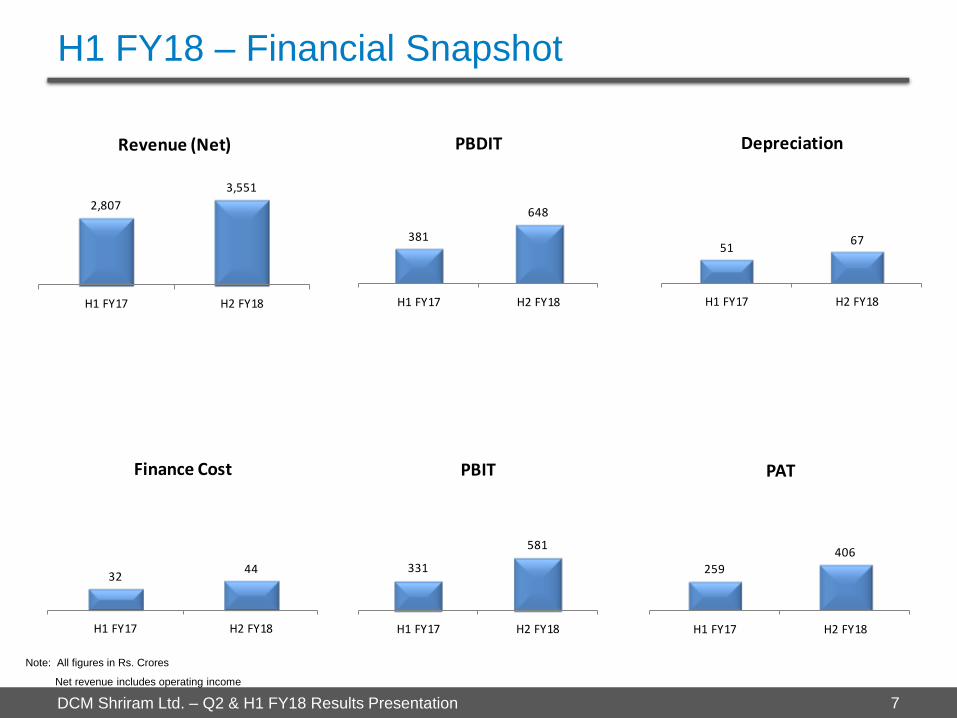
H1 FY18 – Financial Snapshot
2,807
3,551
H1 FY17 H2 FY18
Revenue (Net)
381
648
H1 FY17 H2 FY18
PBDIT
5167
H1 FY17 H2 FY18
Depreciation
3244
H1 FY17 H2 FY18
Finance Cost
331
581
H1 FY17 H2 FY18
PBIT
259
406
H1 FY17 H2 FY18
PAT
Note: All figures in Rs. Crores
Net revenue includes operating income
DCM Shriram Ltd. – Q2 & H1 FY18 Results Presentation
Rs. crore
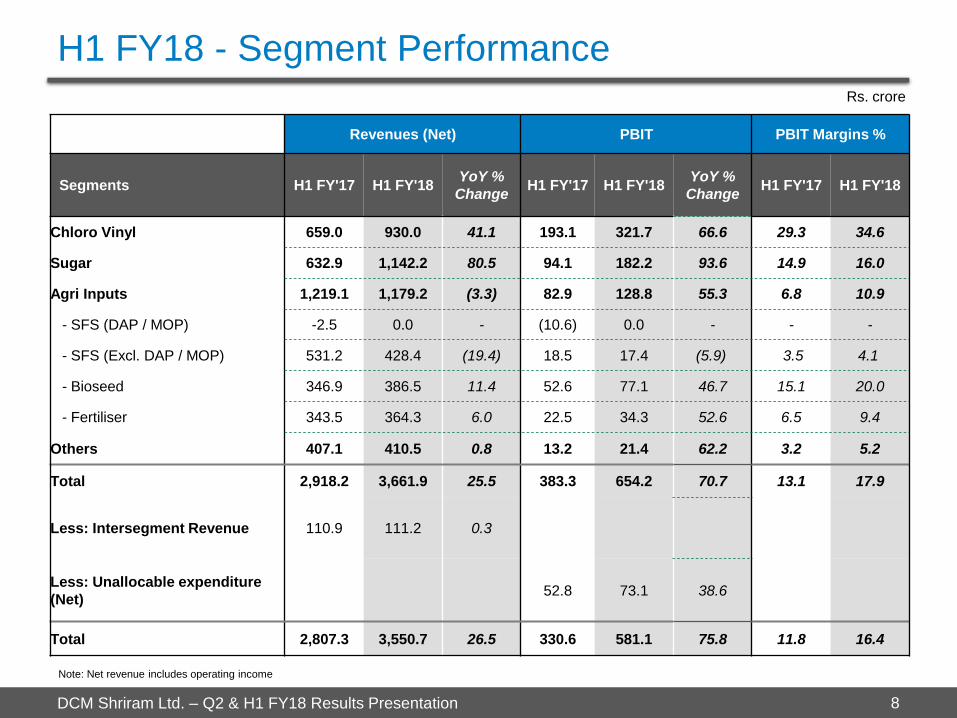
H1 FY18 - Segment Performance
8
Revenues (Net) PBIT PBIT Margins %
Segments H1 FY'17 H1 FY'18 YoY %
Change H1 FY'17 H1 FY'18
YoY %
Change H1 FY'17 H1 FY'18
Chloro Vinyl 659.0 930.0 41.1 193.1 321.7 66.6 29.3 34.6
Sugar 632.9 1,142.2 80.5 94.1 182.2 93.6 14.9 16.0
Agri Inputs 1,219.1 1,179.2 (3.3) 82.9 128.8 55.3 6.8 10.9
- SFS (DAP / MOP) -2.5 0.0 - (10.6) 0.0 - - -
- SFS (Excl. DAP / MOP) 531.2 428.4 (19.4) 18.5 17.4 (5.9) 3.5 4.1
- Bioseed 346.9 386.5 11.4 52.6 77.1 46.7 15.1 20.0
- Fertiliser 343.5 364.3 6.0 22.5 34.3 52.6 6.5 9.4
Others 407.1 410.5 0.8 13.2 21.4 62.2 3.2 5.2
Total 2,918.2 3,661.9 25.5 383.3 654.2 70.7 13.1 17.9
Less: Intersegment Revenue 110.9 111.2 0.3
Less: Unallocable expenditure
(Net) 52.8 73.1 38.6
Total 2,807.3 3,550.7 26.5 330.6 581.1 75.8 11.8 16.4
Note: Net revenue includes operating income

DCM Shriram Ltd. – Q2 & H1 FY18 Results Presentation
Q2 FY18 - Performance Overview & Outlook
9
Chloro-Vinyl
Net revenue was up 47% and earnings up 148%
Volumes at Bharuch Chemicals complex were up by 37%, a result of the capacity expansion project that
was part commissioned in Q2 FY17 (full in Q3 FY17). Plant is now operating at 90% capacity utilisation.
Chemical volumes at Kota are stable.
Chlor-Alkali prices have improved significantly over same period last year as well as sequentially
Vinyl (PVC) is stable
Input prices of Coal and Carbon material have risen over last year but are stable sequentially. Better
efficiencies and economies of scale post completion of the expansion projects have mitigated part of the
cost increases emanating from increase in Coal prices.
Outlook
We expect to sustain / improve on ~90% capacity utilization achieved by end of Q2 FY’18, at Bharuch.
With global energy prices rising, the Coal and Carbon material costs may start rising again.
Projects underway - Expansion at Kota and Aluminum Chloride at Bharuch, are progressing as per plan.
New projects: 146 TPA capacity at Bharuch to come on-stream by Q1 FY 20 and 84 TPA capacity at
Kota to come onstream by Q3 FY’20.
Net revenue was up 39% and earnings up 18%
Volumes during the quarter were up 35%, a result of higher capacity utilisation in Sugar season
2016-17 at 46.4 lac quintals vs 31.3 lac quintals for previous season.
Outlook
Current season has started and all our mills have started crushing
The 150 KLD Distillery project at Hariawan underway unit is progressing as per schedule and will be
commissioned by Jan’18
To take advantage of improving Cane availability and Industry fundamentals, Board has approved
expansion at Hariawan unit, with an investment of ~Rs. 500 crs.
Sugar Capacity (5000 TCD) and Co-gen (34 MW) - to be completed by 3rd Quarter FY’19
Distillery (100 KLD) – to be completed by 3rd Quarter FY’20
Sugar

DCM Shriram Ltd. – Q2 & H1 FY18 Results Presentation 10
Net revenue was lower by 37%, earnings were positive vs loss last year
Net revenue were lower in Value added business by about 24% and in SSP 54% . Earnings were
marginally better.
Last year there was a loss in the same period due to discount passed on Channel inventory of MOP in
line with price reduction announced by the government.
Outlook
The growth in this business is expected to remain muted in the near term
Shriram Farm Solutions
Bioseed
Net revenue was up 21% and losses lower during the quarter
India - Q2 is an off-season for this business in India. Net revenues were up 33% at Rs. 58 crs. lead by
cotton and corn, leading to lower losses
International - Net revenue stable at Rs. 22 crore. Losses declined with improving margins
Outlook
International business expected to further improve performance
Company working towards research led expansion of its crop portfolio and product offerings, to provide
stability and growth over medium term
Q2 FY18 - Performance Overview & Outlook
DCM Shriram Ltd. – Q2 & H1 FY18 Results Presentation 11
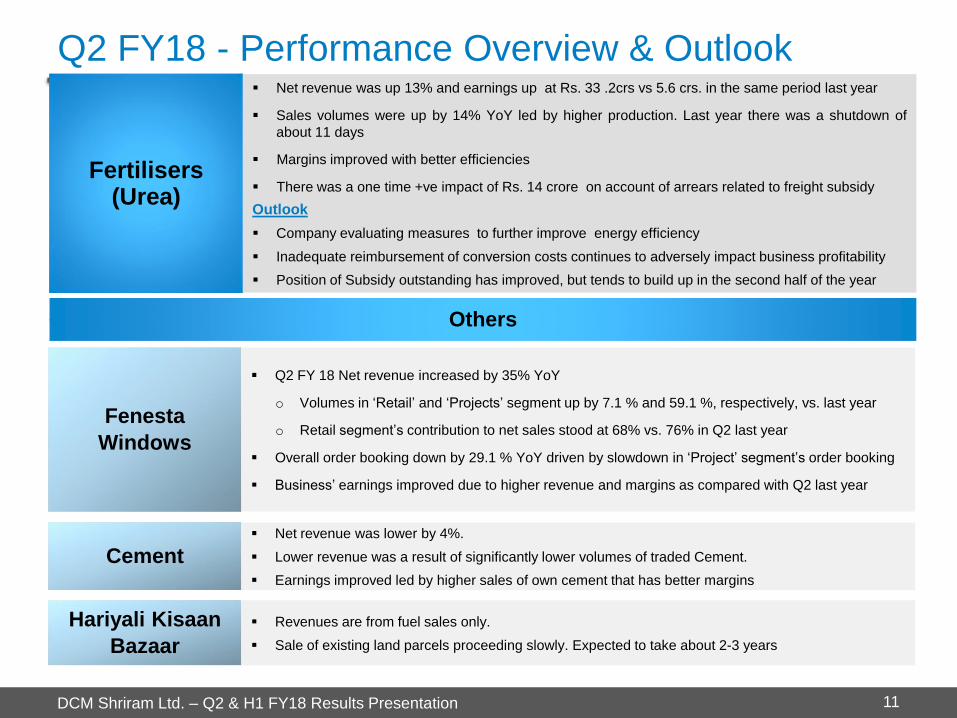
Fertilisers (Urea)
Net revenue was up 13% and earnings up at Rs. 33 .2crs vs 5.6 crs. in the same period last year
Sales volumes were up by 14% YoY led by higher production. Last year there was a shutdown of
about 11 days
Margins improved with better efficiencies
There was a one time +ve impact of Rs. 14 crore on account of arrears related to freight subsidy
Outlook
Company evaluating measures to further improve energy efficiency
Inadequate reimbursement of conversion costs continues to adversely impact business profitability
Position of Subsidy outstanding has improved, but tends to build up in the second half of the year
Q2 FY 18 Net revenue increased by 35% YoY
o Volumes in ‘Retail’ and ‘Projects’ segment up by 7.1 % and 59.1 %, respectively, vs. last year
o Retail segment’s contribution to net sales stood at 68% vs. 76% in Q2 last year
Overall order booking down by 29.1 % YoY driven by slowdown in ‘Project’ segment’s order booking
Business’ earnings improved due to higher revenue and margins as compared with Q2 last year
Fenesta
Windows
Others
Revenues are from fuel sales only.
Sale of existing land parcels proceeding slowly. Expected to take about 2-3 years
Hariyali Kisaan
Bazaar
Q2 FY18 - Performance Overview & Outlook
Net revenue was lower by 4%.
Lower revenue was a result of significantly lower volumes of traded Cement.
Earnings improved led by higher sales of own cement that has better margins
Cement

DCM Shriram Ltd. – Q2 & H1 FY18 Results Presentation 12
Balance Sheet Abstract (Rs. cr.)
Net Worth increased to Rs.
2,915 crores as on Sep 30,
2017 up from Rs. 2,528
crore as on March 31, 2017
Gross Debt at Rs.673 crore
vs. Rs 1074 crore as on
Mar 31, 2017
Gross Debt to Equity at
0.23x as on Sep 30, 2017
vs. 0.42x as on March 31,
2017
PARTICULARS As at As at
30.09.2017 31.03.2017
Unaudited Audited
ASSETS
Non-current assets
(a) Property, Plant and equipment 1,900.04 1,922.63
(b) Capital work -in- progress 131.42 60.28
(c) Goodwill 70.99 70.55
(d) Other Intangible assets 32.21 32.85
(e) Financial assets 77.42 84.15
(f) Deferred tax assets (net) 63.96 80.11
(g) Other non-current assets 92.09 65.98
Total- Non-current assets 2,368.13 2,316.55
Current assets
(a) Inventories 772.73 1,615.67
(b) Financial assets
(i) Trade receivables 942.78 1,004.46
(ii) Cash and cash equivalents 749.56 203.71
(v) Other financial assets 50.89 37.87
(c) Other current assets 240.95 272.79
Total Current assets 2,756.91 3,134.50
Assets classified as held for sale 113.43 122.83
TOTAL- ASSETS 5,238.47 5,573.88
EQUITY AND LIABILITIES
EQUITY
(a) Equity Share capital 32.64 32.64
(b) Other Equity 2,881.97 2,495.09
Equity attributable to shareholders of the company 2,914.61 2,527.73
Non-controlling Interest 2.25 2.08
Total Equity 2,916.86 2,529.81
LIABILITIES
Non-current liabilities
(a) Financial Liabilities
(i) Borrowings 442.46 472.20
(ii) Other financial liabilities 2.59 4.02
(b) Provisions 198.18 183.65
(c) Other non-current liabilities 0.88 0.92
Total- Non-current liabilities 644.11 660.79
Current liabilities
(a) Financial Liabilities
(i) Borrowings 140.97 508.29
(ii) Trade payables 919.72 1,146.45
(iii) Other financial liabilities 198.57 224.23
(b) Other current liabilities 409.41 496.06
Total Current liabilities 1,668.67 2,375.03
Liabilities associated with assets classified as held for sale 8.83 8.25
Total- Liabilities 2,321.61 3,044.07
TOTAL- EQUITY AND LIABILITIES 5,238.47 5,573.88

DCM Shriram Ltd. – Q2 & H1 FY18 Results Presentation
Management’s Message
Commenting on the performance for the quarter and financial year, in a joint statement, Mr. Ajay Shriram,
Chairman & Senior Managing Director, and Mr. Vikram Shriram, Vice Chairman & Managing Director, said:
“We are happy to report a satisfactory performance for the quarter. All our business reported better operating performance.
The investments undertaken over last few years for expansion of capacity and cost optimisation also contributed to better
performance.
We are implementing projects involving investments of Rs. 350 crores for setting up 150 KLD Distillery, expansion of Chlor-
alkali and setting up Aluminum chloride business. These will be commissioned by Q2 FY’19.
We are undertaking additional investments of ~Rs. 850 crore for capacity expansion as well as cost optimisation in our
Chemicals and Sugar business including upgradation and expansion of captive Power plant at Kota. These projects will be
commissioned during November’18 to September’19.
We are also taking steps to achieve sustained growth of Bioseed, Fenesta and Farm Solutions business over the medium
term.
With our strong Balance Sheet and healthy cash accruals, we are confident of delivering healthy growth over medium term.
13

DCM Shriram Ltd. – Q2 & H1 FY18 Results Presentation
Chloro-Vinyl
Businesses
Agri
Businesses
Other Businesses
• Chemicals
• PVC Resins
• Calcium carbide
• Power
• Agri- Inputs
o Shriram Farm Solutions
o Bioseeds
o Fertilisers
• Sugar
Segmental Overview
14
• Fenesta Building Systems
• Cement
• Polymer Compounds
• Hariyali Kisaan Bazaar

DCM Shriram Ltd. – Q2 & H1 FY18 Results Presentation
Chloro Vinyl Business
15
The Chloro-Vinyl business of the Company has highly integrated operations with multiple revenue streams and 143 MW captive power
generation facilities. Chemicals operations are at two locations (Kota – Rajasthan and Bharuch – Gujarat), while Vinyl is at Kota only.
The multiple revenue streams enable the Company to optimize operations in a manner to maximize the contribution per unit of power .
Particulars Revenues (Net)
(Rs. cr.) PBIT (Rs. cr.)
Cap. Employed
(Rs. cr.)
Q2 FY18 484.7 178.7 1,038.7
Q2 FY17 329.6 71.9 947.8
% Shift 47.1 148.4 9.6
H1 FY18 930.0 321.7 1,038.7
H1 FY17 659.0 193.1 947.8
% Shift 41.1 66.6 9.6
DCM Shriram Ltd. – Q2 & H1 FY18 Results Presentation
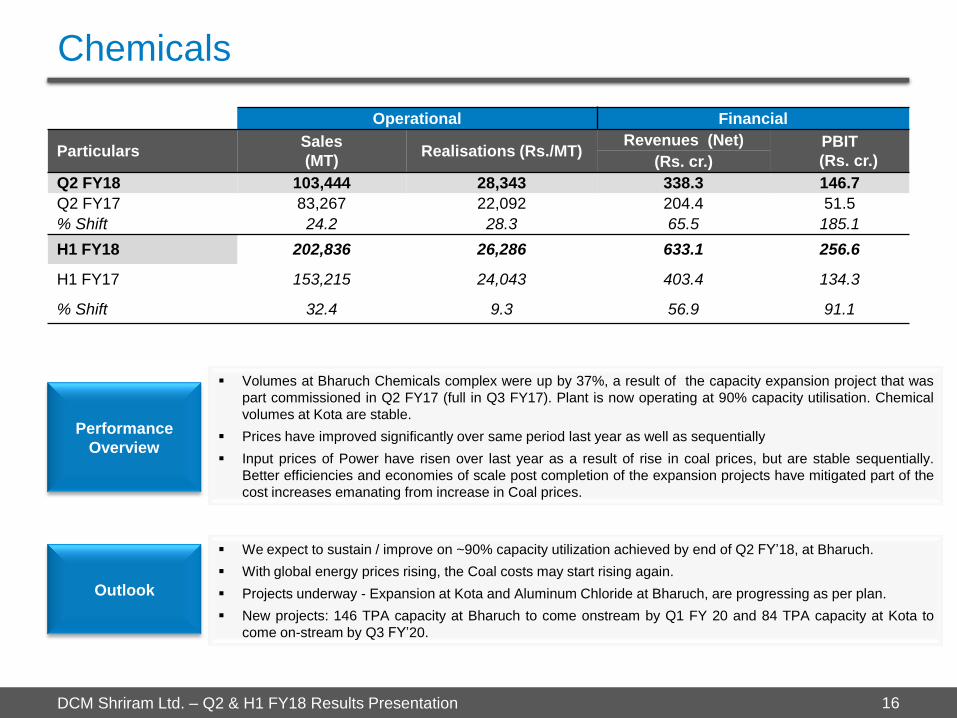
Chemicals
16
Performance
Overview
Outlook
Volumes at Bharuch Chemicals complex were up by 37%, a result of the capacity expansion project that was
part commissioned in Q2 FY17 (full in Q3 FY17). Plant is now operating at 90% capacity utilisation. Chemical
volumes at Kota are stable.
Prices have improved significantly over same period last year as well as sequentially
Input prices of Power have risen over last year as a result of rise in coal prices, but are stable sequentially.
Better efficiencies and economies of scale post completion of the expansion projects have mitigated part of the
cost increases emanating from increase in Coal prices.
We expect to sustain / improve on ~90% capacity utilization achieved by end of Q2 FY’18, at Bharuch.
With global energy prices rising, the Coal costs may start rising again.
Projects underway - Expansion at Kota and Aluminum Chloride at Bharuch, are progressing as per plan.
New projects: 146 TPA capacity at Bharuch to come onstream by Q1 FY 20 and 84 TPA capacity at Kota to
come on-stream by Q3 FY’20.
Operational Financial
Particulars Sales
(MT) Realisations (Rs./MT)
Revenues (Net) PBIT
(Rs. cr.) (Rs. cr.)
Q2 FY18 103,444 28,343 338.3 146.7
Q2 FY17 83,267 22,092 204.4 51.5
% Shift 24.2 28.3 65.5 185.1
H1 FY18 202,836 26,286 633.1 256.6
H1 FY17 153,215 24,043 403.4 134.3
% Shift 32.4 9.3 56.9 91.1

DCM Shriram Ltd. – Q2 & H1 FY18 Results Presentation
Plastics
17
Performance
Overview
Outlook
Volumes were higher led by higher production
Realisations are stable
Costs of Carbon material has been rising. Coal costs have risen YoY, however are stable QoQ
Domestic Prices will follow global price trends
Coal and Carbon material prices may further rise in line with rising energy prices led by crude
Company continues to work on improving cost efficiencies to mitigate the impact of rising input costs
and maintain reasonable margins on a sustained basis
Operational Financial
Particulars PVC Sales
(MT)
PVC XWR
Realisations
(Rs./MT)
Carbide Sales
(MT)
Carbide XWR
Realisations
(Rs./MT)
Revenues
(Net) PBIT
(Rs. cr.) (Rs. cr.)
Q2 FY18 15,744 69,795 8,032 43,787 146.4 32.0
Q2 FY17 14,260 69,636 5,705 41,257 125.2 20.5
% Shift 10.4 0.2 40.8 6.1 16.9 56.3
H1 FY18 31,627 71,469 14,805 44,216 296.8 65.1
H1 FY17 29,709 68,811 10,742 43,037 255.6 58.8
% Shift 6.5 3.9 37.8 2.7 16.1 10.8
DCM Shriram Ltd. – Q2 & H1 FY18 Results Presentation
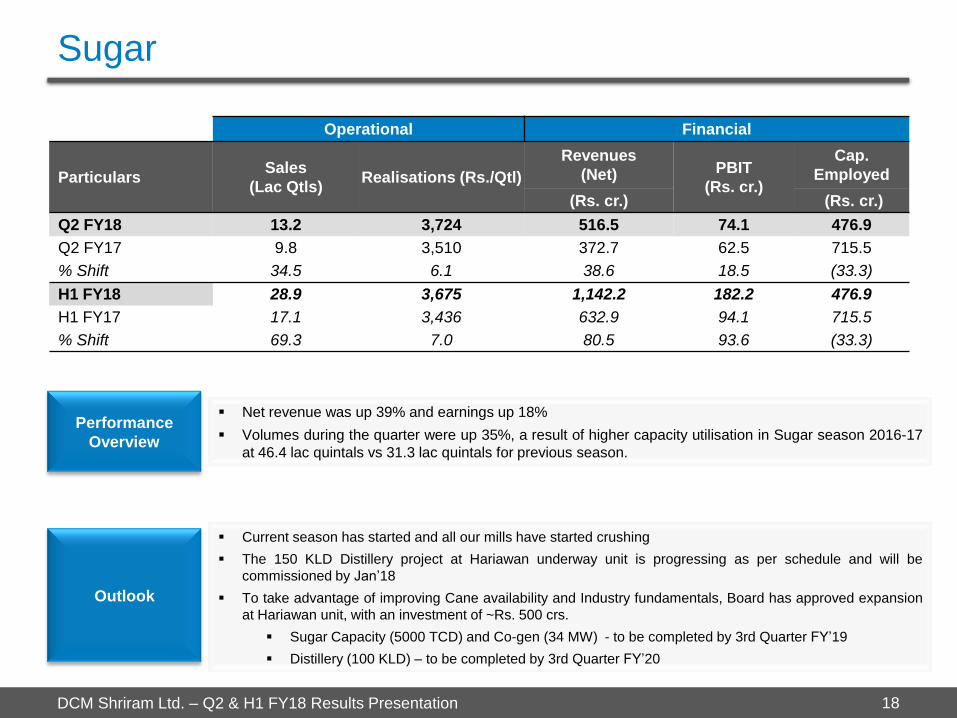
Sugar
18
Performance
Overview
Outlook
Net revenue was up 39% and earnings up 18%
Volumes during the quarter were up 35%, a result of higher capacity utilisation in Sugar season 2016-17
at 46.4 lac quintals vs 31.3 lac quintals for previous season.
Current season has started and all our mills have started crushing
The 150 KLD Distillery project at Hariawan underway unit is progressing as per schedule and will be
commissioned by Jan’18
To take advantage of improving Cane availability and Industry fundamentals, Board has approved expansion
at Hariawan unit, with an investment of ~Rs. 500 crs.
Sugar Capacity (5000 TCD) and Co-gen (34 MW) - to be completed by 3rd Quarter FY’19
Distillery (100 KLD) – to be completed by 3rd Quarter FY’20
Operational Financial
Particulars Sales
(Lac Qtls) Realisations (Rs./Qtl)
Revenues
(Net) PBIT
(Rs. cr.)
Cap.
Employed
(Rs. cr.) (Rs. cr.)
Q2 FY18 13.2 3,724 516.5 74.1 476.9
Q2 FY17 9.8 3,510 372.7 62.5 715.5
% Shift 34.5 6.1 38.6 18.5 (33.3)
H1 FY18 28.9 3,675 1,142.2 182.2 476.9
H1 FY17 17.1 3,436 632.9 94.1 715.5
% Shift 69.3 7.0 80.5 93.6 (33.3)

DCM Shriram Ltd. – Q2 & H1 FY18 Results Presentation
The Agri input businesses contributed to 27% of the Company’s revenues during Q2 FY 18. The
Company continues to focus on these businesses given the huge opportunity in this area where the
Company can capitalize on its long standing understanding of varied Agri businesses and the rural
consumer; its established infrastructure; services & product portfolio; and a deep rural presence. The
Agri Input Business includes:
Agri- Input Businesses
Shriram Farm Solutions
Bioseed
Fertiliser (Urea)
19
DCM Shriram Ltd. – Q2 & H1 FY18 Results Presentation
Shriram Farm Solutions
20
Performance
Overview
Outlook
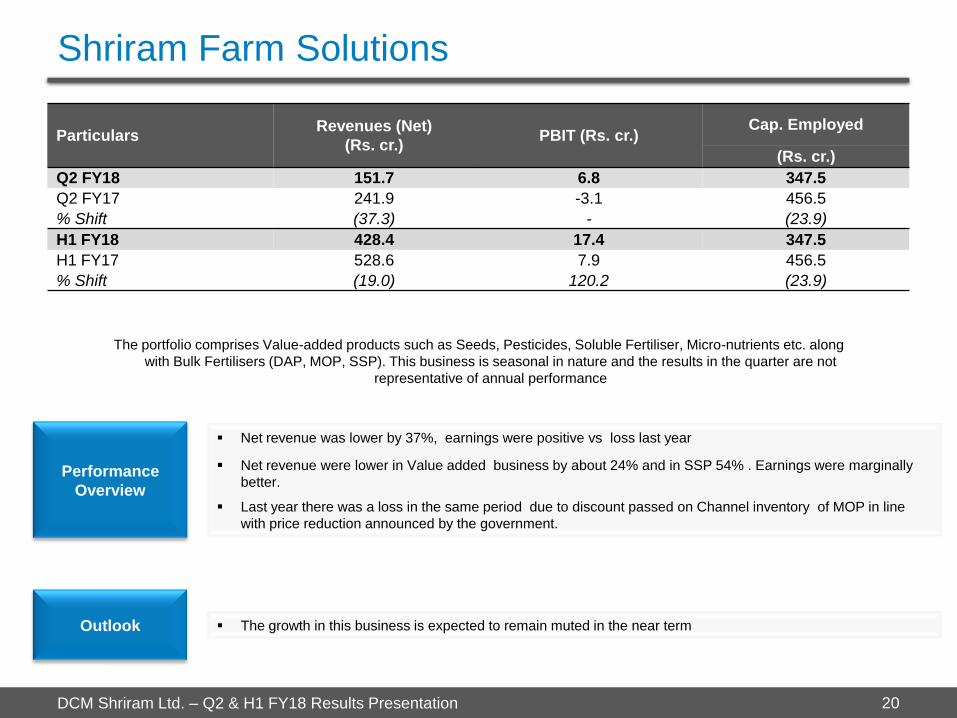
The portfolio comprises Value-added products such as Seeds, Pesticides, Soluble Fertiliser, Micro-nutrients etc. along
with Bulk Fertilisers (DAP, MOP, SSP). This business is seasonal in nature and the results in the quarter are not
representative of annual performance
Net revenue was lower by 37%, earnings were positive vs loss last year
Net revenue were lower in Value added business by about 24% and in SSP 54% . Earnings were marginally
better.
Last year there was a loss in the same period due to discount passed on Channel inventory of MOP in line
with price reduction announced by the government.
The growth in this business is expected to remain muted in the near term
Particulars Revenues (Net)
(Rs. cr.) PBIT (Rs. cr.)
Cap. Employed
(Rs. cr.)
Q2 FY18 151.7 6.8 347.5
Q2 FY17 241.9 -3.1 456.5
% Shift (37.3) - (23.9)
H1 FY18 428.4 17.4 347.5
H1 FY17 528.6 7.9 456.5
% Shift (19.0) 120.2 (23.9)
DCM Shriram Ltd. – Q2 & H1 FY18 Results Presentation
Bioseed
21
Performance
Overview
Outlook
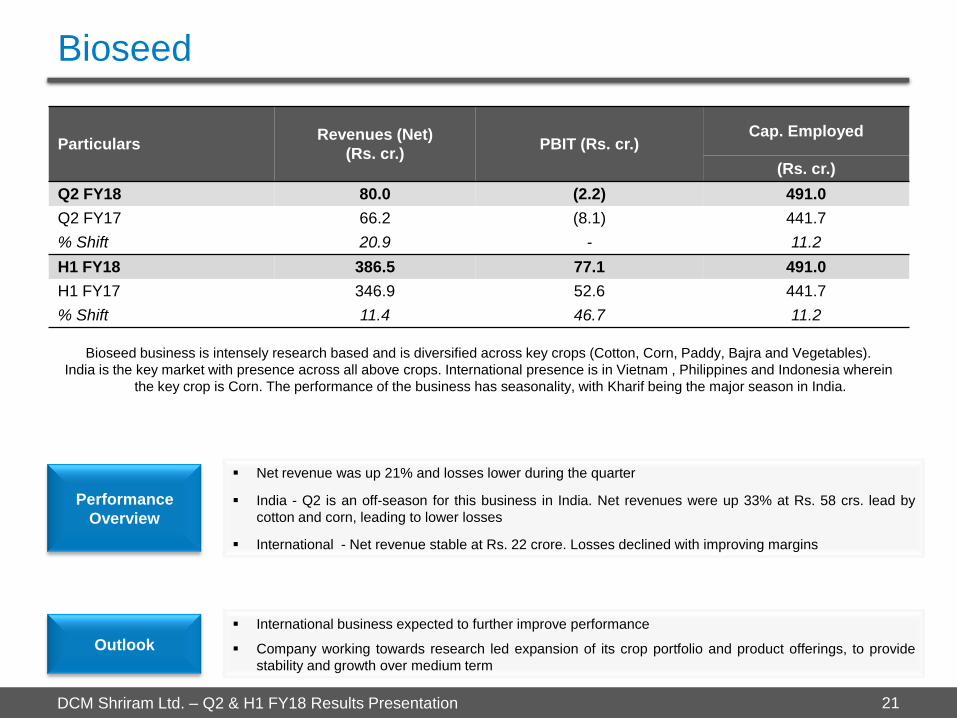
Bioseed business is intensely research based and is diversified across key crops (Cotton, Corn, Paddy, Bajra and Vegetables).
India is the key market with presence across all above crops. International presence is in Vietnam , Philippines and Indonesia wherein
the key crop is Corn. The performance of the business has seasonality, with Kharif being the major season in India.
Net revenue was up 21% and losses lower during the quarter
India - Q2 is an off-season for this business in India. Net revenues were up 33% at Rs. 58 crs. lead by
cotton and corn, leading to lower losses
International - Net revenue stable at Rs. 22 crore. Losses declined with improving margins
International business expected to further improve performance
Company working towards research led expansion of its crop portfolio and product offerings, to provide
stability and growth over medium term
Particulars Revenues (Net)
(Rs. cr.) PBIT (Rs. cr.)
Cap. Employed
(Rs. cr.)
Q2 FY18 80.0 (2.2) 491.0
Q2 FY17 66.2 (8.1) 441.7
% Shift 20.9 - 11.2
H1 FY18 386.5 77.1 491.0
H1 FY17 346.9 52.6 441.7
% Shift 11.4 46.7 11.2
DCM Shriram Ltd. – Q2 & H1 FY18 Results Presentation
Fertilisers (Urea)
22
Performance
Overview
Outlook
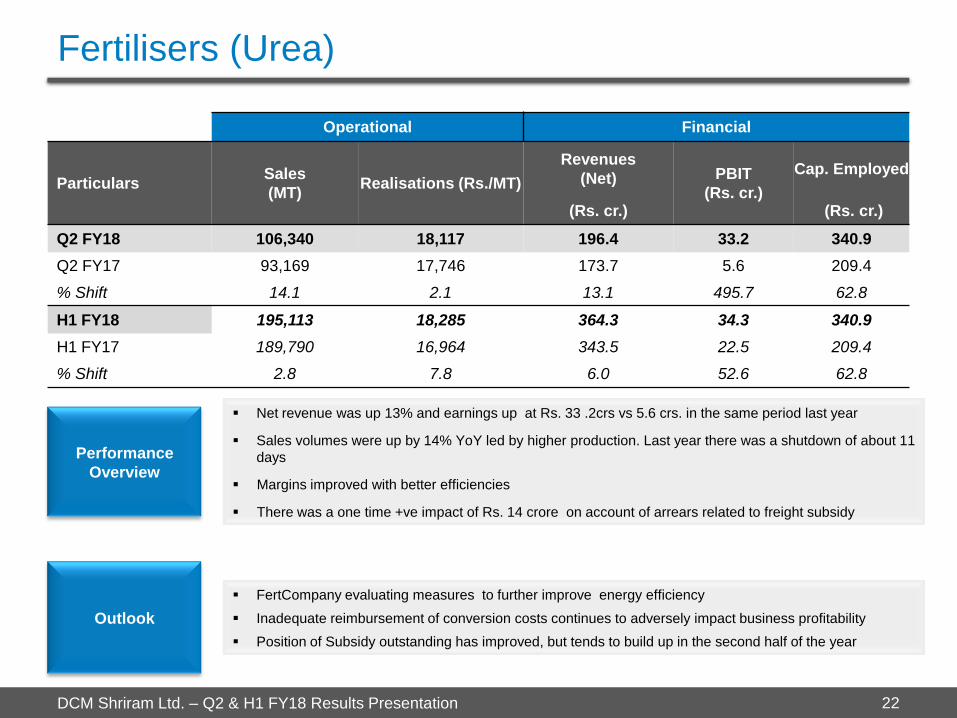
Net revenue was up 13% and earnings up at Rs. 33 .2crs vs 5.6 crs. in the same period last year
Sales volumes were up by 14% YoY led by higher production. Last year there was a shutdown of about 11
days
Margins improved with better efficiencies
There was a one time +ve impact of Rs. 14 crore on account of arrears related to freight subsidy
FertCompany evaluating measures to further improve energy efficiency
Inadequate reimbursement of conversion costs continues to adversely impact business profitability
Position of Subsidy outstanding has improved, but tends to build up in the second half of the year
Operational Financial
Particulars Sales
(MT) Realisations (Rs./MT)
Revenues
(Net) PBIT
(Rs. cr.)
Cap. Employed
(Rs. cr.) (Rs. cr.)
Q2 FY18 106,340 18,117 196.4 33.2 340.9
Q2 FY17 93,169 17,746 173.7 5.6 209.4
% Shift 14.1 2.1 13.1 495.7 62.8
H1 FY18 195,113 18,285 364.3 34.3 340.9
H1 FY17 189,790 16,964 343.5 22.5 209.4
% Shift 2.8 7.8 6.0 52.6 62.8

DCM Shriram Ltd. – Q2 & H1 FY18 Results Presentation
Other Businesses
23
DCM Shriram’s other operations, reported as ‘Others’ in the financial results, include its businesses of Cement, Fenesta
Building Systems and Hariyali Kisaan Bazar.
Revenues under ‘Others’ stood at Rs 189 crores in the quarter under review compared to Rs. 188 crores in Q2 FY 17.
PBIT for the quarter stood at Rs. 11.3 crores vis-à-vis Rs. 3.1 crores in Q2 FY 17.

DCM Shriram Ltd. – Q2 & H1 FY18 Results Presentation
Fenesta Building Systems
24
Performance
Overview
Fenesta a pan India brand has become synonymous with UPVC windows. Includes Retail and Project Segment
Outlook
Q2 FY 18 Net revenue increased by 35% YoY
o Volumes in ‘Retail’ and ‘Projects’ segment up by 7.1 % and 59.1 %, respectively, vs. last year
o Retail segment’s contribution to net sales stood at 68% vs. 76% in Q2 last year
Overall order booking down by 29.1 % YoY driven by slowdown in ‘Project’ segment’s order booking
Business’ earnings improved due to higher revenue and margins as compared with Q2 last year
In ‘Retail’, our strategic focus area is to provide exceptional customer experience along with enhancing
sales volumes and offering comprehensive product portfolio
In ‘Projects’ our focus is on establishing relationship with key accounts and continue to achieve profitable
growth
Improvement in the overall economic scenario and uptick in the real estate sector will enable higher
penetration of our UPVC window offerings
Operational Financial
Particulars Order Book Revenues (Net)
(Rs cr.) (Rs. cr.)
Q2 FY18 94.0 85.1
Q2 FY17 132.1 62.9
% Shift (28.8) 35.3
H1 FY18 170.4 162.3
H1 FY17 213.7 123.2
% Shift (20.3) 31.7
DCM Shriram Ltd. – Q2 & H1 FY18 Results Presentation
Cement
25
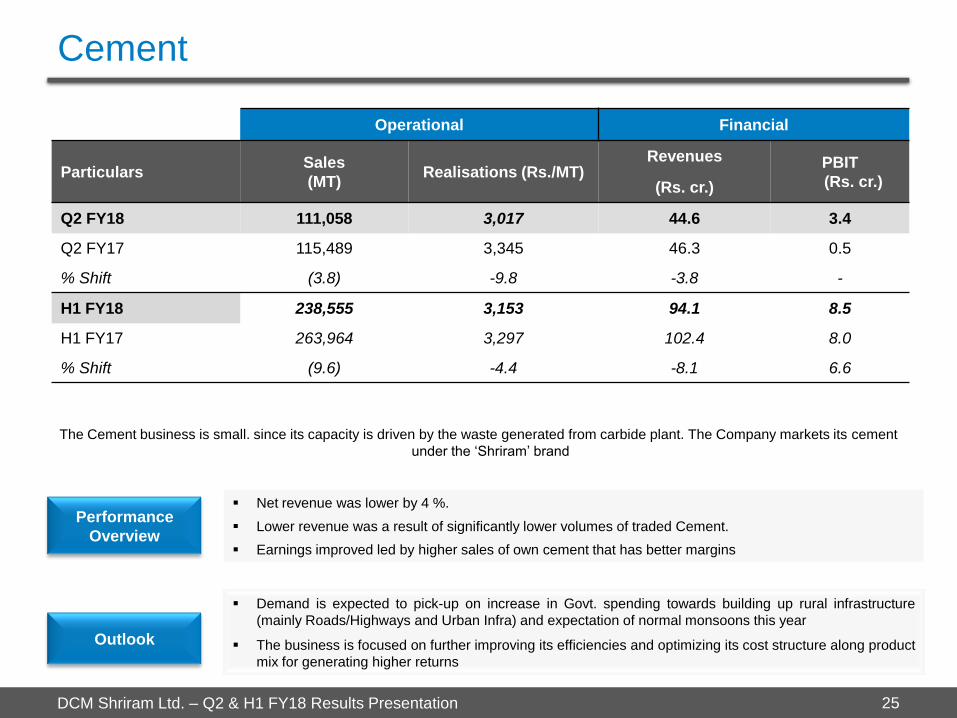
The Cement business is small. since its capacity is driven by the waste generated from carbide plant. The Company markets its cement
under the ‘Shriram’ brand
Performance
Overview
Outlook
Net revenue was lower by 4 %.
Lower revenue was a result of significantly lower volumes of traded Cement.
Earnings improved led by higher sales of own cement that has better margins
Demand is expected to pick-up on increase in Govt. spending towards building up rural infrastructure
(mainly Roads/Highways and Urban Infra) and expectation of normal monsoons this year
The business is focused on further improving its efficiencies and optimizing its cost structure along product
mix for generating higher returns
Operational Financial
Particulars Sales
(MT) Realisations (Rs./MT)
Revenues PBIT
(Rs. cr.) (Rs. cr.)
Q2 FY18 111,058 3,017 44.6 3.4
Q2 FY17 115,489 3,345 46.3 0.5
% Shift (3.8) -9.8 -3.8 -
H1 FY18 238,555 3,153 94.1 8.5
H1 FY17 263,964 3,297 102.4 8.0
% Shift (9.6) -4.4 -8.1 6.6

DCM Shriram Ltd. – Q2 & H1 FY18 Results Presentation
DCM Shriram Ltd. is an integrated business entity, with extensive and growing presence across the
entire Agri value chain and Chloro-Vinyl industry. The Company has added innovative value- added
businesses in these domains primarily Bioseed and Fenesta. Access to captive power at all key
manufacturing units enables the businesses to optimise competitive edge.
For more information on the Company, its products and services please log on to
www.dcmshriram.com or contact:
Amit Agarwal Siddharth Rangnekar / Shikha Kshirsagar
DCM Shriram Ltd. CDR India
Tel: +91 11 4210 0200 Tel: +91 22 6645 1209/43
Fax: +91 11 2372 0325 Fax: 91 22 6645 1213
Email: [email protected] Email: [email protected] /
About Us & Investor Contacts
26


