D P evelopmnet iscussion olicy aper IDE C D D D D D D D D D D D D D P P P P P P P P P P P P P P 2 Series Vol. No. Department of Development Policy Division of Development Science Graduate School for International Development and Cooperation (IDEC) Hiroshima University 1-5-1 Kagamiyama, Higashi-Hiroshima 739-8529 JAPAN 3 2 Assessing Inequalities in Thai Education Jirada Prasartpornsirichoke and Yoshi Takahashi March, 2013
Transcript
DP
evelopmnetiscussion
olicyaper
IDEC DDDDDDDDDDDDDPPPPPPPPPPPPPP2 Series Vol. No.
Department of Development PolicyDivision of Development ScienceGraduate School for International Development and Cooperation (IDEC)Hiroshima University1-5-1 Kagamiyama, Higashi-Hiroshima 739-8529 JAPAN
3 2
Assessing Inequalities in Thai Education
Jirada Prasartpornsirichoke and Yoshi Takahashi
March, 2013
1
Assessing Inequalities in Thai Education
Jirada Prasartpornsirichoke1 and Yoshi Takahashi2
Abstract
Using data from Thailand’s Household Socioeconomic Survey, this paper measures the inequalities of Thai education in 2011. We utilize the Gini coefficients to estimate Thai educational inequalities from cumulative years of educational attainment which are between zero (no schooling) to 21 (doctoral level) years (totally 22 levels of educational attainment). The education Gini coefficient of the whole country is 0.349. At the provincial level, the Gini coefficients are in a range between 0.272 (Nonthaburi) and 0.521 (Mae hong son). The provinces located near the Bangkok metropolis have greater equality in education, except for Samut Sakhon, while the provinces in the northern part of Thailand have severe inequality in education, especially the border provinces. As for the effect of schooling on educational inequality, we found that at the regional level, average years of schooling was significantly and negatively associated with the educational inequality, except in the northern part of Thailand. The magnitudes of coefficients of average years of schooling in the northern and southern parts are twice that of the central part of Thailand. The policy implication of this paper is that the Thai government should pay attention to two points in adjusting the scope of distribution: reduce the number of people without schooling and extend the educational attainment of people with primary education to secondary education. At the regional level, the policy of education expansion for reducing educational inequality is workable only in central Thailand, the north, and the south. Governments should utilize different policies in each region. In addition, the Thai government should pay more attention to solving the social problems which contribute to the issue of educational inequality. Keywords: Inequality in education, the Gini coefficient, Years of schooling, Thai education. JEL classification Codes: I24 1. Introduction People know well about the huge benefits of education. In many countries, governments drive long-run economic development by investing in human capital, especially in the form of education for their citizens, although access to education is a basic human right that everyone is entitled to. As an outcome of investment in education, ‘inequality in education’ is an inequality in the production of human capital. It is a dimension that not only measures the actual unequal distribution of education in society, but also evaluates the effectiveness of educational policies. Equality in education, an issue in many countries including Thailand, does not mean that all citizens must have the same level of education attainment, but rather that all citizens should be treated the same (rights, opportunities, and accessibility) with regards to certain basic education. Differences in sex, religion, or social status should not be obstacles to access to education or give
1 Ph.D. Student, Graduate School for International Development and Cooperation, Hiroshima University 2 Associate Professor, Graduate School for International Development and Cooperation, Hiroshima University
2
people fewer opportunities to get an education. The concept of inequality in education is influenced by the theories of earnings distribution. Milner (1972) explained the concept of inequality in his book, The Illusion of Inequality as:
The concept of inequality deals with relative differences. Consequently, changes in the absolute level of resources do not necessarily have any effect on the degree or type of inequality. Inequality refers to the shape of the pyramid (distribution), not the absolute level of the pyramid. Consequently, the degree of inequality can be the same in a society that has an average annual per capita income of a hundred dollars as in one where it is ten thousand dollars (p. 36).
The concept of inequality in education also deals with relative differences which refer to the
shape of distribution of education. A method of measuring degrees of educational inequality is also adapted from a measure of income distribution. Scholars used many educational variables for evaluating different types and degrees of inequality in education such as enrollment rates, average years of schooling, and so on.
This study was designed to measure Thai educational inequality in 2011. We picked the case of Thailand since Thailand is a developing country which has a high potential to become a developed country. A study of the pattern of Thai education dispersion is going to accentuate the failure of Thai educational policy, which is a factor explaining why Thailand cannot step up to become a developed country. We employ the Gini coefficients which measure the gap between the actual distribution of educational attainment and perfect equality to quantitatively assess the tier of inequality in Thai education using years of educational attainment. Differing from earlier studies, this paper chooses the disaggregated micro-level data instead of aggregated macro-level data for computing degrees of inequality in education. The advantage of using the micro level data is that we can more precisely evaluate the actual degree of educational inequality. There are two reasons. Firstly, we can capture the actual years of schooling of dropouts or people with limited education without necessarily assuming a half duration of completion and secondly, we can expand the range of years of schooling without terminating at the undergraduate level of higher education. Due to the fact that there has been a proportion of the population which highest attained graduate levels of higher education and the share of this group will tend to become bigger and bigger in the future, including graduate levels of education in the analysis can reduce underestimation or overestimation of inequality in education and prevent defining a misspecified shape of education distribution which leads to inappropriate educational policies. For these reasons, we can categorize levels of education to 22 levels of educational attainment from the primary level till graduate level. Even if the importance of higher education in terms of social benefits is less than primary and secondary education and investment in higher education becomes an overinvestment in the over-education of the labor market, the current increasing trend of labor with graduate level in education market induces the supply of over-education workforce in labor market. It signals to the employers to increase their demand for over-education labor.
The Thai formal education system is basically organized along five levels: pre-elementary (three years), elementary (six years), lower-secondary (three years), upper-secondary (three years), and higher education (four years or more). There was a big structural change in Thai education in 1978. The Thai formal educational cycle durations of primary and secondary levels of education were completely changed by legislation from “seven and five” to “six and six” in this year (Hawley, 2004). Under the Thai National Education Act, free basic education was expanded from nine years to twelve years in 1999, while in 2003 compulsory education was
3
expanded to nine years (UIS, 2013). Among all three levels of education, primary education and higher education are the most heavily subsidized by the state, while secondary education is barely subsidized (Blaug, 1976). The scheme of Thai government policies for education after institutional and political revolution in 1932 can be roughly separated into two periods. In 1932-1974, the first period of government educational policies emphasized laying the foundation of the education system, expanding the supply of schooling, and education reform. In 1975, the government under Prime Minister Seni Pramoj raised the issue of educational equality in education policy. After that, equality in education has become a continuous basic issue of Thai education policy.
This paper contains seven sections. The next section reviews related earlier literatures. Section 3 outlines the source of data and summary statistics. Section 4 introduces the measure of inequality in educational attainment used in this study. Sections 5 and 6 are the main sections of analysis. The former applies the method identified in the previous section to quantify inequality in Thai education from individual-level data to national, regional, and provincial-level calculations. We present the inequality in education of each province in Thailand by geographic information. We further compute inequality in schooling by gender group. A comparison of degrees of inequality in education among four, seven, 17 and 22 levels of education are provided. The latter analyzes the relationship between average years of educational attainment and educational inequality, calculated at the corresponding aggregated provincial level. The last section, Section 7, summarizes the main conclusions and suggests policy implications. 2. Literature review As Milner (1972) stated in his book, The Illusion of Inequality, on the concept of inequality “…if the meaning of inequality is relatively clear, a method of describing and measuring different degrees and types of inequality is much less clear” (p.34). This state is also true in an unequal educational scheme. Scholars utilize many educational variables for assessing degrees of educational inequality. Thomas, et al. (2000) provided a measure of the education Gini coefficients for aggregate macro-data which became the prototype in many later studies regarding this analysis.
On the relationship between education and inequality in education, internationally they have a dualistic relationship due to measurements of inequality. Basically, there are two measures of dispersion, absolute and relative, that are applied in examining inequality in education. The difference between the two measures seems to impact the relationship between average years of educational attainment and educational inequality. Ram (1990), Gregorio and Lee (2002), and Lim and Tang (2008) applied the standard deviation of schooling to measure unequal distributions of education and revealed the existence of a concave (inverted U-shape) relation between them. The negative monotonic relationship between them was found by Thomas, et al. (2000), Checchi (2001), Castellό and Domenéch (2002), and Lim and Tang (2008) because all of these studies employed the Gini index of education to assess education disparity.
Within a single country, the negative linear slope between average years of schooling and the education Gini coefficients have been clearly identified in the cases of the Philippines (Mesa, 2007), Brazil (Lorel, 2008), and Indonesia (Kumba, 2010). On the other hand, Hojo (2009) observed an inverted U-shape relationship between average years of schooling and the education
4
Gini coefficients due to decreasing proportions of people ending schooling at the primary level and increasing proportions of higher-educated groups.
Turning to the issue of inequality in Thai education, most of the earlier studies identified inequality in education through the enrollment ratio of the school age population. Chiangkul (2008) observed that during 2002-2006, the northeastern part of Thailand had the lowest enrollment ratio of primary and upper-secondary education while the eastern part of Thailand had the highest enrollment ratio of primary and secondary education. Bangkok and provinces located near Bangkok had the lowest enrollment ratio of lower-secondary education due to the high opportunity cost of education.
3. Data source and summary statistics The data set used in this paper comes from the Household Socioeconomic Survey (SES) which was conducted in 2011 by Thailand’s National Statistics Office. The SES has several advantages in studying the situation of educational inequality in Thailand. Firstly, the survey represents individual demographic information. Secondly, we can identify the highest level of educational attainment from the survey. Table 1 reports the total number of people (column 2) and people aged 25 years and older (column 3) at the regional level. Table 1: Structure of people by region in 2011
Source: Author’s calculations based on the Household Socioeconomic Survey, 2011. Note: The classification of regions is provided by Thailand’s National Statistics Office. In the same year (2011), the number of provinces in Thailand changed from 76 to 77 provinces. ‘Bueng Kan’ is the 77th province, which separated from ‘Nong Khai’, a province in the northeastern part of Thailand. In the Household Socioeconomic Survey for 2011, Bueng Kan was not counted as a new province. In column 1, the number in parenthesis shows the number of provinces corresponding to each region of Thailand. In column 2 and column 3, the percentage of people in each region is in parenthesis. The ratio of people aged 25 years and over to the overall population is 69.02 per cent.
Focusing on educational data, table 2 describes the shares of people with the highest educational level attainment. In the whole of Thailand, approximately six per cent of people have had no schooling. The biggest proportion of people’s highest level of educational attainment is a primary school education, which makes up over 50 per cent of the total. The area where the largest number of people has never attended school is the northern part of Thailand.
Table 3 presents the descriptive analysis of education by background characteristic. The average number of years of schooling of Thai people is 7.63 years, which is lower than basic education and compulsory education in Thailand. Similar to all parts of Thailand, the minimum number of years of schooling is zero years (no schooling) and the maximum number of years of schooling is 21 years (obtained a doctorate). Contrary to Hawley (2004), we observe that men had a greater average number of years of educational attainment in all areas of Thailand. In
By location(1) Number of People (2) Number of People, aged 25 and over (3)
Bangkok metropolis 7,740 (6.04) 5,529 (6.26)
Central (25) 36,523 (28.52) 25,549 (28.90)
North (17) 29,758 (23.24) 21,408 (24.22)
Northeast (19) 35,173 (27.46) 23,621 (26.72)
South (14) 18,877 (14.74) 12,290 (13.90)
Total (76) 128,071 (100) 88,397 (100)
5
addition, the average level of education at the regional level in 2011 provided in this analysis is lower than the average number of years of educational attainment in 1995 provided by Hawley (2004). Among the four regions of Thailand, similar to Chiangkul (2008), The South had the highest average number of years of schooling, while the North had the lowest average number of years of educational attainment. Table 2: Educational levels attained by regional groups of the population
By education level By location
Total Bangkok Central North Northeast South
No schooling 5,042 (5.72%)
217 (3.93%)
1,316 (5.15%)
1,957 (9.19%)
707 (3.00%)
845 (6.89%)
Primary 48,609 (55.10%)
1,966 (35.58%)
13,982 (54.76%)
12,263 (57.57%)
14,431 (61.16%)
5,967 (48.68%)
Secondary 19,204 (21.77%)
1,488 (26.93%)
6,286 (24.62%)
3,908 (18.35%)
4,448 (18.85%)
3,074 (25.08%)
Higher 15,360 (17.41%)
1,855 (33.57%)
3,950 (15.47%)
3,173 (14.90%)
4,011 (17.00%)
2,371 (19.34%)
Total 88,215 (100%)
5,526 (100%)
25,534 (100%)
21,301 (100%)
23,597 (100%)
12,257 (100%)
Source: Author’s calculations based on the Household Socioeconomic Survey, 2011 Note: People with religious study (Buddhism-Bali), unidentified educational level, and incommensurable education level are not reckoned in this table. Table 3: Summary statistics
Area part
Variable: Education (Years of Schooling) Sample Mean S.D. Min Max
Thailand Total 88,215 7.63 4.86 0 21 Male 40,185 8.00 4.73 0 21
Female 48,030 7.32 4.95 0 21 Central
Total 25,534 7.57 4.69 0 21 Male 11,500 7.98 4.55 0 21
Female 14,034 7.25 4.77 North
Total 21,301 6.90 4.87 0 21 Male 9,691 7.31 4.75 0 21
Female 11,610 6.56 4.95 0 21 Northeast
Total 23,597 7.57 4.71 0 21 Male 10,861 7.91 4.65 0 21
Female 12,736 7.28 4.73 0 21 South
Total 12,257 8.06 4.94 0 21 Male 5,623 8.37 4.74 0 21
Female 6,634 7.80 5.09 0 21 Bangkok
Total 5,526 10.07 5.24 0 21 Male 2,510 10.43 4.98 0 21
Female 3,016 9.76 5.42 0 21
Source: Author’s calculations based on the Household Socioeconomic Survey, 2011. 4. Measuring inequality in educational attainment
The Gini coefficient, the standard relative measure of inequality, was chosen as a measure of inequality in Thai education for this study. Deaton (1997) defined the direct method of
6
measuring the Gini coefficient of inequality as “the ratio to the mean of half the average over all pairs of the absolute deviations between people; there are N(N-1)/2 distinct pairs in all” (p.139). Haughton and Khandker (2009) mentioned that the Gini coefficient satisfies four out of six criteria that make a good measure of inequality. These are mean independence, population size independence, symmetry, and Pigou-Dalton transfer sensitivity. Hence the specification of the Gini coefficient advocated by Deaton (1997) is as follows:
Geduc = ∑ ∑ xi‐xjji j . (1)
Where Geduc is the education Gini coefficients representing an unequal distribution of
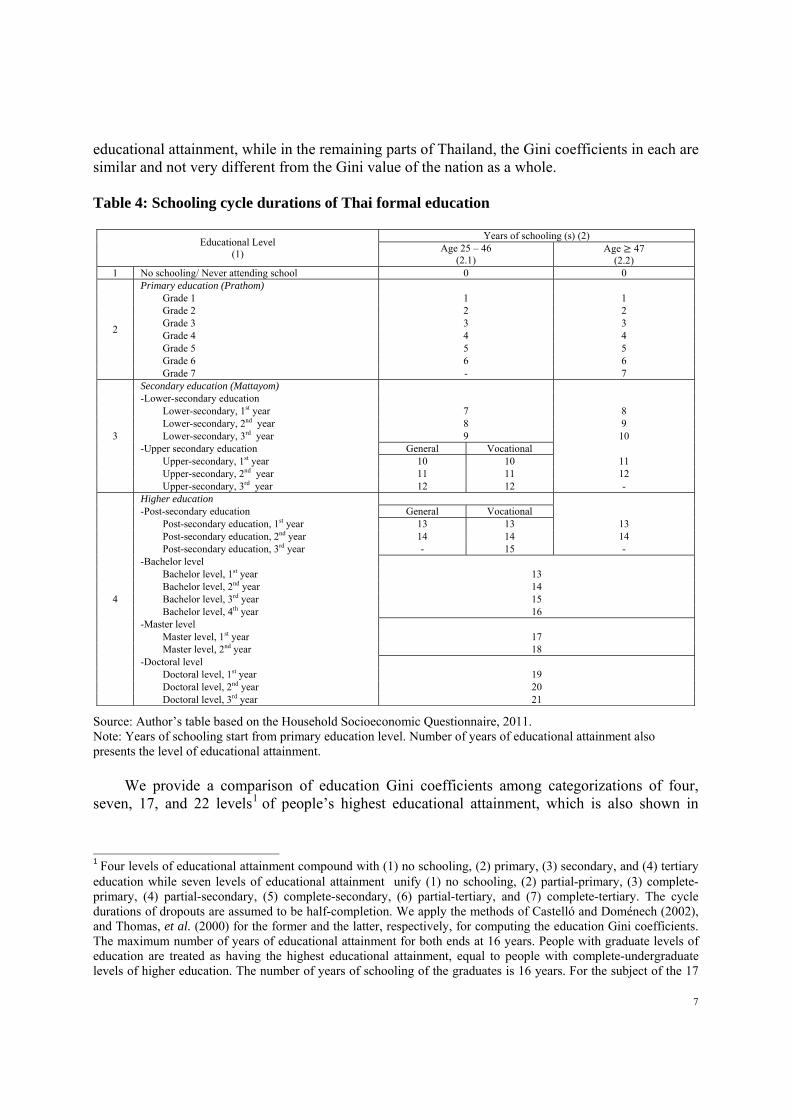
education which lie between zero (perfect equality) and one (perfect inequality); μ is the mean number of years of schooling with the highest educational attainment; N is the total number of individuals. In this analysis, individuals aged 25 years and older are included for capturing the workforce; xi and xj are the cumulative number of years of schooling of individuals which are between zero (no formal schooling or having never attended school) and 21 (completion of a doctoral degree) years of schooling which cover the primary level until the doctoral level. The amount of schooling initially starts from the primary level of education. Different from the previous studies, due to the elasticity of using the micro-data level, we are able to group 21 levels of education which is more than the previous research did. The number of years of schooling for dropouts is not assumed to be half completion, nor takes the average number of years of a partial education level. We capture the difference in years of educational attainment for dropouts. Table 4 outlines levels of education and corresponding years of schooling. Regarding the modification of the Thai education structure in 1978, we take the effect of structural change into account because individuals who are aged 47 years and older are treated as having seven years of elementary education and five years of secondary education, while individuals aged between 25 and 46 years are considered to have six years of primary education and also six years of secondary education.
Since the range of number of years of schooling is tapered (between zero and 21 years), we can also apply the education Gini formula suggested by Thomas, et al. (2000), Checchi (2001), and Castellό and Domenéch (2002) as follows:
Geduc = ∑ ∑ |xi20j=0
21i j – xj| ni nj. (2)
Where ni and nj are the proportions of people with given years of schooling. Continuing from
this section, the Gini coefficients of Thai education will be computed in the next section. 5. Inequality in Thai education In this section, we compute the education Gini coefficients which were introduced in the previous section by the national, regional, and provincial-level based on educational attainment distribution. Table 5 reports levels of the Gini coefficients comparing background characteristics. The Gini coefficient of education in the whole of Thailand is at 0.349. At the regional level, we found that the northern area of Thailand has the most grievous unequal distribution of
7
educational attainment, while in the remaining parts of Thailand, the Gini coefficients in each are similar and not very different from the Gini value of the nation as a whole. Table 4: Schooling cycle durations of Thai formal education
Lower-secondary, 1st year 7 8 Lower-secondary, 2nd year 8 9 Lower-secondary, 3rd year 9 10
-Upper secondary education General Vocational Upper-secondary, 1st year 10 10 11 Upper-secondary, 2nd year 11 11 12 Upper-secondary, 3rd year 12 12 -
4
Higher education -Post-secondary education General Vocational
Post-secondary education, 1st year 13 13 13 Post-secondary education, 2nd year 14 14 14 Post-secondary education, 3rd year - 15 -
-Bachelor level Bachelor level, 1st year 13 Bachelor level, 2nd year 14 Bachelor level, 3rd year 15 Bachelor level, 4th year 16
-Master level Master level, 1st year 17 Master level, 2nd year 18
-Doctoral level Doctoral level, 1st year 19 Doctoral level, 2nd year 20 Doctoral level, 3rd year 21
Source: Author’s table based on the Household Socioeconomic Questionnaire, 2011. Note: Years of schooling start from primary education level. Number of years of educational attainment also presents the level of educational attainment. We provide a comparison of education Gini coefficients among categorizations of four, seven, 17, and 22 levels1 of people’s highest educational attainment, which is also shown in
1 Four levels of educational attainment compound with (1) no schooling, (2) primary, (3) secondary, and (4) tertiary education while seven levels of educational attainment unify (1) no schooling, (2) partial-primary, (3) complete-primary, (4) partial-secondary, (5) complete-secondary, (6) partial-tertiary, and (7) complete-tertiary. The cycle durations of dropouts are assumed to be half-completion. We apply the methods of Castelló and Doménech (2002), and Thomas, et al. (2000) for the former and the latter, respectively, for computing the education Gini coefficients. The maximum number of years of educational attainment for both ends at 16 years. People with graduate levels of education are treated as having the highest educational attainment, equal to people with complete-undergraduate levels of higher education. The number of years of schooling of the graduates is 16 years. For the subject of the 17
8
Table 5. In this analysis, the share of people with a graduate level of education is approximately 1.7 per cent of the total and 9.8 per cent of people with a higher education. We found that a classification of the four and 17 levels of educational attainment underestimates the factual degrees of inequality in educational attainment while an assortment of seven levels of education possibly underestimates or overestimates the actual level due to a confutation of two associated wedges. Firstly, a limitation of the number of years of schooling excluding the graduate level of education will reduce the gap in educational inequality between minimum and maximum years of educational attainment. This affects an underestimation of inequality in education. Secondly, owing to the assumption of dropouts’ cycle duration, this can overestimate or underestimate the degree of the Gini coefficients that depend on the actual average years of education of dropouts. Setting a half-completion for dropouts in the analysis induces overestimation. Table 5: The Gini Coefficients of education by background characteristics
Sample Number of education levels Whole Central North Northeast South
Source: Author’s calculations based on the Household Socioeconomic Survey, 2011. The Gini coefficients of each province in Thailand are reported in Table A of the Appendix by gender groups. The Gini coefficients are at a range between 0.272 and 0.521. The Bangkok metropolis is not the province with the greatest equality in education, but rather the provinces like Nonthaburi, which is located near Bangkok, have the smallest inequality in education. On the contrary, Mae hong son, a province located in the northern part of Thailand, has the biggest inequality in education. The Gini coefficients of education show that due to the impact of Bangkok’s prosperity, provinces located near the metropolis also have greater equality in education. Figure 3 presents the set of geographic information on inequality in Thai educational attainment. The above-left picture describes the average number of years of educational attainment in 2011. It shows that only Bangkok and provinces around Bangkok have an average number of years of schooling greater than 10 years. The remaining maps depict the degrees of inequality in Thai education. The above-right depiction describes the northern provinces, especially the border provinces, Chiang rai, Mae hong son, and Tak, and three southern border provinces, Naratiwat, Pattani, and Yala, as having severe inequality in education because of ethnic minorities and terrorism, respectively. The two bottom images render educational inequalities in female and male groups consecutively. These demonstrate there was unequal distribution of educational attainment, highly biased against woman, which was distinctly present in the northern area of Thailand. This implied an underinvestment in the education of woman (Tilak, 1987).
and 22 levels of educational attainment, partial levels in each educational level are classified as being higher than the previous level.
Figure
Source: ANote: The
3: Geograp
Author’s calcue symptom ‘st
phic inform
ulations based tar’ in the map
mation of T
on the Househps presents the
hai educati
hold Socioecoe location of th
ional inequ
onomic Surveyhe Bangkok m
uality
y, 2011. metropolis.
9
10
6. Relationship between average number of years of educational attainment and inequality in educational attainment
In the previous section, inequalities in Thai education were assessed using a form of the Gini coefficients. In this section, we further analyze the relationship between the average number of years of educational attainment and inequality in education at the aggregate provincial level. In view of statistical analysis, we simply employ a bivariate linear regression model for predicting the impact of schooling on educational inequality as follows:
Geduci = β0 + β1AYSi + ui (4)
Where Geduci is the education Gini coefficient of province i; AYS is the average number of years of schooling of Thai people aged 25 years and older (see Table A in the appendix); and u is disturbance. In an earlier study, Hawley (2004) observed that women had higher levels of educational attainment than men in 1985, 1995, and 1998, while this study observes that women had lower levels of educational attainment than men in all provinces of Thailand.
Table 6 presents the results of OLS estimations of the relationship between mean years of schooling and the Gini coefficients from provincial-level data into national and regional-levels of analysis. This table demonstrates that, at the national level, a very significant negative association between average number of years of schooling and educational inequality is observed not only in the total group but also in female and male groups. This result implies that provinces with a higher education attainment level (higher average numbers of years of schooling) are likely to achieve better educational equality than those with lower educational attainment (lower average numbers of years of schooling). The magnitude of the relationship in the female group (-0.034) is greater than in the male group (-0.030). This conforms to the higher level of female educational inequality reported in a previous part. This result can explain around half of the differences in inequality among all provinces in Thailand (R2 = 50.24 per cent).
Proceeding to regional analysis, in the same table, among the four regions of Thailand, central, northern, northeastern, and southern, the negative relationship between educational attainment and educational inequality was observed in only three regions, the central, northern, and southern parts of Thailand. There is no significant association in the northeastern area of Thailand. In addition, we found that absolute magnitudes of coefficients of mean years of educational attainment (β1) in the North and South (-0.051 and -0.054, respectively) are double the absolute magnitude of the coefficient of the central part of Thailand (-0.027). Both of these observations were found in female and male groups.
Two further questions arise from these findings. Firstly, why does only the northeastern part of Thailand have no statistical negative relationship between the average number of years of schooling and inequality in educational attainment? Secondly, why does the relationship between the average number of years of educational attainment and inequality in education in the northern and southern parts of Thailand slope twice as steeply than in the central part of Thailand? In Figure 4, we depict scatter plots of average years of schooling and inequalities in education by region, accounting for additional support for these questions. In Figure 4, comparing four regions of Thailand, we notice that degrees of inequality in educational attainment in provinces located in the Northeast fluctuate at a tapered level of the Gini coefficients (mostly within 0.30 to 0.35) while degrees of educational inequality move in a broader range in the other regions. This implies that the allocation of education is best or worst
11
throughout the northeastern area. Therefore, in cross-section analysis, we could not find a negative relationship between educational attainment and inequality in education in the Northeast. In addition, comparing three regions, the graph of the central area is flatter compared to the North and the South and the constant of the former (0.541) is smaller than the latter (0.727 and 0.775, respectively). Differences in coefficients and constants suggest that distance from the capital can impact the level of educational equality.
Table 6: The OLS estimations of inequality in education at national and regional levels
Note: Standard errors are reported in parenthesis. Bangkok metropolis is excluded from the central region. A symbol *; corresponds to the significance levels of T-statistics differing from zero at 1%. Observation is at the provincial level, which is calculated from individual-level data.
Region
Dependent variable: the Gini coefficients of schooling
Coefficient of schooling Constant R-squared (%) Observations
National
Total -0.032* (0.004)
0.585* (0.028)
50.24
76 Female -0.034* (0.004)
0.605* (0.031)
44.70
Male -0.030* (0.003)
0.561* (0.027)
51.48
Central
Total -0.027* (0.003)
0.541* (0.025)
75.36
25 Female -0.028* (0.003)
0.557* (0.025)
74.37
Male -0.025* (0.004)
0.511* (0.029)
67.50
North
Total -0.051* (0.016)
0.727* (0.111)
39.51
17 Female -0.056* (0.018)
0.766* (0.116)
40.09
Male -0.053* (0.016)
0.741* (0.115)
43.32
Northeast
Total -0.006 (0.009)
0.375* (0.072)
2.26
19 Female -0.007 (0.012)
0.392* (0.088)
2.05
Male -0.005 (0.007)
0.359* (0.051)
3.57
South
Total -0.054* (0.007)
0. 775* (0.061)
81.05
14 Female -0.059* (0.009)
0.823* (0.067)
80.04
Male -0.045* (0.007)
0.691* (0.058)
77.55
12
Figure 4: Relationships between education and educational inequalities: regional analysis
Region: Central Region: North
Region: Northeast Region: South
Source: Author’s calculations 7. Concluding remarks This paper mainly aims to investigate inequalities of educational attainment in Thailand by using the micro-data level. The cross-sectional data come from the Household Socioeconomic Survey conducted in 2011. We employ the Gini coefficients to assess the unequal distribution of Thai educational attainment. At the national level, the average number of years of schooling is 7.63 years and the Gini coefficient is 0.349.
At the regional level, we found that the northern part of Thailand has the largest inequality in education while in other parts of Thailand, the levels of educational inequalities are slightly different. The biggest Gini coefficient is from Mae hong son (North) and the smallest is from Nonthaburi (Central). The biggest (0.521) is nearly double the smallest (0.272). Comparing
Samut Prakan
NonthaburiPathum thani
Phra nakhon si ayutthaya
Ang thongLop buri Sing buriChai nat
SaraburiChon buriRayong
Chanthaburi
Trat
ChachoengsaoPrachin buriNakhon nayok
Sakaeo
RatchaburiKanchanaburi
Suphanburi
Nakhon pathom
Samut sakhonSamut songkhram
Phetchaburi
Prachuap khiri khan
.25
.3
.35
.4
.45
.5
.55
The
Gin
i coe
ffic
ient
s of
sch
oolin
g
6 7 8 9 10 11Average years of schooling
Gini Fitted values
Chiang mai
Lamphun
Lampang
UttaraditPhrae
NanPhayao
Chiang rai
Mae hong son
Nakhon sawanUthai thani
Kamphang phet
Tak
SukhothaiPhitsanulok
Phichit
Phetchabun
.25
.3
.35
.4
.45
.5
.55
The
Gin
i coe
ffic
ient
s of
sch
oolin
g
6 7 8 9 10 11Average yearsof schooling
Gini Fitted values
Nakhon ratchasima
Buri ramSurin
Si sa ketUbon ratchathani
YasothonChaiyaphum Amnat charoen
Nong bua lam phuKhon kaenUdon thani
LoeiNong khai
Maha sarakhamRoi etkalasin
Sakon nakhon
Nakhon phanom
Mukdahan
.25
.3
.35
.4
.45
.5
.55
The
Gin
i coe
ffic
ient
s of
sch
oolin
g
6 7 8 9 10 11Average years of schooling
Nakhon si thammarat
Krabi
Phangnga
Phuket
Surat thani
Ranong
Chumphon
SongkhlaSatun
TrangPhatthalung
Pattani
Yala
Naratiwat
.25
.3
.35
.4
.45
.5
.55
The
Gin
i coe
ffic
ient
s of
sch
oolin
g
6 7 8 9 10 11Average years of schooling
Gini Fitted values
13
gender groups, there is a more equal distribution of education in the male group. A gender disparity of opportunity still exists in Thai society.
We searched for a relationship between mean years of schooling and inequality levels using a province-level analysis. The estimations show that at the national level, the greater the educational attainment achieved, the lower the inequality in education. However, at the regional level, the average number of years of schooling was significantly negatively related to the Gini coefficients only in the central, northern, and southern areas. The magnitudes of coefficients in the North and South are more than twice as big as in the central region. On the other hand, there is no significant relation between the average number of years of schooling and educational inequality in the Northeast.
The advantage of this study is that educational inequality is more precisely computed by using the individual data in the analysis. This freed us from two constraints from the previous studies. Firstly, we can drop years of schooling for dropouts at many levels without assuming half completion. Secondly, the range of education levels becomes wider. We include the graduate (master and doctoral) level of educational attainment in the analysis. Expanding the amplitude of education reflects the real numbers of years of schooling. This prevents an underestimation of educational inequality.
In conclusion, this study observes a chronic problem of inequality in education in Thailand because of the failure of educational policies in place affecting people aged 25 and over. The policy implications of this research suggest that the allocation of subsidies to basic education should be higher and go to the North to relieve the degree of inequality in education, especially to reduce the number of people without schooling. The government should pay attention to two points in adjusting the shape of distribution. Firstly, the number of people with no schooling should be reduced to zero and secondly, the Thai government should persuade people with a primary education to further their education by stimulating demand for adult education and providing a greater supply of adult education with easy accessibility and flexibility. At the regional level, the estimates clarify that government should continue to expand education, especially in the North and South, to increase educational equality. In the northeastern part of Thailand, increasing the average number of years of schooling will not always reduce the degree of inequality. Government should utilize different policies in each region. The policy makers are required to concentrate more on enrollment in basic education. In addition, the Thai government should pay more attention to solving social problems like ethnic tensions and terrorism, which also bear on the issue of educational inequality.
References
Blaug, M. (1976). The rate of return on investment in education in Thailand. The Journal of Development Studies, 12(2), pp. 270-283.
Bureau of International Cooperation. (2008). Towards a learning society in Thailand: an introduction to education in Thailand. Retrieved February 11th, 2013, from http://www.bic.moe.go.th/th/index.php?option=com_content&view=article&id=285&catid=44
Castellό, A., & Domenéch R. (2002). Human capital inequality and economic growth: some new evidence. The Economic Journal, 112(478), pp. C187-C200.
14
Checchi, D. (2006). The economics of education: human capital, family background and inequality. Cambridge: Cambridge University Press.
Chiangkul, V. (2008). The generality of Thai education 2007/2008: the problem of equality and the quality of Thai education. Bangkok: V.T.C. communication (in Thai).
Coleman, J. S. (1990). Equality and achievement in education. San Francisco: Westview Press. Deaton, A. (1997). The analysis of household surveys: a microeconometric approach to
development policy. Maryland: The Johns Hopkins University Press. Gregorio, J. D., & Lee J. (2002). Education and income inequality: new evidence from cross-
country data. Review of Income and Wealth, 48(3), pp. 395-416. Haughton, J. & Khandker, S. R. (2009). Handbook on poverty + inequality. Washington, DC:
The World Bank. Hawley, J. D. (2004). Changing returns to education in times of prosperity and crisis, Thailand
1985-1998. Economics of Education Review, 23, pp. 273-286. Hojo, M. (2009). Inequality in Japanese education: estimation using the Gini education
coefficient. Japanese Economy, 36(3), pp.3-27. Knodel, J. (1997). The closing of the gender gap in schooling: the case of Thailand. Comparative
Education, 33(1), pp. 61-86. Kumba, D. (2010). Measuring gini coefficient of education: the Indonesian cases (working paper
No. 19865). Retrieved from Munich Personal RePEc Archive website: http://mpra.ub.uni-muenchen.de/ 19865/
Lim, S. K., & Tang, K. K. (2008). Human capital inequality and the kuznets curve. The Developing Economies, 46(1), pp. 26-51.
Lorel, B. (2008). Assessing Brazilian education inequalities. Revista Brasileira de Economia, 62(1), pp. 31-56.
Mesa., E. P. (2007). Measuring education inequality in the Philippines (discussion paper No. DP 2007-04). Retrieved from University of the Philippines School of Economics website: http://www.econ.upd.edu.ph/dp/index.php/dp/article/view/66
Milner, M. Jr. (1972). The illusion of equality: the effect of education on opportunity, inequality, and social conflict. London: Jossey-Bass.
Ram, R. (1990) Educational expansionn and schooling inequality: international evidence and some implications. The Review of Economics and Statistics, 72(2), pp. 266-274.
Thomas, V., Wang, Y., & Fan, X. (2000). Measuring education inequality: Gini coefficients of education (working paper No. WPS2525). Retrieved from World Bank Policy Research website: http://papers.ssrn.com/sol3/papers.cfm?abstract_id=258182
Tilak, J. B. G. (1987). The economics of inequality in education. New Delhi: Sage Publications India Pvt Ltd.
Tsang, M. C. & Taoklam, W. (1992). Comparing the costs of government and private primary education in Thailand. International Journal Educational Development, 12(3), pp. 177-190.
15
Appendix Table A: The Gini coefficients of Thai education inequality by Province, 2011
Region Province Observations Means The Gini coefficients