Page 1
1
DDRO: A Novel Performance Monitoring Methodology Based on Design-Dependent Ring Oscillators
Tuck-Boon Chan†, Puneet Gupta§, Andrew B. Kahng†‡ and Liangzhen Lai§
UC San Diego ECE† and CSE‡ Departments, La Jolla, CA 92093UC Los Angeles EE§ Department, Los Angeles, CA 90095
Page 2
2
Outline
• Performance Monitoring: An Introduction• DDRO Implementation• Delay Estimation from Measured DDRO Delays• Experiment Results• Conclusions
Page 3
3
Performance Monitoring
• Process corner identification– Adaptive voltage scaling, adaptive body-bias
• Runtime adaptation– DVFS
• Manufacturing process tuning– Wafer and test pruning [Chan10]
Page 4
4
Monitor Taxonomy
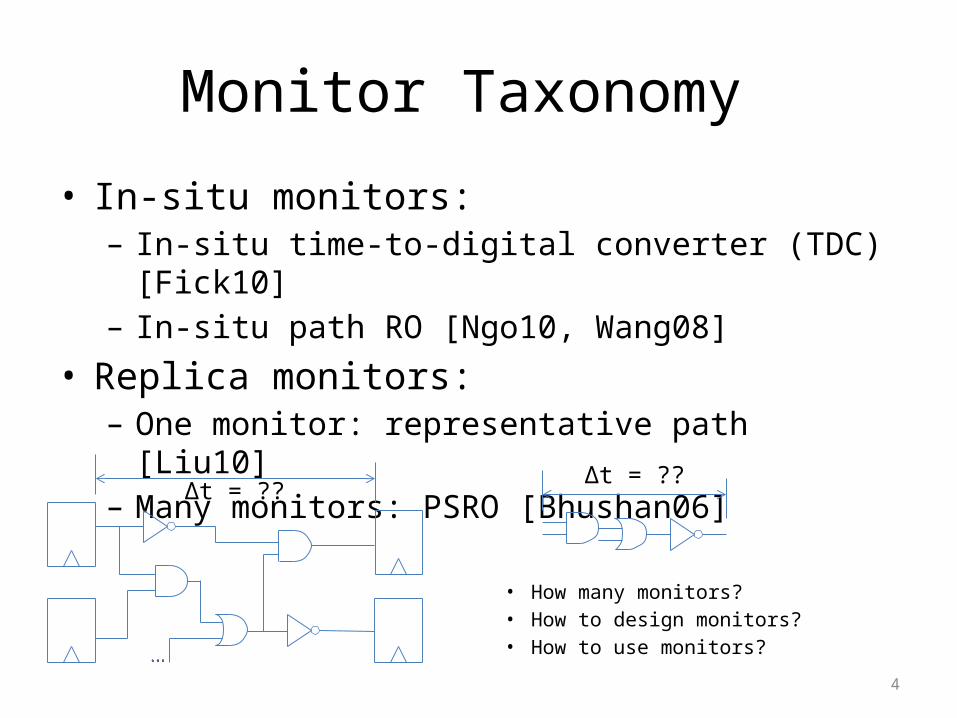
• In-situ monitors:– In-situ time-to-digital converter (TDC) [Fick10]– In-situ path RO [Ngo10, Wang08]
• Replica monitors:– One monitor: representative path [Liu10]– Many monitors: PSRO [Bhushan06]
• How many monitors?• How to design monitors?• How to use monitors?
∆t = ??∆t = ??
Page 5
5
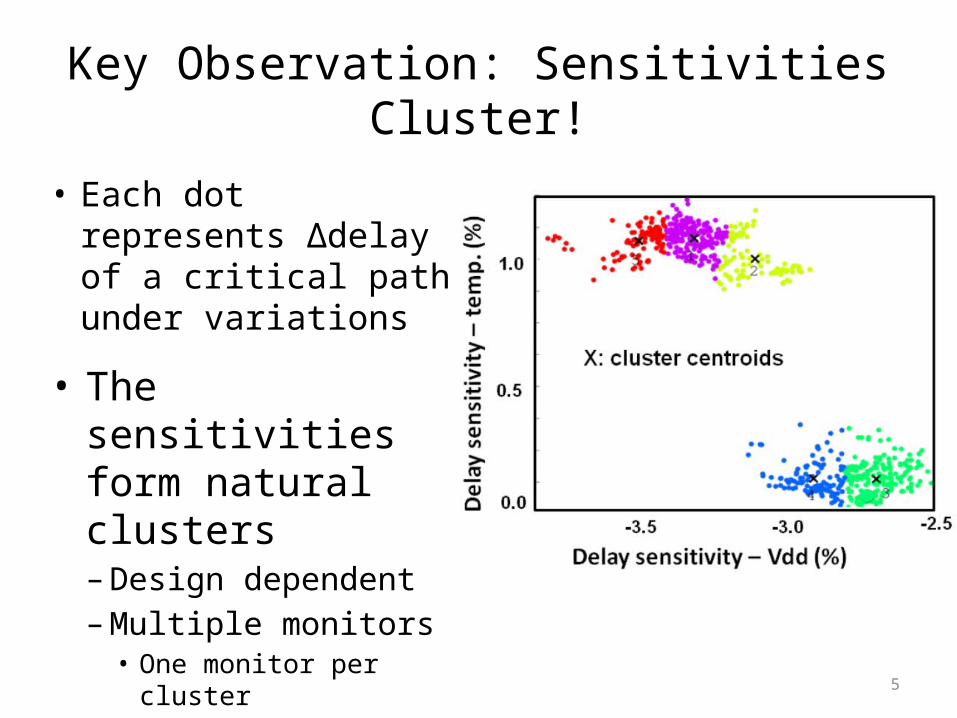
Key Observation: Sensitivities Cluster!
• The sensitivities form natural clusters– Design dependent– Multiple monitors
• One monitor per cluster
• Each dot represents ∆delay of a critical path under variations
Page 6
6
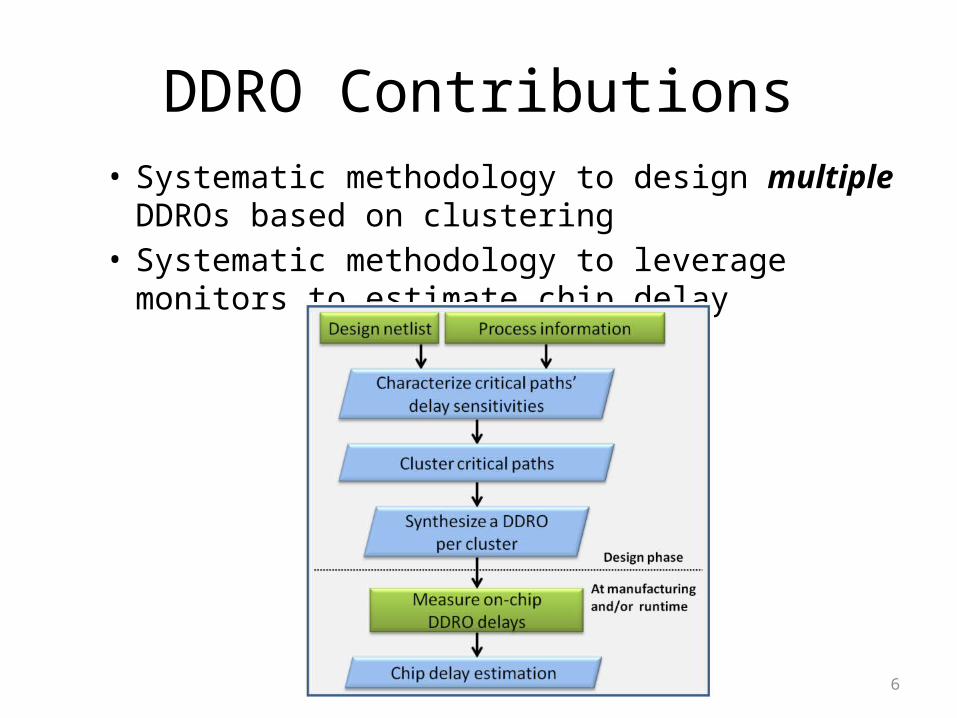
DDRO Contributions• Systematic methodology to design multiple DDROs based
on clustering• Systematic methodology to leverage monitors to estimate
chip delay
Page 7
7
Outline
• Performance Monitoring: An Introduction• DDRO Implementation
– Delay model– Sensitivity Clustering– DDRO Synthesis
• Delay Estimation from Measured DDRO Delays• Experiment Results• Conclusions
Page 8
8
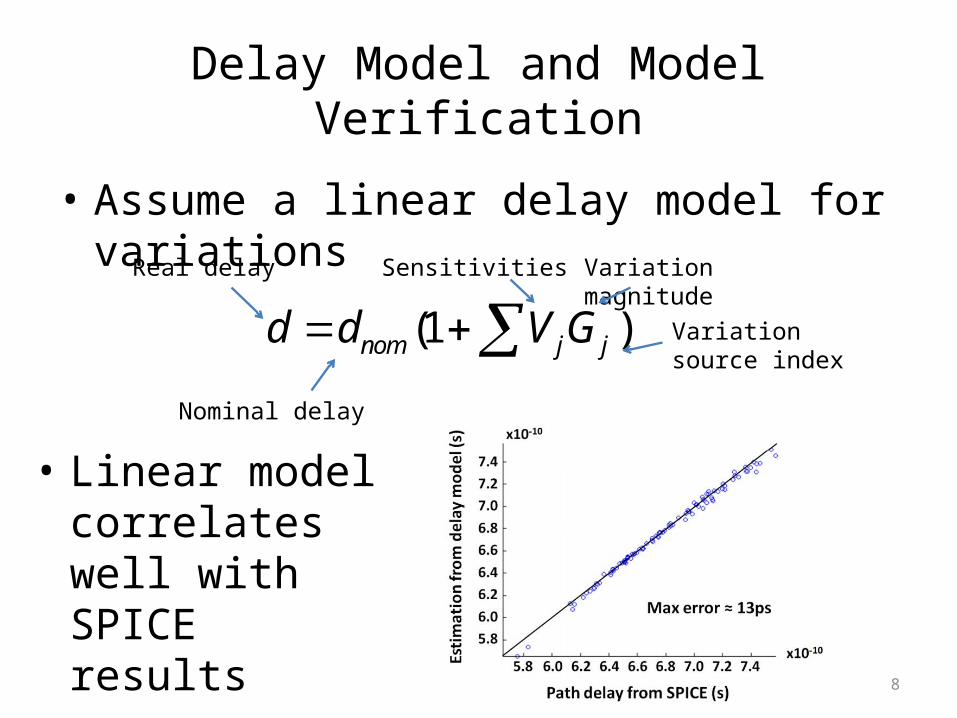
Delay Model and Model Verification
• Linear model correlates well with SPICE results
• Assume a linear delay model for variations
(1 )nom j jd d V G Real delay
Nominal delay
Sensitivities Variation magnitude
Variation source index
Page 9
9
Sensitivities and Clustering
– Use kmeans++ algorithm– Choose best k-way clustering solution in 100 random starts– Each cluster centroid = target sensitivity for a DDRO
• Synthesize DDROs to meet target sensitivities
• Cluster the critical paths based on sensitivities
• Extract delay sensitivity based on finite difference method
1jG nom
jnom
d dV
d
Page 10
10
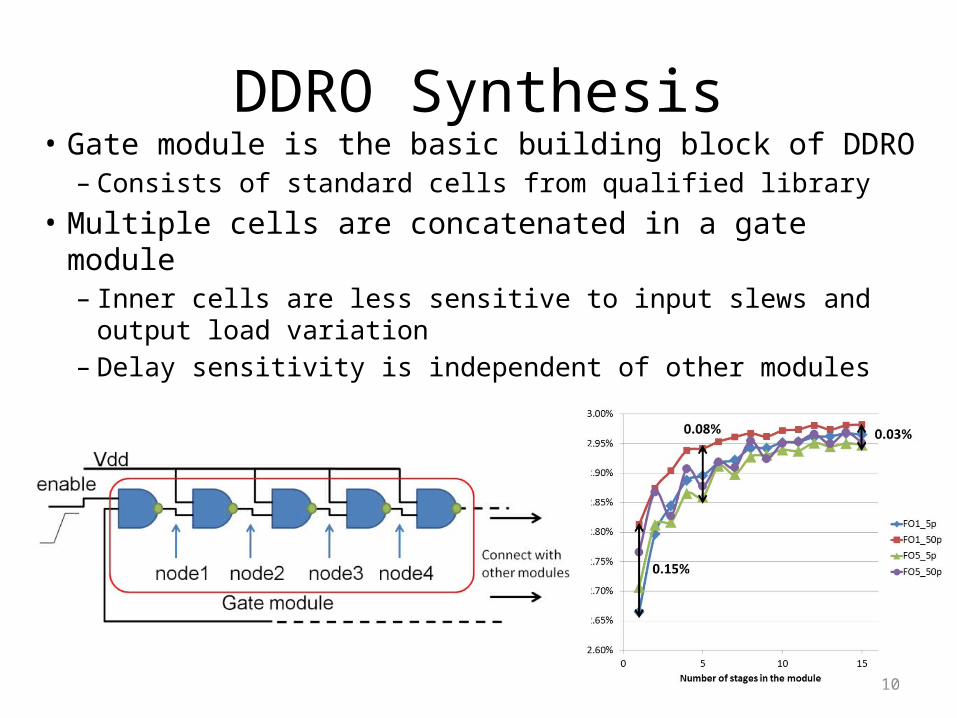
DDRO Synthesis• Gate module is the basic building block of DDRO
– Consists of standard cells from qualified library• Multiple cells are concatenated in a gate module
– Inner cells are less sensitive to input slews and output load variation
– Delay sensitivity is independent of other modules
Page 11
11
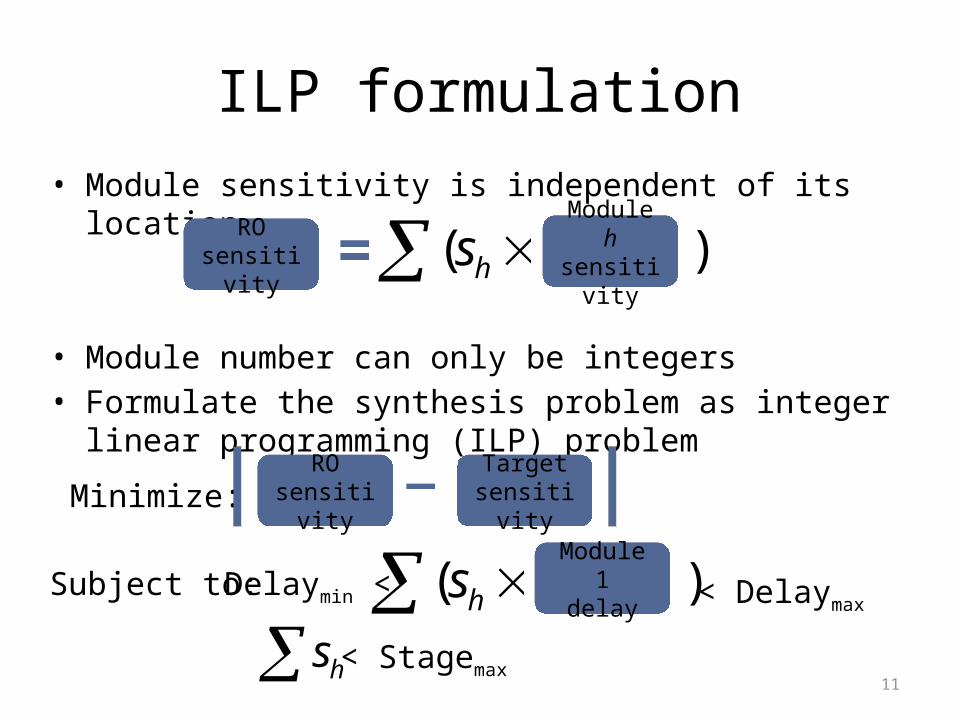
ILP formulation• Module sensitivity is independent of its location
• Module number can only be integers• Formulate the synthesis problem as integer linear
programming (ILP) problem
Minimize: RO
sensitivityTarget
sensitivity
Subject to: Delaymin <Module 1
delay < Delaymax
< Stagemaxhs
ROsensitivity
Module hsensitivity( hs )
( hs )
Page 12
12
Outline
• Performance Monitoring: An Introduction• DDRO Implementation• Delay Estimation from Measured DDRO Delays
– Sensitivity Decomposition– Path Delay Estimation– Cluster Delay Estimation
• Experiment Results• Conclusions
Page 13
13
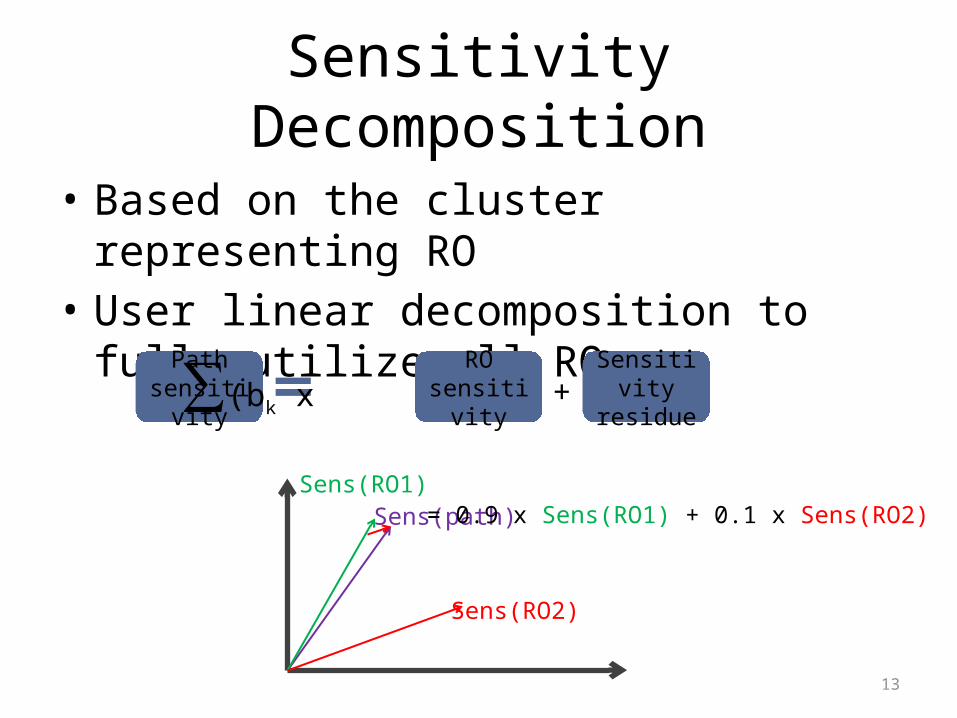
Sensitivity Decomposition
• Based on the cluster representing RO• User linear decomposition to fully utilize all
ROs
Sens(path)Sens(RO1)
Sens(RO2)
= 0.9 x Sens(RO1) + 0.1 x Sens(RO2)
Pathsensitivity
ROsensitivity∑(bk x )+
Sensitivityresidue
Page 14
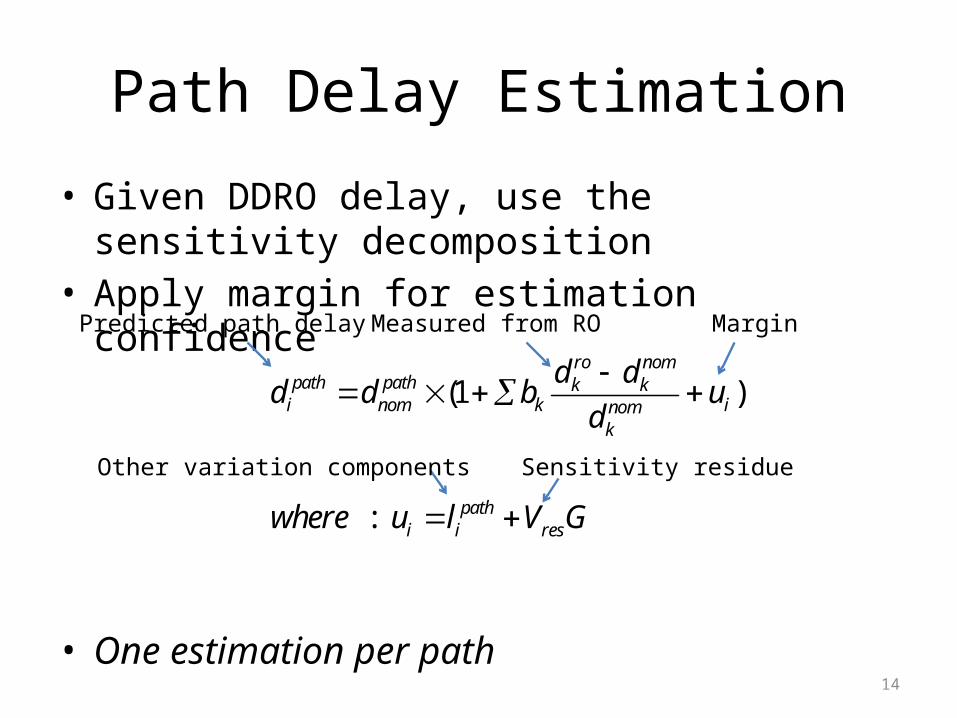
14
• Given DDRO delay, use the sensitivity decomposition• Apply margin for estimation confidence
• One estimation per path
Path Delay Estimation
(1 )
:
ro nompath path k ki nom k inom
k
pathi i res
d dd d b u
d
where u l V G
Predicted path delay
Other variation components Sensitivity residue
Measured from RO Margin
Page 15
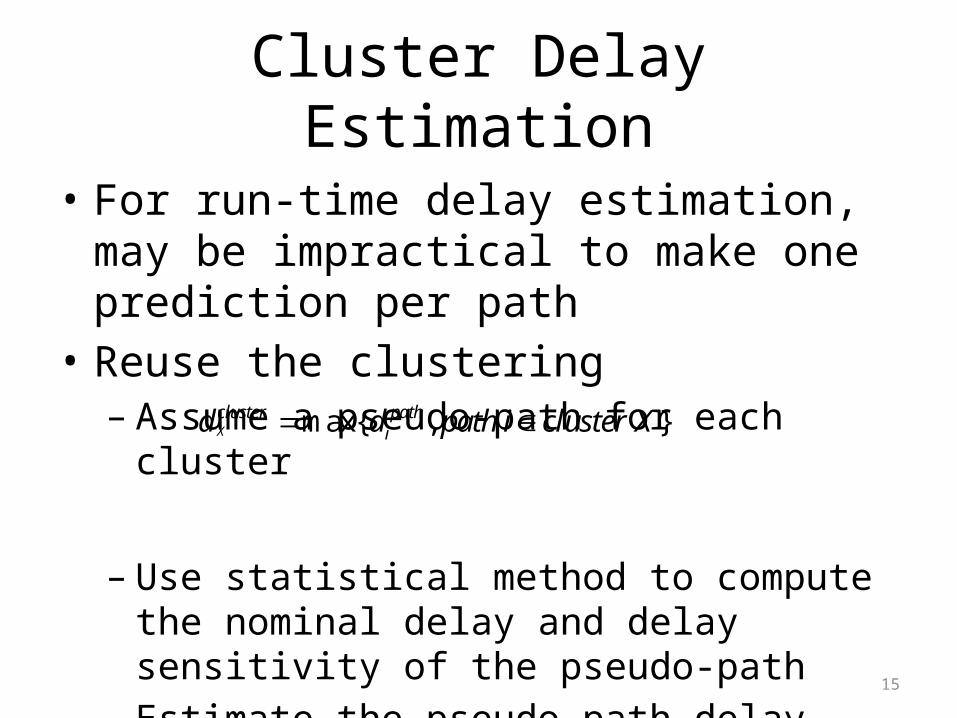
15
Cluster Delay Estimation
• For run-time delay estimation, may be impractical to make one prediction per path
• Reuse the clustering– Assume a pseudo-path for each cluster
– Use statistical method to compute the nominal delay and delay sensitivity of the pseudo-path
– Estimate the pseudo-path delay• One estimation per cluster
max{ , }X
cluster pathid d path i cluster X
Page 16
16
Outline
• Introduction• Implementation• Delay Estimation• Experiment Results• Conclusion
Page 17
17
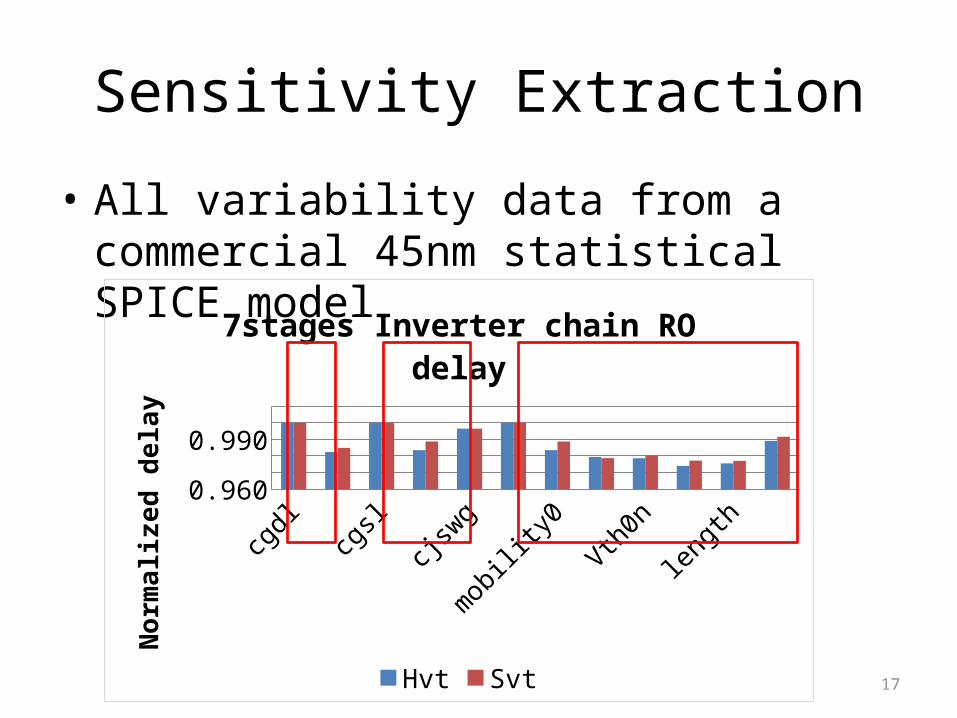
Sensitivity Extraction
• All variability data from a commercial 45nm statistical SPICE model
cgdl
cgdo
cgsl
cgso
cjswg
nominal
mobility0
rdswVth0n
Vth0plength Tox
0.960
0.970
0.980
0.990
1.000
7stages Inverter chain RO delay
Hvt Svt
Nor
mal
ized
del
ay
Page 18
18
Experiment Setup
• Use Monte-Carlo method to simulate critical path delays and DDRO delays
• Apply delay estimation methods with certain estimation confidence– 99% in all experiments
• Compare the amount of delay over-prediction– Delay from DDRO estimation vs. Delay from critical
paths
Page 19
19
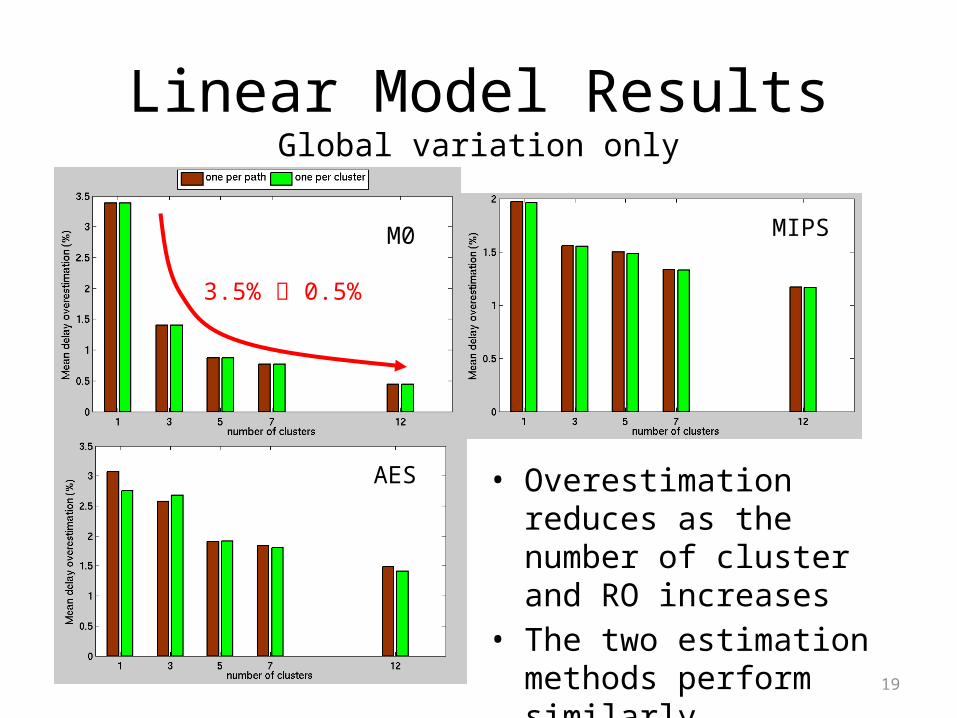
Linear Model ResultsGlobal variation only
M0
AES
MIPS
• Overestimation reduces as the number of cluster and RO increases
• The two estimation methods perform similarly
3.5% 0.5%
Page 20
20
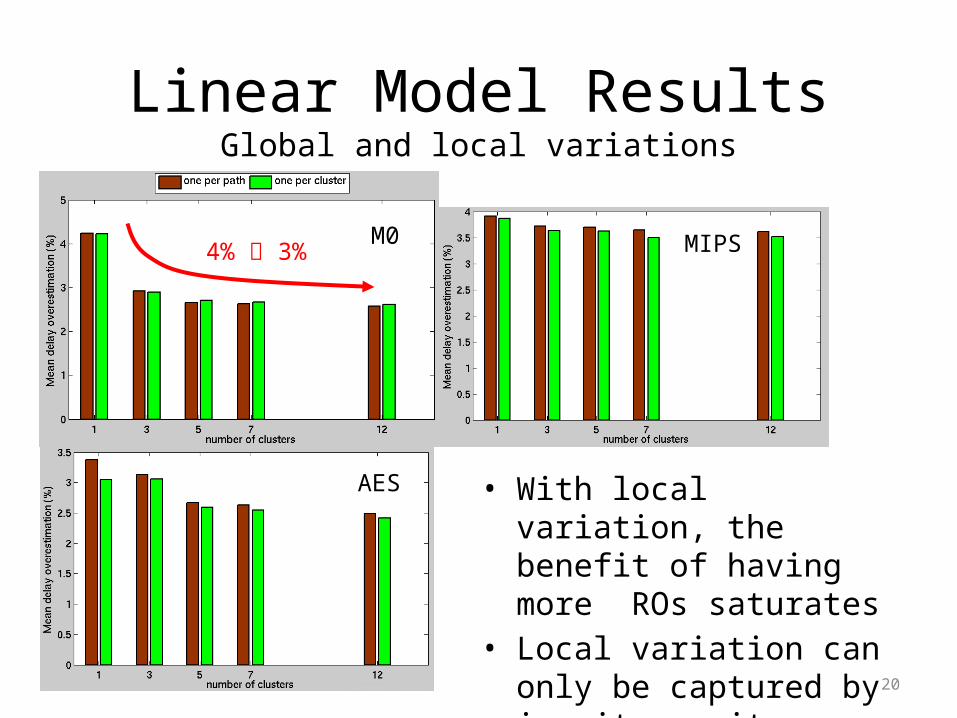
Linear Model ResultsGlobal and local variations
M0
AES
MIPS
• With local variation, the benefit of having more ROs saturates
• Local variation can only be captured by in-situ monitors
4% 3%
Page 21
21
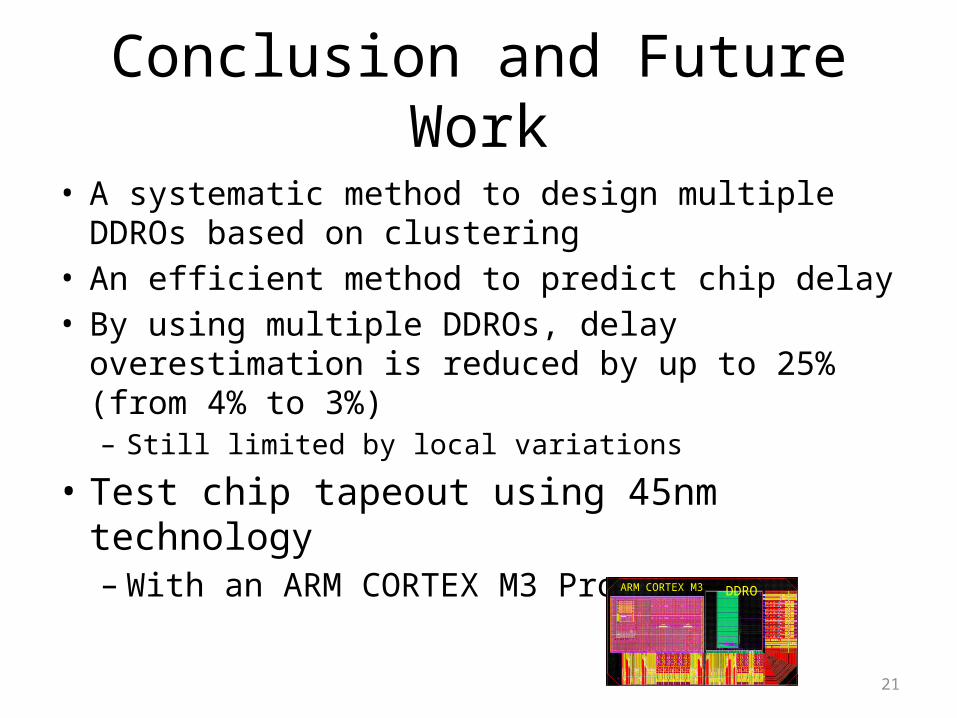
Conclusion and Future Work
• A systematic method to design multiple DDROs based on clustering
• An efficient method to predict chip delay • By using multiple DDROs, delay overestimation is
reduced by up to 25% (from 4% to 3%)– Still limited by local variations
• Test chip tapeout using 45nm technology– With an ARM CORTEX M3 Processor
ARM CORTEX M3 DDRO
Page 22
22
Acknowledgments
• Thanks to Professor Dennis Sylvester, Matt Fojtik, David Fick, and Daeyeon Kim from University of Michigan
Page 24
24
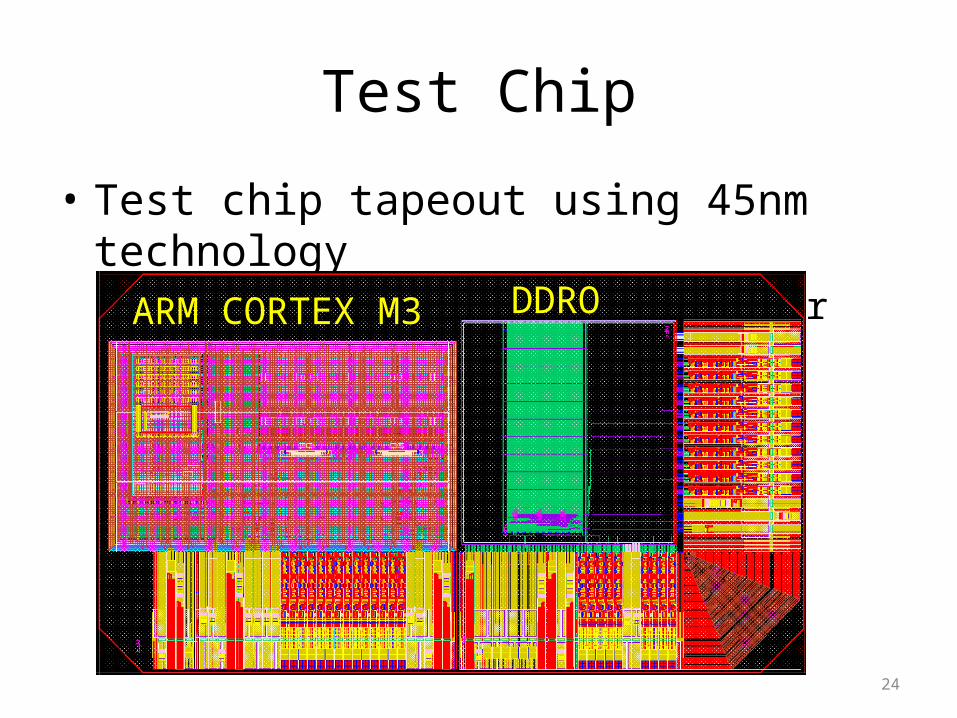
Test Chip
• Test chip tapeout using 45nm technology– With an ARM CORTEX M3 Processor
ARM CORTEX M3 DDRO
Page 25
25
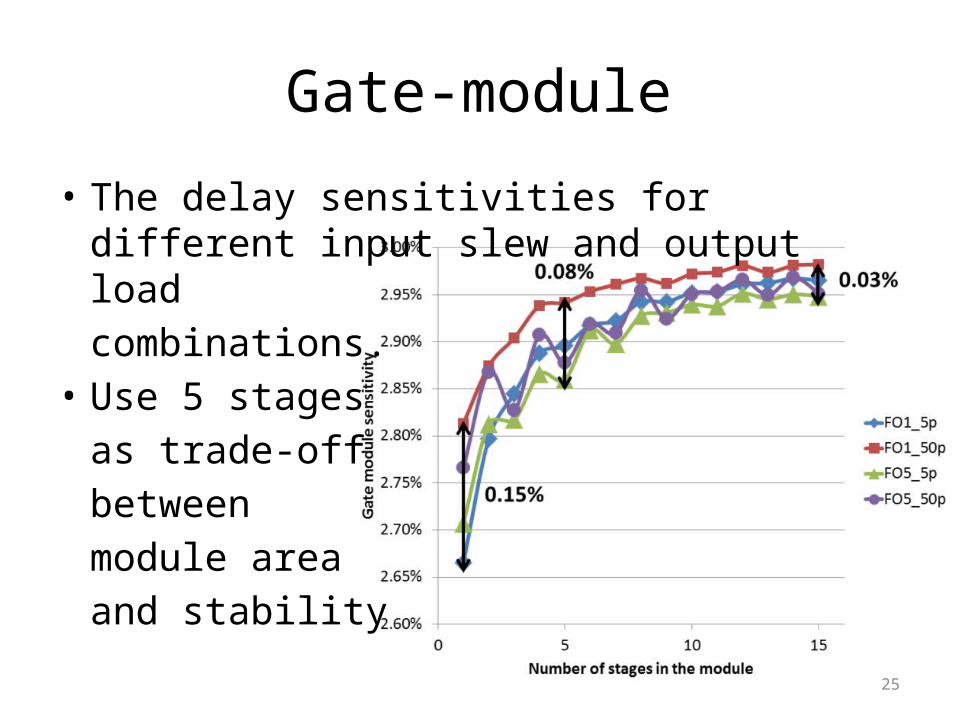
Gate-module
• The delay sensitivities for different input slew and output load combinations.
• Use 5 stagesas trade-offbetweenmodule areaand stability
Page 26
26
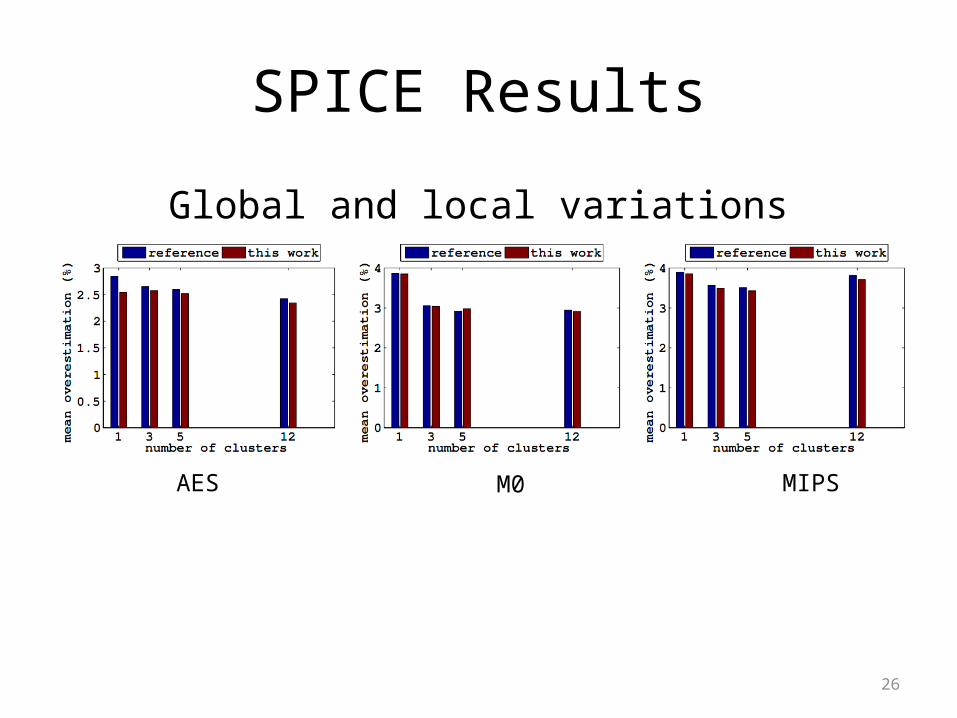
SPICE Results
Global and local variations
AES M0 MIPS
Page 27
27
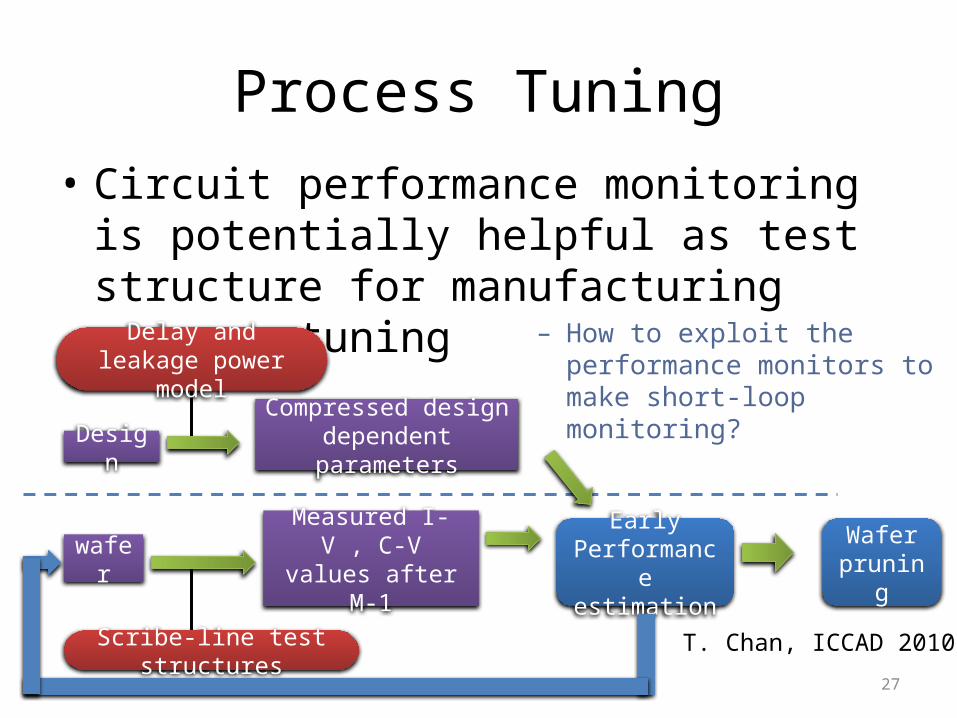
Process Tuning• Circuit performance monitoring is potentially
helpful as test structure for manufacturing process tuning
– How to exploit the performance monitors to make short-loop monitoring?
T. Chan, ICCAD 2010
Measured I-V , C-Vvalues after M-1
Scribe-line test structures
Compressed design dependent parametersDesign
Delay and leakage power model
waferEarly
Performance estimation
Wafer pruning
Page 28
28
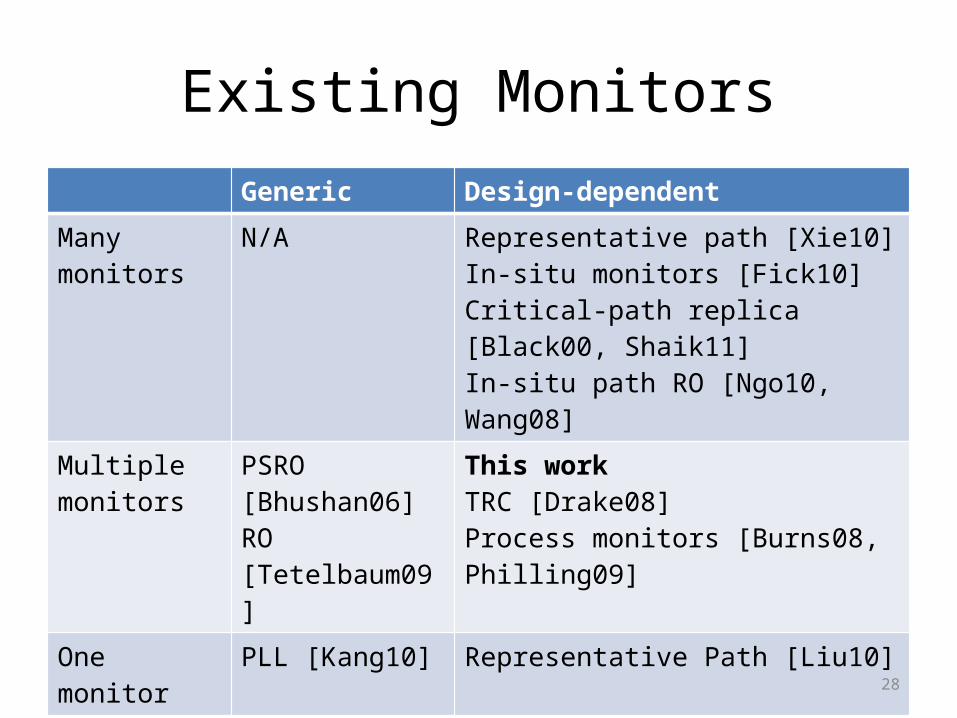
Existing MonitorsGeneric Design-dependent
Many monitors
N/A Representative path [Xie10]In-situ monitors [Fick10]Critical-path replica [Black00, Shaik11]In-situ path RO [Ngo10, Wang08]
Multiple monitors
PSRO [Bhushan06]RO [Tetelbaum09]
This workTRC [Drake08]Process monitors [Burns08, Philling09]
One monitor PLL [Kang10] Representative Path [Liu10]