35
Future of Manufacturing Project: Evidence Paper 31 Foresight, Government Office for Science De-industrialisation and the balance of payments in advanced economies

Future of Manufacturing Project: Evidence Paper 31
Foresight, Government Office for Science
De-industrialisation and the balance of payments in
advanced economies

De-industrialisation and the balance of payments in advanced
economies
By
Professor Robert Rowthorn & Professor Kenneth Coutts
Faculty of Economics, Cambridge University
October 2013
This review has been commissioned as part of the UK Government’s Foresight Future of Manufacturing Project. The views expressed do not represent policy of any government or organisation.

Contents 1. Executive summary .....................................................................................................................4
2. Deindustrialisation .......................................................................................................................6
3. Quantification.............................................................................................................................13
4. Accounting for deindustrialisation..............................................................................................16
5. North – South Trade ..................................................................................................................18
5.1 The USA and the UK compared.............................................................................................18
5.2 Production ..............................................................................................................................19
6. International trade......................................................................................................................22
7. Focus on the UK........................................................................................................................25
8. The balance of payments ..........................................................................................................27
9. Strong and weak industries in UK manufacturing......................................................................30
10. The future ................................................................................................................................33
References ....................................................................................................................................34

1. Executive summary This paper defines de-industrialisation as a secular decline in the share of manufacturing in national employment. De-industrialisation, in this sense, has been a universal feature of economic growth in advanced economies in recent decades. The paper considers briefly what explains this development and quantifies some of the factors responsible. It then examines the experience of Britain and America, which are two countries that prior to the 2008 financial crisis combined rapid de-industrialisation with a strong overall economic performance. The paper considers both the domestic situation of manufacturing industry in these countries and its foreign trade performance. It concludes by examining in detail the British balance of payments, and documenting how improvements in the non-manufacturing sphere have helped offset a worsening performance in manufacturing trade. The main findings of the paper are as follows. The UK: an extreme case All advanced economies have seen a shift in the composition of national employment away from manufacturing and towards services. The decline in manufacturing employment began earlier in the UK and has gone further than in most other advanced economies. Less than one tenth of our employed population is now engaged in manufacturing as compared to one third in the 1960s. Most of the rest are employed in services. Even an industrial powerhouse like Germany has experienced a prolonged decline in manufacturing employment, although its manufacturing sector is still much larger than ours. In 2008, before the full impact of the financial crisis, the employment share of manufacturing was 19% in Germany and under 10% in the UK. Causes The factors responsible for the relative decline in manufacturing employment can be classified as follows. Internal: These are factors that would operate even in a closed economy without foreign trade. Of these the most important is the above average rate of growth of labour productivity that is typically observed in the manufacturing sector, which allows the sector to shed labour whilst enjoying, in most cases, a rapid growth in output. Shifting patterns of domestic expenditure may also play a role. External: The size of the manufacturing sector is also influenced by a country’s role in the international division of labour. A country that specialises in the export of manufactured goods, like Germany, will typically have a larger manufacturing sector than a country like the UK that specialises in the export of services. Another factor is “North-South” trade. Much labour-intensive production, such as clothing, has been outsourced from rich countries to poorer countries where wages are low. Rich countries now concentrate on high-value manufactured exports which, pound for pound, contain much less labour than the manufactured goods they import from poorer countries. The above division into internal and external factors is only a first approximation, and in practice these factors are inter-related.
4
De-industrialisation and the balance of payments in advanced economies

5
Quantification An econometric analysis is used to quantify the factors responsible for the decline in the employment share of manufacturing in advanced economies. It finds that on average more than half of this decline is explained by internal factors, such as above average productivity growth in the manufacturing sector and shifting patterns of domestic expenditure. The outsourcing of labour-intensive manufacturing to low-wage countries also played a significant role, accounting for between one sixth and one quarter of the decline in the share of manufacturing. The UK Between 1973 and 2008, the employment share of UK manufacturing fell by 18.6 percentage points. This decline is considerably larger than predicted by the econometric equations. Further investigation suggests that internal factors account for about two thirds of the decline UK manufacturing employment. The remainder is explained by the changing composition of our external trade and payments. One such change is the outsourcing of the production of labour intensive manufacturing to low-wage economies. Another is the replacement of net manufactured exports by other sources of foreign exchange, mainly service exports and income from overseas investments. Between 1973 and 2008, net manufactured exports (= exports minus imports) declined from +2% of GDP at the start of the period to -4% at the end. The resulting decline in demand for manufactured goods produced in the UK contributed to the decline in manufacturing employment, but it was not the main factor. Special case The UK is unusual in two respects. It has experienced the largest decline in manufacturing employment of any advanced economy. It has also experienced the biggest post-war deterioration in its manufacturing trade balance. No other advanced economy has gone from surplus to deficit in its manufacturing trade in such a spectacular fashion as the UK has done over the past sixty years. This transformation in our external trade is often taken as a sign of intrinsic weakness in the manufacturing sector. We do not deny that such weaknesses have played a role, but we also argue that this transformation may also be a reflection of positive developments elsewhere in the economy. There are sectors of UK manufacturing which remain competitive in international trade in the sense that they have a positive or improving trade balance. These sectors include chemicals and pharmaceuticals, machinery and equipment, and aerospace. The deficit on motor vehicle production has declined substantially over the past decade. The UK now enjoys large net earnings from the export of services and can, within limits, afford to have a manufacturing trade deficit. However, we argue in a companion paper, that things have gone too far. The present deficit in manufacturing trade is too large and a significant improvement is this area is required.
De-industrialisation and the balance of payments in advanced economies

2. Deindustrialisation In the course of economic development most countries follow a broadly similar trajectory. As development gets under way, the share of agriculture in national employment falls and there is a rapid increase in the share of manufacturing. This process is known as ‘industrialisation’. At a certain point, however, the share of manufacturing stabilises and then starts to fall back again. There is a corresponding increase in the share of services in national employment. By analogy with the preceding phase, this falling share of manufacturing is often described as ‘de-industrialisation’. Note that we are talking here about relative shares. If total employment is growing fast enough, then the share of manufacturing may decline even though the absolute number of people working in this sector is actually rising. Note also that employment is not the same thing as production. In many advanced economies, manufacturing productivity is increasing rapidly with the result that this sector is producing more output with fewer workers. De-industrialisation in employment terms does not as a rule imply falling production. Chart 1 provides information about the manufacturing sector in the G7 countries. There has been a dramatic fall in the share of this sector in national employment in all of the countries shown. This has been matched by a similar decline in the share of manufacturing in GDP or value-added measured at current prices1. As can be seen from Chart 2, the employment share of manufacturing has also fallen in the newly industrialised countries of East and South East Asia.
1 Gross domestic product = gross value added + taxes on products – subsidies on products
6
De-industrialisation and the balance of payments in advanced economies

0
5
10
15
20
25
30
35
40
1960 1970 1980 1990 2000 2010 2020
percent
Chart 2. Manufacturing Employment Share: Selected East Asian Economies 1966‐2008
Korea
Taiwan
Malaysia
SingaporeSource: ILO, Stan database, Republic of China Statistical
The causes and significance of de-industrialisation have been debated with fluctuating intensity since the process first began. Some commentators regard declining manufacturing employment as a symptom of economic failure and a harbinger of impending impoverishment. For them the primary objective of public policy should be to halt or reverse this process. Others regard declining manufacturing employment as a normal feature of economic growth in advanced economies. They see it as an inevitable feature of structural change that may create serious problems in the short and medium run, but is potentially beneficial in the longer run. For these commentators, the primary aim of public policy should be to facilitate change and smooth the transition to a new economic structure. In reality, the choice is never quite as stark as this and most commentators take an intermediate position. They recognise the inevitability and potential benefits of structural change, but they also believe that some of the developments in manufacturing may be both undesirable and avoidable. Such developments may reflect the failings of specific industries or firms that would have a viable future if their failings could be overcome2. A variety of reasons have been put forward to explain why the employment share of manufacturing should fall in advanced economies. These include the following: Classification. Certain activities, such as design, catering and transport that were previously performed in-house by manufacturing firms are increasingly performed by specialist service providers. This represents a re-classification rather than a genuine shrinkage in the manufacturing sector. A wider definition of the manufacturing sector would include all of the service inputs that are embodied in the final output of this sector.
2 See Rowthorn and Wells (1987) for an extensive discussion of this and related issues.
7
De-industrialisation and the balance of payments in advanced economies

If this were done, the manufacturing sector would appear larger than it is in official statistics and employment in this broadly defined sector would have declined less than these statistics imply. Thus, part of the decline in manufacturing employment may be a statistical artefact caused by shifting classification. Many modern manufacturing firms provide services as well as physical products to their customers. These include design and development, installation and implementation, leasing, maintenance and support, systems and solutions, and many other services. Neely et al (2011) estimate that around 30% of manufacturers with over 100 employees offer services globally. The proportion is higher than average in the USA (55% in 2011) and although the proportion is much lower in China (20%) it is increasing rapidly. As manufacturing firms provide new services to their customers or outsource previously in-house activities to specialist service providers, it becomes increasingly difficult to delineate the boundaries of the manufacturing sector and hence to determine the true scale of employment decline in this sector. However, it seems implausible that such changes account for more than a modest fraction of the huge recorded fall in the share of manufacturing employment in advanced economies over the past thirty years. Consumption. As incomes rise in poorer countries during the course of industrialisation, the proportion of expenditure devoted to food declines, and consumers purchase more manufactured goods. This is known as Engel’s Law. The sociologist Daniel Bell (1976) in his theory of post-industrial society predicted that the pattern of consumer demand would eventually shift away from manufactures towards services. The evidence for “Bell’s Law”, as it might be called, is mixed. It is true that the share of monetary income spent on manufactured goods is now falling. However, this is not because the real quantity of manufactured goods consumed in rich countries is stagnating. On the contrary, as everyone knows from personal experience, the amount of electronic and mechanical goods consumed by the average citizen of these countries is mushrooming. The falling share of monetary income spent on such goods is not due to the saturation of demand for manufactures, as Bell’s Law would imply. What it mainly reflects is a rapid fall in the relative price of manufactures. Rising imports from low wage countries, together with rising productivity at home, mean that manufactured goods in the advanced economies are now so cheap that consumers can buy a lot more of these goods whilst spending a smaller fraction of their income on them.
International Trade. International trade affects manufacturing employment in a variety of ways. It may increase productivity in the manufacturing sector by stimulating competition and encouraging domestic firms to produce more efficiently. Competition from imports may also increase productivity by eliminating low value-added activities or inefficient firms. To pay for manufactured imports a country may export other types of manufactured goods or items such as food or services, it may use its income from foreign investments, or it may borrow. These responses have diverse implications for the domestic manufacturing sector. Of particular interest for the structure of employment in advanced economies (the “North”) is trade with low-wage, developing countries (the “South”). To the extent that the purchase of manufactured goods from low-wage countries is financed by the export of manufactured goods from the advanced economies this will generate new manufacturing jobs in the exporting countries. For example, in return for clothes from Bangladesh the advanced economies may export sophisticated equipment. This exchange will eliminate jobs in the clothing industry of the advanced economies but create new jobs in their
8
De-industrialisation and the balance of payments in advanced economies

equipment-producing industries. However, the number of jobs lost in the low value-added clothing sector will be much greater than the new jobs created in the high value-added equipment industries3. As a result, there will be a net loss of jobs in the manufacturing sector as a whole even though the value of manufactured goods exported is equal to the value of manufactured goods imported. Investment. Expenditure on fixed capital has a large manufacturing component in the form of equipment, construction materials and the like. An increase in the rate of investment will therefore increase the share of manufactured goods in total demand, and thereby raise the share of manufacturing in real output and employment.
Labour Productivity. By definition, the growth rate of output per worker is equal to the growth rate of output minus the growth rate of employment. Thus, if output in two sectors is increasing at the same rate, the sector with the faster productivity growth will have the slower employment growth and vice-versa. The employment share of the most dynamic sector will decline. This is simply a matter of arithmetic. Official statistics indicate that, prior to the recent crisis, the real output of manufactured goods in the average advanced economy was growing at about the same rate as the economy as a whole (table 1). Since the non-manufacturing part of a modern economy consists mainly of services, this implies that the real output of services and manufactures were on average growing at about the same rate. One notable exception was the UK where manufacturing output grew much slower than the output of services. We shall return to this point below.
Table 1. Manufacturing Output and GDP compared
Annual percentage growth rates 1980-2007 Manufacturing Whole Economy (GDP) Difference col (1) col (2) col (1)-col (2)
United States 3.43 3.07 0.36 Belgium 1.69 2.16 -0.46 Canada 2.19 2.78 -0.59
Denmark 1.21 2.15 -0.93 Finland 4.78 2.74 2.04 France 1.37 2.09 -0.72
Germany 1.40 1.93 -0.53 Italy 1.39 1.80 -0.41
Japan 2.67 2.49 0.19 Korea 9.38 7.21 2.17
Netherlands 2.49 2.51 -0.02 Norway 0.91 2.90 -1.99 Spain 2.20 3.05 -0.85
Sweden 4.07 2.39 1.68 Taiwan 6.40 6.21 0.18
United Kingdom 1.04 2.74 -1.70 Sources: Manufacturing output from BLS, GDP from IMF
3 This point is explored at length below.
9
De-industrialisation and the balance of payments in advanced economies

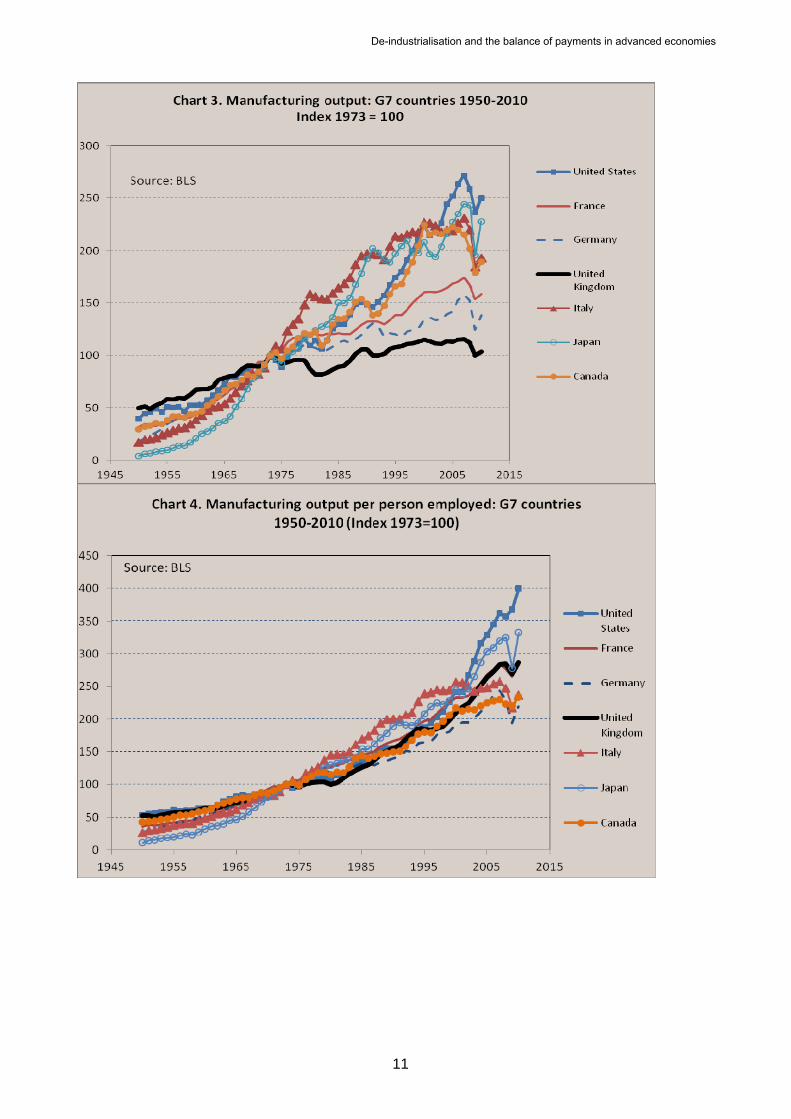
The statistics also indicate that in most countries the growth rate of labour productivity in the manufacturing sector has been faster than in services and in the economy as a whole. To maintain its share of real output, the manufacturing sector has required a decreasing share of total employment. Conversely, to maintain its share of real output, the service sector has required an ever-increasing share of employment, which it has acquired mainly at the expense of manufacturing4. This arithmetic suggests that the relative decline of manufacturing employment has been mainly the result of rapid productivity growth in this sector. In their paper on the United States, Triplett and Bosworth (2003) show that productivity growth in the service sector has accelerated markedly in recent times. However, manufacturing industry has experienced a similar acceleration, so the gap between productivity growth in manufacturing and services remains significant5. Chart 3 to 5 show what has happened to manufacturing output, productivity and employment in the G7 countries since 1950. Prior to the climacteric in 1973 manufacturing output grew strongly in all of these countries. In most of them the growth of output has slowed down since then, although over the period 1973-2010 as a whole most of them experienced a substantial increase in production (chart 3). The UK is an exception in this respect and, following the recent crisis, aggregate output in the manufacturing sector is now much the same as it was in 1973.
4 This argument was first advanced systematically byLengellé (1966), Baumol (1967) and Fuchs (1968) and was developed at length in Baumol, Blackman and Wolff (1989). Oulton (2001) presents a more optimistic view of the potential for productivity growth in services. 5 Table 1 of Triplett and Bosworth (2003) indicates that the annual growth rate of labour productivity in 27 service industries (employment weighted) was on average 1.5% over the period 1987-95 and 2.6% over the period 1995-2000. According to BLS statistics for output per worker hour, manufacturing productivity grew by 2.9% and 4.0% per year respectively. Thus, in each period manufacturing productivity growth was around 1.3% a year faster in manufacturing.
10
De-industrialisation and the balance of payments in advanced economies
11
De-industrialisation and the balance of payments in advanced economies

12
In all of the countries shown, labour productivity increased rapidly, if irregularly, throughout the entire sixty year period (chart 4). 6 Prior to the climacteric in 1973, manufacturing output increased so fast that manufacturing employment rose in absolute terms despite the fact that less labour was required to produce each unit of output. The situation altered when output growth slowed down after 1973. From then onwards, manufacturing employment began to fall as output growth was no longer fast enough to keep up with rising labour productivity, so that more output was being produced using fewer workers (chart 5). In the UK, this turning point was reached in 1966, whereas in Japan it was delayed until 1992. Of all the major advanced economies, the UK has experienced by far the largest proportionate fall in the number of people employed in manufacturing and in the share of this sector in total employment.
6 Chart 4 shows what happened to output per person employed in the manufacturing sector, but the picture is similar for output per worker hour.
De-industrialisation and the balance of payments in advanced economies

3. Quantification In an article written for the IMF some years ago, Rowthorn and Ramaswamy sought to quantify some of the above effects7. Between 1970 and 1994 the employment share of manufacturing in the advanced economies as a whole fell by 8.7 percentage points. They estimated that about four-fifths of this decline was due to internal factors such as productivity growth and changing expenditure patterns, and about one fifth to trade with low wage economies. They also estimated that for every 4.4 manufacturing jobs that were lost thorough competition from imports from low-wage countries, there was on average one new manufacturing job created through the export of more sophisticated manufactured goods to these countries8. Rowthorn and Coutts (2004) obtained a somewhat larger figure for the ratio between jobs lost and jobs gained through trade with low wage economies. The above estimates are now quite old and may have been overtaken by events. We have therefore updated the previous econometric analyses. Our analysis in this paper uses almost the same panel of 23 industrial countries as Rowthorn and Coutts (2004) over the somewhat longer time period 1962-20089. As before, the regression analysis is based on an equation of the following form,
Where EMPSHARE is the share of manufacturing in civil employment, Y is per capita income and the Zi are other variables. The latter may include dummy variables for individual countries to correct for international differences in measurement practices and other unexplained 'fixed' effects. There is also a dummy for Germany to allow for the impact of reunification in 1990 and subsequent adjustment. In one formulation we include
as an explanatory variable. To capture the influence of international trade on
economic structure, there are three variables, MANTRADEBAL, OPEN and LDCIMP. The first of these variables is the overall trade balance in manufactured goods (total exports minus total imports); the variable OPEN is equal to manufactured exports plus imports, and LDCIMP is equal to manufactured imports from developing countries. All trade variables are expressed as a percentage of GDP measured in US dollars at current market prices.
3(log )e Y
The purpose of MANTRADEBAL is to capture the effect of overall manufacturing trade performance on the structure of employment. Roughly speaking, this variable measures the impact of a change in net manufactured exports which is offset by an equal and opposite change in the net exports of other types of goods and services10. The variable
errorZaYaYaaEMPSHAREi
iiee 2
2210 )(loglog
7 Rowthorn and Ramaswamy (1999). 8 Rowthorn and Ramaswamy (1999). 9 The only difference is that Belgium is used in this paper in place of Belgium-Luxemburg. Given the small size of Luxemburg the difference is trivial. 10 This statement would be exact if the overall balance of trade (manufactures plus non-manufactures) were always equal to zero. In this case, any changes in the manufacturing trade balance would always be accompanied by an equal and opposite change in the non-manufacturing balance. Ideally, the regression equation should include an additional variable NONMANTRADEBAL to allow for the effect of independent changes in the non-manufacturing trade balance on the structure of employment. Unfortunately, the relevant data on non-manufacturing trade are not readily available. In practice, this may not be a serious problem,
13
De-industrialisation and the balance of payments in advanced economies

LDCIMP is designed to capture the additional effects of competition from low-wage countries on manufacturing employment in the advanced economies. These effects include increased efficiency in activities that compete directly with low-wage producers, together with shifts in the composition of manufacturing towards higher value-added, skill-intensive or capital-intensive activities. The variable OPEN is included to see whether greater openness to foreign trade leads to higher relative labour productivity in manufacturing, and hence less employment, in the manufacturing sector.
Finally, there is the variable FIXCAP, which is gross domestic fixed capital formation expressed as a percent of GDP at current market prices. The rationale for using this variable is that capital investment is manufacturing-intensive, so that an increase in the rate of investment should skew demand toward the manufactured goods. Provided the goods in question are produced at home, this will stimulate employment in the domestic manufacturing sector.
Table 2
Explaining the Share of Manufacturing in Employment, Regression Equations 1962-2008
(Dependent variable = EMPSHARE) Equation Number
Explanatory Variables
(1) (2) (3)
(4)
Loge Y 114.95*** (17.25)
122.43*** (26.17)
122.49*** (27.41)
316.09** (76.58)
(Loge Y)2 -6.19*** (17.69)
-6.61*** (26.78)
-6.57*** (27.87)
-27.14** (8.19)
(Loge Y)3 0.724* (2.53)
MANTRADEBAL 0.312*** (19.42)
0.215*** (12.33)
0.291*** (15.83)
0.207** (11.71)
OPEN
-0.098*** (9.78)
LDCIMP -0.844*** (8.34)
-0.697*** (8.33)
-0.287** (3.19)
-0.742*** (8.70)
FIXCAP 0.186** (6.13)
0.336*** (12.92)
0.347*** (13.96)
0.332** (12.78)
Country dummies No Yes Yes Yes
R2 0.589 0.864 0.876 0.877
Turning Point 10.400 10.567 11,189 10,206
N-S Balanced Trade Ratio
3.71 4.24 3.50 4.59
Notes: ‘***’, ‘**’,‘*’ denote significance at the 0.1%, 1%, 5% levels respectively; absolute t-values shown brackets; constant terms are omitted for clarity. All regressions are based on a sample consisting of the following countries: Australia, Austria, Belgium, Canada, Denmark, Finland, France, Germany, Greece, Ireland, Italy, Japan, Korea, Netherlands, New Zealand, Norway, Portugal, Spain, Sweden, Taiwan, United Kingdom, and United States.
since in most of the countries in the sample, for much of the time, the overall current account, and by implication, the overall trade balance (manufactures plus non-manufactures), is close to zero. ..
14
De-industrialisation and the balance of payments in advanced economies

15
Variables are defined as follows: EMPSHARE = percentage share of manufacturing in civil employment Y = GDP per capita at PPP in constant 1995 international dollars MANTRADEBAL = manufactured exports – manufactured imports OPEN = manufactured exports + manufactured imports LDCIMP = manufactured imports from developing countries (UN definition - excludes Korea, Malaysia, Singapore and Taiwan; includes China) FIXCAP = gross domestic fixed capital formation MANTRADEBAL, OPEN, LDCIMP and FIXCAP are all expressed as percentages of GDP at current market prices. Exports are measured fob and imports are measured cif. In addition to country dummies (fixed effects) there is an adjustment dummy for Germany to allow for the effects of re-unification. The reunification dummy is equal to zero for t ≤ 1990, (t-1990)/6 for 1991 < t ≤ 1996 and to 1 thereafter. All equations include this reunification dummy.
Table 2 reports the econometric results using pooled data from all countries in the sample over the whole time period 1962-2008. There is strong evidence of a hump-shaped relationship between manufacturing employment and per capita income. The employment share of manufacturing rises in the earlier stages of economic development and falls back at high levels of per capita income. The estimated turning point is somewhat less than $10,500 (1995 PPP) per capita which many OECD countries had reached by 1970 and some well before. A number of the more advanced Asian economies have now surpassed this point and the share of manufacturing employment has been falling in these countries for some years. The coefficient of LDCIMP is negative and significant, supporting the view that imports from low-wage economies impact negatively on manufacturing employment in the industrial countries even when they are accompanied by an equivalent dollar value of manufactured exports in the opposite direction. The coefficient of OPEN is negative and significant, suggesting that more open economies have higher productivity, and therefore less employment, in manufacturing. The regressions also indicate that fixed capital formation exerts a positive influence on manufacturing employment. As expected, the overall trade balance in manufactures has a significant impact on manufacturing employment. The coefficient of MANTRADEBAL is positive and highly significant in all equations, suggesting that countries with a large trade surplus in manufactures tend to have a larger than average manufacturing sector. The magnitude of this coefficient is consistent with the results obtained in Rowthorn and Ramaswamy (1999) and Rowthorn and Coutts (2004). Depending on the equation, the coefficient of MANTRADEBAL is between 0.2 and 0.3. This is probably too low. Calculations based upon the UK input-output tables for 2008 give a value for this coefficient in the range 0.4 to 0.5. These calculations are reported in appendix 1.
De-industrialisation and the balance of payments in advanced economies

4. Accounting for deindustrialisation This section uses the regression results shown in table 2 to quantify the influence of various factors that have contributed to de-industrialisation over the period 1973-2008. Table 3 presents two distinct sets of calculations based on equations (1) and (2) from table 2. Other equations yield similar results. The headings in table 3 are self-explanatory with the exception of the component labelled “normal growth”. This component covers all of the effects which would normally be associated with rising per capita income in a closed economy, and thus takes into account both the income elasticity of demand for manufactures and the influence of normal productivity and price changes. It is estimated from the coefficients of logY and (logY)2 in the relevant equation. Note that this component excludes the effect of output and productivity changes due to international trade, in particular the abnormal productivity growth induced by competition from low-wage imports. These are included under the various trade headings. The main conclusion from our decomposition is that trade with low wage economies (North-South trade) has been a significant factor behind recent de-industrialisation in many of the countries in our sample. However, it has been less important than internal factors such as productivity growth and shifting patterns of domestic demand. In the sample as a whole, such internal factors were two to three times as important as North-South trade in accounting for the relative decline of manufacturing employment since 1973. One puzzling feature of the results is the large unexplained negative residual for the United Kingdom, where the share of manufacturing employment has fallen by much more than the predicted amount. Part of the explanation may be that the impact of trade, in the UK case at least, is underestimated by the regression equations. In these equations the coefficient of MANTRADEBAL is between 0.2 and 0.3. With an arguably more realistic coefficient of around 0.45 (as implied by the UK input-tables), this would explain another 2 percentage points of the decline in the manufacturing employment share. However, it would still leave an unexplained residual of more than 4 percentage points. An examination of the trajectory of the equation residuals suggests that much of this unexplained decline took place during the initial years of the Thatcher government after 1979, reflecting perhaps the big-shake out in manufacturing jobs during this period. This issue deserves further investigation.
16
De-industrialisation and the balance of payments in advanced economies

Table 3 Accounting for De-industrialisation 1962-2008
Change in: Change due to:
Percentage share of employment Normal growth Investment
German restructuring
Total internal
North – South trade
Other Trade
Total Trade
Unexplained residual
Equation (1)
EU-3 -11.9 -5.6 -0.9 0.6 -5.9 -2.6 0.5 -2.2 -3.9
Japan -9.2 -6.0 -2.5 0.0 -8.5 -2.7 0.4 -2.2 1.6
Canada -11.2 -6.7 0.0 0.0 -6.7 -4.5 0.7 -3.7 -0.8
USA -12.2 -8.6 -0.3 0.0 -9.0 -4.3 -0.2 -4.5 1.3
UK -18.6 -6.9 -0.7 0.0 -7.6 -3.4 -0.9 -4.3 -6.6
Equation (2)
EU-3 -11.9 -6.2 -1.6 -1.5 -9.3 -2.1 0.3 -1.8 -0.9
Japan -9.2 -6.7 -4.5 0.0 -11.2 -2.2 0.3 -1.9 3.9
Canada -11.2 -7.4 0.0 0.0 -7.3 -3.5 0.5 -3.0 -0.9
USA -12.2 -9.4 -0.6 0.0 -10.0 -3.5 -0.2 -3.6 1.4
UK -18.6 -7.6 -1.3 0.0 -8.9 -2.7 -0.6 -3.3 -6.4
Notes: This table decomposes changes in the percentage share of manufacturing employment. Equation numbers refer to the regression results given in table 2. EU-3 is an unweighted average of France, Italy and Germany.
17
De-industrialisation and the balance of payments in advanced economies

5. North – South Trade From the estimates shown in Table 2 it is possible to calculate the impact of North-South trade on the structure of employment in advanced economies. The answer depends to some extent on which equation is used. Suppose that manufactured exports to the South increase by 1 percent of GDP. According to equation (2), this will cause the share of manufacturing employment to rise by 0.21 percentage points. Conversely, if manufactured imports from the South increase by 1 percent of GDP, the result will be a 0.91 percentage point fall in the share of manufacturing jobs. Thus, one dollar's worth of imports from the South destroys approximately 4.2 times as many Northern manufacturing jobs as are created by one dollar's worth of exports to the South11. Other equations yield ratios between 3.5 and 4.6 12. These estimates are similar to the estimate of 4.4 in Rowthorn and Ramaswamy (1999). Such calculations reveal the origin of the "balanced trade effect", whereby manufactured imports from the South reduce manufacturing employment in the North even when they are matched by an equal value of manufacturing exports from the North13. Calculations based on equation (1) of table 2 imply that, amongst the larger countries in our sample, imports from low-wage economies in the South have eliminated manufacturing jobs equivalent to between 3 percent and 5 percent of total employment since the early nineteen sixties. The corresponding estimates for new manufacturing jobs created by exports to the South are in all cases less than 1 percent of total employment. The other equations yield similar results. The structural changes implied by these figures are not huge when spread over a number of decades, but the impact on particular types of worker or on certain regions has been much greater than the aggregate figures would suggest.
5.1 The USA and the UK compared
The rest of this paper will focus mainly on the USA and the UK. These countries exhibit some important similarities. They both enjoyed a long period of rapid growth in per capita income prior to the financial crisis (Chart 6) and were often cited as models by those urging economic reform in the Eurozone and Japan. The USA increased its lead over these countries and the UK caught up or overtook many of its rivals. Maddison (2009)
11 These numbers are derived as follows. An increase of 1 percentage point in the ratio of manufactured exports from the North to GDP implies a change of +1 unit in the variable MANTRADEBAL. According to equation (2) in table 1, this will cause EMPSHARE to change by (0.215)(1) = 0.215 units. Conversely, suppose that the ratio of manufactured imports from the South to GDP increases by 1 percentage point. This will cause the variables MANTRADEBAL and LDCIMP to alter by -1 and +1 units respectively. From equation (2), it follows that EMPSHARE will change by (0.215)(-1) + (-0.697)(1) = -0.912. The balanced trade ratio in this case is equal to 0.912/0.214 = 4.24. 12This ratio of 3.5 is derived from equation (3) as follows. An increase of 1 percentage point in the ratio of manufactured exports from the North to GDP implies a change of +1 unit in the variables MANTRADEBAL and OPEN. According to equation (3), this will cause EMPSHARE to change by (0.291)(1) + (-0.098)(1) = 0.193 units. Conversely, suppose that the ratio of manufactured imports from the South to GDP increases by 1 percentage point. This will cause the variables MANTRADEBAL, OPEN and LDCIMP to alter by -1, +1 and +1 units respectively. From equation (3), it follows that EMPSHARE will change by (0.291)(-1) + (-0.098)(1) + (-0.287)(1) = -0.676. The balanced trade ratio in this case is equal to 0.676/0.193 = 3.5.
13 The balanced trade effect was first emphasised by Wood (1994).
18
De-industrialisation and the balance of payments in advanced economies

estimates that by 2008 GDP per capita in the UK was 7% higher than in France, 14% higher than in Germany and 4% higher than in Japan14.
In both the UK and the USA, a widely praised economic performance was accompanied by a massive fall in the employment share of manufacturing. Both countries experienced a prolonged decline in their manufacturing trade balance and in both of them this balance is now in deficit. There are also important differences. The USA still has the world’s strongest manufacturing sector, rivalled only by China in quantity, whereas manufacturing in the UK is in perennial difficulty. Although both countries now have a large deficit in their manufacturing trade, the significance of this deficit is different. The American deficit is financed mainly by borrowing abroad, whereas much of the British deficit is largely covered by income from overseas investments and by the rapidly growing earnings from knowledge-based services. Thus, although the UK has a much weaker manufacturing sector than the USA, its external position taken as a whole is stronger. Let us explore some of these points in more detail.
5.2 Production
Chart 7 compares production in the USA and the UK. The output series in this chart are measured in constant prices at purchasing power parity. This gets rid of differences caused by inflation, fluctuating exchange rates and different price levels in the two countries. The series are our own estimates and they are inevitably rather crude. However, they are accurate enough for their present purpose.
14 IMF estimates put Germany neck and neck with the UK and OECD estimates put Germany about 5% ahead, but otherwise they are similar to those of Maddison.
19
De-industrialisation and the balance of payments in advanced economies

As can be seen from the chart, the per capita output of manufactures was similar forty years ago in Britain and America. Productivity was much higher in America but this was offset by the fact that a much greater fraction of the British population was employed in the manufacturing sector. Since then manufacturing employment has fallen dramatically in the UK and the productivity gap between the two countries has got wider. As a result, the USA now produces roughly 70 percent more manufactured goods per head of population as the UK.
Table 4 UK and US Manufacturing Compared 1973- 2010
Annual percentage growth rates
Output Output per person
employed
Employment
USA
1973-2007 3.0 3.9 -0.8
2007-2010 -2.8 3.4 -6.0
1973-2010 2.5 3.8 -1.3
UK
1973-2007 0.4 3.1 -2.6
2007-2010 -3.5 0.4 -3.9
1973-2010 0.1 2.9 -2.7
Source: US Bureau of Labor Statistics
20
De-industrialisation and the balance of payments in advanced economies

21
The picture is more favourable to the UK in the service sector. Per capita output of services is lower than in the USA, but the gap has been closing steadily. This strong performance reflects the contribution of new service exports that have helped to raise the overall growth rate of the UK service sector. The contrast between manufacturing in the two countries can be illustrated by comparing what has happened to output and employment. Between 1973 and 2007, prior to the financial crisis, manufacturing output in the USA rose by 3.0% per annum and employment fell by 0.8% per annum (Table 4). Cumulatively, this implied an increase of 172 % in output and a fall of 25% in employment. Over the same period, manufacturing output in the UK rose by 16% and employment fell by a remarkable 58%. Whereas productivity growth in US manufacturing served mainly to increase output, in the UK it served mainly to reduce employment. This is the long-run picture, although since the financial crisis the situation has become more confused, with output falling sharply in both countries and the USA experiencing widespread job losses (Table 4). It remains to be seen whether pre-crisis trends will resume when economic recovery eventually occurs.
De-industrialisation and the balance of payments in advanced economies

6. International trade By definition, the manufacturing trade balance is equal to national production of manufactured goods minus national expenditure on such goods. Charts 8 and 9 show what has happened to these items in the UK and the USA. In both of these countries expenditure on manufactures has outstripped national production, with the result that both of them now have a large deficit in their trade balance in manufactures. The production of manufactures has grown much faster in America, but this has been surpassed by an even faster growth of expenditure on manufactures.
22
De-industrialisation and the balance of payments in advanced economies

23
De-industrialisation and the balance of payments in advanced economies

Further information on manufacturing trade is given in Chart 10 which compares the UK and the USA with other developed economies. The East Asian group – Japan, Korea and Taiwan – has a large, although fluctuating, trade surplus. The Eurozone as a whole has a manufacturing trade surplus which has been relatively stable as a percentage of GDP over the past fifty years. Within the Eurozone fortunes vary. Germany and other northern countries enjoy large and sometimes growing surpluses in their manufacturing trade, whilst France and the Mediterranean countries mostly have deficits on this item. Provided that some other source of revenue can be found, a manufacturing deficit is not important15. What matters is the overall balance of payments, which in addition to manufactures includes all current expenditures and receipts for such items as food, materials, fuel, services, transfers, and property income. Any loss of net revenue in manufacturing trade can in principle be made good by additional net revenue from these other items. Indeed, this is just what has happened in the British case. New sources of overseas income have been developed and a previously large deficit on such items as energy, food and raw materials (6-10% of GDP in the mid-1970s) has been reduced to a relatively small fraction of GDP (2.6% in 2011). Despite a prolonged and massive deterioration in manufacturing trade, Britain’s overall balance of payments is, for the time being at least, in moderately good shape. In contrast, the USA has not yet developed new sources of income to offset its worsening trade balance in manufactures. The contrast is reflected in the overall balance of payments of the two countries. In 2011, the UK had a current account deficit equal to 1.9% of GDP whereas the US deficit was more than 5% of GDP.
15 For a good discussion of this issue see Singh (1977).
24
De-industrialisation and the balance of payments in advanced economies

7. Focus on the UK The preceding discussion indicates how the UK has prospered and maintained a moderately sound balance of payments despite a weak manufacturing trade performance. This is an unusual combination that is worth exploring in more depth. To round off the paper we shall therefore examine the country’s balance of payments in more detail. The UK emerged from the Second World War in a difficult economic situation. Much of her overseas wealth had been lost in the war and revenue from this source was severely depleted. The price of imported food and raw materials was astronomical, and a huge manufacturing trade surplus was required to pay for vital imports. In 1950, the UK manufacturing trade surplus was 10% of GDP – more than three times its pre-war level, but even this was not sufficient to cover the even larger deficit on other items such as food and materials. The UK was still one of the great industrial nations of the world, but her situation seemed precarious. Moreover, international competition was about to intensify as the war-torn economies of Continental Europe recovered and new competitors appeared in Asia. In the event, things turned out quite well. The UK economy grew quite fast by its own historical standards, living standards rose, and the country did not go bankrupt. Even so, there was nagging unease as the country experienced periodic currency crises and her manufacturing trade surplus steadily shrank. Following a seminal article by Ajit Singh (1977), there was an intense debate, about why the manufacturing trade surplus had been shrinking and what this trend signified. Some saw it as a pathological development that could only end in disaster. Others, such as Rowthorn and Wells (1987), argued that it reflected long-run structural changes that were altering the shape of the UK economy and its relations with the rest of the world16. In the immediate post-war period, the country had needed a huge manufacturing trade surplus because there was no other way to pay for her large and expensive imports of food and raw materials. Now the UKwas less reliant on these items and their real price had fallen dramatically. Moreover, there were new sources of revenue, such North Sea Oil, services and income fromoverseas investments, which could be used to pay for imported food and raw materials. As a result, the previously huge deficit on non-manufacturing trade had disappeared and hence there was no longer the need to finance this deficit by earning a hugemanufacturing trade.
surplus on
The above description raises an interesting question. To what extent were the changes on the non-manufacturing side of the balance of payments fortunate accidents that compensated for an independently poor manufacturing trade performance? And to what extent did events on the non-manufacturing side of the balance influence manufacturing trade? For example, the exploitation of North Sea oil turned the UK from a major net importer of oil into net exporter and was accompanied by an appreciation of the real exchange rate. This made UK manufacturing firms less competitive, thereby damaging manufactured exports and stimulating imports. In this case, via its effects on the real exchange rate, an improvement in the non-manufacturing side of the balance caused the manufacturing trade balance to deteriorate17. This is an example of what at one time was
16 See Rowthorn and Wells (1987). 17 See Forsyth & Kay (1980, 1981)
25
De-industrialisation and the balance of payments in advanced economies

26
known as the ‘Dutch disease’. Oil is only one example. It is conceivable that other autonomous developments, such as the growth of invisible earnings, have also damaged manufacturing trade through their impact on the real exchange rate. To the extent this is true, the long-run deterioration in manufacturing trade balance may not indicate an intrinsic lack of competiveness, but may be an endogenous consequence to events elsewhere in the balance of payments. In our view, Rowthorn and Wells were correct to argue that Britain’s economy had become overspecialised by 1950, and that a substantial reorientation away from manufacturing towards other activities was inevitable, indeed, desirable. However, as we shall argue in another paper, things may have gone too far. Too much manufacturing capacity may have been shed, and the failure to develop a more dynamic manufacturing sector may eventually turn out to have serious consequences for the balance of payments and the overall prosperity of the country.
De-industrialisation and the balance of payments in advanced economies

8. The balance of payments The overall payments position of a country is normally measured by the so-called current account. In addition to manufactured goods, this account includes “other visibles”, such as food, fuels and raw materials, together with “invisibles”, such as services, income from overseas investments, migrants’ remittances and inter-governmental transfers. Chart 11 gives a breakdown of the UK current account into three major components: manufactures, other visibles, and invisibles. The general picture is as follows. The trade balance in manufactures has been on a downward trend for a long time and there is now a large deficit on this item. After a period of stability, the balance on “other visibles” has deteriorated in recent times, due to a combination of higher commodity prices and lower domestic oil and gas production. However, for most of the time these negative trends have been largely offset by improvements on the invisible side of the account, so the overall current account deficit has mostly been quite small been quite small for most of the time. It is uncertain whether this will continue to be the case in the future.
27
De-industrialisation and the balance of payments in advanced economies

Table 5 Components of Services and Property Income in UK Balance of Payments
Balances £ million % of GDP 1991 2008 2011 1991 2008 2011 Knowledge-based services
7425 78149 84510 1.3 5.5 5.6
of which: Insurance 585 11603 8013 0.1 0.8 0.5 Financial services 3023 39610 38663 0.5 2.8 2.6 Computers & Information 301 3941 5174 0.1 0.3 0.3 Other Business Services 3520 18121 25880 0.6 1.3 1.7 Other services -4 4874 6780 0.0 0.3 0.4
Traditional services & Transfers
-4554 -30886 -30346 -0.8 -2.2 -2.0
of which: Transport -633 2228 3169 -0.1 0.2 0.2 Travel -1925 -17658 -9942 -0.3 -1.2 -0.7 Government -765 -1691 -1357 -0.1 -0.1 -0.1 Transfers -1231 -13765 -22216 -0.2 -1.0 -1.5 Income -3307 32406 17133 -0.6 2.3 1.1of which: Direct Investment 8328 66401 48854 1.4 4.7 3.2 Portfolio & other income -11635 -33995 -31721 -2.0 -2.4 -2.1
Manufactures -3622 -57927 -60646 -0.6 -4.1 -4.0 Other goods -6601 -36155 -39697 -1.1 -2.5 -2.6of which: Energy 14 -13550 -19121 0.0 -1.0 -1.3
Food , beverages & tobacco
-3955 -17379 -17971 -0.7 -1.2 -1.2
Basic materials & misc. -2660 -4836 -2911 -0.5 -0.3 -0.2 Total = Current Account -10659 -14413 -29046 -1.8 -1.0 -1.9 Source: UK Balance of Payments Pink Book, ONS.
The overall improvement in invisibles conceals some widely divergent trends. Table 5 presents detailed information on this topic. On the one hand, net transfer payments to international institutions and others are increasing as a fraction of GDP, mainly due to increased government payments to the EU together with migrants’ remittances. Moreover, after rising strongly for some years, net investment income from overseas has
28
De-industrialisation and the balance of payments in advanced economies
29
fallen sharply from its 2008 peak and in the first half of 2012 there was actually a deficit on this item. On the other hand, there has been a dramatic growth in receipts from knowledge-based services, such as finance, insurance, consultancy and other business services. Within the space of twenty years, net earnings of this type have risen more than tenfold in monetary terms. In 1991, knowledge-based services, including finance and insurance, generated between them a net income for the UK equal to 1.3% of GDP. By 2011, this had risen to 5.6% of GDP.
De-industrialisation and the balance of payments in advanced economies

9. Strong and weak industries in UK manufacturing Chart 12 classifies manufacturing industries into three groups according to their trade performance: weaker, stable, and competitive. Weaker industries are defined as those that have a negative and worsening trade balance; competitive industries have a positive or an improving trade balance, and the rest are classified as stable (in deficit but with no trend deterioration).. The list of competitive industries includes coke and refined petroleum products, chemicals & pharmaceuticals, machinery & equipment, motor vehicles and other transport (aerospace and weapons).18 The list of weaker industries is large and includes such obvious ones as clothing or leather where domestic producers are suffering severe competition from low wage imports. It also includes less obvious ones such as electrical equipment, computer, electronic and optical products19.
18 We have separated motor vehicles from other activities within its sector and put it into the competitive group because it has substantially reduced its deficit over the past decade. The remaining component consisting of vehicle parts, trailers etc. is put into the stable group. 19 Some of the weaker industries’ decline may reflect the success of competition from low wage countries where firms have invested in technology transfer to close the gap in the frontier of technology with advanced economies (see Aghion and Howitt (2009). For other sectors, though, the weakness in trade performance may reflect lack of R&D investment to compete with other advanced countries.
30
De-industrialisation and the balance of payments in advanced economies

31
De-industrialisation and the balance of payments in advanced economies

In most manufacturing industries, imports and exports are increasing simultaneously, both absolutely and in relation to national production. In the strongest sectors, such as chemicals & pharmaceuticals or other transport, exports exceed imports and the balance is stable or improving. In weaker industries, the opposite is true. In some cases, total exports are increasing, but they are being outstripped by mushrooming imports. This is most obvious in computer, electronic and optical products, where exports rose by 80% between 1995 and 2001, but imports grew by 270%. The picture is similar, but less dramatic in wood, paper & printing, vehicle parts and the residual group “other manufacturing”. The fact that exports are increasing in such supposedly weak industries indicates that they still retain some areas of strength. This is confirmed by the fact that, in most of the weaker industries just listed, national production has been increasing. This should make us cautious about writing off such industries simply because their trade balance is negative and getting worse. However, there are a few manufacturing industries, such as textiles, leather & clothing, or basic metals, where both exports and production are falling. This is evidence of long-term decline, although even in these industries there must be areas of actual or potential strength, and they should not be written off prematurely.
32
De-industrialisation and the balance of payments in advanced economies

10. The future Predicting long run movements in the balance of payments is hazardous. This balance is the difference between two very large quantities (exports and imports) and quite small proportionate changes in these items can cause the balance to swing sharply from surplus to deficit or vice-versa. However, it is fair to say that the balance of payments situation is a cause for some concern. Projections that we present in a companion paper suggest that over the next decade there will be a persistent balance of payments deficit equal to roughly 3% of GDP20. In itself, this is not a huge figure and could be financed for some years by international borrowing. However, there is a danger that things may get worse. We have identified certain manufacturing industries where there is a continuing deterioration in trade performance. Moreover, the production of North Sea oil and gas is falling; energy and commodity prices may be on an upward trend; net investment income has fallen sharply; and UK transfer payments to others are increasing. To offset these negative developments will require continued improvement in other sectors, such as knowledge-based services or our more competitive manufacturing industries. The ideal would be to eliminate the current account deficit altogether, but short of this ideal it would still be a valuable achievement to stabilise the balance of payments and prevent a further worsening of our trade performance. This may be difficult to achieve without a strong manufacturing sector. The share of manufacturing in total exports has been falling, but this sector still accounts for almost half of Britain’s total exports of goods and services. Manufactured exports are almost three times larger than total earnings from the export of all knowledge-intensive services combined, excluding finance and insurance. Knowledge-intensive services are a vital and dynamic component of our exports, but they may not be sufficient to compensate for continued failings in the manufacturing sector. For the foreseeable future, manufactures will continue to play an important role in our foreign trade, and the health of our balance of payments will to a significant degree depend on what happens to manufacturing. To close the projected current account deficit through a stronger manufacturing trade performance would require an increase in net manufactured exports equal to around 3% of GDP. The input-output calculations reported in appendix 1 suggest that this would increase the share of manufacturing in GDP and in employment by around 1.8 and 1.5 percentage points respectively21. In job terms this would imply the employment of another half a million manufacturing workers. This is a substantial increase, but is not remotely sufficient to raise the share of manufacturing to anything like the German level. Moreover, such an increase would be superimposed on a long-run decline in the share of manufacturing in employment and GDP due to rapid productivity growth in this sector.
20 Coutts and Rowthorn (2013) 21 These figures are based on Row (4) of table A1.
33
De-industrialisation and the balance of payments in advanced economies

References Aghion, Philippe and Howitt, Peter (2009), The Economics of Growth, MIT Press, Cambridge Mass.
Baumol, W. J. (1967), “Macroeconomics of Unbalanced Growth: The Anatomy of Urban Crisis”, American Economic Review, Vol. 57 (June).
Baumol, W. J., S. Blackman, and E. N. Wolff (1989), Productivity and American Leadership: The Long View, Cambridge Massachusetts, The MIT Press.
Bell, D. (1976), The Coming of Post-industrial Society, Harmondsworth, Penguin Books.
Cosh, A. D., Hughes, A., and R. E. Rowthorn (1994), “The Competitive Role of UK Manufacturing Industry: 1950-2003” in K. Hughes (ed.) The Future of UK Industrial Competitiveness. Oxford, Oxford University Press.
Cosh, A. D., Coutts, K. and A. Hughes (1996), “Manufacturing, the Balance of Payments and Capacity” in J. Michie and J. Grieve Smith (eds) Creating Industrial Capacity, Oxford, Oxford University Press.
Coutts, K. and W. Godley (1990) “Prosperity and foreign trade in the 1990s: Britain’s strategic problem”, Oxford Review of Economic Policy, vol. 6:3, pp. 82-92.
Coutts, K. and R. E. Rowthorn (2013), “Prospects for the UK Balance of Payments”, BIS.
Forsyth, P. J. and Kay, J. A. (1980), “The Economic Implications of North Sea Oil Revenues. Fiscal Studies, vol. 1:3, pp.1–28.
Forsyth, P. J. and J. A. Kay (1981), “Oil Revenues and Manufacturing Output”, Fiscal Studies, vol 2. No. 2. pp. 9-17.
Fuchs, V. R. (1968), The Service Economy, New York, NBER.
Lengellé, M. (1966), The Growing Importance of the Service Sector in Member Countries, Paris, OECD.
Maddison, A, (2009), Statistics on World Population & GDP, www.ggdc.net/maddison/
Neely, A., Benedettini, O. and I. Visnijic (2011), “The servitization of manufacturing: Further evidence”, Cambridge University, mimeo.
Oulton, N. (2001), "Must the Growth Rate Decline? Baumol's Unbalanced Growth Revisited," Oxford Economic Papers, Oxford University Press, vol. 53(4), pages 605-27, October
Rowthorn, R. E. and J. R. Wells (1987), De-industrialisation and Foreign Trade, Cambridge, Cambridge University Press.
Rowthorn, R. E. and R. Ramaswamy (1999), “Growth, Trade and Deindustrialization”, IMF Staff Papers, vol. 46, no. 1, pp. 18-41.
Singh, A. (1977), “UK Industry and the World Economy: A Case of De-Industrialisation”, Cambridge Journal of Economics, vol. 1, no. 2, pp.113-36
Triplett, J.E. and B. P Bosworth (2003), “Productivity Measurement Issues in Services Industries: “Baumol’s Disease Has Been Cured”, Federal Reserve Bank of New York Economic Policy Review, September, pp. 23-33
UNCTAD (2003), Trade and Development Report 2003, United Nations Conference on Trade and Development, Geneva.
Wood, A. (1994), North-South Trade, employment and Inequality: Changing Fortunes in a Skill-Driven World, Oxford, Clarendon Press.
34
De-industrialisation and the balance of payments in advanced economies

© Crown copyright 2013 Foresight 1 Victoria Street London SW1H 0ET www.bis.gov.uk/foresight URN 13/841


