Page 1
Deactivation of hydroprocessing catalysts
Edward Furimskya,*, Franklin E. Massothb
aIMAF Group 184 Marlborough Avenue, Ottawa, Ont., Canada K1N 8G4bDepartment of Fuels Engineering, University of Utah, Salt Lake City 84112, UT, USA
1. Introduction
Hydroprocessing of commercial feeds is exten-
sively practised in the petroleum industry, and to some
extent in coal liquefaction and in upgrading of syn-
thetic fuels. The process, employing a molybdenum
catalyst supported on a high surface area transition
alumina and promoted by cobalt or nickel, is carried
out in a trickle-bed reactor or ebullating-bed reactor at
elevated temperature and hydrogen pressure.
Hydroprocessing catalysts are quite versatile, exhi-
biting activity for a number of important reactions.
Those of major interest in hydroprocessing are
removal of heteroatoms, viz hydrodesulfurization
(HDS), hydrodenitrogenation (HDN), hydrodemetal-
lation (HDM), and for coal-derived liquids, hydro-
deoxygenation (HDO). These reactions involve
hydrogenolysis of C-heteroatom bonds. An important
attendant reaction is hydrogenation of aromatics
(HYD). Typical classes of these reactants are shown
in Fig. 1 Hydrogenolysis of C±C bonds is generally
minor, except when hydrocracking catalysts are
employed.
For relatively light feeds, deactivation of the cata-
lyst is minimal and the process can operate for long
periods of time before replacement of the catalyst.
However, in hydroprocessing heavy residues, catalyst
deactivation can be severe, having an important com-
mercial economic consideration with respect to cata-
lyst lifetime. Similar deactivation is experienced in
hydroprocessing coal liquids.
Hydroprocessing reactions occur on the active sites
of the catalysts. Also, a suitable pore size distribution
is required to ensure the access of reactant molecules
to the active sites. A main reason for deactivation of
the catalysts involves loss of active sites. A number of
basic causes for this loss are listed in Table 1. Block-
ing of pore mouths, of course, render still active sites
unavailable to reactants, while pore mouth restriction
could accentuate diffusional limitations on reaction
rates. Irreversible site poisoning would reduce the
number of sites available for reaction, and may be
more severe on promotional sites. Sintering of the
active slabs, comprising a plane of Mo(W) atoms
sandwiched between the two hexagonal planes of
sulphur atoms, would reduce the total number of
surface vacancies. Also, rearrangement of the struc-
ture might disproportionally reduce certain site center
con®gurations more than others, affecting catalyst
selectivity as well as activity.
In commercial operation, hydroprocessing catalysts
invariably experience some degree of deactivation,
depending on the feed source. Under commercial
operating conditions, catalyst activity, for example
HDS conversion, is maintained by constantly raising
the temperature. Deactivation is then manifested by
the temperature-rise pro®le as a function of time on
stream, as illustrated by the typical S-curve of Fig. 2
for a resid feed [1]. Initial deactivation is caused by
coke, which appears to rapidly reach a pseudo steady-
Catalysis Today 52 (1999) 381±495
*Corresponding author. Tel.: +1-613-565-5604; fax: +1-613-
565-5618
E-mail address: [email protected] (E. Furimsky)
0920-5861/99/$ ± see front matter # 1999 Elsevier Science B.V. All rights reserved.
PII: S 0 9 2 0 - 5 8 6 1 ( 9 9 ) 0 0 0 9 6 - 6
Page 2
state level. Continued deactivation over a longer time
period is due to metal deposits, whose rate of deac-
tivation depends on the metals level in the feed. The
®nal, catastrophic loss in activity is attributed to pore
constriction and ultimate pore blockage. At this stage,
Fig. 1. Typical heteroatom and aromatic compounds found in petroleum.
Table 1
Basic deactivation factors
Active site poisoning by strongly adsorbed species
Active site coverage by deposits (coke, metals)
Pore mouth constriction/blockage
Sintering of active phaseFig. 2. Typical S-shaped deactivation curve [1].
382 E. Furimsky, F.E. Massoth / Catalysis Today 52 (1999) 381±495
Page 3
the temperature cannot be raised suf®ciently to keep
up with deactivation, and the run has to be terminated.
The molecular structure of reactants in the feed has
an indirect bearing on catalyst deactivation. Since
rates are affected by adsorbed species, strongly
adsorbed species can lower reaction rates consider-
ably. This requires increase in temperature to maintain
catalyst activity, which is usually accompanied by
increased deactivation rates. Adsorbed species reduce
the number of active sites via competition with the
reactant. Even a simple molecule as indole has been
found to have a long-time adsorption effect on HDS
and HYD. Table 2 shows that even after two days after
its removal, the HDS of dibenzothiophene has not
been entirely recovered, and HYD of naphthalene was
still appreciably lower than before the addition of
indole. This may be explained on the basis of relative
reaction rates to desorption rates. A strongly adsorbed
compound, having a slow rate of desorption compared
to the given reaction, will experience only very slow
recovery. This is especially marked in the case of
polyaromatic nitrogen compounds, whose rates of
desorption are exceedingly slow.
Many studies have been performed to understand
the underlying phenomena leading to deactivation in
order to develop longer life catalysts [1±10]. Most of
these studies have been of a semi-empirical nature, in
which various deactivating factors have been com-
pounded, making dif®cult assessment of the individual
factors responsible. There have been few attempts to
comprehensively review published information rele-
vant to deactivation of hydroprocessing catalysts.
Deactivation of HDS catalysts was part of a review
by Bartholomew [2] on deactivation occurring during
various reactions. The information on deactivation
during direct coal liquefaction was reviewed by Tho-
mas and Thakur [3]. Subsequently, the same authors
have published a summary of more than 250 published
works on deactivation during hydroprocessing of
heavy feeds and synthetic crudes [4]. Deactivation
by coke was reviewed by Menon [5] and Absi-Halabi
et al. [6]. It is to be noted that the latter two reviews
dealt mainly with the chemical aspects of coke for-
mation. Thus, little attention was paid to catalyst
porosity and associated restrictive diffusion phenom-
ena. These aspects of deactivation were discussed in
the review published by Gualda and Toulhoat [7].
Tamm et al. [1] discussed in detail phenomena occur-
ring during deactivation by metals. Various models
applied to HDM and deactivation were reviewed by
Dautzenberg et al. [8] and Wei [9]. The catalyst
deactivation during hydroprocessing of residues was
the primary focus of another review published recently
by Bartholomew [10].
In this review, we draw upon material from the
literature in an attempt to elucidate various basic
factors responsible for catalyst deactivation. After a
brief background discussion of catalyst structure and
active sites, we concentrate on deactivation phenom-
ena with poisons, coke, metals deposits and changes in
catalyst active phase structure. A number of remedies
relevant to practical situations are also presented.
2. Hydroprocessing catalysts
The catalysts of concern in hydroprocessing consist
of molybdenum supported on a high surface area
carrier, most commonly alumina, promoted by cobalt
or nickel. These catalysts are active in the sul®ded
state, being either presul®ded or sul®ded on stream
with a sulfur containing feed. CoMo/Al2O3 catalysts
are usually employed for HDS, HDM catalysts gen-
erally have large pores and lower metal contents.
Extensive characterization studies of these catalysts
have been reviewed by a number of authors [11±15],
and we will only summarize here current opinion
relative to structure and catalytic sites, without refer-
ence to original papers on the subject.
The supports employed usually consist of high
surface area (�200 m2/g) transition-aluminas (or
silica-alumina or zeolite for hydrocracking). The aver-
age pore size is generally between 75 and 300 AÊ ,
although a distribution of pore sizes is prevalent. Some
supports, especially those used for demetallation, may
also sustain macropores, i.e., a bimodal pore structure.
Table 2
Effect of indole on HDS and HYD conversion
% Conversion
HDS HYD
Before indole 87 69
After indole 64 21
After 2 days with DBT 80 39
E. Furimsky, F.E. Massoth / Catalysis Today 52 (1999) 381±495 383
Page 4
The micropore dimensions can have a signi®cant
bearing on diffusion of reactants to the active sites,
particularly for heavy feeds. The literature on pre-
paration of the hydroprocessing catalysts is quite
extensive [16±19]. For the purpose of this review, a
brief summary of the key issues on the subject will
only be given, without reference to the original works.
Research has shown that sul®ded catalysts contain-
ing Mo consist of essentially monolayer slabs or
clusters of slabs of MoS2 partially covering the alu-
mina surface. Fig. 3 shows a model representation of a
slab, which is believed to be roughly hexagonal in
shape. The relative lateral size of the slabs, and the
amount of monolayer slabs and clusters of slabs will
depend on the Mo loading relative to the alumina
surface area. At high levels of Mo (greater than about
5% Mo per 100 m2/g of alumina surface), bulk MoS2
can also be present. Because of the relatively small
size of the slabs, e.g., 10±50 Mo/slab, a considerable
fraction of the terminal sulfur ions will be absent in
order to maintain an approximate MoS2 stoichiometry.
These are shown by the absence of S atoms in
Fig. 4. These coordinatively unsaturated sites (CUS)
or sulfur anion vacancies are located at the edges of the
slabs and have Lewis acid character. Thus, they can
adsorb molecules with unpaired electrons, e.g., NO,
pyridine, and are believed to be the sites for catalytic
reactions. The vacancies can consist of a signi®cant
fraction of the edge sulfur atoms. Because of the high
concentration of vacancies (about 1 vacancy/edge Mo
atom), double and even multiple vacancy centers can
be present.
Studies have shown that the presence of Co or Ni
does not affect the basic slab size of the MoS2, being
located at the edge sites of the slabs. The Co or Ni does
not appear to appreciably increase the number of
vacancies, but the vacancies associated with the Co
or Ni are considerably more active than those asso-
ciated with the Mo, leading to the increased `promo-
Fig. 3. Model of MoS2 slab.
Fig. 4. Activity±time profiles for (a) reversible; (b) quasi-irreversible and (c) irreversible poisoning.
384 E. Furimsky, F.E. Massoth / Catalysis Today 52 (1999) 381±495
Page 5
tional' activity of the catalyst. The vacancy concen-
tration under hydroprocessing conditions is thought
to be a function of the H2 and H2S concentrations.
Considerable evidence exists for the presence of
±SH groups on the catalyst, and weak Brùnsted
activity has been shown to be present under typical
hydroprocessing conditions.
The relevance of this to deactivation is obvious Ð
any strongly adsorbed species, for example, N-com-
pound, coke molecule, metal deposit, which occupies
(poisons) an active vacancy site will cause a loss in
catalytic activity. This could affect the Mo vacancies,
and more importantly the more active Co or Ni sites.
Since most reactants will most likely require multi-
vacancy site centers for adsorption, it may not even be
necessary to poison all the sites of the active centers to
cause deactivation, i.e., one poison molecule could
conceivably poison the entire center for reaction.
It is evident from the literature that the different
reactions occurring on hydroprocessing catalysts do
not take place on the same sites. It may seem dif®cult
at ®rst to reconcile a number of different sites with the
idea that vacancies are the active sites. However, one
may certainly envision a number of different site
ensembles of vacancies to be present, which having
different con®gurational and/or energetic properties,
would be more suitable for bonding a particular
reactant in an activated state. The consequence of this
is that some reactions may be more affected by
catalyst deactivation than others.
3. Deactivation by poisons
A poison is a substance which adsorbs on active
catalyst sites, resulting in either incapacitating the site
or competition with the reactants of a given reaction.
The poison may be due to the reactant, reaction
intermediates or products, as well as the extraneous
compounds present in the feed. The net result is a
lowering in the catalyst activity. It is assumed that
during poisoning, the basic structure of the active sites
is not changed.
A poison may be adsorbed reversibly, irreversibly
or quasi-irreversibly. The effects in these cases on the
rate or conversion of a given reaction are illustrated in
Fig. 4. In the case of a reversible poison, the catalyst
activity is restored when the poison is removed from
the feed. Thus, its effect is transitory and is manifested
in an inhibition (denominator) term in the usual
Langmuir±Hinshelwood rate expression for reactant
A, rA,
rA � kA f �CA�1� KpCp �
PKiCi
ÿ �n (3.1)
where kA is the rate constant, CA the concentration of
A and f(CA) its particular rate form, Kp the adsorption
constant of the poison and Cp its concentration, Ki the
adsorption constant of all other adsorbed species
associated with the main reaction and Ci their con-
centrations, and n the power on the inhibition term.
Thus, the rate of the main reaction in the lined-out
catalyst will be affected by the strength of adsorption
of all species under the given conditions. Since the
effect of theP
KiCi term is indigenous to the reaction,
it is always present (although some or all of the Ki's
may be suf®ciently small that their effect is negligi-
ble). The presence of an extraneous reversible poison
will further lower the main reaction rate by virtue of its
appearance in the inhibition term. Its effect will
depend upon its concentration and strength of adsorp-
tion. Since the catalyst regains its original activity
when the poison is removed, the reversible poison is
not a true poison in the sense that it only temporarily
competes for active sites. It is thus better described as
an `inhibition' to the main reaction instead of a poison.
An irreversible poison is one that is not desorbed,
i.e., its bonding to the active site is so strong that its
desorption rate is negligible under reaction conditions.
Deactivation by irreversible poisoning does not
depend on the concentration of poison (although the
rate of deactivation does). Upon its removal from the
feed, the catalyst activity remains permanently
depressed at its value prior to removal. An essentially
irreversible poison at one temperature may become a
reversible poison at a higher temperature, although
raising temperature sometimes results in decomposi-
tion rather than simple desorption. The rate constant in
Eq. (3.1) includes the total number of active sites on
the catalyst for reaction of A. The irreversible poison
will permanently poison some active sites, resulting in
a lowering of the number of active sites available.
Thus, the irreversible poison will effectively lower the
rate constant rather than appear in the inhibition term.
However, not all active sites may be covered by a
particular poison, only some very active sites. Con-
E. Furimsky, F.E. Massoth / Catalysis Today 52 (1999) 381±495 385
Page 6
sequently, the main reaction may not be completely
deactivated by this poison, despite its continued pre-
sence in the feed. When the adsorbed species poly-
merize or condense into larger units on the catalyst
surface, poisoning loses its meaning; these processes
are better described, for example, as deactivation by
coke or metal deposition (see subsequent chapters).
A quasi-permanent poison has the characteristics of
both reversible and irreversible poisons. Hence, it will
lower catalytic activity by virtue of adsorption on
active sites, but appear as a permanent due to its very
slow desorption rate with respect to the rate of the
reaction at hand. As a consequence, adsorption equi-
librium is only slowly established, and the reversible
poison component will appear in the inhibition term,
while the irreversible component will be included in
the rate constant. When the poison is removed, the
catalyst activity will only be partially restored, the
resulting activity loss being due to the permanent
poison still residing on the more active sites.
Investigations of the kinetics of inhibition via
Eq. (3.1) or other comparable equations are extensive
in the literature. In this regard, the review published by
Girgis and Gates [20] focuses on inhibition of all
reactions occurring during hydroprocessing. Since
these studies involve predominantly reversible `poi-
son', in the following literature review, we will mostly
be concerned with irreversible and quasi-irreversible
poisoning.
3.1. Poisoning by nitrogen compounds
In the case of hydroprocessing, nitrogen-containing
compounds are the most common poisons by virtue of
their strong adsorption on catalyst sites. Because of
their basic nature, they adsorb on catalyst acidic sites,
viz. Lewis and Brùnsted sites, and may adsorb rever-
sibly or irreversibly, depending on reaction conditions.
Most of the nitrogen in petroleum is in the form of 5-
and 6-membered heteroatom rings and anilines. The 6-
membered rings and anilines are the most basic,
accounting for about one third of the total nitrogen.
A small amount of porphyrin type nitrogen (in the
asphaltenes) is also present in heavy feeds; these will
be discussed in the next chapter.
The HDN of N-containing heterorings requires
more severe conditions than that of other heteror-
ing-compounds, especially high H2 pressure. For this
reason, N-compounds are often used to study poison-
ing reactions under mild conditions, e.g., HDS. It is
generally accepted that 5-membered N-ring com-
pounds are less basic (less aromatic character) than
6-membered ring compounds. This is supported by the
resonance energies shown in Table 3 [21]. These
values were estimated from the heat of ring hydro-
genation (�H) according to the formula:
Eres � 30n ÿ �H, where n is the number of hydro-
genated double bonds. It is evident that the 5-mem-
bered rings are less resistant to hydrogenation,
suggesting that they will be removed from the feed
at a greater rate, as supported by experimental results.
Consequently, relative contribution of 5-membered
N-rings to poisoning is expected to be less important
than of 6-membered N-rings. For this reason, many
authors have used pyridine as a poison in HDS studies
[22±28], in which the poisoning effect was usually
treated as a reversible inhibition.
Besides strongly adsorbing on Lewis sites via the
N-electron pair or via the aromatic �-system, N-com-
pounds can also interact with protons from Brùnsted
sites, forming positively charged species [29,30].
LaVopa and Satter®eld [31] related equilibrium
adsorption parameters with proton af®nities for a
number of N-compounds. Fig. 5 shows a good corre-
lation, except for sterically hindered compounds. A
similar correlation was presented by Nagai et al. [32],
which again failed to correlate sterically hindered
compounds. The basic strength and extent of adsorp-
tion of several N-compounds on a sul®ded CoMo
catalyst were compared by Miciukiewicz et al. [33]
and are listed in Table 4. The adsorption values given
were obtained by microbalance experiments under
reaction conditions in which the N-compounds were
stable towards HDN, and include adsorption on active
as well as on inactive sites (support). The pKa values
are from the literature and represent the basic strength
Table 3
Heat of hydrogenation and resonance energies of rings [21]
Equilibrium ÿ�H (kcal/mol) Eres (kcal/mol)
Pyrrole @ Pyrrolidine 30 30
Pyridine @ Pyperidine 48 42
Indole @ Indoline 13 17
Quinoline @ 1-,2-,3-,4-
Tetrahydoquinoline
30 30
386 E. Furimsky, F.E. Massoth / Catalysis Today 52 (1999) 381±495
Page 7
in water, which is related to the protonation of the
base, e.g. B � H2O � BH� � OHÿ. The basic
strength is not necessarily the same as the adsorption
strength on catalyst sites. Thus, according to pKa
values in Table 4, piperidine is much more basic than
pyridine, yet their overall adsorption on the catalyst is
the same, implying that the degree of protonation of
the adsorbed base is not directly related to its adsorp-
tion on the catalyst. Signi®cant differences between
the adsorption of 2,6-lutidine and 3,5-lutidine, as well
as quinoline and 2-methylquinoline (quinaldine), indi-
cate the importance of steric hindrance to adsorption.
Steric hinderance is not accounted for in the pKa
values or proton af®nities. Because adsorption is
appreciably diminished by methyl substitution at car-
bons adjacent to the nitrogen, the interaction of N-
bases with catalyst sites occurs predominantly via the
N-heteroatom, either by donating its unpaired electron
to the Lewis site or by interaction with the proton of a
Brùnsted site.
The effect of molecular structure of adsorbed N-
compounds on the HDS of thiophene and the HYD of
hexene was also determined by Miciukiewicz et al.
[33]. In these experiments, desorption of the N-com-
pound was extremely slow, indicative of quasi-irre-
versible adsorption. Deactivation curves are presented
in Fig. 6. It is evident that the curves are tailing off
with increasing amount of poison, implying that some
Fig. 5. Correlation between adsorption parameter and proton
affinity [31].
Table 4
Nitrogen-compound poisins [33]
Name Structure pKa Adsorbtionc
(mmol/g)
Piperidine (PIP) 11.1 0.15
Pyridine (PY) 5.3 0.16
2,6-Lutidine (26L) 7b 0.045
3,5-Lutidine (35L) 6.2 0.215
Aniline (AN) 4.6 0.13
N,N-dimethylaniline (NAN) 5.2 0.085
Quinoline (Q) 4.9 0.25
Quinaldine (MQ) 5.8 0.08
a Handbook of Chemistry and Physics, 60th ed., p. D-161.b Estimated from data of susbstituted puridines.c Amount adsorbed on catalyst at 0.25 kPa pressure of N-
compound at 623 K, in presence of 1.06 kPa thiophene, 1.73 kPa
H2S and 83.3 kPa H2.
Fig. 6. Effect of N-compounds on relative activities of HDS and
HYD; PY ± pyridine, AN ± aniline, Q ± quinoline (CoMo/Al2O3,
623 K, near atm. H2) [33].
E. Furimsky, F.E. Massoth / Catalysis Today 52 (1999) 381±495 387
Page 8
Fig. 7. Effect of the structure of N-compounds on relative activities of HDS and HYD; PY ± pyridine, PIP ± piperidine, AN ± aniline, NAN ±
N,N-dimethylaniline, Q ± quinoline, MQ ± quinaldine, 26L-2,6-lutidine, 35L-3,5-lutidine (conditions as in Fig. 6) [33].
388 E. Furimsky, F.E. Massoth / Catalysis Today 52 (1999) 381±495
Page 9
HDS sites are immune to poisoning. Also, HDS
activity is more greatly deactivated compared with
HYD for the same amount of poison. The effect of
molecular structure on relative activities is shown in
Fig. 7. Piperidine, the hydrogenated analog of pyri-
dine, deactivated HDS to a greater extent than HYD.
Similarly, HDS was more deactivated than HYD for
aniline and its N-substituted analog. Different results
were obtained for quinoline and its 2-methyl analog
quinaldine. The latter showed a reverse effect, deac-
tivating HYD more than HDS. This effect was even
more pronounced for 2,6-dimethylpyridine (2,6-luti-
dine). Not only was HDS less deactivated than HYD,
but a positive promotion of HDS was obtained at low
adsorption. In contrast, deactivation by 3,5-dimethyl-
pyridine (3,5-lutidine) was comparable to that of
pyridine. A strong poisoning effect of 2,4-lutidine
on the HYD of 2-methylnaphthalene was also reported
by Ho et al. [34]. It appears that, except for sterically
hindered compounds, HDS is more deactivated than
HYD. This suggests a greater adsorption of poison on
HDS sites compared with that on HYD sites.
The studies of Miciukiewicz et al. [33] were later
extended by Yang and Massoth [35] to poisoning of
the HDS of 2-methylthiophene and the HDO of 2-
methylfuran by piperidine and 2,6-lutidine. Fig. 8
shows the effect of the adsorbed piperidine on the
HDS and HDO activities. While the HDS activity
decreased gradually and then tailed off with increasing
amount of poison, a drastic decrease in the HDO
activity was observed in the presence of small amounts
of poison. With further addition of poison, the HDO
activity remained unchanged. The results for deacti-
vation by 2,6-lutidine, shown in Fig. 9, are much
different than those in Fig. 8. This indicates that the
reaction sites for HDO are sterically hindered, as was
found for HDS sites [33]. Because of the similarity of
these results with those for thiophene, the same type of
site may be involved in the hydrogenolysis of C±O and
C±S bonds.
Strong inhibition by carbazole was observed by
Nagai and Kabe [36] during the HDS of benzothio-
phene. This was attributed to a partial hydrogenation
of carbazole to more basic intermediates. A similar
reason was given for the inhibition of HDO of m-
cresol with indole by Odebunmi and Ollis [37]. The
inhibition was greater at lower temperatures due to
higher ratio of more basic indoline to indole. Besides
lowering the activity, often a poison will affect the
selectivity of a reaction if its effect is different on
different pathways. For example, as shown in Fig. 10
[32], the addition of acridine radically changed the
product distribution for HDS of dibenzothiophene at
2608C. Thus, biphenyl became the major product,
whereas the yields of hydrogenated products
decreased signi®cantly with increasing amounts of
acridine. Fig. 11 [36] shows results for the same
experiments performed at 3008C. It is evident that
the temperature increase from 260 to 3008C decreased
the HDS conversion as indicated by the concentration
Fig. 8. Effect of piperidine on relative activities; ** ± HDS of
methylthiophene, && ± HDO of methylfuran (CoMo/Al2O3,
623 K, near atm. H2) [35].
Fig. 9. Effect of lutidine on relative activities (symbols and
conditions as in Fig. 8) [35].
E. Furimsky, F.E. Massoth / Catalysis Today 52 (1999) 381±495 389
Page 10
of the reactant dibenzothiophene and that of biphenyl
which is the major HDS product.
Ramachandran and Massoth [38] studied the poi-
soning effect of pyridine on the HDS of benzothio-
phene. Under the conditions employed, pyridine can
be considered an irreversible poison, as its desorption
rate is very slow, and it does not undergo reaction. The
catalyst activity initially decreased linearly with
increasing amounts of pyridine on the catalyst. How-
ever, at about 40% of residual activity, a tailing out
occurred, suggesting that some HDS sites are immune
to pyridine poisoning, the excess pyridine being
adsorbed on non-active sites. Kinetic analysis revealed
that the inhibition term was essentially the same
without or with pyridine present, whereas the HDS
rate constant was smaller for the latter, indicative of
quasi-reversible poisoning.
It is not clear whether strongly adsorbed N-com-
pounds actually remain intact, or undergo simple
polymerization to larger units, which could account
for their `irreversibility'; once a polymer is formed, it
is dif®cult to reverse the reaction to desorb the parent
poison. Dong and Massoth [39] investigated coking of
a CoMo/Al2O3 catalyst at several coking conditions
with a vacuum gas oil containing very little nitrogen
both in the absence and presence of acridine and
carbazole in the feed. The coked catalysts were Soxh-
let extracted with xylene to remove any weakly
adsorbed species. By comparing chemical analysis
of pairs of coked catalysts at the same coking condi-
tions, they were able to establish that the strongly
retained N-compound had the same N/C ratio as that
of the parent N-compound suggesting that the latter
adsorbed in molecular form, or as a simple polymer of
the parent. A similar result was obtained for poisoning
by N-phenylcarbazole [40]. In this case, the catalyst
was ®rst exposed to the poison, and then tested for
HDS and HYD. All activities were about one-half of
those of the unpoisoned catalyst. Chemical analysis
showed the poisoned catalyst to have an N/C ratio
close to N-phenylcarbazole. Yang and Satter®eld [41]
reported 10% loss in material balance during studies
of quinoline HDN. They attributed this to a trimer of
hydroquinoline. Similar results were obtained during
studies of indole HDN [42]. Depending on reaction
conditions, material losses of 5±25% were obtained,
and chemical analysis of the catalyst after a run gave
N/C ratio close to that of indole.
As mentioned earlier, if the poison adsorption-
desorption rates are considerable slower than the
reaction rate under the study, the poison must be
looked at in terms of a quasi-reversible state at a
given concentration of poison. Based on this rational,
Fig. 10. Effect of added acridine on the products of dibenzothio-
phene (DBT) HDS; * ± biphenyl, ~ ±cyclohexylbenzene, * ±
DBT, & ±tetrahydroDBT, * ± hexahydroDBT, * ± bicyclohexyl,
* ± Cyclohexylhexane (NiMo/Al2O3; 533 K; 10.1 MPa) [32].
Fig. 11. Effect of added acridine on the products of DBT HDS; ~-
hexahydroDBT, other symbols the same as in Fig. 10 (NiMo/
Al2O3, 573 K, 10.1 MPa) [36].
390 E. Furimsky, F.E. Massoth / Catalysis Today 52 (1999) 381±495
Page 11
Massoth and Miciukiewicz [43] treated a set of experi-
mental data for the effect of pyridine on the HDS of
thiophene. A special stirred-¯ow microbalance pro-
vided simultaneous measurements of thiophene con-
version and adsorbed pyridine. The thiophene reaction
data did not ®t the common Langmuir±Hinshelwood
kinetic treatment, which assumes fast, reversible
adsorption of pyridine. Also, the adsorption data did
not adequately ®t a Langmuir isotherm, whereas the
modi®ed Temkin isotherm showed a good ®t. In this
isotherm, the coverage by pyridine is give by
�N � WN
WN;max
� b ln1� a0pN
1� a0pN exp�ÿ1=b�� �
where WN and pN are adsorbed weight and partial
pressure of pyridine, respectively. This isotherm
invokes a distribution of strengths of adsorption sites
on the catalyst [43]. The HDS rate constant, kT will
depend on the semi-permanent coverage of active sites
by pyridine, viz.
kT � k0T�1ÿ �N�n
For the relative activity, AT, the following equation
was derived:
AT � kT
k0T
D0
D
� �n
where kT and k0T are the HDS rate constants and D and
D0 the inhibition terms for the poisoned and unpoi-
soned catalyst, respectively. As D and D0 varied less
than 5% over the conversion range tested, then
AT � �1ÿ �N�n
This equation was combined with the modi®ed
Temkin isotherm and solved for the various para-
meters by nonlinear regression analysis for n � 1
and n � 2, i.e., both a single and dual site mechanism
was tested. Tests of the data ®t are given in Fig. 12
[43], showing the dual-site mechanism to be some-
what better.
During HDN, ammonia is produced, most of which
will leave the reactor zone with the products. How-
ever, a part of NH3 will be strongly adsorbed on the
catalyst. Adsorption of NH3 is weaker than N-heteror-
ing compounds, and is generally treated as a reversible
inhibition [31]. GuÈltekin et al. [44] showed severe
poisoning of the hydrogenation of propylbenzene by
NH3 via addition of propylamine to a naphtha feed.
Gutberlet and Bertolacini [22] reported a poisoning of
the HDS activity, but little effect on HYD of ole®ns.
It is generally accepted that the cracking function-
ality has an acidic nature. It is quite obvious that the N-
compounds, especially those of a high basicity, will
poison cracking sites. Yet, for the hydroprocessing
catalysts, the information con®rming the poisoning
effect is very limited. While studying HDS and HYD
of model compounds, Girgis and Gates [20] observed
signi®cant poisoning by quinoline, especially that of
cracking of model compounds to lighter products.
Fig. 12. Test of deactivation with modified Temkin isotherm for single and dual site mechanism (lines represent best fits) [43].
E. Furimsky, F.E. Massoth / Catalysis Today 52 (1999) 381±495 391
Page 12
Hughes et al. [46,47] have used typical cracking
catalysts to study cracking of hexadecane in the pre-
sence of a number of poisons. As the results in Fig. 13
show, the most severe poisoning of the cracking sites
was caused by quinoline. It is believed that among
these compounds, quinoline and its partially hydro-
genated intermediates will cause the most extensive
poisoning also in the case of hydroprocessing cata-
lysts.
HDM is an important functionality of the hydro-
processing catalysts for heavy feeds. Ware and Wei
[48] observed signi®cant poisoning by pyridine during
the HDM of a Ni-porphyrin using a CoMo/Al2O3
catalyst. Each of the reaction steps in the HDM
mechanism was supressed by pyridine. The details
of the HDM mechanism proposed by these authors
will be discussed in a subsequent chapter.
Information on N-compounds poisoning during the
hydroprocessing of real feeds is scarce. Gutberlet and
Bertolacini [22] studied the HDS of naphtha spiked by
substituted pyridines. With the exception of the 2,6-
methylpyridine, all others substituted pyridines inhib-
ited HDS in agreement with results of Miciukiewicz
et al. [33]. In a similar study, Jones et al. [49] spiked
a gas oil feed with quinoline and observed a decrease
in the sulfur removal.
3.2. Effect of H2O
Sulfur compounds are more reactive than oxygen
compounds, and both are considerably more reactive
than nitrogen compounds. Sulfur compounds in con-
ventional and heavy feeds are predominantly as 5-
membered thiophenic heterocyclics. They adsorb
essentially reversibly, as does H2S, and have been
kinetically treated as an inhibition. Although the
oxygen content in conventional feeds is low, in the
case of coal-derived liquids and biomass-derived
feeds, oxygenated compounds and water derived
therefrom may have an inhibiting effect on HDO
reactions. It is believed that the inhibiting effect of
water can be diminished by maintaining a desirable
pressure of H2S in order to maintain the catalyst in its
sul®ded state. In the case of the high oxygen content
feeds, this may require an addition of an H2S gen-
erating species to the feed. Otherwise, H2O may
modify the catalyst surface during the period of
operation, and as such contribute to loss in catalyst
Fig. 13. Effect of poisons (1%) on cracking conversion of hexadecane; & ± hexadecane, � ± quinoline, * ± phenanthrene, & ± benzofuran,
x ± benzothiophene, ~ ± indene [47].
392 E. Furimsky, F.E. Massoth / Catalysis Today 52 (1999) 381±495
Page 13
activity [50]. Although this effect may be reversible,
some attention may be paid to the potential activity
loss due to the presence of H2O.
Krishnamurthy and Shah [51] reported that the
addition of 0.75 wt.% of dibenzofuran (DBF) to
1 wt.% of dibenzothiophene (DBT) reduced the
HDS rate by 25%. However, addition of 1 wt.% of
cyclohexylphenol resulted in a two-fold reduction in
HDS. This was attributed to inhibition by water, which
was rapidly formed from the cyclohexylphenol,
although polymer formation on the catalyst surface
cannot be ruled out. Girgis and Gates [45] found that
the inhibition by 5,6,7,8-tetrahydro-1-naphthol and/or
water from it, on the hydrogenation of aromatics and
HDO and HDS of DBF and DBT, respectively, was
rather weak; however, because of the low reactant
concentrations, these authors cautioned that this
observation may not be representative of high oxygen
content feeds. Odebunmi and Ollis [37,52] reported a
gradual loss in catalytic activity during the HDO of m-
cresol, which could only be recovered by resul®ding
the catalyst. When indole was added, catalytic activity
was only one-half restored even by resul®ding. These
results are indicative of quasi-reversible adsorption.
Satter®eld and Yang [53] reported that the addition of
m-ethylphenol to a quinoline feed increased the HDN.
The original HDN activity was not fully restored when
the phenol was removed. This may be due to formation
of a polymer on the catalyst, as benzylether and
benzodioxane caused catalyst bed plugging.
Some contrary results are found in the literature on
the effect of water. Thus, Lipsch and Schuit [25]
observed a poisoning effect of water on HDS of
thiophene, and Krishnamurthy and Shah [51] found
that the pseudo-®rst-order rate constant for hydroge-
nation of biphenyl to cyclohexylbenzene decreased by
an order of magnitude when 1 wt.% water was added
to the feed. Vogelzang et al. [50] observed a weak
inhibition of naphthol HDO by water. On the other
hand, Satter®eld et al. [54] reported a promoting effect
of water on the HDN of quinoline. The enhancing
effect of water was increased in the presence of H2S.
Laurent and Delmon [55,56] reported that water
caused only very weak inhibition in the HDO of
phenols, ketones and carboxylic compounds, com-
pared to H2S and NH3. These authors expanded their
studies [57] to include the HDO of bio-oils under high
water pressure in a batch reactor with a sul®ded NiMo
catalyst. The results from this study for 4-methylphe-
nol are given in Table 5. For the blank run (dodecane
solvent), little change in the catalyst activity was
noted. However, on the addition of water, about
two-thirds of the activity was lost. The poisoning
effect of water was evident also with H2S present,
whereas the selectivity of methylcyclohexanol and
toluene (MCH/TOL) was hardly affected. The surface
changes signify a modi®cation of the catalyst structure
by water. In summary, it is apparent that the effect of
water gains on importance with increasing concentra-
tion in the feed, and after certain level is exceeded, the
poisoning effect of water may be quite signi®cant.
Almost certainly, poisoning by water will be present
during hydroprocessing of the biomass derived feeds.
4. Deactivation by coke
Catalyst deactivation by coke and metal deposits
occurs simultaneously if metals are present in the feed.
As indicated previously, species which poison active
sites on the catalyst contribute to the overall deactiva-
tion, as well as changes in the catalyst structure which
Table 5
Effect of H2O on HDO of 4-methylphenol and BET surface area of catalyst [57]
Run Duration
(h)
Rate constant
(cm3minÿ1g catÿ1)
Selectivity
(MCH/TOL)
BET surface
area (m2/g)
Fresh catalyst 2.65 20.0 181
Blank 5 2.30 20.5 172
H2O 5 0.90 19.0 133
H2O±H2S 1 1.43 23.3 170
H2O±H2S 2 0.82 19.5 156
H2O±H2S 5 0.92 23.0 150
E. Furimsky, F.E. Massoth / Catalysis Today 52 (1999) 381±495 393
Page 14
may occur during the operation. It is not easy to
distinguish quantitatively between the contribution
of all these causes to deactivation. As shown in
Fig. 14, there is a difference between the deposition
patterns of coke and metals [58]. The symbols for
Fig. 14 are identi®ed in Fig. 14b. The former deposits
rapidly during the initial stages before attaining a
steady-state. About one third of the pore volume of
the fresh catalyst is ®lled during the initial stage on
stream. At the same time, metals exhibit more or less
linear deposition patterns with time. A similar obser-
vation was made by Mara® and Stanislaus [59] using a
gas oil feed. Coke deposition was the main cause of
the initial pore volume loss. The coke and metal build-
up depend on the properties of the feed and hydro-
processing conditions. Netzel et al. [60] have shown
that the structure of the catalyst can have a signi®cant
effect on the amount of deposited coke. Also, in the
case of coke and metals, only a relative extent of
deactivation could be estimated, as shown in the
results of Table 6 published by Cable et al. [61]. These
results suggest that when the fresh catalyst is com-
pared with the aged-regenerated catalyst, metals
appear to have a moderate effect on HDS activity, a
very weak effect on hydrogenation activity and a weak
effect on cracking activity. Comparing the aged cat-
alyst with the aged-regenerated catalyst shows an
additional effect on the HDS activity due to coke.
Coke seems to have a strong effect on the hydrogena-
tion, since metals have almost no effect, and coke has a
much stronger effect than metals on the cracking
activity.
4.1. Origin of catalyst coke
Coke on hydroprocessing catalysts is ubiquitous,
i.e., coke is formed from virtually all hydroprocessing
feeds employed. General trends which can be estab-
lished from many studies on realistic feeds indicate
that the coke build-up increases with the molecular
weight and/or boiling range of the processed feed.
However, among feeds having similar boiling range,
the one with a high content of coke precursors, e.g.,
aromatics or heterocyclics, will require the most active
catalyst to prevent coke formation. For example, a
naphtha fraction from coal liquefaction will require
a different catalyst and conditions compared with a
similar naphtha fraction derived from a conventional
crude.
It is well established that the carbonaceous deposit
on spent catalysts at the end of the hydroprocessing
operation comprises some carryovers of feed, the
asphaltene-like solvent soluble species, and solvent
insoluble species. The amount of the carryovers
depends on the de-oiling procedure applied during
the catalyst withdrawal from the reactor. The average
molecular weight of the solvent soluble portion of the
deposit is usually signi®cantly greater than the mole-
cular weight of the largest molecules in the feed,
Fig. 14. Evolution of (a) coke, (b) metals and (c) total occupied
volume as a function of time on stream [58].
Table 6
Relative deactivation by metals and coke [61]
Catalyst function Relative effect
Metals Coke
HDS m m
Hydrogenation w s
Cracking w vs
m: moderate; w: weak; s: strong; vs: very strong.
394 E. Furimsky, F.E. Massoth / Catalysis Today 52 (1999) 381±495
Page 15
especially in the case of light feeds. In this case, the
molecules contained in the carbonaceous deposit on
the spent catalyst after the removal of carryovers were
not present in the original feed but were formed during
the operation [62]. The amount and composition of the
soluble portion of the deposit depends on the solvent
used for the extraction [63]. Soxhlet extraction of
spent hydroprocessing catalysts has been used most
frequently before their analysis and/or testing.
Alkanes, such as pentane, hexane, cyclohexane and
others are suitable for removal of the carryovers and/or
non-asphaltenic portion of the deposits. Aromatic
solvents, such as benzene, toluene and others appear
to be the most suitable for the removal of asphaltene-
like species. Other solvents, e.g., methylene chloride,
THF, methanol, pyridine, etc. have also been used.
However, it is not easy to remove some of these
solvents from the catalyst after the extraction. Also,
some of the solvents may polymerize during the
extraction and as such modify the structure of the
organic deposit. A standard extraction procedure,
which could be commonly adapted by all researchers
involved in the evaluation of the spent hydroproces-
sing catalysts, would be desirable in order to make
comparison of the results obtained by different
research groups more meaningful. It was proposed
that the insoluble portion of the carbonaceous deposit
on the spent catalyst be referred to as `coke' [64].
4.1.1. Mechanism of coke formation
The signi®cant difference between the average
molecular weight of coke molecules and those present
in the hydroprocessed feeds indicates that polymer-
ization or polycondensation are the main reactions
leading to coke. For example, the extract from the
spent catalyst used for hydroprocessing of a naphtha
fraction contained molecules as high as coronene [62].
It is obvious that the coke moities remaining on the
catalyst after extraction would be even heavier. Coke
forming reactions occur on the catalyst surface; there-
fore, the structure of the surface is important for
controlling the extent of coking. Among hydrocarbon
groups, the alkenes, aromatics and heterocyclics are
most susceptible to coke formation. Their interaction
with the surface is much stronger than that of saturated
hydrocarbons. Therefore, they are more likely to
convert to higher molecular weight species if suf®-
cient active hydrogen is not available to prevent it.
Wiwel et al. [65] obtained a correlation (Fig. 15)
between the coke propensity of the feed and the
PNA content in the feed. The involvement of hetero-
cyclics in coke formation is supported by the results
shown in Table 7 [62]. In this case, the spent catalyst
from hydroprocessing of a low sulphur coal-derived
naphtha was subjected to sequential extractions by
pentane (A), benzene � methanol (B) and pyridine
(C). The solvents were then removed to recover the
extracts. The signi®cant increase in the heteroatoms
content in the extracts compared with the feed is quite
evident. The aromaticity and content of phenols in the
extracts increased and that of saturated carbon com-
pounds decreased. After every extraction step, the N/C
Fig. 15. Effect of the content of PNA in feed on the amount of
coke on catalyst [65].
Table 7
Chemical composition of extracts [62]
Feed Extracts
A B C
Yield, wt.% ± 2.3 3.7 1.3
Carbon 85.3 87.4 81.0 75.3
Hydrogen 9.6 9.4 7.2 5.1
Nitrogen 0.5 0.1 2.2 5.2
Oxygen 4.8 0.3 7.5 5.3
Sulfur 0.0 tr 0.01 0.4
H/C 1.35 1.30 1.06 0.81
N/C 0.005 0.001 0.023 0.059
O/C 0.048 0.003 0.071 0.053
CAR 52.7 56.1 65.0 ±
CS 47.3 43.9 35.0 ±
CAR-OH 1.9 tr 2.6 ±
E. Furimsky, F.E. Massoth / Catalysis Today 52 (1999) 381±495 395
Page 16
ratio of the catalyst gradually increased from 0.001 for
the unextracted catalyst, to 0.023 and 0.059 after
extractions with A, B and C, respectively. This indi-
cates a signi®cant contribution of the N-containing
compounds to coke formation. A similar evaluation of
a high sulfur feed con®rmed a marked increase of
sulfur content in the extracts, as well as that of
nitrogen and oxygen compared with the feed [66].
The coke precursors are present in the original feed or
can be formed during the operation if suf®cient active
hydrogen is not supplied. Such a situation may
develop during the late stages of the operation, i.e.,
when the catalyst deactivation reaches an advanced
stage. Under such conditions even molecules as small
as toluene can act as coke precursors [67].
Zeuthen et al. [68] used pyrene and alkylated
pyrenes as well as carbazole and alkylated carbazols
in a solution of n-heptane for coking a NiMo/Al2O3
catalyst under hydroprocessing conditions. In the case
of pyrenes, there was little effect of alkyl substitution
on the rate of coke formation, indicating a �-interac-
tion of rings with the catalyst surface. However, in the
case of carbazoles, the interaction with the surface was
signi®cantly reduced by substitution in the ®rst posi-
tion (neighbor to the nitrogen atom), suggesting that
carbazoles interact via the unpaired electrons on the
nitrogen.
In the case of heavy feeds, asphaltenes and heavier
species can precipitate on the catalyst surface if the
colloid stability of the feed cannot be maintained. This
requires a proper ratio of oil, resins and asphaltenes in
the feed. The resins play a role of stabilizer in pre-
venting precipitation of asphaltenes [69]. Under
hydroprocessing conditions, this structure is most
likely disrupted and the system may be classi®ed as
a pseudo-solution of a random mixture of oil, resins
and asphaltenes [70]. It may be important that during
hydroprocessing, resins are removed at about the same
rate as the asphaltenes. Otherwise, precipitation of
asphaltenes from the feed can be a major cause of coke
formation [71]. It was established that the coking
propensity of asphaltenes is higher than that of resins
[72]. After being adsorbed on the surface, both the
resins and asphaltenes are gradually converted to
lighter fractions; however, a small amount may con-
vert to coke. Nagaishi et al. [73] have shown that the
asphaltenes become more aromatic than the original
asphaltenes. Condensation of asphaltenes on the cata-
lyst surface may produce coke containing small ani-
sotropic regions consistent with mesophase
development [74]. The mechanism shown in Fig. 8
was proposed to explain thermal hydrocracking and
pyrolysis of asphaltenes derived from Athabasca bitu-
men [75]. For this purpose, the model proposed by
Suzuki et al. [76] was used. The volatile products are
not shown in the mechanism. The partial conversion of
asphaltenes shown in Fig. 16 may already occur dur-
ing preheating the mixture of H2 and feed prior to
contacting catalyst bed. If the catalyst bed is function-
ing properly, the thermally hydrocracked products will
be converted to lighter fractions; otherwise, they will
be converted to coke. Thus, the bene®cial role of H2 is
evident in the mechanism. Using terminology intro-
duced by Alvarez et al. [77], the products in Fig. 16
formed during hydrocracking of the asphaltene may
be viewed as `mildly aged coke' whereas those formed
during pyrolysis as `aged coke'.
The introduction of bio-feeds raises the problem of
potential coke formation from the various O-contain-
ing species, among which phenols and furanic rings
are predominant. It was indeed con®rmed by Laurent
et al. [78] that some phenols are important coke
precursors inspite of their low molecular weight and
size. Thus, the CoMo/Al2O3 catalysts used for the
HDO of hexadecane solutions containing methoxy-
phenol, hydroxyphenol, phenol or methylanisol
resulted in 7.8, 5.5, 3.5 and 2.8 wt.% of coke, respec-
tively, suggesting that compounds with two oxygens
are more ef®cient coke precursors. These values of
coke were rather high considering the short residence
time employed. Under hydrogen-de®cient conditions,
coke can be formed even from THF [79]. In this case,
pretreatment of the catalyst is important.
The strength of the interaction of coke precursors
with the catalyst depends on the properties of the
catalyst surface and the structure of the coke precur-
sor. It was established by Appleby et al. [80] that
coking increases with increasing acidity of the surface
and/or increasing basicity of the precursor. However,
since acidity favors hydrocracking, a balance must be
found between the rate of coking and hydrocracking
activity. It is believed that both Lewis and Brùnsted
acid sites may take part during coking, the former by
strongly interacting with basic species in the feed, thus
prolonging their life on the catalyst, and the latter by
supplying protons to form carbonium cations, which
396 E. Furimsky, F.E. Massoth / Catalysis Today 52 (1999) 381±495
Page 17
are assumed to be responsible for coking [81]. How-
ever, the contribution of the Lewis and Brùnsted acidic
sites to coke formation is still controversial [82,83].
Lewis and Brùnsted sites are associated with the
catalyst active phase, whereas only Lewis sites are
present on alumina supports [84]. As shown by Scar-
oni et al. [85], the HDS catalyst can catalyze coking.
Thus, during coking of anthracene under N2, the
amount of coke on the bare Al2O3 support was much
smaller than that on a CoMo/Al2O3 catalyst. The
difference may be caused by the presence of the
Brùnsted acidic sites on the latter and their absence
on the bare g-Al2O3. On the other hand, De Jong et al.
[86] showed that during hydroprocessing of a vacuum
gas oil, the amount of coke decreased signi®cantly by
adding 0.2% of Mo to Al2O3, as the results in Fig. 17
show. Thus, the presence of Mo signi®cantly
supressed coke formation on the alumina support.
However, with increasing Mo loading, the amount
of coke again increased slightly. The authors assumed
that to a certain extent MoS2 can catalyze coke for-
mation. It is believed that the Brùnsted acidic sites on
MoS2/Al2O3 aided coke formation via carbonium
cations as intermediates.
Besides feed composition and catalyst properties,
hydroprocessing conditions are important for control-
ling the extent of coke formation. Of particular impor-
tance is the partial pressure of H2, temperature and
contact time. Hydrogen can convert coke precursors
into stable products before they are converted to coke.
Fig. 16. Tentative mechanism for coke formation from asphaltenes [75].
Fig. 17. Effect of Mo loading on the coke selectivity and HDS
activity (723 K, 30 bar H2) [86].
E. Furimsky, F.E. Massoth / Catalysis Today 52 (1999) 381±495 397
Page 18
However, the probability of this conversion decreases
with increasing temperature. The results in Fig. 18
suggest that there might be an optimal combination of
catalyst properties and processing conditions, which
ensures the best performance of the catalyst [87].
These results suggest that at a given partial pressure
of H2, the coke build-up increases up to about 3758Cbecause the conversion of heavy species to lighter
fractions is slow. As a result of the slow conversion,
the life of heavy molecules on the catalyst surface is
prolonged, which increases the chances of polymer-
ization. A faster conversion of the resins than that of
the asphaltenes, leading to precipitation of the latter
may be another reason for this observation. Above
3758C, the hydrogenation of the coke precursors to
products competes successfully with their polymeri-
zation. Also, an increased conversion of asphaltene-
like species (because of the increased temperature),
may slow down coking. Stohl and Stephens [88]
observed even a slight decrease in the coke formation
by increasing temperature from about 360 to 3708Cbecause of the improved conversion of heavy species
in the feed and possibly also some of those heavy
species which temporarily adsorbed on the catalyst.
However, the coke build-up increase above 4408C(Fig. 18) indicates on increasing rate of dehydrogena-
tion followed by polycondensation reactions. Mochida
et al. [89] observed little change in coke build-up
between 380 and 4308C within the ®rst 10 h on stream.
At 4308C, the coke build-up began to increase and the
H/C ratio of the coke to decrease afterward, indicating
dehydrogenation of the coke. Similar trends were
observed by van Dorn et al. [90] who arti®cially coked
Co/NiMo/Al2O3 catalysts at 400 and 5008C. The H/C
ratio for the deposited cokes was 1.7 and 0.6, respec-
tively, indicating signi®cant dehydrogenation at
5008C compared with that at 4008C. It is believed
that the ¯at region in Fig. 18 can be expanded by
increasing the partial pressure of H2. This is supported
by results published by Richardson et al. [91], shown
Fig. 18. Effects of temperature on catalyst coke [87].
Fig. 19. Carbon content of catalyst as function of H2 pressure (NiMo/Al2O3, 703 K) [91].
398 E. Furimsky, F.E. Massoth / Catalysis Today 52 (1999) 381±495
Page 19
in Fig. 19, obtained at 4308C for the initial coking. As
shown in Fig. 20, the effect of the partial pressure of
H2 is even more pronounced on the steady-state level
of coke [92]. De Jong et al. [86] showed that H2/oil
ratio also can in¯uence coke formation. As seen in
Fig. 21, a distinct maximum in coke formation is
observed at intermediate feed ratios. The model devel-
oped by these authors suggested that at low gas rates,
the gas oil was mainly in the liquid phase, whereas at
high rates, the reactor was operating in the gas phase.
Perhaps, the most detailed study on the effect of
processing conditions on deactivation by coke was
published by Gualda and Kasztelan [93], who
observed that in a batch system the amount of coke
decreased with increasing contact time, temperature
and H2 pressure. This was attributed to a feed `puri-
®cation' accompanied by the removal of coke pre-
cursors as well as an improved hydrogenation of the
coke deposited on the catalyst during the initial stages.
More coke was deposited in a continuous ¯ow system
because of the uninterrupted supply of coke precur-
sors. As expected, more coke was deposited on g-
Al2O3 than on the NiMo/Al2O3 catalysts. Also, the
H/C ratio of this coke was lower than that deposited on
the catalysts, indicating a role of active metals during
coke formation. The H/C ratio of the coke seemed to
go through a maximum while increasing temperature
and contact time. These authors concluded that the
behavior of coke on the catalyst is clearly dynamic, as
indicated by the effects of conditions as well as
differences between the structure of the `young coke'
and the `aged' coke.
A detailed analysis of the organic deposit on the
catalyst is required to elucidate the mechanism of coke
formation. The presence of polynuclear aromatics
(PNA) shown in Table 8 was con®rmed in the extract
from the spent catalyst after hydroprocessing a coal-
derived naphtha [62]. Yet, according to the boiling
range of the naphtha, only lighter PNA's (e.g., alky-
lated naphthalenes and acridines) are expected in the
feed. Similar species were identi®ed as notorious coke
makers by Appleby et al. [80] and Bakulin et al. [94].
Nagaishi et al. [73] reported that the apparent ®rst-
Fig. 20. Steady-state level of carbon on catalyst as function of H2
pressure [92].
Fig. 21. Effect of H2/feed ratio on the coke content of catalyst (NiV/SiO2, 723 K, 30 bar H2) [86].
E. Furimsky, F.E. Massoth / Catalysis Today 52 (1999) 381±495 399
Page 20
order rate constant for a residue conversion decreased
with increasing content of the aromatic carbon in the
residue. The mechanism shown in Fig. 22 is based on
the coupling of two naphthalene molecules via route
1b or two alkyl naphthalenes leading to coronene via
route 1a. In the latter case, two additional rings can be
formed via dehydrocyclization as depicted by dotted
lines. Beguin and Setton [95] observed coupling of
PNA aided by various metals. Also, coupling was
enhanced in the presence of a proton donating med-
ium, such as a Brùnsted acid [96]. In this case, the
formation of the carbonium cations is predicted. It was
established that such carbonium cations can combine
with neutral PNA rings to yield larger structures [97].
The coupling capability was signi®cantly diminished
after the Brùnsted acidity was destroyed by pretreating
the support with basic species [98]. The involvement
of carbonium cations was assumed in the mechanism
proposed by Gates et al. [99] for coking of anthracene.
Scaroni and Jenkins [100] assumed the participation
of carbonium cations in a study of several model
compounds in the presence of a CoMo/Al2O3 catalyst.
These authors proposed that the carbonium cations
were formed by electron transfer between the aromatic
and hetero rings and the catalyst surface.
The involvement of free radicals in coke formation
has been proposed by several authors [101±104]. The
probability for such a mechanism increases with
increasing temperature, which favors the formation
of free radicals. An example of this mechanism,
proposed by Lewis and Singer [101], is shown in
Fig. 23. A similar mechanism may be involved during
coke formation from N-containing bases. In this case,
two molecules adsorbed at neighboring Lewis acid
sites may couple at temperatures favoring dehydro-
genation of the heteroring. Once partially dehydroge-
nated, the heteroring may couple with an aromatic ring
according to the mechanism in Fig. 23. Absi-Halabi
et al. [6] proposed the polymerization mechanism in
Fig. 24 to illustrate coke formation from both light
and heavy hydrocarbons. Experimental support for
this mechanism was provided by Nohara and Sakai
[104] from coking studies of large aromatic structures
with small molecules such as butadiene.
Table 8
PNA identified in the extracta [62]
1 Chrysene
2 Benzochrysene
3 Benzophenathrene
4 Benzofluoranthene
5 Perylene
6 Benzoperylene
7 Benzacridine
8 Benzcarbazole
9 Coronene
a Decreasing order of abundance.
Fig. 22. Tentative mechanism of coupling of naphthalene mole-
cules [62].
Fig. 23. Free radical mechanism for formation of coke from
anthracene [101].
Fig. 24. Mechanism of coke formation by polymerization [6].
400 E. Furimsky, F.E. Massoth / Catalysis Today 52 (1999) 381±495
Page 21
Spectroscopic techniques reveal information on
chemical structure without destroying the coke on
the catalyst. In this regard, 13C NMR alone or in
combination with other techniques has been used most
frequently. It appears that trends established from the
chemical analysis of coke and extracts can be con-
®rmed by this technique. For example, the increase in
the coke aromaticity with increasing severity of the
operation has been con®rmed by several studies [105±
107]. An example of increasing temperature on coke
aromaticity is shown in Fig. 25 [105]. Thus, increas-
ing the temperature from 335 to 3958C increased the
content of the aromatic carbon from about 44 to
almost 70%. Because some carbon atoms in highly
aromatic structures are `invisible' to 13CNMR, these
values may underestimate the aromaticity [108]. The
aromaticity of the coke formed at 3358C was close to
that of the feed. Myers et al. [109] have observed
increasing aromaticity with the age of the catalyst.
Weissman and Edwards [110] used the 13C NMR
technique to evaluate an aged catalyst after hydro-
processing a high aromatic gas oil and a low aromatic
naphtha. The aromaticity of the coke deposit varied
from 0.70 to 0.90 and from 0.30 to 0.60 for gas oil and
naphtha, respectively. The naphtha derived deposit
had longer aliphatic chain lengths but relatively few
aliphatic attachments bridging between the polynuc-
lear aromatic groups. The gas oil derived deposits
were highly aromatic and much more condensed, with
very short bridging groups or direct phenyl-phenylene
bond types. This deposit was described as dense and
compact, whereas the naphtha derived deposit as less
dense and `¯uf®er', as the carbons in the deposit had a
much higher degree of freedom because of the numer-
ous aliphatic chains present. A fair amount of carbon
attached to heteroatoms was also present in the depos-
its, especially for the naphtha derived coke.
Perhaps the most detailed evaluation of the structure
of coke formed on the surface of hydroprocessing
catalysts was conducted by Fonseco et al. [58,108]
using 13C NMR. These authors studied CoMo/Al2O3
and NiMo/Al2O3 catalysts which were deactivated
under different conditions. The catalysts in Fig. 26,
identi®ed by NT, are spent NiMo/Al2O3 catalysts
taken during the hydroprocessing of an atmosphericFig. 25. Effect of temperature on aromaticity of coke (NiMo/
Al2O3, 12.7 MPa H2) [105].
Fig. 26. Evolution of aromaticity (a) protonated aromatics (b) and
graphitic fraction (c) as functions of time on-stream [58].
E. Furimsky, F.E. Massoth / Catalysis Today 52 (1999) 381±495 401
Page 22
residue, whereas those identi®ed as K are spent CoMo/
Al2O3 catalysts. The spent catalyst NM was from the
treatment of a solution of pyrene in n-heptane. The
same catalysts are shown in Fig. 14. It is evident that
the aromatic fraction of the coke rapidly increased
during the ®rst 5 days on stream and then increased
only slightly thereafter. The graphitic structure of the
coke increased rapidly during the ®rst 4 days on
stream and then decreased progressively with aging
time. It appears that the graphitic structures are better
formed at the beginning of coke deposition when there
is more space available for coke rearrangements. More
graphitic carbon was formed at the exit of the bed
because much less metal deposits were present, i.e., a
lower competition with the coke deposition for the
space. Mara® and Stanislaus [111] studied hydropro-
cessing of two very low metal content feeds using a
NiMo/Al2O3 catalyst. They observed that the aroma-
ticity, determined by 13C NMR, of the coke formed
during the initial stages was higher than that formed
later, indicating that the coke formed initially was
undergoing hydrogenation and presumably was con-
verted to lighter fractions.
Magnoux et al. [67] used gas chromatography-mass
spectroscopy (GC±MS) for characterizing catalyst
coke during pyrolysis of toluene. The main compo-
nents identi®ed in the methylene chloride extract and
the mechanism of coke formation proposed by these
authors are shown in Figs. 27 and 28, respectively. It is
evident that both 13CNMR and GC±MS are excellent
tools to con®rm participation of the aromatic struc-
tures during coke formation.
4.1.2. Effect of restrictive diffusion
It is well known that catalytic hydroprocessing can
be in¯uenced by restrictive diffusion in catalysts. This
effect becomes critical when the size of reactant
molecules approaches the pore diameter. It is impor-
tant to understand the dependence of the restrictive
effects on the nature of the feed and temperature under
the reaction conditions, as they may in¯uence the
structure and distribution of coke as well as its rate
of formation. Although restrictive diffusion phenom-
ena apply equally to metal deposits and coke deposits,
information relevant to the former will be discussed in
the next chapter.
Diffusivity measurements of solutes from different
solutions in the pores of fresh and aged catalysts
provide valuable information on restrictive diffusion.
Such information is crucial for the understanding
catalyst deactivation. If the solute is relatively small
compared with the pore size, its effective diffusivity
can be related to bulk diffusivity by the following
equation [112]:
De � Db�
�(4.1)
where De is the effective diffusivity, Db the bulk
diffusivity in free solution, and � the porosity and �the tortuosity of the catalyst. When the solute mole-
cular size approaches that of the pore size, the effec-
tive diffusivity becomes less than predicted by
Eq. (4.1). To account for this, a restrictive factor,
F(�) is added to Eq. (4.1), i.e.,
De � Db�
�� F��� (4.2)
where � is the ratio of the solute critical molecular
diameter to pore diameter (�ds/dp). The following
empirical correlation was proposed for the restrictive
factor [113]:
F��� � De�
Db�eÿ4:6� (4.3)
Studies conducted by Chantong and Massoth [114]
with polyaromatic compounds using aluminas of var-
ious pore sizes gave a similar relationship, viz.,
F��� � De�0
Db
1:03eÿ4:5� (4.4)
con®rming the general validity of this form for both
adsorbing and nonadsorbing solutes. Another form of
the restrictive factor, proposed by Beck and Schultz
[115] is:
F��� � �1ÿ ��z (4.5)
This equation can also be approximated by the
following empirical expression:
F��� � eÿb� (4.6)
where b is a constant. Then, a logarithmic plot of De/
Db� versus ln(1 ÿ �) should yield a straight line with
slope equal to z and intercept equal to �0. A nonlinear
isothermal adsorption of solute can be related to its
bulk concentration C by a Freundlich isotherm, i.e.,
q � mC1=n (4.7)
402 E. Furimsky, F.E. Massoth / Catalysis Today 52 (1999) 381±495
Page 23
where q is the amount of the adsorbed solute and m
and n are constants. This approach was used by
Chantong and Massoth [114] to measure restrictive
diffusion of naphthalene and coronene solutes in
cyclohexane solution in aluminas of varying pore
sizes at ambient temperature. The restrictive factor
decreased with increasing �. The restrictive factor was
less than unity even when the molecular diameter was
a relatively small fraction of pore diameter.
The work by Chantong and Massoth [114] was later
extended by Massoth et al. [116±118] to include three
NiMo/Al2O3 catalysts whose properties are shown in
Fig. 27. Components identified in the extract of the spen catalyst used for pyrolysis of toluene [67].
E. Furimsky, F.E. Massoth / Catalysis Today 52 (1999) 381±495 403
Page 24
Table 9 [118]. Some parameters in this table will be
included in a later discussion. A signi®cant difference
in the surface area and average micropore diameter
among these catalysts is quite evident. To avoid
external mass transport, the catalysts were crushed
and sieved to 35±65 mesh. The eight solutes studied
were naphthalene (NAP), anthracene (ANT), 2,3-ben-
zanthracene (BAN), 1,2,5,6-dibenzanthracene (DBA),
coronene (COR), 9-phenylcarbazol (9-PC), tetraphe-
nylporphyrin (TPP) and tetra(4-biphenyl)porphyrin
(TBP). The physical properties of the solutes are
shown in Table 10. Aliphatic hydrocarbons such as
cyclohexane, n-heptane and iso-octane were used as
solvents. The effective diffusivity, De, was determined
from the concentration decay time data from the
diffusion experiments. In order to calculate De, dimen-
sionless time and dimensionless concentration rela-
tionships were developed to back-calculate the ratio of
dimensionless time for the nonlinear isotherm case
�N, to real time t, viz.,
De � �N
t�r2 (4.8)
where r is the particle radius. Alternatively, De can be
calculated from the ratio of dimensionless time for the
linear isotherm case, �L, to real time and the adsorp-
tion constant, K, the ratio of equilibrium uptake to
®nal concentration, viz.,
De � �L
t��� �K�r2 (4.9)
Fig. 28. Mechanism of thermal formation of coke [67].
Table 9
Physical properties of catalysts [118]
NiMo-125 NiMo-225 NiMo-325
BET Sg (m2/g) 112 204 291
�p (g/cm3) 1.28 1.32 1.30
Vp (cm3/g) 0.49 0.45 0.45
� 0.627 0.594 0.585
�m 0.465 0.451 0.447
�M 0.162 0.143 0.138
!m (AÊ ) 138 71 54
�m (AÊ ) 1.97 1.76 1.70
dm (AÊ ) 174 83 62
!M (AÊ ) 10674 6318 9110
�M (AÊ ) 1.67 1.71 1.79
dM (AÊ ) 12174 7296 10793
Sg, �, Vp and d are surface area, density, pore volume and pore
diameter, respectively.
�, ! and � porosity, mean value and standard deviation of a log-
normal distribution function, respectively.
Subscripts m and M are for micro and macro pores, respectively.
Table 10
Physical properties of solutes [116]
Solute Vaa
(cm3/mol)
dcri
(nm)
dmax
(nm)
daver
(nm)
NAP 157.2 0.74 0.88 0.79
ANT 214 0.74 1.12 0.88
BAN 246 0.74 1.36 0.92
DBA 302.4 0.85 1.57 0.98
COR 294.6 1.11 1.18 0.98
9PC 273.6 1.13 1.15 0.95
TPP 711.4 1.57 1.90 1.31
TBP 1065.8 2.18 2.72 1.50
a Va: Molar volume at boiling point.
404 E. Furimsky, F.E. Massoth / Catalysis Today 52 (1999) 381±495
Page 25
where � is the particle density. For a complete data
treatment, the bulk diffusivity, Db, is also needed. A
nonlinear regression analysis of literature data yielded
the following equation applicable to aromatic solutes
in aliphatic solvents:
Db � 18:7� 10ÿ8 M0:30b T
�0:84b V0:55
a
�cm2=s� (4.10)
where Mb is the solvent molecular weight, Va is the
molar volume of solute at its boiling point and �b is the
solvent viscosity. To check the Db values obtained
from Eq. (4.10) with the experimental data, Eqs. (4.2)
and (4.6) were combined to give
lnDe
�� ÿbds
1
dp
� lnDb
�(4.11)
Straight line ®ts of the data plotted as ln(De/�)versus 1/dp for the solutes in cyclohexane are shown
in Fig. 29 [116], where the intercepts are equal to
Db/� . To calculate Db, � has to be determined. This
required data from diffusion experiments with a solute
having a known value of Db such as anthracene, i.e.,
Db � 1.2 � 10ÿ5 cm2/s. This value of Db yielded
value of � of 1.37. Eqs. (4.2) and (4.5) can be com-
bined and expressed in logarithmic form to give
ln � � Z ln�1ÿ �� ÿ ln � (4.12)
where � is the diffusion constrictive factor (�De/�Db).
The parameter Z can now be estimated fromEq. (4.12) from the slopes in Fig. 30 [116]. The best
Z value was obtained by using the critical dimension,
i.e., in agreement with the value of 4.0 predicted by
hydrodynamic theory. The maximum and average
dimensions gave unrealistic Z values. Therefore, the
use of the critical dimension appears to be the best
choice for the solute dimension in computing �. The
nature of the aliphatic solvents had little effect on the
diffusivity constriction factor. The average tortuosity
factor can be determined using all the measured De
values by combining Eqs. (4.2) and (4.6) to give
lnDe
�Db
� ln � � ÿb�ÿ ln � (4.13)
A semilogarithmic plot of ln � versus �, using
critical dimensions of the solutes Table 10 is given
in Fig. 31 [116]. The � value estimated from the
intercept was 1.27 � 0.03 in a good agreement with
the previous estimate. The effect of temperature andFig. 29. Determination of tortuosity and bulk diffusivity in
cyclohexane [116].
Fig. 30. Comparison of Z factors obtained from different solute
molecular dimensions; & ± disk-shaped, ^ ± rod-shaped solutes
[116].
E. Furimsky, F.E. Massoth / Catalysis Today 52 (1999) 381±495 405
Page 26
H2 pressure on De values was also evaluated [117].
In the latter case, the effect of H2 pressure was found
to be insigni®cant. The effect of temperature was
determined by obtaining the experimental data for
COR, TPP and octaethylporphyrin at 298, 313 and
333 K. These results are shown in Fig. 32. The equa-
tion relating the restrictive coef®cient with tempera-
ture is,
ln b � 1:30
Tÿ 2:62 (4.14)
Then, using Eqs. (4.6) and (4.14), it is possible to
estimate the temperature above which restrictive dif-
fusion can be neglected, i.e., F(�) > 0.9. For example,
at 625 K, a typical hydroprocessing temperature, a
restrictive factor of 0.89 is predicted for � � 0.2 and a
value of 0.75 for � � 0.5, con®rming that restrictive
diffusion is important under hydroprocessing condi-
tions when the molecular size of the reactants is
suf®ciently large compared to the catalyst pore size.
The concept of restrictive diffusion was used by Lee
et al. [118] to test validity of the random pore model
using the three NiMo/Al2O3 catalysts given in
Table 9. The results indicated the catalysts had a
bidispersed nature, i.e., the presence of both macro
and microporosity. Several monodispersed supports
were also tested. The random pore model assumes
three types of parallel diffusion passages, i.e., diffu-
sion through macropores, micropores and a series of
macropores and micropores. Effective diffusivity is a
combination of macropore and micropore diffusivities
(DM and Dm) and given by Smith [119] as
De � �2MDM �
�2m�1� 3�M�
1ÿ �M
�iDm (4.15)
The effectiveness factor for the entire pellet, �a, is a
function of the Thiele modulus, �a, viz
�a � 3�a coth�a ÿ 1
�2a
(4.16)
�a � R0
ks�p�i
De
� �1=2
(4.17)
where R0 is the radius of catalyst pellet, ks is the
intrinsic rate constant and �p is the catalyst pellet
density. It is evident from Eq. (4.17) that the Thiele
modulus depends on the effectiveness factor of the
microporous particles (�i). The sorptive data obtained
at ambient conditions suggest that macropores in the
bidispersed supports did not increase effective diffu-
sivities signi®cantly when compared with the mono-
dispersed supports, suggesting that effective
diffusivities were mainly in¯uenced by the average
micropore sizes. Then, the general form for expressing
Fig. 31. Determination of tortuosity factor and b constant [116].
Fig. 32. Variation of Db/De� with � [117].
406 E. Furimsky, F.E. Massoth / Catalysis Today 52 (1999) 381±495
Page 27
the restrictive diffusion effect becomes
F��� � �1ÿ ��z � D�
Db(4.18)
Lee et al. [118] also used their data to test the
validity of the globular-structure model proposed
Ruckenstein et al. [120]. This model assumes that
molecules diffuse through the macropores and then
into the micropores, i.e., the molecules can enter the
micropores only through the macropores. Thus, it
differs considerably from the random-pore model.
Very poor correlations were obtained by using this
model to ®t the diffusion data, suggesting that this
model has little validity for hydroprocessing catalysts.
The dif®culty in obtaining effective diffusivity data
at typical hydroprocessing temperatures can be over-
come by obtaining such data in conjunction with
catalytic reactions. However, this can be a rather
dif®cult task in the case of realistic feeds compared
with model compounds studies. For this purpose, it is
necessary to express the effect of temperature on bulk
diffusivity (Db). The Wilke and Chang [121] equation
can be expressed as
Db � B
V0:6A
(4.19)
where B is a function of temperature and viscosity of
solvent, and thus, is a constant; and VA is the molar
volume of reactant at its normal boiling temperature.
Substitution of Eq. (4.19) in combined Eqs. (4.2) and
(4.5) yields
DeV0:6A
�� B
��1ÿ ��z (4.20)
The logarithmic plot of DeV0:6A =� against 1 ÿ � for
the catalysts in Table 9 and four solutes gave a z value
of 6.9 when � values of the fresh catalyst were
considered [122]. This would indicate signi®cantly
larger restrictive effect than expected. However, when
a correction was applied to � values to account for a
decrease in the pore mouth size due to coke, a reason-
able z value of 4.9 � 0.5 was obtained. It was indi-
cated by Prasher et al. [123] that the tortuosity factor
can also be affected by coke deposits.
Several studies indicate that the effective diffusivity
depends upon the equilibrium partition coef®cient
de®ned as the ratio of the solute concentration within
the porous material to that in the bulk solution [123±
126]. The former depends on the adsorption strength
of solute and solvent. Thus, the effective diffusivity is
smaller for a solute having a strong adsorption
strength than for a non-adsorbing solute. Also, the
effective diffusivity of a solute would be higher in the
case of strong adsorption of solvent. Adsorption
strength affects the radial distribution of solute within
the pore. It was shown by Malone and Anderson [127]
that if the solute strongly adsorbs on the pore walls, the
restrictive effect would be more important because the
solute close to the pore wall exhibits a greater drag
force than that near the centerline. It is obvious that the
adsorption decreases with increasing temperature,
resulting in an increase of the effective diffusivity.
Lee et al. [128] did not observe a signi®cant tempera-
ture effect on the effective diffusivity under typical
hydroprocessing conditions. They concluded that the
adsorption became unimportant at these temperatures.
The additional effect of solvent on the data obtained
under reaction conditions would arise from the dif-
ferent solubility of H2 in different hydrocarbons and
different viscosity. Apparently, effective diffusivity
and pore size of a catalyst will change with time on
stream. This is supported by their values for fresh and
spent catalysts shown in Table 11 [129]. The level of
decrease of these parameters depends on several fac-
tors, e.g., time on stream, properties of feed and
catalyst, operating conditions, etc.
4.1.3. Kinetics of coke formation
There is an abundance of information on models for
describing the kinetics of coke formation [130,131].
Some of these models were used to study deactivation
under conditions which differ markedly from hydro-
processing. Thus, they may not pay adequate attention
to the restrictive diffusivity phenomena which are
Table 11
Effective diffusivity and pore diameter of fresh and spent catalysts
[129]
Effective diffusivity
(De � 106 (cm2/s))
Pore
diameter (AÊ )
NiMo-125
fresh 3.59 175
spent 2.65 153
NiMo-325
fresh 2.02 62
spent 1.31 52
E. Furimsky, F.E. Massoth / Catalysis Today 52 (1999) 381±495 407
Page 28
occurring during hydroprocessing. Without fully
recognizing this fact, such models may only indicate
some trends relevant to intrinsic kinetics. The concept
of restrictive diffusivity was discussed above in order
to put some of the deactivation models in prospective.
It is to be noted that there are several models treating
the kinetics of coke formation in parallel with the
formation of metal deposits. These models will be
presented in the subsequent chapter.
Perhaps the most widely used kinetic model was
that proposed by Voorhies [132] in 1945 to describe
coking of cracking catalysts, i.e.,
C0 � Atn (4.21)
where C0 is the amount of coke on the catalyst at time
t. The correlation coef®cients (A and n) are usually
obtained experimentally for a particular system. This
equation may be more applicable to cracking cata-
lysts for which it was proposed. In this case, the size
of the catalyst particles is signi®cantly smaller and
the contact time shorter than for hydroprocessing
catalysts. Also, the coke build-up with time exhibits
a different pattern compared with that observed for
the latter. Further, in the case of cracking catalysts, the
effect of coke on the loss of activity is more linear
than in the case of hydroprocessing catalysts.
Attempts were made to advance Voorhies' model
and/or adapt it to hydroprocessing conditions [133±
135]. These investigations were reviewed by Gualda
and Toulhoat [7].
It is well established that in the case of hydropro-
cessing catalysts, at least two regions of coke lay down
always exist [6,70]. As shown in Fig. 33 [6], the ®rst
region occurs during the initial stages of the operation
when coke is rapidly formed before reaching the
second, the steady-state region in which the coke
lay down is very slow. Near the end of the operation,
when the catalyst has lost most of its activity, the coke
build-up increases. The catalyst retains a substantial
portion of its original activity inspite of the rapid coke
deposition during the initial stages. In the steady-state
region, the overall coke lay down and the activity loss
will follow a different pattern than that during the
initial stage. Thus, part of the coke deposited initially
will have little effect on the catalyst activity in the
steady state. These facts were taken into consideration
in the pore-plugging model developed by Newson
[136]. According to this author, the `fast' coke formed
initially takes up about one third of the porosity,
whereas the `slow' coke and metals take up the
remainder of the porosity. The `fast' coke is typically
formed during the ®rst 50 h on stream. At any time
greater than 50 h, the weight fraction of coke on the
catalyst, Q, is constant, i.e.,
Q � WC
Wf �WC �WMS
� constant (4.22)
where Wf is weight of catalyst, WC weight of coke and
WMS is weight of metal sul®des. The coke rate in the
steady-state (RC) is expressed in terms of the metal
deposition rate, RMS, as follows:
RC � Q
1ÿ Q
� �RMS (4.23)
whereas the coke plugging rate, Rpl, is given by
Rpl � 1
�
Q
1ÿ Q
� �RMS (4.24)
where � is the density of the fast coke.
Masamune and Smith [137] have assumed three
types of fouling occurring during a main reaction
depicted as A! B, where A and B represent reactant
and product, respectively. The fouling results from a
partial conversion of A and B as well as that of an
impurity in the feed, S, to a solid deposit (presumably
coke) on the catalyst, i.e.,
1. B! C series fouling,
2. A! C parallel fouling,
3. S! C independent fouling.
This approach may have some relevance to hydro-
processing if one assumes A to be a mixture of H2 andFig. 33. Typical example of surface area change and coke
formation as a function of time on-stream [6].
408 E. Furimsky, F.E. Massoth / Catalysis Today 52 (1999) 381±495
Page 29
a light feed containing poisons such as nitrogen bases.
The formation of coke C may proceed according the
mechanism in Fig. 24 proposed by Absi-Halabi et al.
[6]. The ®rst-order rate expressions of the fouling
reactions are:
Series fouling :dq
dt� kBfCB 1ÿ q
q0
� �(4.25)
Parallel fouling :dq
dt� kAfCA 1ÿ q
q0
� �(4.26)
Independent fouling :dq
dt� kSfCS 1ÿ q
q0
� �(4.27)
where CA, CB and CS are concentrations of A, B and S,
kBf, kAf and kSf rate constants for the series, parallel
and independent fouling, respectively, and q and q0 the
amount of coke at time t and that corresponding to
complete deactivation, respectively. A stepwise
numerical technique was applied to solve these equa-
tions with the aim of obtaining the effectiveness factor.
However, parameters such as critical diameter of
reactant molecule, pore radius, porosity, etc. or their
change with time and/or conditions were not consid-
ered. Nevertheless, the results of these calculations
indicated several trends regarding deactivation, e.g.,
for series fouling, the deactivation is least for the
catalyst with the lowest diffusion resistance for the
main reactant; for parallel fouling, catalysts with some
diffusion resistance are more stable for long process
times; and for independent fouling, the deactivation
is least when the diffusion resistance of the main
reactant is a minimum and that of the contaminant
is a maximum.
The kinetics of coke formation during hydroproces-
sing of a vacuum gas oil was investigated by de Jong
[138,139]. In this case, a CoMo/Al2O3 catalyst was
crushed and sieved to obtain a 30±80 mesh size. Both
the thermal and catalytic sources of coke were con-
sidered. In this case, thermal coke results from con-
densation of aromatic radicals which can be supressed
by active hydrogen, whereas catalytic coke is pro-
duced via dehydrogenation reactions. For the rates of
catalytic coke lay-down, the following Langmuir±
Hinshelwood type kinetic equation was used:
Rc � kcKadsCq
1� KadsCq
(4.28)
where Cq is the concentration of coke precursor, Q,
and Kads its equilibrium adsorption constant, and kc is
the rate constant dependent on the amount of coke on
the catalyst, viz
kc � kc;0 1ÿ D
Dc;max
� �(4.29)
in which D is the amount of coke deposited. Dc,max
was estimated by extrapolation of the steady-state
coke-time curve to zero time. This would imply that
catalytic coke is deposited in the early stages. For the
formation of thermal coke, de Jong [138,139] assumed
the following mechanism:
Q! P�
H2 � 2H�
P� � H
� ! P
P� � P
�P2
P2 ! coke
In this scheme, the coke precursor generates radical
P�
which is either terminated by H�
or converted to
coke. The rate of thermal coke formation was
expressed as:
Rt � ktC2q=PH2
(4.30)
Then, the total rate of coke deposition, R, is
R � Rc � Rt (4.31)
As the coke in pores reduced the liquid holdup, this
was accounted for by the following equations:
�c � mc
k(4.32)
�L � 0:15� VP� �B ÿ �c (4.33)
where �c is the coke holdup, mc the weight of coke, k
the density of the coke, �L liquid holdup, VP pore
volume of catalyst and �B bulk density of the catalyst.
In this case, the coke holdup accounts for coke in the
pores, whereas the liquid holdup accounts for volume
of the liquid in the reactor. The model was success-
fully tested for predicting the effects of temperature
and H2/feed ratio on coke formation.
Both active site blocking and pore plugging by coke
was considered in the model developed by Haynes and
Leung [140,141]. The model was based on the
assumption that the catalyst consists of compacted
E. Furimsky, F.E. Massoth / Catalysis Today 52 (1999) 381±495 409
Page 30
microparticles, i.e., the porosity inherent within the
particles was microporosity and voids due to the space
between the compacted particles was macroporosity.
The model was developed to simulate properties of
two aged catalysts for which a signi®cant loss of
microporosity was observed while macroporosity
was relatively unaffected during the deactivation per-
iod. The microparticle deactivation was assumed to be
uniform and the microeffectiveness factor was
assumed to be near unity due to the small diffusion
paths involved. Thus, the macropores provided the
access of the reactant molecules to the active sites
within the micropores. These authors derived several
mathematical equations. For example:
� � �0
�1ÿ � �1=2(4.34)
where � and �0 are the ratios of molecular radius to
effective pore radius for the actual and coke free
micropores, respectively, � � 2Ws/�pr0 where Ws is
the weight of coke for complete deactivation, �p is the
density of coke and r0 is the effective pore radius; is
the reduced coke concentration, e.g., W/Ws. The fol-
lowing equation was used to calculate the rate of
coking:
Robs � �x�1ÿ �y��CAS (4.35)
where �x is the microparticle density, �y the particle
porosity, � the effectiveness factor, k the rate constant
and CAS the surface reactant concentration. Several
conclusions relevant for catalyst design resulted from
this study. For example, an optimum macroporosity
exists for maintaining acceptable activity and as the
intrinsic activity increases, the optimum macroporos-
ity shifts to higher values. Also, the catalyst life can be
increased by increasing the micropore size, but this
may be accompanied by loss of activity. With respect
to initial activity, catalysts possessing a low intrinsic
activity are not greatly affected by macroporosity over
a wide range of �y values. For more active catalysts,
macroporosity is essential for good initial activity.
Richardson et al. [91] developed a model to predict
coke formation during the initial stages of hydropro-
cessing of heavy feeds. Based on the amount of coke
and catalyst properties, a uniform distribution of coke
in a monolayer like form was assumed. Thus, the
maximum coke which can accumulate on the catalyst
is equal to the monolayer coverage. The monolayer
calculation assumed that most of the coke originates
from the asphaltenes in the feed. In the proximity of
the active metal crystallites, a cleared annular zone
was assumed (Fig. 34). Inside the cleared zone, no
coke is present. Similar assumptions were made by
Diez et al. [105] and van Dorn and Moulijn [142]. The
alumina surface will remain clear as long as the sur-
face ¯ux of hydrogen is greater than the critical value
of the radius of the cleared zone. For the coke buildup,
Richardson et al. [91] derived the following ®rst order
kinetic equation:
C � Cmax�1ÿ eÿkw� (4.36)
where C is the actual amount of carbon on the catalyst
and Cmax the maximum carbon deposition, i.e., a
complete monolayer; w is the cumulative feed to
catalyst ratio and k is an adsorption constant. The
solid line in Fig. 35 represents the model prediction
Fig. 34. Schematic representation of catalyst surface, showing a
cross section through metal crystallites [91].
Fig. 35. Carbon content of catalyst as a function of cumulative
feed/catalyst ratio (NiMoAl2O3, 703 K, 13.8 MPa) [91].
410 E. Furimsky, F.E. Massoth / Catalysis Today 52 (1999) 381±495
Page 31
which agreed well with the experimental data.
Another prediction of the model includes a similarity
in the structure of the coke deposited on the catalyst
during initial stages and asphaltenes in the feed. Thus,
a large portion of the former could be extracted.
Similar H/C and N/C ratios of the extractable portion
of the deposits and that of the bitumen feed was also
observed by Chu et al. [143]. However, the density and
the average molecular weight of the extract was
signi®cantly greater than that of the bitumen. The
model presented by Richardson et al. [91] suggests
that most of the active sites will survive the initial
rapid coke deposition. Yet, it is well known that a
relatively large portion of the original catalyst activity
is lost during the initial stages. These authors clari®ed
this issue by taking into consideration the change in
physical properties of the aged catalyst, i.e., surface
area and pore size distribution. The former decreased
from 317 to 157 m2/g, whereas pore volume decreased
from 0.57 to 0.25 cm3/g. The pore size distribution and
reduction in the effective diffusivity are shown in
Fig. 36. The latter was estimated from the following
equation:
De;c
De;f� �c
�f
eÿ��cÿ�f� (4.37)
where the subscripts c and f are for the coked and fresh
catalysts, respectively. The predicted ratio of the
diffusivity of the coked catalyst compared to the
diffusivity of the fresh catalyst decreases rapidly
below a pore radius of approximately 8 nm, reaching
0.06 at 2 nm. It is interesting that the peak in the pore
size distribution of the aged catalyst in Fig. 36 occurs
at about 2 nm as well. This suggests that the feed
molecules may be excluded from pores with radius
smaller than 2 nm.
4.1.4. Structure and distribution of coke
Advancements in analytical techniques such as
temperature programmed oxidation (TPO) and reduc-
tion (TPR), X-ray photoelectron spectroscopy (XPS),
high resolution electron microscopy (HREM), Fourier
transform infra-red (FTIR), Laser Raman spectro-
scopy (LAS) and others can provide information on
the distribution and physical structure (topology) of
coke on the catalyst. Researchers could only speculate
on these aspects of coke before some of these tech-
niques became available.
One of the ®rst studies on the nature of coke on
catalysts was conducted by Haldeman and Botty [144]
using an X-ray diffraction technique. It was concluded
that coke was a ®nely divided, highly dispersed phase,
present within the pore structure of the catalyst. Both
pseudo-graphitic and amorphous structures were pre-
sent. Using a similar technique, Appleby et al. [80]
observed spherical particles of less than 100 AÊ dia-
meter for coke formed from various model com-
pounds. In both these studies, cracking catalysts
were investigated. Nevertheless, because they repre-
sent the ®rst attempts to characterize coke on catalysts,
it is felt appropriate to mention these studies in this
review.
The HREM technique revealed the presence of
curved and buckled structures of coke with occasional
concentric circles on a spent CoMo/Al2O3 catalyst
[145]. The coke resembled heat treated carbon,
although a little less developed [146]. Also, the part
of the catalyst covered with coke had a homogeneous
appearance. The coke, consisting of small irregular
structures covering most of the surface but not in the
proximity of active sites, was observed by van Dorn
et al. [142,147]. These results are consistent with the
work published by Fleisch et al. [148], who observed
an increase in the Mo/Al ratio by XPS with increase in
the coke level on the catalyst, con®rming that coke is
preferentially deposited on the bare support. Dorn
et al. [142,147] proposed that at larger distances from
the catalytic sites, the coke consists of a three dimen-
sional network. Thus, the major part of the coke is
Fig. 36. Pore size distribution based on surface area and reduction
of adsorptive diffusivity as a function of pore radius (conditions as
in Fig. 35) [91].
E. Furimsky, F.E. Massoth / Catalysis Today 52 (1999) 381±495 411
Page 32
covering the support rather than the active phase,
suggesting that there may not be any correlation
between the amount of coke on the catalyst and
catalytic activity. However, it was shown by Chu et
al. [143] that a correlation may be obtained after the
extractable portion of the deposit blocking the micro-
pores, is removed. The coke, which was in proximity
of active sites, could be catalytically hydropyrolyzed
during TPR experiments [149]. The ease of removing
the coke during hydrogen gasi®cation was con®rmed
by Hughes et al. [150]. The model of a hydroproces-
sing catalyst under reaction conditions proposed by
van Dorn et al. [147] is shown in Fig. 37. The model
suggests that the support is almost entirely covered
with coke, whereas the slabs of active phase are not
covered. It is believed that coke on the support consists
of several layers, i.e., three-dimensional network.
The slabs of active phase may participate in coke-
removing reactions during hydrogen gasi®cation.
It was indicated earlier that properties of the feed
in¯uence the structure of the coke on the catalyst.
Massoth et al. [40,151,152] studied NiMo/Al2O3 cat-
alyst having an average pore diameter of 182 AÊ , used
for hydroprocessing of anthracene, a high aromatic
gas oil and bitumen feeds. Little pore plugging
occurred because of the large pore size of the catalyst.
However, there was a difference in the surface area as
the result of the different feeds. Thus, for anthracene
and gas oil, a rather small decrease in surface area was
observed, whereas for coke produced from bitumen,
the surface area actually increased. The authors [151]
attributed these observations to the porosity of the
coke contributing to the overall surface area. In the
case of anthracene and high aromatic gas oil, a
compact aromatic, graphitic type of coke is formed.
On the other hand, aromatics (two or three rings) in the
bitumen contain large aliphatic groups attached to
them, which may prevent condensation into fused
rings in the pores [153]. Then, the coke from bitumen
is expected to possess a higher porosity than that from
anthracene and gas oil. Pores of 200 AÊ and higher
were observed in the deposit on the catalyst after the
bitumen treatment [143]. A signi®cant effect of the
origin of the feed on the textural properties of coke
was demonstrated by Aldag [154]. In this case, coke
on the catalyst after hydroprocessing the residue
derived from a Maya crude approached the structure
of a thermal coke, whereas that after hydroprocessing
the residue derived from a Honda crude showed the
presence of a catalytic coke with ®laments on the order
of 100±200 nm in diameter.
The topology of the coke deposits on aged catalysts
was investigated by de Jong et al. [86,138,139,155],
using XPS. The catalysts (CoMo/Al2O3 and Mo/
Al2O3) were crushed to 30±80 mesh and presul®ded
prior to the aging tests using a gas oil feed. For both
catalysts, about 25% coke was deposited. Two types of
coke were assumed, i.e., thermal and catalytic. The
former tends to agglomerate, whereas the catalytic
coke tends to spread on the catalyst surface. In the case
of the CoMo/Al2O3 catalyst, almost 96% of the sur-
face was covered by the coke. The calculated layer
Fig. 37. Model of fresh (a) and deactivated (b) catalyst [147].
412 E. Furimsky, F.E. Massoth / Catalysis Today 52 (1999) 381±495
Page 33
thickness corresponded to three to four layers of coke.
On the Mo/Al2O3 catalyst, only about 50% of the
surface was covered with the coke. Apparently, with
this catalyst, the coke tends to agglomerate near the
active phase. The use of small particle sizes ensured
that no coke gradient was present.
Using LRS, Van Langeveld et al. [156] observed
differences in the amount of carbon deposited in
various positions in the cross section of a quadro-lobe
extrudate. The different carbon distribution was attrib-
uted to several factors, i.e., the variations in the local
amount of active phase metal, the occurrence of local
hot spots and the orientation of the particle in the
reactor bed. Other studies were conducted to deter-
mine the radial distribution of the coke in the catalyst
particle. For example, Stohl and Stephens [88] have
determined the radial distribution of carbon during the
hydroprocessing a coal-derived feed. The results of
these analyses are shown in Table 12. Symbols A, B,
C, D and E are the radial position in the extrudate, i.e.,
E is in the center of the extrudate and A on its surface;
B is slightly below the surface, whereas C and D are at
one third and two thirds of the radius, respectively.
The catalyst identi®ed as 242-PS was from the very
early stages of the operation, whereas 242±43 and
242±527 were after processing of 43 lb of the feed/lb
of catalyst and 527 lb of the feed/lb of catalyst,
respectively. It is evident that during the early stages,
carbon deposited predominantly on the external
surface of the extrudate; however, in the course of
the operation, carbon gradually penetrated into the
interior of the extrudates.
The effect of mesoporosity on coke deposition
pro®les was investigated by Yoshimura et al. [157]
using three monomodal NiMo/Al2O3 catalysts. The
catalysts had similar chemical composition and shape
(0.79 mm extrudate) but had different average meso-
pore diameters. Thus, the catalysts B and C in Fig. 38
had average mesopore diameters of 10.8 and 22.4 nm,
respectively, whereas that of the catalyst A was
8.8 nm. It is evident that the mesopore diameter of
at least 10.8 nm is required to ensure diffusion of large
molecules into the catalyst interior; otherwise, large
molecules will deposit near the outer surface. More-
over, these authors suggested that deposits on the
catalyst exterior may hinder diffusion of the product
molecules from the catalyst interior. In the case of
®xed bed operation, the coke distribution pro®les
depend on the time on stream and the position in
the reactor. These effects were investigated in detail by
Tamm et al. [1]. Some interesting changes in the
pro®les are evident in Fig. 39. In the interior of the
particles, the level of coke increases linearly with
time. But at some point in the reactor, the coke level
on the exterior of the particles passes through a
maximum early on and then declines with time.
The coke level is the lowest at the reactor inlet and
the highest at the reactor exit at all times during the
run.
Using an NiMo/Al2O3 catalyst and coronene in
cyclohexane solution as the solute, Massoth and cow-
orkers [40,114,151] observed that coronene adsorbs
on both the alumina and active phase, whereas its
adsorption on the coke is nil. Then, the lowering in
adsorption with increasing coke is proportional to the
loss in surface area due to coke. The results in Fig. 40
[40] show the effect of coke on relative uptake of
Table 12
Carbon distribution (wt.%) [88]
Catalyst A B C D E
242-PS 5 5 3 2 2
242-43 5 3 3 2 2
242-527 7 6 6 7 7
Fig. 38. Radial concentration profiles of carbon on spent catalysts
by EPMA [157].
E. Furimsky, F.E. Massoth / Catalysis Today 52 (1999) 381±495 413
Page 34
coronene and relative diffusivity for the catalyst coked
with anthracene and a vacuum gas oil. These results
show that for the gas oil coke, the coronene adsorption
drops at 2 wt.% coke but exhibits little change there-
after. This implies that the coke is concentrated near
the mouth of the pores. On the other hand, catalyst
diffusivity measurements show a continual decrease
with the coke content. This suggests that the additional
coke builds on the original coke, without further
penetration into the pores, resulting in lowered diffu-
sivity due to pore mouth constriction. The anthracene
coked catalysts show a continuous decrease in cor-
onene uptake with coke content and a sharper decline
in diffusivities. These results show that for the same
amount of coke, the shape of the coke deposits should
be shallower than that from the gas oil coke. Thus, the
gas oil coke seems to deposit on the original coke,
whereas the anthracene coke penetrates further into
the catalyst pores. Based on these observations, the
two models shown in Fig. 41 [40] were proposed, i.e.,
one for the gas oil coke and the other for the anthra-
cene coke. In any case, as shown in Fig. 42, pore
diameter is a key parameter in determining the dis-
tribution of coke [158]. These effects become more
evident with increasing size of reactant molecules and/
or decreasing pore diameter.
Yang and Guin [159] developed a model which
assumes that porosity, pore size and effective diffu-
sivity are all a function of radial position in the catalyst
particle. The diffusion parameters were determined by
®tting a mathematical model to the experimentally
observed solute uptake. One unimodal (A) and one
bimodal (B) NiMo/Al2O3 catalyst in four different
particle sizes were examined. For this purpose, a
solution of quinoline in cyclohexane was used. The
results in Fig. 43 show that coke is the main con-
tributor to loss of porosity. Both a uniform and non-
uniform coke distribution was considered. For the
local degree of restrictive diffusion due to pore plug-
ging by coke, Yang and Guin [159] derived dimen-
sionless functions for the nonuniform porosity model
Fig. 39. Carbon distribution as function of reactor position and time [1].
Fig. 40. Effect of carbon on relative coronene uptake (RU) and
relative diffusivity (RD) [40]. Fig. 41. Idealized model of coke pores [40].
414 E. Furimsky, F.E. Massoth / Catalysis Today 52 (1999) 381±495
Page 35
via the following equations:
g1 � Kp�
Kp0�0g2 � KpKr�
Kp0Kr0�0(4.38)
For the fresh catalysts, g1 � g2 � 1. For spent uni-
form particles, g1 and g2 are constant but less than 1.
For nonuniform catalyst particles, g1 and g2 are func-
tions of radial position inside the particle. In these
equations, � and �0 are porosities for spent and fresh
catalysts, respectively, and Kp(Kp0) and Kr(Kr0) are
partition and restrictive factors for spent and fresh
particles, respectively. In the case of nonuniform
particles, the local pore diffusivity at any radial posi-
tion in the particle is given by
De � g2�0
�D1 (4.39)
Thus, the local diffusivity De can be signi®cantly
reduced from the fresh catalyst value D4 by the local
value of g2, which re¯ects the hinderance effects due
to the local reduction in pore diameter caused by coke
deposit. The numerical solution of the diffusion model
for both uniform and nonuniform distribution gave the
parameters shown in Table 13 [159]. In the former
case, extremely low values of diffusivities, or corre-
spondingly high values of tortuosities were obtained
for spent catalysts. For the crushed spent catalyst,
higher diffusivities and more reasonable tortuosities
were obtained. This indicates a nonuniform distribu-
tion of coke. Indeed, better values of the parameters
were obtained when a nonuniform model was applied.
4.2. Effect of coke on catalyst activity
Rapid coke formation during the initial stages of
hydroprocessing is an established fact. For some
feeds, the initial coke build-up has little effect on
catalyst activity [65]. As it was shown earlier, coke
is formed even during hydroprocessing of light feeds
such as naphtha. In this case, the size of the coke
molecules increases because of a gradual polymeriza-
tion until they begin to cover active sites. Then, the
average molecular weight of the coke as well as its
molecular diameter will be signi®cantly greater than
that of the largest molecules in the light feed. For
heavy feeds, physical deposition of the large asphal-
tenic molecules will speed up the rate of coke forma-
tion. This is supported by the results published by
Stohl and Stephens [160] who showed that boiling
point cut of the feed has a signi®cant effect on the
activity. Thus, processing a ÿ2908C feed using an
extrudate NiMo/Al2O3 catalyst caused a 23% loss of
hydrogenation activity compared to the fresh catalyst
but had no effect on HDS activity. At the same time,
Fig. 42. Effect of pore mouth diameter on catalyst deactivation [158].
Fig. 43. Cumulative pore size distribution by mercury porosimetry:
(1) fresh A; (2) spent A; (3) regenerated A; (4) fresh B; (5) spent B;
(6) regenerated B [159].
E. Furimsky, F.E. Massoth / Catalysis Today 52 (1999) 381±495 415
Page 36
processing ÿ4548C feed resulted in the 82 and 70%
loss of hydrogenation and HDS activity, respectively.
For feeds of a similar boiling point cut, the rate of coke
formation will be greater for the more aromatic feeds.
It is noted that the effect of coke on the catalyst
activity can be elucidated only for feeds containing
no metals. Otherwise, the effects of both coke and
metals on activity are compounded. However, some
information suggests that the deactivating effect of
metals becomes evident only after a certain metal
loading on the catalyst is attained [161]. Nevertheless,
in this part of the review, studies will be included
which deal mainly with the effect of coke on the
activity while paying little attention to metals.
Massoth and coworkers [152,162] used a Co/NiMo/
Al2O3 catalyst to study deactivation by coke. The
catalyst was crushed and sieved to 20±40 mesh and
subsequently coked in a high pressure autoclave to
varying levels of coke. For this purpose, a coal-derived
middle distillate was used. The effect of carbon con-
tent on the fraction of pore coverage determined by
coronene adsorption is shown in Fig. 44 [162]. The
activities of these catalysts were determined using
model compounds- dibenzothiophene for HDS, diben-
zofuran for HDO and indole for CNH. The effect of
carbon content on the relative activities (RA) is shown
in Fig. 45. The extrapolation of the results in Fig. 44
and 2 indicates a complete deactivation at about 20%
carbon on the catalyst. A simple model of coke
deactivation was developed to relate catalyst activity
to carbon content. In this model, the rate constant of
the deactivated catalyst (k) was given as
k � k0�1ÿ�c� (4.40)
where k0 is the rate constant for the fresh catalyst and
�c is the fraction of active sites covered by coke. Thus,
�c � 1ÿ k
k0
� 1ÿ RA (4.41)
Table 13
Diffusional parameters for uniform and nonuniform particles [159]
Catalyat � � Kp Kr � De x 106 (cm2/s)
Uniform model
Catalyst A
Fresh 0.055 0.89 0.88 2.1 100
Spent (extrudate) 0.094 0.82 0.80 1080 0.07
Spent (crushed) 0.094 0.82 0.80 10.5 7.1
Regenerated 0.054 0.90 0.89 11.5 17.1
Catalyst B
Fresh 0.050 0.90 0.90 1.1 100
Spent (extrudated) 0.084 0.84 0.83 116 0.44
Spent (crushed) 0.084 0.84 0.83 4.3 12.0
Regenerated 0.045 0.81 0.91 3.1 34.9
Nonuniform modela
Catalyst A 0.009 0.47 0.28 0.21 4.1 0.0015
Catalyst B 0.029 0.26 0.55 0.49 3.7 0.024
a Spent extrudates.
Fig. 44. Fraction pore coverage vs. carbon [162].
416 E. Furimsky, F.E. Massoth / Catalysis Today 52 (1999) 381±495
Page 37
The fraction of poisoned sites can also be given by
�c � Np
Nc
(4.42)
where Np is the number of coke covered sites and Ns is
the total number of active sites. The average number of
carbon atoms on a poisoned site at a given carbon
content is given as
C � Nc;a
Np(4.43)
where Nc,a is the total number of carbon atoms on the
poisoned sites. The ratio of carbon deposited on the
inactive support as well as on the active sites is de®ned
as
a � Nc;i
Nc;a(4.44)
Combining Eq. (4.42) to Eq. (4.44) gives
�c � Nc
Ns�1� a� C
(4.45)
where Nc is the total number of carbon atoms. Equa-
tion Eq. (4.45) can be rewritten in terms of carbon
content,
�c � 12C
ns�1� a� C
(4.46)
where C is the amount of carbon per gram of catalyst
(g C/g cat) and ns is the number of active sites/g cat in
mols. Finally, variation of C with carbon content
takes the form
C � �Cm (4.47)
where � is a proportionality constant and m is a
constant. Then Eq. (4.46) becomes
�c � �Cm (4.48)
where � � 1/12ns(1�a)� and n � 1 ÿ m. Combina-
tion of Eqs. (4.41) and (4.48) yields
1ÿ RA � �Cn (4.49)
ln �1ÿ RA� � ln � � n ln C (4.50)
The data ®t based on Eq. (4.50) is shown in Fig. 46
[162]. From this correlation, the parameters n, m and �can be estimated. The relationship between the cata-
lytically poisoned sites and the coke covered sites
(fraction pore coverage) is shown in Fig. 47. It is
evident that catalytic sites are deactivated to a much
greater extent compared to coked sites.
The conventional methodology proposed by Fro-
ment [163] has been widely used by other researchers
for the development of models predicting deactivation
by coke. In general terms, the mechanism includes the
folowing steps:
Fig. 45. Relative catalyst activity vs. carbon content; * ± HDS,
& ± HDO, ~ ± CNH [162].
Fig. 46. Activity correlation according to Eq. (4.50); * ± HDS,
& ± HDO, ~ ± CNH [162].
E. Furimsky, F.E. Massoth / Catalysis Today 52 (1999) 381±495 417
Page 38
Step 1 A� S � AS
Step 2 AS � RS
Step 3 RS � R� S
Step 4 A� S � A � S
Step 5 A � S � Coke
In this set of reactions, the reactant A adsorbs at
active site S to form AS, which is subsequently
converted to a product still adsorbed at the same site,
i.e., RS. The product R then desorbs and the active site
S is recovered. In parallel with these reactions, the
reactant forms a coke precursor A*S, which is con-
verted to coke. This approach was used by Kittrell
et al. [164±166] to derive the following equation:
ln a � ÿ kdK�ACA
1� KAKC � K�ACA � KRCR
t (4.51)
where a is the catalyst activity at time t; KA, K�A, KA
and KR are equilibrium adsorption constants of the
reactant, coke precursor and product, respectively, CA
and CR are concentrations of reactant and product,
respectively, and kd is the deactivation constant. These
authors assumed that the deactivation reactions were
signi®cantly slower than the hydroprocessing reac-
tions. In the case of hydroprocessing, a similar situa-
tion may be approached after the steady-state level of
coke is attained. Thus, the model may be applicable to
a catalyst which was precoked to a steady-state level.
Because a uniform coke lay down was assumed and
physical properties such as pore size distribution were
not considered, in the case of hydroprocessing cata-
lysts, this model can be applied only to the intrinsic
rate of coke deactivation.
Artega et al. [167,168] coked a CoMo/Al2O3 cat-
alyst with gas mixtures containing Ar and either 1,3-
butadiene or methylcyclopentane at 4508C. As shown
in Fig. 48 [167], the rate of coke formation was higher
from butadiene than from methylcyclopentane.
Fig. 49 [168] shows that the HDS and HYD activities,
de®ned as the conversion of thiophene and cyclohex-
ene respectively, decreased with coke loading and
reached almost zero above 16% of coke.
Fig. 47. Fraction poisoned active sites vs. fraction pore coverage;
* ± HDS, & ± HDO, ~ ± CNH [162]. Fig. 48. Kinetics of coke deposition; * ± methylcyclopentane,
&~ ± 1,3-butadiene [167].
Fig. 49. Effect of coke loading on HDS and hydrogenation (HYD)
activity; (**) ± HDS, (~~) ± HYD [168].
418 E. Furimsky, F.E. Massoth / Catalysis Today 52 (1999) 381±495
Page 39
The effect of the chemical composition of the feed
on catalyst deactivation was studied in detail by Stohl
and Stephens [169]. Using adsorption column chro-
matography, these authors isolated four different
groups of hydrocarbons from the feed (V-178), viz,
aliphatic hydrocarbons, neutral polycyclic aromatic
compounds (PAC), nitrogen polycyclic aromatic com-
pounds (N-PAC) and hydroxy polycyclic aromatic
hydrocarbons (HPAH). Subsequently, these fractions
were hydroprocessed in the presence of a NiMo/Al2O3
catalyst, both in powder form and extrudate form. The
activities of the fresh and aged catalysts were deter-
mined using the hydrogenation of perylene. The mea-
sured intrinsic activity losses of the powder catalysts
(�) and the measured remaining activities of the
extrudate catalysts (F) are correlated in Fig. 50. A
quantitative mathematical expression related these
parameters with the effective diffusivity [170]. Since
the intrinsic activity loss increased more rapidly than
the remaining extrudate activity, the dominant mode
of deactivation was homogeneous poisoning of active
sites. The aliphatic hydrocarbons and PAC fraction
caused less deactivation than the feed, while the N-
PAC and HPAH fractions caused more deactivation.
This trend in deactivation was inversely correlated
with the carbon content of the aged catalysts, i.e.,
deactivation was highest for the HPAH and lowest for
aliphatic hydrocarbons.
Weissman and Edwards [110] used two light gas
oils and two naphthas to study deactivation of several
NiMo/Al2O3 and CoMo/Al2O3 catalysts. The results
of this study are summarized in Fig. 51. The symbols
represent different catalysts, whereas the symbol
labels refer to different feeds, i.e., S and I to III are
from naphtha tests and IV and V are from gas oil tests.
It is evident that HDN follows similar trends with
respect to coke content for all feeds and catalysts,
whereas HDS of gas oils differs from that of naphthas.
In the latter case, it takes almost 6% of carbon before
any activity loss is observed. An interesting correla-
tion was obtained between the non-protonated aro-
matic carbon (determined by 13C NMR) and the pore
volume and the pore diameter. The authors proposed
that the origin of these differences is in the type of
carbon originated from the gas oils and from the
naphthas, the former being more compact while the
latter being less dense. Little effect of the initial cokeFig. 50. Effect of feed composition of intrinsic activity losses (�)
and remaining activities (F) [169].
Fig. 51. Effect of total carbon deposited on HDS (top) and HDN
(bottom) (623 K, 5.5 MPa) [110].
E. Furimsky, F.E. Massoth / Catalysis Today 52 (1999) 381±495 419
Page 40
deposition on HDS activity was observed by Zeuthen
et al. [68]. These authors used a solution of pyrene
and methylated pyrenes for coking an NiNo/Al2O3
catalyst to different levels of coke under typical
hydroprocessing conditions. The addition of ben-
zothiophene to feeds had little effect on the rate of
coke formation. Therefore, the HDS of benzothio-
phene in the pyrene solution was an ideal feed to study
the effect of coke formation on HDS. As the results in
Fig. 52 show, no loss of HDS activity was observed
before about 4 wt.% of coke was deposited. Subse-
quently, the HDS rate declined exponentially.
Diez et al. [105] prepared hydroprocessing catalysts
with varying amounts of coke in the absence of metal
deposits by using a highly aromatic cycle oil (190±
3808C). A second feed, containing 50% deashed coal
and 50% of naphtha, containing primarily alkyl-sub-
stituted naphthalenes, was used to prepare a coked
catalyst with a higher carbon content. Metal contami-
nants in the deashed residue were low, less than 1 ppm
for V, Ni and Ti and about 200 ppm Fe. The results
showed a negligible difference in the amount of coke
formed between 20 and 70 h with the cycle oil. The
catalyst used with the coal residue for 70 h at 4158Ccontained 10.6% C. There was a slight decrease in
surface area from 146 to 130 m2/g after the operation
using the cycle oil, whereas that for the coal residue
decreased to 113 m2/g. The HDS, HDN and HYD
activity of the used catalysts was determined using
model compounds. Deposition of 3% coke resulted in
about 20% decrease of all functionalities. However,
deposition of 10.6% coke resulted in a loss of 75% of
HDS and HYD activity. At the same time, the HDN
activity decreased to about 5% of the fresh catalyst.
Although the heavily coked catalyst still had activity
for quinoline hydrogenation, it had little activity to
cleave the C±N bond. Diez et al. [105] assumed edge
blocking of the Ni promoted MoS2 crystallites by coke
as a possible cause of deactivation. Because the MoS2
crystallites are about 0.615 nm thick [171,172], coke
deposits with a thickness less than 0.5 nm should be
ineffective in blocking catalyst sites, However, as the
coke thickness increases beyond about 0.7 nm, the
catalyst activity may decrease rapidly [173].
Volume blends of 70/30 of solvent re®ned coal
(SRC) and hydrogenated creosote oil were used by
Curtis et al. [174] to investigate deactivation of NiMo/
Al2O3 extrudate (1/32 in.) catalysts. The SRC was
obtained by critical solvent deashing of coal. This
ensured very low ash content in the investigated
mixtures. Four deactivation cycles were performed
with each cycle followed by a separate hydrogenation
experiment on a catalyst aliquot using naphthalene in
hexadecane to determine catalyst deactivation. The
spent catalysts A and B are from hydroprocessing of
the 70/30 and 50/50 blends, respectively. Parallel
experiments were performed with the solvent and
the catalyst with no SRC present. In this case, essen-
tially no catalyst deactivation occurred as measured by
naphthalene conversion. However, the aged catalyst
exhibited signi®cantly different product distribution,
showing an increase in the tetraline yield, relative to
that of decaline. It was found that deactivation
increased with the SRC loading, as did loss of surface
area. An increase in the hydroprocessing temperature
from 430 to 5008C increased deactivation, as indicated
by the decreased conversion of naphthalene hydro-
genation in Table 14 [174]. In this case, the blends
contained the same amount of SRC. A similar obser-
vation was made by Hertan et al. [175]. These authors
used hydrogenation of naphthalene to tetraline and
HDO of benzofuran for the activity determinations.
Fig. 52. Effect of coke deposits on relative HDS activity [68].
Table 14
Effect of temperature on naphthalene conversion [174]
Temperature (8C) Naphthalene conversion (%)
SRC/Solvent 70/30
430 84
460 51
500 17
SRC/Solvent 50/50
430 84
460 40
500 10
420 E. Furimsky, F.E. Massoth / Catalysis Today 52 (1999) 381±495
Page 41
The loss of hydrogenation activity was more pro-
nounced than that of HDO activity.
Two types of coke on the catalyst, each having a
different deactivating effect, were reported by Chu et
al. [143]. Different amounts of coke were deposited by
reacting solutions of either bitumen in n-heptane or
maltenes in n-heptane for different periods of time.
Subsequently, the aged catalysts were purged with a
heptane/H2 gaseous mixture prior to (in situ) activity
tests. In this case, naphthalene hydrogenation and
indole HDN were used as model reactions. Subse-
quently, a portion of the aged catalyst was Soxhlet
extracted with heptane followed by chloroform and
resul®ded prior to a second (ex situ) activity test. Thus,
the main difference between the aged catalyst used
during the in situ and ex situ testing was that the
former contained the total coke, while the latter con-
tained only that coke which was left after extraction.
The relative in situ activities of hydrogenation (HYD)
and hydrogenolysis of the ®rst C±N bond (CNH) in
indole versus ex situ activities are shown in Fig. 53
[143]. The in situ relative HYD activity is much lower
than ex situ, whereas for HDN both activities are
similar. This suggests that part of the deposit which
was extracted by chloroform affected HYD activity,
but had little effect on the CNH activity.
An NiMo/Al2O3 HDM catalyst, having an average
pore diameter of 180 AÊ was arti®cially coked to
various levels of coke using bitumen or anthracene
[151]. Another series of aged catalysts was prepared
by adding carbazole (AN-CB coked) to the anthracene
feed and Ni porphyrin to the bitumen (BIT-Ni coked).
Relatively small changes in the surface area, pore
volume and pore radius were observed, which were
attributed to the large average pore diameter of the
fresh catalyst. The activities of the catalysts were
determined using conversion of naphthalene to tetra-
line as a measure of hydrogenation activity (HYD),
and conversion of indole for CNH activity. The effect
of coke on the relative activities is shown in Fig. 54.
Since the analysis showed little plugging of pores by
coke, deactivation must be due to covering active sites
by coke. Initial deactivation was linear up to about 4%
of carbon. Relative activities then dropped slower with
increasing carbon. It was proposed that at this stage
coke grows more upon itself rather than by deposition
on new sites. At high coke levels, HDN activities
tended to line out, indicating that some active sites
still remain at this stage. These residual sites may have
a high HYD activity, thus preventing formation of
coke in their proximity. It appears that HYD activity is
much less affected than CNH and HDN activities,
suggesting that HYD sites are less susceptible to coke
formation. The relative activities do not appear to be
affected by the nature of the coke precursor. The effect
of temperature on deactivation was also measured and
the change of activation energies with increasing coke
is shown in Fig. 55 [151]. The coked catalysts have
lower activation energies than that of the sul®ded
catalyst. The decrease in HYD and CNH activation
energies with coke content suggests that the coke
deposits ®rst on high activation energy sites having
low HYD activity (high coke propensity sites), while
leaving low activation energy sites having high activ-
ity (low coke propensity sites).
The concept of activation energy was further
expanded by Massoth [176] who has developed a
variable site model based on a normal (Gaussian)
variable activation energy function. The normal dis-Fig. 53. In situ vs. ex situ relative activities (RA) for (a) HYD and
(b) CNH (NiMo/Al2O3) [143].
E. Furimsky, F.E. Massoth / Catalysis Today 52 (1999) 381±495 421
Page 42
tribution of active sites, n(E), of activation energy, E,
is given by
n�E� � 1
�������2�p exp
ÿ�E ÿ E0�22�
( )
where E0 and � are the mean activation energy of all
sites and distribution parameter, respectively. A series
of mathematical integrals was used to de®ne para-
meters such as total number of active sites, n, mean
activation energy, Em, and ®nally global rate con-
stants. Two cases were considered for deactivation
by coke, i.e., site selective deactivation (SSD) and site
preference deactivation (SPD). In the former case, the
coking precursor is exclusively adsorbed on the sites
of the highest activation energy, whereas for the SPD
case, the precursor adsorbs preferentially but not
exclusively on the high energy sites. The global rate
constants for the two cases were given as
k0 �ZE0EL
k0�E� dE; k0 �ZEH
EL
k0�E� dE
Fig. 54. Effect of coke on relative activities (RA) of (a) HYD, (b)
HDN and (c) CNH [151].
Fig. 55. Apparent activation energies vs. carbon for HYD (top) and
CNH (bottom) [151].
422 E. Furimsky, F.E. Massoth / Catalysis Today 52 (1999) 381±495
Page 43
for the SSD case and SPD case, respectively. The set
of data on activation energies and relative activities
determined experimentally was used to obtain distri-
bution parameter �. The best ®t of data was obtained
for � � 2.9 for the anthrancene coked catalyst. The
important ®nding of this study is the relationship
between k(E) and n(E) versus E shown in Fig. 56
[176]. It is evident that the lowest E sites, i.e., 18 to
22 kcal/mol contain the highest activities, despite
relatively few sites in this region. On the other hand,
values above 25 kcal/mol represent a small fraction of
the activity despite having the majority of the sites.
Relative activities for the bitumen coked catalyst were
shifted to higher activation energies suggesting that
the SPD mode describes better the deactivation by
bitumen.
Besides blocking active sites, coke deposition has
an adverse effect on the catalyst porosity. Thus, the
mode of catalyst deactivation depends on pore dia-
meter. As shown in Fig. 57 [177], for small pore
diameters, catalytic activity will be lost as result of
pore mouth plugging, whereas for large pore dia-
meters, because of the core deactivation. The com-
bined effect of the feed properties and pore size on the
activity is shown in Fig. 58 [178]. As expected, for the
light feed, activity will decline with increasing pore
size, whereas an optimal pore size exists for which the
activity loss is minimal. Fig. 59 shows the pore size
distribution data from the study published by Chu
et al. [143]. A signi®cant loss of porosity for catalyst
from the in situ testing (cat. A) compared with that for
the ex situ testing (cat. C) is quite evident. For the
latter, activities could be related to the coke content,
indicating loss of active sites by coke. A reasonable
relationship between the in situ relative activities and
the fraction of unblocked surface area is shown in
Fig. 60. The dashed line represents the activity for
HYD and CNH if all free surface contained the same
intrinsic activity as the sul®ded catalyst. Deviations
between the dashed line and the experimental curves
represent additional loss of the remaining active sites.
A direct correlation between the relative catalytic
activity and the unblocked surface area was obtained.
Fig. 56. Distribution of sites and rate constants as a function of site
activation energy [176].
Fig. 57. Effect of pore diameter on deactivation mode [177].
Fig. 58. Effect of pore size and feed properties on deactivation
[178].
E. Furimsky, F.E. Massoth / Catalysis Today 52 (1999) 381±495 423
Page 44
Hydroprocessing of an atmospheric residue from
coal liquefaction in a mixture with creosote oil was
investigated by Yoshimura et al. [157]. The mixture
was deashed to less than 0.01% ash to eliminate the
interference with metals. Three NiMo/Al2O3 catalysts,
having similar chemical compositions but different
surface characteristics, were used. The effect of the
average pore diameter on HDS, HDN and hydrocrack-
ing (HDC) is shown in Fig. 61. Catalyst A had the
smallest pore diameter and the lowest activity. The
analysis of spent catalysts after the toluene extraction
showed only a small difference in the loss of surface
area. As expected, the smallest loss of pore volume
was observed for catalyst C, which had the largest
pores. As was shown in Fig. 38 [157], the distribution
of carbon per unit of catalyst surface, determined by
particle micro analysis (EPMA), indicates preferential
accumulation on the catalyst external surface with
decreasing average pore diameter. In another study,
Yoshimura et al. [179] enriched a mixture of coal-
derived atmospheric residue and creosote oil with
toluene insolubles from de-ashing of coal, i.e., the
content of the toluene insolubles was increased from
0.42 to 3.32%, whereas that of ash from 0.01 to 0.04.
As the results in Table 15 show, all functionalities
were adversely affected by the toluene insolubles.
Also, the radial pro®le of carbon showed accumula-
tion near the catalyst outer surface, causing a signi®-
cant decrease in pore size and pore volume. Pore size
distributions of the spent catalysts after 50 h on stream
(Fig. 62) was in¯uenced by the addition of toluene
insolubles as well. The results from these studies
con®rm that coke deposition is a major contributor
to catalyst deactivation during hydroprocessing of
Fig. 59. Plots of pore size distribution for sulfided catalyst, catalyst
A and catalyst B (NiMo/Al2O3) [143].
Fig. 60. In situ relative activities (RA) vs. fraction of unblocked
surface area for HYD and CNH [143].
Fig. 61. Effect of average pore diameter on the rates of HDS, HDN
and HDC (coal liquid, NiMo/Al2O3) [157].
424 E. Furimsky, F.E. Massoth / Catalysis Today 52 (1999) 381±495
Page 45
coal-derived feeds. The same was con®rmed by
Ocampo et al. [180]. Thus, the deactivating effects
of a coal slurry and that of the ashless coal slurry were
similar, suggesting that mineral matter was less detri-
mental than coke.
5. Deactivation by metal deposits
During hydroprocessing, part of the metals present
in the feed will deposit on the catalyst surface and
cause deactivation. The nature of the metals deposited
depends on the origin of the feed. V and Ni are the
predominant metals in petroleum crudes, heavy oils
and oil shale- derived liquids, while Fe and Ti are the
main metals in coal-derived liquids. Heavy oils
derived from tar sands may contain V, Ni, Ti, Fe
and small amounts of other metals, in addition to
clay-like mineral matter. Alkalis can also be present
if the feed is not completely dewatered. In some cases,
alkalis are introduced during the separation of heavy
oil from sands. Biofeeds, usually prepared by a ther-
mal treatment of biomass, are the least contaminated
by metals.
In summary of previous discussions, it is again
emphasized that the deactivation by metals always
occurs simultaneously along with that by coke. Deac-
tivation by metals is irreversible. Kinetic data have
shown that the rate of metal deposition varies from
metal to metal. For example, in the case of V and Ni,
the initial deposition occurs at much higher rate for V
than for Ni, and increases with increasing pore dia-
meter [181]. This suggests that the formation of V
deposits may have an adverse effect on the rate of Ni
deposit formation. While the initial coke deposition is
rapid before the pseudo-equilibrium level is reached,
metal deposits continually increase with time [182].
The general trends in the formation of coke and metal
deposits are shown in Fig. 63 [92]. Then, during the
entire period, metals deposition occurs on the catalyst,
which has already lost a substantial portion of its
original porosity and surface area [58]. This is gen-
erally true for petroleum-derived feeds and coal-
Table 15
Conversions of whole feed and �623 K fraction [179]
Reaction Feed Feed � TIa
10 h 50 h 10 h 50 h
Whole feed
HDS 87.3 86.7 80.6 80.0
HDN 70.7 61.3 51.3 43.6
�623 K fraction
HDHIb 96.2 93.8 84.2 80.7
HDC 42.8 34.7 22.1 15.8
HDS 89.6 87.1 78.6 69.4
HDN 75.5 63.3 51.6 43.1
H2 consumption (%) 2.69 2.38 2.28 2.15
a TI: toluene insolubles.b Conversion of hexane insolubles to hexane solubles.
Fig. 62. Pore size distribution; * ± fresh catalyst, * ± spent
catalyst from high TI feed, ~ ± spent catalyst from low TI feed
[179].
Fig. 63. Metals and carbon deposits as function of catalyst age
[92].
E. Furimsky, F.E. Massoth / Catalysis Today 52 (1999) 381±495 425
Page 46
derived feeds as well as other feeds. In order to
maintain design activity, temperature is raised to offset
deactivation. Hence, the deposition of metals affects
the lifetime of the catalyst.
Cross-sectional pro®les show that some metals tend
to deposit on the external surface of the catalyst
particles, whereas others are more evenly distributed.
This leads to diffusion limitations which affect access
to the active sites in the particle interior. It is evident
that coke and metals plug the pores and eventually
may lead to a complete loss of the activity [136].
Jacobsen et al. [183] have suggested that metal sul-
®des gradually narrow the pores and thus slow down
the diffusion of reactant molecules into the undeacti-
vated interior of the catalyst particles. At the end of the
run, the catalyst may still possess some activity. In
other words, a complete loss of activity is generally
not observed. End run occurs when either the tem-
perature to maintain the activity is too high for reactor
design or the loss of active sites by pore plugging is too
large to maintain design activity by raising the tem-
perature.
5.1. Formation of and deactivation by V and Ni
deposits
The contents of V and Ni in crudes vary between a
few parts per million to several 1000 ppm. With few
exceptions, the content of V is greater than that of Ni.
Several forms of V and Ni porphyrins were isolated
from crude oil, i.e., deoxo-phyllo-erythro-etio-vana-
dyl porphyrin (DPEP), etio-vanadyl porphyrin and
rhodo porphyrin [183±185]. The typical structures
of porphyrins found in the Alberta oil-sand bitumen
are shown in Fig. 64. [186]. The frequently investi-
gated tetra-phenyl-substituted porphyrin is much less
common in crudes than the other porphyrins, but it
may resemble part of the metals present in asphaltenes
[187]. Porphyrins account for about one-half of the V
and Ni in heavy feeds. The unaccounted part of the
metals are in less characterized forms, which may
include bonds with nitrogen, oxygen and sulphur in
the defect centers of asphaltene sheets [188,189]. The
latter structures are more stable than porphyrins sug-
gesting that deposition of the metals during hydro-
Fig. 64. Major porphyrin types in heavy oils: (1) etio; (2) desoxophylloerythroetioporphyrin (DPEP); (3) benzoDPEP; (4)
tetrahydrobenzoDPEP (THBD); (5) benzoetio; (6) tetrahydrobenzoetio (THBE) [186].
426 E. Furimsky, F.E. Massoth / Catalysis Today 52 (1999) 381±495
Page 47
processing may be faster from porphyrins. Grigsby
and Green [190] pointed out some uncertainty in
characterizing V species in crudes. Thus, at least a
part of the apparent `non-porphyrinic V' may be, in
fact, porphyrinic. This is supported by the work
published by Sakanishi et al. [191]. Using the change
in molecular weight on a solvent treatment, these
authors assumed that four molecules of the asphaltene
units are associated to form aggregates in which
porphyrins may be occluded by a strong non-covalent
interaction. Porphyrins can be released from the
aggregates once the interaction of the asphaltene units
is weaken by solvent action. A number of issues need
to be addressed to explain deactivation by metals.
These include the orientation and interaction of the
metal containing compounds with the catalyst surface,
as well as their mechanism and kinetics under hydro-
processing conditions.
5.1.1. Interaction of V and Ni containing
compounds with catalyst surface
In the case of metal porphyrins, some observations
can be rationalized by assuming that they lie ¯at on the
catalyst surface with the plane of the molecule parallel
with the surface [189]. Loos et al. [192] used the
EXAFS technique to explain the form of the interac-
tion of several V porphyrins, including two which
were isolated from a crude oil, with an Al2O3 and an
oxidic form of the NiMo/Al2O3 catalyst under ambient
conditions. The porphyrins were deposited on the
catalysts by impregnation. They concluded that the
interaction with the bare support (Al2O3) was much
weaker than with the catalyst. Moreover, a negative
axial shift of V back to the plane of the porphyrin was
observed. Thus, there was no evidence for a direct
interaction of the V=O moiety with any speci®c site of
the support. Some of the signals detected were
assigned to oxygen atoms of the MoO3 layer on top
of which the porphyrin might be adsorbed. This
observation is consistent with the porphyrin molecule
lying ¯at on the oxomolybdenum phase of the catalyst.
Loos et al. [193] extended their study to include HDM
conditions. The presence of the V=O group in the
spent catalyst was again con®rmed; however, the other
part of the V was coordinated with at least four sulfur
atoms in a V polyhedron. In this case, the NiMo/Al2O3
catalyst was presul®ded prior to a hydrogenation run,
followed by an HDM run. On the bare Al2O3 support,
used as a baseline in the HDM run, the V=O group
coordinated to the additional oxygen and sulfur
ligands.
Mitchell and Scott [194] used ESR to study the
nature of the interaction between the sul®ded catalyst
surface and several porphyrins. They concluded that
the porphyrins are bound to the catalyst surface by a
donor±acceptor or a charge transfer interaction of the
� system of the porphyrin ring (the donor), and
Brùnsted and/or Lewis acid sites of the catalyst (the
acceptor). However, such an interaction may be dif®-
cult for the tetraphenyl substituted porphyrins because
the planes of the phenyl groups are oriented perpen-
dicular to the plane of the porphyrin. The adsorbed
porphyrin may be oxidized by the MoO3 component of
the oxidic catalyst or reduced by hydrogenation on the
sulphided catalyst. The VO-TPP porphyrin deposited
on a bimodal g-Al2O3, Mo/Al2O3 and NiMo/Al2O3
was investigated by Knozinger et al. [195,196] using
Raman and electron spin resonance techniques. The
catalysts were in an oxidic, reduced and sulphided
form. The main conclusion from this study was that
VO-TPP is bound to the catalyst via a donor±acceptor
interaction through the vanadyl group in which V4�
interacts with donor (Lewis base) sites by charge
transfer from the surface to the porphyrin ring. The
acceptor (Lewis acid) sites on the surface are respon-
sible for the reduction of the excess of negative charge
in the ring. Thus, VO-TPP adsorbs on the surface not
covered with active metals. On the catalyst, thermal
decomposition of the porphyrin began at about 2008C.
In H2, coke formation was observed at about 2508C.
It is believed that the non-porphyrin type of V and
presumably also Ni will end-up on the catalyst surface
in a sulphided form as well. Because they are asso-
ciated with the asphaltene molecules [189], the inter-
action of this part of Vand Ni with the catalyst surface
will be to a great extent in¯uenced by the form of the
adsorption of such molecules on the catalyst. In this
regard, little information could be found in the litera-
ture. Thus, some research efforts are required to ®ll
this gap.
5.1.2. Mechanism of HDM
An ultimate result of the HDM of porphyrins and
other metal containing compounds in the feed is the
deposition of metals, predominantly as metal sul®des,
on the catalyst surface and catalyst deactivation asso-
E. Furimsky, F.E. Massoth / Catalysis Today 52 (1999) 381±495 427
Page 48
ciated with it. Most of the efforts have been devoted to
metal porphyrins. Because they are less stable than the
other metal containing species, their HDM and the
ultimate metal deposit formation will be faster. Under-
standing of the HDM mechanism is essential to
explain catalyst deactivation. Also, such knowledge
may aid in the preparation of tailor-made catalysts to
suit hydroprocessing of a particular feed. All evidence
suggests that the presence of H2 and catalyst is essen-
tial for the HDM of porphyrins to occur. Otherwise,
their conversion will be very low. The mechanism of
HDM has been investigated using model compounds,
as well as feedstocks containing metals of interest.
Little information is available on the HDM mechan-
ism of the non-porphyrin type of the V- and Ni-
containing species, though their contribution to deac-
tivation may be important. If this part of the V and Ni
compounds is associated with the asphaltene sheets
[92,189], their fate during hydroprocessing will
depend on the conversion of the asphaltenes.
Under hydroprocessing conditions, the metal por-
phyrin (M-P) is hydrogenated in the ®rst step to
chlorin, in which hydrogens are introduced into bpositions of one of the pyrrole rings. The formation
of the intermediate chlorin from V and Ni etiopor-
phyrin was observed by Huang and Wei [197,198] in
the presence of an oxidic CoMo/Al2O3 catalyst and
high H2 pressure. Chlorin was indeed con®rmed by
isolation in a pure form using column chromatogra-
phy, followed by its structure con®rmation using mass
spectroscopy [199]. It was concluded that the forma-
tion of other intermediates is also possible, as it was
evidenced by shoulders on the UV±Vis peak of the
chlorin. Ware and Wei [200] isolated a second inter-
mediate (Ni-PH4) and a third intermediate (Ni-X) and
included them in the overall HDM mechanism shown
in Fig. 65. Detection of the Ni-X intermediate was
prompted by the lack of mass balance of Ni in the
solution, in which Ni-P, Ni-P2 and Ni-P4 did not
account for a large portion of Ni in the solution. In
this case, liquid chromatography was used for the
isolation. The structure of Ni-X shown in Fig. 65
was assigned after an extensive spectroscopic evalua-
tion. It is evident that this intermediate has lost its
porphyrin character. At high Ni-P conversions, this
intermediate accounted for as much as 80% of the total
metal in the solution; therefore, its role in the overall
HDM may be important. The formation of this inter-
mediate was favored by an oxidic catalyst, whereas the
sulphided CoMo/Al2O3 catalyst favored the direct
Fig. 65. Tentative mechanism of HDM of Ni-porphyrin [200].
428 E. Furimsky, F.E. Massoth / Catalysis Today 52 (1999) 381±495
Page 49
release of the metals. This was attributed to an
enhanced bond cleavage activity of the sul®ded cat-
alyst, promoting ring rupture of the intermediate at the
expense of further skeletal rearrangement. Presum-
ably, this was consistent with the increased presence
of the Brùnsted sites associated with the generation
of ±SH groups.
Formation of chlorin from porphyrin does not
require the presence of a catalyst. While studying
vanadyl octaethyl porphyrin, Vandeneeckoutte et al.
[201] have shown that temperature and H2 pressure are
the main parameters in¯uencing this reaction. The
results shown in Fig. 66 were obtained by these
authors in the absence of catalyst. At 723 K and 50
atm of H2, the equilibrium is practically displaced
towards chlorin. When the solution is exposed to air at
room temperature, the equilibrium gradually shifts
back to the porphyrin. The authors suggested that
the aromaticity of chlorin is preserved by an increase
in the electron population in the methine bridges.
Then, hydrogens in the methine group in the chlorin
are more exchangeable, i.e., more acidic than in the
porphyrin. This may be a key factor for the increased
reactivity of chlorin compared with the corresponding
porphyrin.
The formation of the intermediate chlorin was part
of the mechanism described by Chen and Massoth
[202]. Similarly as in the previous studies, V and Ni
porphyrins were dissolved in a Nujol and treated at
3208C and 69 atm of H2 in a batch stirred reactor. A
35±65 mesh particle size of the sul®ded CoMo/Al2O3
catalyst was used for testing. The UV±Vis spectra of
the original solution and the one after 1 h reaction time
con®rmed the presence of a new peak (at 633 nm)
consistent with Ni/V-PH2. As the results in Fig. 67
show, the appearance of the new peak was comple-
mented by the decrease of the porphyrin peak. Fig. 68
shows that as the absorption of the porphyrin peak
decreased, that of the intermediate reached a max-
imum and then also decreased. These trends were
similar for both the V and Ni porphyrins and were
in general agreement with other studies
[129,189,198,201].
Tsai et al. [129] showed that the hydrogenation of
porphyrin over sul®ded NiMo/Al2O3 catalyst is in¯u-
enced by properties of the hydrocarbon medium. The
hydrogen transfer ability of the medium was found to
be the most important parameter. Among several
solvents used, a triple-hydrogenated coal-derived
Fig. 66. Percentage of VO-porphyrin hydrogenated vs. time at different pressures and temperatures [201].
Fig. 67. UV±Vis absorption spectra of pure VO-porphyrin (ÐÐÐ)
and sample collected during HDM run (- - -) (NiMo/Al2O3, 593 K,
69 atm) [202].
E. Furimsky, F.E. Massoth / Catalysis Today 52 (1999) 381±495 429
Page 50
liquid was superior because of the high content of
polycyclic hydroaromatic structures, rich in naphthe-
nic hydrogen and attached alkyl groups. Such struc-
tures were observed to be much better hydrogen
transfer agents compared with tetraline, decaline
and other solvents [203,204]. As shown in Fig. 69
[129], during the hydrogenation of the hydrotreated
coal-derived liquid, the typical chlorin peak showed
up ®rst as an initial intermediate, while another peak
showed up later as a secondary hydrogenation pro-
duct. As reaction proceeded, the UV±Vis absorption
intensities of both peaks showed an increase and then
decrease, after reaching a maximum, indicative of
intermediate products. However, with pure solvents,
such as mesitylene, decaline or tetraline, only one
intermediate product (chlorin) was observed, even up
to 75% conversion of the reactant. The deeper hydro-
genation ability of the triple-hydrogenated coal
derived liquid was attributed to better hydrogen trans-
fer rather than hydrogen solubility, since the latter was
lower than that in the other solvents. The authors
summarized their observations in the overall mechan-
ism shown in Fig. 70 [129]. In this mechanism, NTP
depicts Ni porphyrin and NTP2 and NTP4 the ®rst and
second intermediates. Formation of NTP4 in hydrogen
Fig. 68. Absorbance±time profiles for VO-porphyrin (*) and
intermediate (~) during HDM run (conditions as in Fig. 67) [202].
Fig. 69. UV±Vis spectra products of hydrogenation of Ni-
porphyrin (A) in mesitylene and (B) hydrogenated CDL [129].
Fig. 70. Proposed reaction scheme for hydrogenation of NTP and
NBP [129].
430 E. Furimsky, F.E. Massoth / Catalysis Today 52 (1999) 381±495
Page 51
lean solvents cannot be excluded. Thus, this inter-
mediate and possibly others were formed but were
removed at the faster rate than the rate of their for-
mation. It was suggested by Mitchell [189] that
phlorin is among possible intermediates as well,
although it was not detected in the products. It can
be formed by hydrogenation of methine or meso
carbons. Phlorin is unstable and is easily converted
to chlorin. Nevertheless, the hydrogenation activity of
the catalyst seems to play an important role in the
overall HDM mechanism. This is supported by the
observation of the three intermediates noted by Ware
and Wei [200].
As it was indicated earlier, the presence of catalyst
is crucial for achieving the ®nal fragmentation of the
porphyrin molecule, which requires hydrogenolysis of
C±N bonds. According to Weitcamp et al. [205], at
lower temperatures, the main hydrocarbon products
from the HDM of porphyrin would be predominantly
dipyrroles, while at higher temperatures, the HDN of
dipyrroles would lead to hydrocarbons and ammonia
if a suf®cient H2 pressure is maintained. The forma-
tion of polypyrroles was con®rmed by Rankel [206].
Thus, at least a partial break up of the intermediates
is required to release the metal, because the metal
free porphyrin could not be detected in the liquid
products [207]. Deposited metals will be rapidly
sulphided by H2S from the HDS reactions occurring
simultaneously. Perhaps the role of H2S in the overall
HDM deserves more attention in view of observa-
tions made by Rankel [206] that H2S plus H2 in the
absence of catalyst can produce thermally cleaved
porphyrin rings or polypyrroles from both V and
Ni porphyrins, with the former being more reactive.
This would indicate a modi®cation of HDM mechan-
ism by H2S.
Perhaps the most detailed account of the mechan-
ism of HDM of porphyrins was given by Janssens et al.
[187]. From molecular modeling calculations and GC-
MS analysis of the HDM products, these authors were
able to con®rm the presence of the intermediates
proposed by other researchers, as well as new inter-
mediates not identi®ed and/or proposed previously.
The overall mechanism proposed by these authors is
shown in Fig. 71. In this case, M represents either Ni
or V=O, as it was assumed that the different metal
species should have little in¯uence on the mechanism.
In the ®rst step, the tetraphenylporphyrin (M-TPP) is
converted to chlorin (M-TPC), in agreement with
other researchers [199±204]. In the next step, the
M-TPC is converted to tetrahydroporhyrin and/or
isobacteriochlorine (M-TPiB). The formation of bac-
teriochlorin is less probable but cannot be ruled out
completely. In the next step, the M-TPiB is hydro-
genated to hexahydroporphyrin (M-TPHP). The octa-
hydrogenated species arising from the hydrogenation
of M-TPHP was not con®rmed, but assumed to be part
of the mechanism. In this case, the molecular model-
ing suggested that the hydrogenation of the meso-
bridge positions would yield a more stable intermedi-
ate (M-B) than that of the last pyrrole ring. The meso
position becomes susceptible to attack leading either
to an immediate ring cleavage and metal removal or to
a tolyl elimination leading to the new M-Bil structure.
Most likely, the next step is metal removal because of
the unstable coordination in the M-Bil structure.
According to the authors [187], elimination of pyrrole
groups before the metal removal is not probable
because of the minimum coordination number of four
of the metal atom. The metal atom is removed with the
aid of H2S. In this case, the role of H2S is not fully
understood. Further hydrogenation leads to monopyr-
role and phenyl-group containing molecules.
The information on the HDM mechanism of non-
porphyrin metal-containing species is limited because
the structure of these species is much less de®ned than
that of porphyrins. The evaluation of a heavy crude by
size exclusion chromatography has shown that both V
and Ni are quite evenly distributed in fractions having
average molecular weights between 370 and 6680
[208]. Fractions having average molecular weight
between 1420 and 6680 accounted for 56 and 72%
of V and Ni, respectively. Sughrue et al. [209] used
size exclusion chromatography with inductively
coupled plasma emission detection to study removal
of V from residual oils. The distribution of V shown in
Fig. 72 indicates the presence of small and large V-
containing molecules. The former were more reactive
and could be readily removed under mild hydropro-
cessing conditions. It is speculated that the structure of
the small molecules approaches that of the porphyrin.
Nevertheless, there are indications that the non-por-
phyrin type of the metal containing compounds may
account for more metals than the porphyrins. More
information on HDM of such structures would be
desirable.
E. Furimsky, F.E. Massoth / Catalysis Today 52 (1999) 381±495 431
Page 52
5.1.3. Kinetics of HDM of V and Ni
It was indicated earlier that physical properties of
the catalyst are important because of the size of the
metal-containing compounds. Of a particular impor-
tance is the size of the catalyst particles. As shown in
Fig. 73 [210], for particle sizes less than about 1 mm,
HDM rate was constant, indicating the absence of
diffusional phenomena. The effect of the size of the
catalyst particles on the rate of HDM was studied
extensively by Kobayashi et al. [181]. To avoid diffu-
sion problems and/or to determine the intrinsic
kinetics, many studies were conducted using a powder
form of catalyst either in an oxidic or sulphided form.
Such information is important for understanding
HDM. However, from the practical point of view,
the investigation of catalysts in their operating form
is crucial because the diffusion phenomena have a
signi®cant impact on the performance and lifetime of
the catalyst. A number of studies on the kinetics of
metal removal from various crudes and residues in the
presence of hydroprocessing catalysts have appeared
in the scienti®c literature. The kinetic order of HDM
with respect to the metal concentration in the feed has
Fig. 71. A complete reaction mechanism for HDM of metalloporphyrins; M � Ni or VO [187].
Fig. 72. Size exclusion chromatography for V in feed (ÐÐÐ) and
product (- - -) [209].
432 E. Furimsky, F.E. Massoth / Catalysis Today 52 (1999) 381±495
Page 53
been reported as ®rst-order [211±213] and second-
order [214,215]. The discrepancies could be attributed
to many different sulphur, nitrogen, metal and asphal-
tenic compounds in crudes and residues. Besides this,
the different amounts and reactivity of the various
metal-containing (porphyrin and non-porphyrin) com-
pounds may have also contributed. The type of cat-
alyst, its particle size and shape in particular, should
also be taken into consideration when different studies
are compared. Last but not least, the conditions
applied during the hydroprocessing operation are
important.
5.1.3.1. Intrinsic kinetics. An extensive database
exists on the kinetics of HDM of porphyrins. The
kinetics of the non-porphyrin V and Ni are less
understood, although they are part of the overall
rate during HDM of the metal containing feeds. An
oxidic CoMo/Al2O3 catalyst, in a powder form
(0.075±0.086 mm) was used by Huang and Wei
[197,198] to investigate the kinetics of HDM of
tetraphenyl- and etio-porphyrins of V and Ni in a
batch reactor. After the first contact with the
catalyst, a rapid decline in the V concentration from
20 to about 10 ppm was observed, compared with little
change for Ni. The etio structures were used to
compare the removal of V with Ni. At lower
temperature, the Ni-etio was more reactive, but VO-
etio, having a higher activation energy, was more
reactive at high temperatures, i.e., activation energy
for the VO-etio and Ni-etio porphyrins were 37.1 and
27.6 kcal/mol, respectively. The rates of HDM of V
and Ni fitted 0.5 order kinetics well but a temperature
dependence on the order was noted. Because of the
catalyst particle size chosen, no external diffusion
limitations were observed. The results were
consistent with other studies [216±218].
The studies performed with the oxidic catalyst
[197,198] were later expanded to evaluate the effect
of the catalyst presul®ding as well as poisoning by
pyridine on the HDM kinetics [48]. It was already
noted that sul®dation of the catalyst in¯uenced the
HDM mechanism [200]. Comparison of the results in
Fig. 74 [200], obtained for the oxidic catalyst with
those in Fig. 75 [48] obtained for the sul®ded catalyst,
con®rm a dramatic effect of presul®ding on the rate of
HDM. For example, for the sul®ded catalyst, aboutFig. 73. Effect of particle diameter on HDM activity [210].
Fig. 74. Concentration vs. contact time during HDM of Ni-
porphyrin (63 ppm of Ni in feed, CoMo/Al2O3 oxid., 618 K,
6.99 MPa) [200].
E. Furimsky, F.E. Massoth / Catalysis Today 52 (1999) 381±495 433
Page 54
80% Ni removal was achieved at a contact time of
0.075 g cat h/ml oil compared with about 0.42 g cat h/
ml oil for the oxidic catalyst. Results such as shown in
Figs. 74 and 75 were used to calculate kinetic para-
meters using the sequential hydrogenation/hydroge-
nolysis model of Fig. 65, assuming ®rst order kinetics
for each of the reaction steps and constant H2 pressure.
The parameters in Table 16 [48] are the ratios of the
rate coef®cient of the sul®ded catalyst to that of the
corresponding rate coef®cient of the oxide catalyst.
The effect of catalyst prereduction was also evaluated.
Poisoning of the catalyst by pyridine was quite evi-
dent. As expected, prereduction increased the kinetic
parameters. In the case of presul®ding, the metal
deposit steps were in¯uenced to a much greater extent
than the dynamic equilibria. At all temperatures, the
selectivity of Ni-PH4 to Ni-X relative to direct metal
deposition (k5/k7) was smaller on the sulphided cat-
alyst compared to the oxidic catalyst. The kinetic
parameters estimated by Ware and Wei [48] for the
sul®ded catalyst are shown in Table 17. The relative
magnitudes of the rate parameters suggest that the
metal deposition steps (k6, k7) are rate limiting in the
overall mechanism.
The assumption of ®rst-order kinetics for all steps in
the mechanism shown in Fig. 65 [200] may affect the
validity of kinetic parameters though they may be
useful to indicate relative trends. A detailed kinetic
analysis performed by Chen and Massoth [202] takes
into consideration the effect of temperature, H2 pres-
sure and concentration of V and Ni porphyrins on the
overall kinetics. In this case, sul®ded CoMo/Al2O3
extrudates were crushed and sieved to obtain 0.21±
0.42 mm (35±65 mesh) size particles in order to obtain
intrinsic kinetics. The effect of temperature on the
kinetic order is shown in the ®rst-order plot of Fig. 76,
in which two temperature regions may be identi®ed.
Above 3508C, the kinetics follow ®rst-order, whereas
below 3508C, the curvature in the plots is evident. This
Fig. 75. Concentration vs. time during HDM of Ni-porphyrin
(conditions the same as in Fig. 74 except sulfur catalyst) [48].
Table 16
Kinetic parameters for HDM of Ni±T3MPPa
Reaction step kpyrid/koxid kred/koxid ksulph/koxid
1 0.42 2.5 1.7
2 0.56 2.1 1.7
3 0.35 1.9 2.0
4 0.52 1.4 2.6
5 0.15 2.5 3.5
6 0.61 2.2 7.1
7 0.78 2.2 6.7
a Experimental conditions: 3458C; 6.99 MPa H2; 65 ppm Ni [48].
Table 17
Kinetic parameters for HDM of Ni-T3MPPa
Reaction
step
k (ml oil/g
cat. h)
E
(kcal/mol)
H2 pressure
order
1 183 23.0 1
2 164 24.9 0
3 250 19.7 1
4 400 23.1 0
5 171 40.3 2
6 27 29.4 2
7 120 20.0 3
a Experimental conditions: 3458C; 6.99 MPa; 60 ppm Ni [48].
434 E. Furimsky, F.E. Massoth / Catalysis Today 52 (1999) 381±495
Page 55
curvature was attributed to the adsorption of the
reactant being greater than that of the dipyrrole pro-
ducts, indicating inhibition by the reactant. The
mechanistic scheme which suited best the kinetic
analysis is shown in Fig. 77, i.e., the direct conversion
(from A to C) had to be considered as part of the
overall mechanism. The direct path is probably not a
real path but rather a direct conversion of porphyrin to
the hydrogenated intermediates and products in a
single adsorption step without desorption of the inter-
mediates, thus avoiding desorption and readsorption.
Solution of the appropriate differential equations
describing this system yields the following equations:
XB � �1
�2 ÿ 1�XA ÿ X
�2
A � (5.1)
�1 � k1
k1 � k3
; �2 � k2
k1 � k3
(5.2)
where XA and XB are mole fractions for a given run
whereas �1 and �2 were obtained by non-linear regres-
sion analysis. Fig. 78 shows the experimental data and
Fig. 76. First order plots of Ni-porphyrin disappearance as function of temperature (35 ppm of Ni in feed, CoMo/Al2O3, 6.99 MPa) [202].
Fig. 77. Reaction network for kinetic analysis [202].
Fig. 78. Selectivity plot of XB vs. 1 ÿ XA; fit of data with k3
(ÐÐÐ) and without kr (- - -) [202].
E. Furimsky, F.E. Massoth / Catalysis Today 52 (1999) 381±495 435
Page 56
the ®t based on the scheme in Fig. 77 (solid line) and
the one not including k3 (broken line). It is obvious
that the former gives a much better ®t of the kinetic
data. The scatter of the data is not surprising con-
sidering the limitations of the analytical accuracy by
UV±Vis spectroscopy. The estimated rate constants
are shown in Table 18 [202]. Increasing H2 pressure
increased the reactant conversion (Fig. 79). From the
®rst-order plot, the following power equation in pH
was obtained:
rNP � 3:63cNP
1� 0:14c0NP
p1:57�0:15H (5.3)
The noninteger order signi®es that the overall rate is
not a simple function of H2 pressure. The 1.57 power
in pH can be rationalized if Path 1 is assumed to be
®rst-order and Path 3 second-order in pH. The effect of
temperature could be best described when two tem-
perature regions were assumed, i.e., between 275±
3508C and 350±3808C.
5.1.3.2. Diffusion controlled kinetics. Because of their
size, the concept of restrictive diffusion presented
earlier is applicable to the metal bearing species
present in heavy feeds. In summary, when the
molecular diameter of the porphyrins and metal
containing asphaltenes approach the size of the pore
diameter, their diffusion rate into the liquid filled pores
becomes smaller than that in the bulk liquid medium.
If the diameter of the molecule equals or is more than
that of the pore diameter, diffusion into the pore com-
pletely ceases [219]. Therefore, the smallest micropores
will not be accessible to large molecules such as
porphyrins. The molecular size distribution in Fig. 80
Table 18
Rate constants for HDM Ni±P [202]
Constant (kg oil/g cat h)
kNP 16.4
k1 0.56
k2 5.91
k3 1.74
Fig. 79. Effect of H2 pressure on Ni-porphyrin reaction; (*) 89,
(&) 69, (~) 42 atm (other conditions are the same as in Fig. 76)
[202].
Fig. 80. Distribution of diameter of V molecules in feed and
products [220].
436 E. Furimsky, F.E. Massoth / Catalysis Today 52 (1999) 381±495
Page 57
shows that the size of the V-containing molecules varies
between 15 and 150 AÊ , indicating that the micropores
would be mostly affected by diffusion [220]. If the
diffusion rate of a V- or Ni-containing molecule is the
slow step compared with its surface reaction, only the
outer portion of the catalyst will be utilized. As a result,
the conversion versus time on stream will exhibit a
nonlinear decrease, compared with a nearly linear
decrease for the powdered form of a catalyst [221].
Note that the smallest pores could also be affected in
powder catalysts, even though the path is shorter.
Most studies on diffusion controlled HDM kinetics
of model compounds involved porphyrins. Lee et al.
[118,122,128] investigated the effect of particle and
pore size on the HDM kinetics of Ni-tetraphenylpor-
phyrin (Ni-TPP) and Ni-tetra(4-biphenyl)porphyrin
(Ni-TBP), having critical molecular diameters of
15.7 and 21.8 AÊ , respectively. For this purpose, they
used three NiMo/Al2O3 catalysts whose properties are
given in Table 9[118]. Spheres of 1/8-in. and 60±80
mesh size particles were used. The effect of particle
size on reaction rate was estimated, using the mea-
sured apparent rate constant and the relationship
between the effectiveness factor, �, and the Thiele
modulus expressed as
� � 3
�
1
tanh�ÿ 1
�
� �(5.4)
in which the usual form of the Thiele modulus for
spherical particles, �S, used was:
�S � R0
ks�p
De
� �0:5
(5.5)
Initial runs with fresh catalysts gave erratic results,
presumably due to rapid deactivation. Accordingly,
one catalyst was used in a sequence of batch reaction
runs to investigate the deactivation phenomena. In
these tests, the catalyst was always kept in the reactor
and only the feed solution (Ni-TPP in mesitylene) was
replaced after each run. As shown in Fig. 81 [122],
catalyst deactivation occurred very rapidly, ®nally
reaching a steady state. It was realized that the initial
deactivation was caused by a rapid initial buildup of
coke. Subsequently, reaction of a concentrated Ni-TPP
solution over the catalyst was used to age catalysts.
After aging, the data could be ®tted to ®rst-order
kinetics. First-order plots of the hydrogenation of
Ni-TPP and Ni-TBP in decalin are shown in Fig. 82
The rate constants estimated from such plots and
effectiveness factors are listed in Table 19. The
increase in the rate constant with decreasing particle
size is quite evident. Also, when the reactant mole-
cular size was increased or the micropore size was
decreased, the effectiveness factor decreased. The
effective diffusivities of the fresh and aged catalysts
were determined from sorptive diffusion experiments
at ambient conditions, using a coronene solution in
cyclohexane. The results shown in Table 20 indicate a
signi®cant change in physical properties between the
aged and fresh catalysts. This fact has to be taken into
consideration in order to determine restrictive diffu-
sion in more realistic terms. For this purpose, Lee et al.
[118] attempted to obtain a corrected size of the pore
mouths of aged catalyst by taking the ratio of De
(Eq. (4.20)), i.e.,
D0eDe� �2
��0�2�1ÿ �0�4�1ÿ ��4 (5.6)
Fig. 81. Deactivation profile of NiMo-125 catalyst for reaction of
Ni-porphyrin in mesitylene (623 K, 5.27 MPa H2) [122].
Fig. 82. First-order conversion of Ni-porphyrins in decalin with
NiMo-225 catalyst (623 K, 5.27 MPa) [122].
E. Furimsky, F.E. Massoth / Catalysis Today 52 (1999) 381±495 437
Page 58
where primed parameters refer to aged catalyst. Two
assumptions were made to derive this equation; the
tortuosity factor of the aged and fresh catalysts are the
same and coke does not completely block the pores,
i.e., the number of pores remains the same. Then,
�0=� � d02p=d2p � �2=�02 was incorporated to account
for the decrease in the surface fraction of pores for the
aged catalysts due to the reduction in pore mouth size
by coke. Using the above equation and the De values in
Table 20[122], the corrected pore diameters of the
aged catalysts were calculated to be 116.7, 59.2 and
45.7 AÊ for NiMo-125, NiMo-225 and NiMo-325,
respectively, compared with 174, 83 and 62 for the
corresponding fresh catalysts. Consequently, surface
porosities were adjusted to estimate effective diffu-
sivities under reaction conditions by using the follow-
ing equation:
D0e �Db�
0
��1ÿ ��z � B��2
V0:6A ���0�2 �1ÿ �
0�z (5.7)
As the results in Fig. 83 show, when the corrected
value of �0 was used, a value 4.9 was obtained for the z
parameter. Without applying the correction for the
pore size, an unrealistic value of 6.9 was obtained. It
was felt appropriate to review the approach made by
Lee et al. [118,122,128] in more detail as it gives an
excellent illustration of the restrictive diffusion phe-
nomena relevant to diffusion controlled HDM
kinetics.
Tsai et al. [129] studied the effect of solvent on
hydrogenation of Ni-TPP at 3358C and 50 atm of H2.
In this case, a triple-hydrogenated coal-derived liquid
(HT-CDL) having a boiling range of 230±3508C was
compared with mesitylene, tetralin and decalin. For
the reactivity tests, the NiMo 125 and NiMo 325
catalysts shown in Table 9 were used in two particle
sizes, i.e., 0.33 cm (1/8 in.) spheres and 0.036 cm
Table 19
Rate constants and effectiveness factors for hydrogenation of Ni-TPP and Ni-TBP [122]
Catalyst
NiMo-125 NiMo-225 NiMo-325
Hydrogenaton of Ni-TPP
Particle radius (cm) 0.011 0.184 0.011 0.183 0.011 0.167
Rate constanta (cm3/g min) 3.366 0.742 3.000 0.476 3.278 0.423
Effectiveness factora 0.96 0.21 0.93 0.15 0.85 0.11
Particle radius (cm) 0.011 0.184 0.011 0.183 0.011 0.167
Rate constantb (cm3/g min) 1.982 0.603 2.453 0.372 2.030 0.297
Effectiveness factorb 0.98 0.30 0.91 0.14 0.88 0.13
Hydrogenation of Ni-TBP
Particle radius (cm) 0.011 0.184 0.011 0.183 0.011 0.167
Rate const. (cm3/g min) 3.812 0.662 3.207 0.371 3.301 0.299
Effectiveness factor 0.94 0.16 0.85 0.10 0.65 0.06
a,b Data for different experimental condiitons.
Table 20
Effective diffusivity data (De � 106, cm2/s) for fresh and spent
NiMo catalysts [122]
NiMo-125 NiMo-225 NiMo-325
Fresh Spent Fresh Spent Fresh Spent
3.59 1.31 2.52 1.15 1.94 0.71 Fig. 83. Determination of Z from experimental data for hydro-
genation of Ni-porphyrins [122].
438 E. Furimsky, F.E. Massoth / Catalysis Today 52 (1999) 381±495
Page 59
particles. To achieve a stable activity for kinetic
measurements, the catalyst was predeactivated by
depositing about 1.6 wt.% of coke. First-order kinetic
plots in Fig. 84 show that the best performance was
obtained with the HT-CDL. The effective diffusivity
and uptake in coronene-cyclohexane solution at ambi-
ent conditions for the fresh and spent NiMo-125 and
NiMo-325 catalysts are shown in Table 21. These
results suggest that while the pore diameter reduction
was only about 5%, the reduction of the effective
diffusivity was considerably more. This implies that
the coke deposit in the catalyst is concentrated at the
pore mouths. The estimated parameters, such as the
rate constants, intrinsic rate constants, effectiveness
factor and effective diffusivity are given in Table 22.
In this case, the effectiveness factor is de®ned as the
ratio of the observed rate to the intrinsic rate. These
results show that the effectiveness factor decreased as
pore size decreased, indicating more diffusion resis-
tance in smaller pores. This con®rms that the mobility
of the reactants is hindered by pore size, indicative of a
restrictive diffusion effect. The Z-value estimated
from these measurements was 4.2, which is close to
the hydrodynamic theory prediction and only slightly
higher than the 3.7 value obtained from ambient
diffusion studies [114] and lower than 4.9 obtained
for pure solvents during hydrogenation [128]. This
suggests that the effect of restrictive diffusion in the
HT-CDL was less than in the pure solvents, which was
attributed to a superior hydrogen donor ability of the
former.
To investigate the cumulative effects of solvent and
temperature, as well particle size and pore size upon
restrictive diffusion rates, Lee et al. [128] performed
Fig. 84. First-order kinetics plots for hydrogenation of Ni-
porphyrin in various solvents [129].
Table 21
Effective diffusivity and uptake in coronene±cyclohexane solution
[129]
Catalyst Effectivediffusion
(De x 106
(cm2/g))
Uptake of
coronene
(mg/g of cat)
Pore
diameter
(A8)
NiMo 125 fresh 3.59 4.2 175
NiMo 125 spent 2.65 3.8 153
NiMo 325 fresh 2.02 13.4 62
NiMo 325 spent 1.31 11.9 52
Table 22
Kinetic parameters for hydrogenation at 3358C and 50 atm H2 [129]
Catalyst Particlesize (cm) Rate constant (cc/g min) Effectiveness factor
NTP NBP NTP NBP
NiMo 125 0.175 2.79 3.68 0.29 0.18
NiMo 125 0.0181 8.99 16.5 0.94 0.83
NiMo 325 0.161 2.07 2.11 0.19 0.09
NiMo 325 0.0181 8.90 13.2 0.84 0.57
Intrinsic rate constants (cc/g min) Effective diffusivity (De � 106 (cm2/s)
NTP NBP NTP NBP
NiMo 125 9.60 19.9 7.63 5.78
NiMo 325 10.6 23.1 2.41 1.05
NTP: Ni-tetraphenylporphyrin.
NBP: Ni-tetra(4-biphenylyl)porphyrin.
E. Furimsky, F.E. Massoth / Catalysis Today 52 (1999) 381±495 439
Page 60
hydrogenation of Ni-TTP and Ni-TBP in mesitylene
and decalin at 300 and 3508C, using the NiMo-125,
NiMo-225 and NiMo-325 catalysts of Table 9. The
results of hydrogenation of Ni-TBP at 5.27 MPa are
shown in Table 23. The same set of results was also
obtained for Ni-TPP. At higher temperatures, the
intraparticle resistance becomes more important, since
a larger increase in the reaction rate due to temperature
rise occurs compared with that of intraparticle diffu-
sion phenomena. The particle size effect was more
signi®cant with the NiMo-325 catalyst, which had
considerably lower average micropore diameter than
the NiMo-125 and NiMo-225 catalysts. The effective
diffusivities were estimated using the relationship
between effectiveness factor and Thiele modulus.
These results are given in Table 24. It is again appar-
ent that the mobility of both Ni-TPP and Ni-TBP was
hindered by pore size. The lower viscosity of mesi-
tylene at the experimental temperatures was one of the
reasons for higher effective diffusivities compared
with that in decalin. Also, for the former, the critical
temperature had been approached. This was supported
by the lower z parameter in mesitylene at 3508Ccompared with that in decalin. Lee et al. [128] con-
cluded that the restrictive effect can be reduced by
employing solvents with relatively low critical tem-
peratures.
The results in Table 25, published by Johnson et al.
[222] represent an extreme case of the low uptake of
coronene caused by the loss of diffusivity due to
catalyst deactivation. The three catalysts contained
2% Co and 7% Mo on different alumina supports.
The catalysts in extrudate form were used in different
hydroprocessing operations and contained coke and
metal deposits, with a dense outer crust. A portion of
each spent catalyst was crushed, and both extrudates
and crushed particles were tested for diffusivity. As
can be seen in Table 25, the extrudates had very low
Table 23
Apparent and intrinsic rate constants and effectiveness factors [128]
Decalin Mesitylene
3008C 3508C 3008C 3508C
NiMo-125
Intrinsic rate constant cm3/(g min) 1.08 4.06 1.34 6.28
Particle radius, cm 0.01 0.18 0.01 0.18 0.01 0.18 0.01 0.18
Rate constant (cm3/(g min)) 1.04 0.22 3.81 0.66 1.32 0.39 5.99 1.17
Effective factor 0.96 0.20 0.94 0.16 0.98 0.29 0.95 0.19
NiMo-225
Intrinsic rate constant (cm3/(g min)) 0.93 3.78 1.10 7.43
Particle radius (cm) 0.01 0.18 0.01 0.18 0.01 0.18 0.01 0.18
Rate constant cm3/(g min) 0.85 0.13 3.21 0.37 1.06 0.23 6.67 0.92
Effective factor 0.91 0.14 0.85 0.10 0.96 0.21 0.90 0.12
NiMo-325
Intrinsic rate constant (cm3/(g min)) 1.06 5.09 1.17 8.77
Particle radius (cm) 0.01 0.17 0.01 0.17 0.01 0.17 0.01 0.17
Rate constant (cm3/(g min)) 0.82 0.09 3.30 0.30 1.04 0.16 6.54 0.67
Effect factor 0.77 0.08 0.65 0.06 0.90 0.13 0.75 0.08
Table 24
Effective diffusivities (De � 106, cm2/s) [128]
Decalin Mesitylene
3008C 3508C 3008C 3508C
NiMo-125
Ni-TPP 8.49 17.9 24.4 43.8
Ni-TBP 4.14 9.76 11.2 20.5
NiMo-225
Ni-TPP 2.32 6.36 9.10 15.7
Ni-TBP 1.57 3.24 4.88 10.4
NiMo-325
Ni-TPP 1.26 3.39 2.78 7.59
Ni-TBP 0.52 1.23 1.57 3.63
440 E. Furimsky, F.E. Massoth / Catalysis Today 52 (1999) 381±495
Page 61
diffusivities. However, the crushed catalysts exhibited
appreciably larger diffusivities, indicating that the
outer crust was extremely impervious. Regeneration
improved the parameters but the original values could
not be attained, con®rming that the metal deposits
were a main contributor to deactivation.
Several studies were published on the kinetics of
HDM of petroleum residues, in which case diffusional
phenomena are almost certainly present. Beaton and
Bertolacini [188] used a ®rst-order reaction expression
to describe the overall HDM of V and Ni. They found
the HDM of V to be faster than that of Ni. Similarly,
the work published by Bartholdy and Hannerup [223]
used an atmospheric residue to study removal of V.
These authors combined the rate constants and diffu-
sional parameters into the same equation, assuming a
sequential ®rst-order reaction network for HDM, i.e.,
A!k1B!k2
C
In this network, the ®rst step involves hydrogena-
tion of the porphyrins, whereas the second step is a
reaction between the hydrogenated porphyrins and
H2S, leading to metal sul®de deposits. For the con-
centration through the reactor, the following kinetic
expression was derived:
CB
CA
� ��1ÿ eÿ�k2eÿk1e�U=Fy� (5.8)
where CA and CB are concentrations of A and B in the
bulk phase outside the catalyst, respectively, U is
volume of catalyst, F ¯ow rate of the feed, y the
length of catalyst bed and � � k1/k1�k2. It was
assumed that k1 and k2 are proportional to partial
pressure of H2 and H2S, respectively. In these equa-
tions, k2 and k2e, k1 and k1e are the rate constants for
the intrinsic and diffusion limited operations, respec-
tively. While applying this approach to V removal,
Bartholdy and Hannerup [223] observed that the
simple ®rst-order reaction A! B is the rate-control-
ling step.
The HDM of an atmospheric residue was simulated
by Bourseau et al. [224]. The parameters used in the
model include the Thiele modulus, minimum and
maximum pore diameter (Rm and RM, respectively),
effective diffusivity, ratio of particle length to twice
radius (�), and ratio of the radius maximal to minimal
(�). As the results in Fig. 85 show (solid line), the
Table 25
Effective diffusivities and uptakes of coronene [222]
De � 1010 (m2/s) Uptake � 103 (kg/kg)
Catalyst E A F E A F
Crushed
Support 4.3 5.0 5.9 11.6 8.8 6.9
Fresh 4.0 4.9 5.3 14.6 11.3 7.4
Aged 0.3 0.2 0.1 2.3 1.8 1.5
Regen. 1.3 1.2 0.5 7.2 5.7 5.2
Extrudates
Fresh 4.1 5.1 5.1 11.6 10.9 8.3
Ageda ±b <0.01 <0.01 ± ± ±
Regen* 0.2 0.1 0.1 ± ± ±
a De value based on uptake values for crushed catalysts.b Too slow to measure.
Fig. 85. Experimental (~) and computed (ÐÐÐ) values of total
mass of metal sulfide deposited [224].
E. Furimsky, F.E. Massoth / Catalysis Today 52 (1999) 381±495 441
Page 62
removal of V and Ni could be predicted quite well by
the model. Kobayashi et al. [181,225] compared the
intrinsic and diffusion controlled HDM using two
different particle sizes of 1.3 and 0.11 mm, during
hydroprocessing of an atmospheric residue. As the
results in Fig. 86 [225] show, the experimental results
agreed well with the predicted values (solid lines). The
prediction was made using the following ®rst-order
equation:
lnC0
C� WeS
Vr
kt (5.9)
where C0 is the initial concentration, C the concentra-
tion after 30 and 60 min, We the catalyst weight, S the
surface area, Vr the reaction volume, k the rate con-
stant and t the time. Fig. 86 reveals that all reactions
can reasonably be expressed by ®rst-order kinetics.
The effect of particle size on the overall HDM is quite
evident. Based on these results, Kobayashi et al. [225]
determined the effect of particle size on the effective-
ness factor (k/ki) for removal of V and Ni (Fig. 87). In
a similar study, Reyes et al. [226] made an attempt to
predict the effect of the amount of deposited V on the
apparent rate constant. As demonstrated in Fig. 88,
®rst-order HDM kinetics were con®rmed over a wide
H2 pressure range [227].
The kinetics of removal of V from several atmo-
spheric residues was investigated by Sughrue et al.
[209]. In Fig. 89, a plot of ®rst-order kinetics in an
isothermal, plug ¯ow reactor shows excellent ®ts of
Fig. 86. First-order plot of reactions; (**) HDV, (~~) HDNi,
(&&) HDasph. [225].
Fig. 87. Relationship between effectiveness factor and pellet size
during HDNi [225].
Fig. 88. Effect of H2 pressure on first-order plot of V removal
[227].
442 E. Furimsky, F.E. Massoth / Catalysis Today 52 (1999) 381±495
Page 63
the data at both 616 and 644 K. However, the intercept
for both lines was not zero, (as it should be for true
®rst-order kinetics) and is indicative of adsorption
inhibition by V-compounds. Oleck and Sherry [215]
reported that their HDM data could be best correlated
when they assumed reactive and nonreactive fractions
of V. If parallel, ®rst-order kinetics with two types of
V, i.e., slow reacting and fast reacting, were assumed,
the following equation applies when there is no fast
reacting V left:
lnVf
Vp
� �� k
LHSV� ln
Vf
Vsr
� �(5.10)
where Vf, Vp and Vsr are V in the feed, products and
slow reacting V, respectively, and k is the rate constant.
Sughrue et al. [209] used Eq. (5.10) to plot ln(Vf/Vp)
versus ln(1/LHSV) for both parallel ®rst-order and
simple ®rst-order reaction models. These results are
shown in Fig. 89. For the simple ®rst-order reaction
model, where V is the total vanadium in the feed, the
value of the slope (order) varied between 0.4 to 0.7,
whereas for the parallel ®rst-order kinetics the value of
the slope was one, indicating ideal reactor behavior.
Rajagopalan and Luss [219] derived several math-
ematical models to simulate HDM reactions without
comparing their models with the experimental data.
They proposed the following equation for the rate of
the deposit formation:
dm
dt� �2�rpkCM (5.11)
where m is metals removed at time t, � is the number
of metal atoms per reactant molecule; rp is the actual
pore radius; k is rate constant; and C is the concentra-
tion and M molecular weight of the metal sul®de. The
volume of the metal sul®de can be calculated from its
amount and density and can be used for estimating the
change in porosity. The above equation was rewritten
by Pereira and Beeckman [228] in the following form
to test the experimental data from the HDM of a
vacuum residue derived from the Boscan crude:
dfm
dt� ÿ 2kCMdum
d0m�d
(5.12)
where fm is the fraction of the initial micropore
diameter �d0p� that is still available for diffusion, C
is the concentration of metals in the feed, Md is the
molecular weight of the deposit, um is the dimension-
less metal concentration in the feed normalized with
respect to the reactor inlet concentration and, �d is the
deposit density. The model used by these authors
assumes a random distribution of the macropores
and that the metal bearing molecules can enter the
micropores only through macropores. However, this
assumption breaks down when the catalyst has very
low macroporosity. In this case, diffusion into the
particle through micropores becomes important. The
local weight of deposit per unit area of catalyst surface
is given by
w � d0i �1ÿ f 2
i ��d
4(5.13)
where i � m, M subscripts are for micropores and
macropores, respectively. Thus, the total weight of
deposits is obtained by summing up the deposits in the
micropores and macropores. The isothermal HDM
reactor was modelled as a series of mixing cells based
on the equation of Pereira et al. [229] discussed above.
Fig. 90 shows that the model predictions were quite
accurate during the ®rst ten days. It is noted that after 6
days on stream, temperature was raised from 644 to
672 K. Interparticle deposits were found at the end of
the runs. When this was taken into consideration, the
prediction improved signi®cantly. Similar predictions
were made for cylinder and minilith catalyst shapes.
Attempts to develop models for predicting the
HDM kinetics began several decades ago. A number
of important studies appeared in the scienti®c litera-
ture [1,123±125,230±238]. These and other studies
have been cited by other researchers and discussed in
some previous reviews on catalyst deactivation. New
Fig. 89. Effect of temperature on HDV kinetics: (*) 644 K; (~)
616 K [209].
E. Furimsky, F.E. Massoth / Catalysis Today 52 (1999) 381±495 443
Page 64
concepts for explaining HDM reactions have also been
introduced. For example, Mace and Wei [237] sug-
gested that it is more realistic to model HDM by
assuming the catalyst comprises random spheres
and/or needles rather than cylindrical pores. These
authors have proposed four models for predicting the
catalyst performance, i.e., random sphere model, ran-
dom needle model, discrete percolation and contin-
uous random walk.
5.1.3.3. Radial profiles of V and Ni. Diffusion
controlled kinetics implies that the cross-sectional
distribution of V and Ni will change during the
HDM reaction. This will result in a nonuniform
distribution of metals. Among several parameters,
hydroprocessing conditions can influence the
distribution of metals. The position of the catalyst
in the reactor bed is also important, as shown in
Fig. 91 published by Simpson [239]. Thus, the
largest deposition of metals occurs at the inlet of
the bed and then decreases while approaching the
reactor exit. As expected, sulfur exhibits the same
trends as metals, whereas carbon deposition exhibits
the opposite trend.
It was estimated by Wei [240] that if a uniform
distribution is assumed, 20 wt.% of coke and 20 wt.%
of a V sul®de deposited on a catalyst having about
200 m2/g of surface area would represent 5±6 ML
(monolayers) equivalent of deposits. This would result
in complete covering of the catalyst surface. Inspite of
such deposit, the catalyst still retains some activity.
This can be reconciled by assuming either a nonuni-
form distribution or the presence of large crystallites
of metal sul®des. It was suggested that there is a ®xed
number of nucleation sites where the depositions can
occur and then these crystallites grow in size with time
[241,242]. Apparently, the metal species are present as
large crystallites several hundreds of Angstroms in
length rather than as a uniform layers.
Tamm et al. [1] suggested that the radial pro®les of
metals can be characterized by a distribution para-
meter de®ned as:
�m �R 1
0M�r�r dr
Mmax
R 1
0r dr
(5.14)
In this equation, M(r) is the local radial concentra-
tion of metal deposit in the catalyst particle; Mmax is
the maximum concentration and r is the fractional
radius. The �m is the ratio of the average metal
concentration to the concentration at the maximum.
The validity of this parameter was tested during
hydroprocessing of an atmospheric residue. Samples
of the catalyst were periodically withdrawn from the
inlet, middle and outlet of the reactor for analysis of
metals by electron microprobe. Examples of the metal
Fig. 90. Experimental (*) and predicted HDM conversion (644
and 672 K, 14.0 MPa) [229].
Fig. 91. Distribution of metals (V � Ni), carbon and sulfur through
bed length [239].
444 E. Furimsky, F.E. Massoth / Catalysis Today 52 (1999) 381±495
Page 65
pro®les are shown in Fig. 92 [1]. Similar trends were
established by Janssens et al. [243]. These results were
used for estimating the parameter at different intervals
of the run. The change in the parameter with time on
stream is shown in Fig. 93. These results show that
metals have less access to the interior of the catalyst
extrudate with time on stream. Also, Ni penetrates the
interior more than V. The results further show that the
metal deposition is the largest at the inlet and smallest
at the outlet of the catalyst bed, in agreement with the
results in Fig. 91 [239]. The operating parameters also
in¯uence the metal pro®les. Examples of the effect of
hydrogen pressure and type of feed are shown in
Figs. 94 and 95, respectively.
Fig. 92. Typical deposition patterns for Ni, V and Fe [1].
Fig. 93. Ni and V distribution parameters as a function of reactor
position and time [1].
Fig. 94. Effect of H2 partial pressure on V deposition; (�)
19.0 MPa H2 and �v of 0.27, (*) 12.8 MPa H2 and �v of 0.33
(Arab. heavy atm., res., 644 K) [1].
Fig. 95. Effect of the feed type on V deposition (*) Arab. heavy
atm. res. and �v of 0.33, (�) Alask. North Slope atm. res. and �v
of 0.48 (644 K, 12.8 MPa H2) [1].
E. Furimsky, F.E. Massoth / Catalysis Today 52 (1999) 381±495 445
Page 66
The usefulness of the �m parameter has been
recognized by many researchers. For example, Toul-
hoat et al. [244,245] correlated the �m parameter with
experimental results, such as the relative ®rst-order
rate constant and surface area from simulated aging.
As the results in Fig. 96 show, a discontinuity appears
in the ®rst derivative of the �m parameter between 30±
40% metal loading. This indicates that the ultimate
metal storage capacity of the catalyst is being
approached. Bartholdy and Hannerup [223] have
related the distribution parameter to the rate constants
for the sequential reaction network discussed earlier in
the form of the following equation:
Qm � pCA
CB
k1e
k1
� 1ÿ pCA
CB
� �k2e
k1
(5.15)
where p � k1/k1 � k2e. When the equilibrium value
CB/CA � p has been reached, Qm � k1e/k1 � 1. As the
results in Fig. 97 show, the ef®ciency of the V removal
could be correlated with the distribution parameter.
Moreover, the results in Fig. 98 indicate a potential for
predicting the Qm value from the Thiele modulus.
Hung et al. [246] showed that the optimum distribu-
tion factors for an HDM catalyst is case speci®c and is
determined by feed properties, process conditions and
product quality requirements.
Wei et al. [200,247] reported deposition pro®les
from the HDM of Ni- and V-etioporphyrins using 1/16
in extrudates of a CoMo/Al2O3 catalyst in various
positions in the catalyst bed. For both porphyrins, so-
called M pro®les were observed at the entrance of the
catalyst bed with a gradual change to the U-shape
pro®le while approaching the end of the bed. In
Fig. 99 [48], the internal maximum of the M-shape
pro®le was much sharper in the case of Ni as compared
to V. The experimental data was compared with that
obtained by a model. The work was later expanded to
compare an oxidic form of the CoMoAl2O3 catalyst
with its sul®ded form [48,200]. For this purpose, Ni-
etio and -N3TPP porphyrins were used. As the results
in Fig. 100 [200] show, the pro®le of Ni deposits
Fig. 96. Comparison of simulated and experimental data for HDM
aging test results; (&) 653 K experimental, (}) 653 K simululated,
(�) 673 experimental, (~) 673 simulated [245].
Fig. 97. Effect of distribution parameter on V removal [223].
Fig. 98. Correlation between distribution parameter and Thiele
modulus [223].
446 E. Furimsky, F.E. Massoth / Catalysis Today 52 (1999) 381±495
Page 67
varied across the catalyst bed con®rming previous
®ndings. The solid lines represent a prediction based
on the model developed by the authors. For sul®ded
catalyst, the Ni maximum in the M-shape pro®le
shifted towards the outer edge of particles. The M
pro®le at the entrance is explained by the absence of
the deposit species in the oil at the entrance. Thus,
such species have to be ®rst formed by hydrogenation
while reactant molecules diffuse into pores. The shift
in the Ni maximum to the exterior is consistent with
the higher HDM rate in the presence of the sul®ded
catalyst. The Ni deposition pro®le was in¯uenced by
various catalyst pretreatments, e.g., doping with Na
and Cs and halogenation [248]. The observations
made by Agarwal and Wei [247] are in general
agreement with the results published by Tamm et
al. [1]. Internal maxima were also reported by other
authors [249±251]. Other studies have shown that V
forms a U-shape pro®le, whereas Ni tends to be more
uniformly distributed [252±254]. Considering the
number of parameters in¯uencing HDM, i.e., feed
and catalyst characteristics as well as experimental
conditions, the reported differences in the metal pro-
®les are not surprising.
A simple pore-plugging model developed by Oye-
kunle and Hughes [255] was based on second-order
HDM kinetics [136,256±259]. Later, this model was
modi®ed and used for estimating the effectiveness
factor for HDM, metal deposition thickness within
the catalyst pores, radial distribution of metals, cata-
Fig. 99. Ni-deposition profiles in 1.6 mm pellet at various axial
positions; solid lines from model calculations (CoMo/Al2O3 sulfur,
618 K, 6.99 MPa H2) [48].
Fig. 100. Ni-deposition profiles in 1.6 mm pellet at various axial
positions (all the same as in Fig. 99 except CoMo/Al2O3 sulfur)
[200].
E. Furimsky, F.E. Massoth / Catalysis Today 52 (1999) 381±495 447
Page 68
lyst age and the rate of HDM. The thickness of the
metal deposits m was computed from the following
equation:
m � r0 1ÿ r
r0
� �(5.16)
where r is the instantaneous pore radius and r0 is the
initial pore radius. Fig. 101 [255] shows that the metal
deposition thickness increases with time on stream.
Also, metal deposition decreases with increasing pore
size for catalysts of the same age. These results further
indicate that with decreasing average pore diameter of
catalysts, the radial pro®les of metals will get sharper.
Melkote and Jensen [260] used the pore plugging
model to study the evolution of topological properties
assuming two modes of metal deposition, i.e., uniform
and discrete. Apparently, the former would cause a
rapid deactivation, contrary to experimental observa-
tions. Thus, both site coverage and pore plugging were
considered, similar to that by Sahimi and Totsis [258]
and Beeckman and Froment [233,234]. The model can
describe the birth and propagation of the pore plug-
ging `wave' through the particle, and relate this to
experimentally measured deposition pro®les. Melkote
and Jensen [260] used the experimental results pub-
lished by other authors [1,245,259] to test their mod-
els. The best ®t was obtained when the discrete
deposition mode was applied.
The percolation model, based on the regular dis-
crete Bethe network was used by Janssens et al. [261]
and Sahimi et al. [262] to study the effect of the
diffusion coef®cient on the distribution of V during
the HDM of VO-TPP. The maximum in the V pro®le
was shifted to the edge of the particle with decreasing
diffusion coef®cient (Fig. 102). For bulk diffusion, the
deposition occurred at the center of the catalyst pellet
indicating that the deposition process is reaction rate
determined. With decreasing diffusivity, the metal
deposition process becomes more diffusion rate deter-
mined.
Fig. 101. Metal deposition thickness as a function of catalyst age [255].
448 E. Furimsky, F.E. Massoth / Catalysis Today 52 (1999) 381±495
Page 69
5.1.4. Effect of V and Ni Deposits on Activity
This topic of catalyst deactivation is well documen-
ted in the scienti®c literature. Information is available
on the activity of the aged catalysts determined during
hydroprocessing of model compounds as well as real
feeds.
5.1.4.1. Effect on HDM. As the results in Fig. 103
show, the rate of deactivation can be influenced by the
catalyst properties [210]. The type of the feed, reaction
conditions, and the content of V and Ni in particular
are important for the rate of deactivation. The rate of
HDM will gradually decline with progressive
deposition of V and Ni. At a certain point, the
metals will end up in the products. This issue was
considered by Toulhoat et al. [245] in a study of a feed
derived from Boscan crude containing 620 ppm of
V � Ni. The results in Fig. 104 indicate significant
differences in deactivation at two temperatures. At
about 40% metal loading, the deactivation curves
crossed and the rate constant approached zero at
about 65% loading at 4008C, whereas at 3808C the
catalyst did not lose all activity even at 90% metal
loading. The authors attempted to simulate the
experimental results using a deactivation model,
which takes into account the ultimate storage
capacity of the catalyst for V � Ni, its textural
properties, initial activity and selectivities, the
dimensions of the pellets and the reactivity of the
feed.
5.1.4.2. Effect on catalyst activity. Ledoux and
Hantzer [263] conducted a detailed study of catalyst
deactivation using model compounds containing V
and Ni. One series of samples was prepared by
impregnation of a NiMo/Al2O3 catalyst with a
water solution of ammonium vanadate and nickel
Fig. 102. Influence of bulk diffusion coefficient on metal
deposition profiles [261].
Fig. 103. Relationship between HDM rate and the amount of
adsorbed metals for different catalysts [210].
Fig. 104. Apparent first-order constant for HDM (h-1) vs. (Ni � V)
uptake (g%g); & ± 3808C, ± 4008C [245].
E. Furimsky, F.E. Massoth / Catalysis Today 52 (1999) 381±495 449
Page 70
nitrate. This series was designated as VAN-X and
NIN-X for samples containing V and Ni,
respectively. The X in this designation represents
the approximate amount of the metals in wt.%. For
another series of samples, porphyrin from a toluene
solution was deposited on presulfided extrudates of
the catalyst. After removing the solvent, the
impregnated extrudates were sulfided in the reactor
at 4508C in a H2S/H2 mixture. These samples were
designated as VAP-X and NIP-X. Finally, H2-
porphyrin without metal (VAP-O) was deposited on
the catalyst. After determining the HDS activity of
thiophene, the VAP and NIP catalysts were
regenerated and subsequently resulfided. These
samples are designated as VAP-XR and NIP-XR.
Fig. 105 shows the effect of the V content on the
HDS activity. It is evident that the VAP samples were
much more deactivated by the same amount of V than
the VAN samples. However, upon regeneration, the
activity of the VAP-R approached that of the VAN.
These results indicate that V-porphyrin deactivates the
catalyst much more than the impregnated V, and that
upon oxidative regeneration, the V-porphyrin is
converted to V species similar to impregnated V. As
shown in Fig. 106, very different behavior is observed
for the Ni-containing samples. It this case, the NIN
samples were more active than the original catalyst,
whereas the NIP samples followed similar trends as
the VAP samples. The beneficial effect of the
additional Ni was attributed to its association with
the active phase of the catalyst. The HDS activity of
the VAP-0 and H2-porphyrin, i.e., species containing
no metals, decreased only slightly compared with the
catalysts impregnated with a similar amount of the
metal containing porphyrins.
Dejonghe et al. [264] studied the effect of V on the
HYD activity of toluene. Rather than impregnate the
catalysts, these authors deposited V during the HDM
of VO(OEP) under typical hydroprocessing condi-
tions. Thus, the HYD activity was determined at the
end of the HDM experiments of different durations.
The results of these tests are shown in Fig. 107. For
the NiMo/Al2O3 catalyst, the HYD activity is almost
constant up to 2% V, and then begins to decline slowly.
For the Mo/Al2O3 catalyst, the activity increased, but
never reached that of the NiMo/Al2O3 catalyst. This is
consistent with the results published by Guillard et al.
[265], who observed some catalytic activity of the V
sul®des for several hydroprocessing reactions. Little
activity was observed on the bare Al2O3.
Kim and Massoth [266] studied the effect of Von a
CoMo/Al2O3 catalyst activity. One series of V depos-
ited catalysts (V-IMP) was prepared by impregnation
using ammonium metavanadate dissolved in an aqu-
eous oxalic acid solution, and the other series by
reaction of VO-TPP with the catalyst under hydro-
processing conditions. As seen in Fig. 108, a relatively
small amount of V introduced by impregnation dras-
tically deactivated all catalyst functionalities. The V-
TPP deactivation data do not exhibit a smooth decay,
but an apparent line out in activity above about 2% V.
The temperature increase required to compensate for
deactivation is shown in Fig. 109. Again, the differ-
ence between the V-IMP and V-TPP series is quite
evident. It is obvious that the impregnation ensures
more uniform distribution of V in the particle. The
Fig. 105. Effect of vanadium content on HDS activity (NiMo/
Al2O3, 500 K, near atm. H2) [263].
Fig. 106. Effect of nickel content on HDS activity (conditions as in
Fig. 105) [263].
450 E. Furimsky, F.E. Massoth / Catalysis Today 52 (1999) 381±495
Page 71
HYD and CNH activities increased, while the HDS
activity was maintained at 48% by the temperature
increase. This was attributed to higher activation
energies of the HYD and CNH functionalities. More-
over, as the results in Fig. 110 show, the activation
energy for CNH goes through a maximum, while that
of HYD shows little change, and that of HDS shows a
small increase with increasing V content.
The effect of V and Ni sul®des on the activity of a
NiMo/Al2O3 catalyst was investigated by Diez et al.
[105]. The catalysts were impregnated with Ni and V
naphthenates from a toluene solution. Subsequently,
the catalysts were dried and calcined under controlled
conditions. Electron microprobe analysis showed that
both the Vand Ni were uniformly distributed through-
out the particle. After sul®dation, the fresh and metal-
deposited catalysts were used to determine the activity
for HDS, HDN and HYD of dibenzothiophene, quino-
line and naphthalene, respectively. In every case, V
and Ni had little effect on the reaction network, but
affected the individual rate constants. Thus, the added
Ni had little effect on hydrogenation of naphthalene
and hydrogenolysis of dibenzothiophene, while the
added V decreased the rate constants in the former and
increased those in the hydrogenation network of
dibenzothiophene. The added V enhanced cracking
activity, whereas the added Ni had little effect. The
authors attempted to predict deactivation by using a
process model. They concluded that Ni and V deposits
have to be considered separately in the model.
Ammus et al. [161] compared three different par-
ticle sizes of a commercial CoMo/Al2O3 catalyst, i.e.,
1/8-in., 1/16-in. and pulverized with a mean particle
diameter of 0.34 mm, during the hydroprocessing of
an atmospheric residue containing 9 and 11 ppm Vand
Ni, respectively. Another CoMo/Al2O3 catalyst was
used in two different particle sizes. The effect of coke
and metals on catalyst properties are given in Table 26
for the pulverized sample. After 70 h on stream, almost
all surface area and pore volume could be recovered
on regeneration, indicating that coke was mainly
responsible for the decrease of these parameters. At
the same time, the mean pore diameter decreased by
about 25%, suggesting that metals were depositing
near the pore mouth. However, the recovery of surface
area and pore volume decreased signi®cantly after
200 h on stream. These results suggest that up to a
certain level of metal deposits, the surface area and
pore volume of the catalysts are unaffected. These
effects were less pronounced for larger particles,
Fig. 107. Effect of vanadium on toluene hydrogenation activity (* ± NiMo/Al2O3, & ± Mo/Al2O3, ~ ± Al2O3, 623 K, 10 MPa) [264].
E. Furimsky, F.E. Massoth / Catalysis Today 52 (1999) 381±495 451
Page 72
Fig
.1
08
.R
elat
ive
acti
vit
y(R
A)
vs.
van
adiu
mco
nte
nt
of
cata
lyst
sfo
r(a
)H
DS
;(b
)H
YD
;(c
)C
NH
and
(d)
HD
N:
x±
V-I
MP,
*±
V-T
PP
(NiM
o/A
l 2O
3,
623
K,
3.5
MP
aH
2)
[266].
452 E. Furimsky, F.E. Massoth / Catalysis Today 52 (1999) 381±495
Page 73
mainly due to the fact that less coke and metals were
deposited. Supporting evidence for these observations
was published by Wukasch and Rase [267].
Ammus et al. [161] also correlated relative HDS
activities of CoMo/Al2O3 catalysts with the amount of
coke and metal (V � Ni) deposits. As the results in
Figs. 111 and 112 show, for the pulverized catalyst,
25 wt.% coke and 0.7 wt.% metal deposits, respec-
tively, developed before a measurable activity loss was
detected. Further increase in the deposits caused an
almost linear activity loss. The more pronounced loss
of activity observed for the extrudate samples is in line
with the presence of diffusional phenomena. In a
similar study, Koyama et al. [268] studied hydropro-
cessing of a vacuum residue in a reactor consisting of
four beds in series. The samples of spent catalysts
were taken after 22 weeks, except for one sample
taken from bed 3 after two weeks. Properties of the
spent catalysts are shown in Table 26. The adverse
effect of both coke and metal deposits is quite evident.
The effect of metal deposits on relative activity
obtained from these results is shown in Fig. 113.
Subsequently, the catalysts were regenerated and com-
pared with the spent catalysts for HDS, HDN and
hydrogenation of model compounds. The summary of
these experiments is shown in Fig. 114. Comparison
of Fig. 114 with Table 27 suggests that the detrimen-
tal effect of metals increases with their content in the
catalyst.
Inoguchi et al. [251] evaluated three catalysts after
about 3000 h of operation during the hydroprocessing
a Kuwait atmospheric residue containing 53 ppm V
Fig. 109. Effect of vanadium content (V-IMP) of catalyst on tem-
perature for 48% HDS conversion (conditions as in Fig. 108) [266].
Fig. 110. Activation energies vs. vanadium content of (V-TPP)
catalysts [266].
Table 26
Effect of coke and metals on catalyst properties [161]
Time on
stream (h)
Coke (CHN)
(wt.%)
Metals (wt.%) Surface
area (m2/g)
Pore volume
(cm3/g)
Pore
diam. (AÊ )V Ni
0 fresh 215 0.442 86
30 spent 0.532 0.178 146 0.219 36
Regenerated 221 0.465 74
70 spent 28.9 0.986 0.222 111 0.188 36
Regenerated 208 0.429 64
200 spent 31.6 2.028 0.884 26 0.047 36
Regenerated 141 0.323 56
E. Furimsky, F.E. Massoth / Catalysis Today 52 (1999) 381±495 453
Page 74
and 13 ppm Ni. The catalysts were taken from the
upper part and lower part of the bed. The catalysts
were regenerated at 4008C in 2% O2. Parameters such
as surface area, pore volume and pore diameter were
determined for the fresh, spent and regenerated cat-
alysts. The results of these evaluations are shown in
Table 28. The higher recovery of surface area and pore
volume for the catalyst taken from the lower part
(reactor exit) of the bed was attributed to lower content
of Vand Ni compared with that in the upper part. Little
effect on the mean pore diameter was consistent with
preferential ®lling of small pores. The difference in the
parameters among the catalysts can be almost cer-
tainly attributed to the different properties of the
catalysts, which were not given. Only a partial recov-
ery of the activity could be achieved on regeneration,
indicating a deactivating effect of metals. In a similar
study published by Johnson et al. [222], three CoMo/
Al2O3 extrudate (1/32-in.) catalysts were evaluated
Fig. 111. Catalyst relative HDS activity vs. metal (V � Ni)
deposit; (a) CoMo/Al2O3 of 0.414 bed void, (b) CoMo/Al2O3 of
0.472 bed void, * ± pulverize, & ± extrudates 1/16-in., ~ ±
extrudates 1/8-in. (623 K, near atm. H2) [161].
Fig. 112. Catalyst relative HDS activity vs. coke deposit (symbols
and conditions as in Fig. 111) [161].
Fig. 113. Relative dibenzothiophene HDS activity vs. metal
deposits (NiMo/Al2O3, 633 K, 12 MPa) [268].
Fig. 114. Loss of HDS, HDN and HYD activities due to coke and
metals (catalysts and conditions as in Fig. 113) [268].
454 E. Furimsky, F.E. Massoth / Catalysis Today 52 (1999) 381±495
Page 75
after being used in a trickle bed reactor for the
hydroprocessing of an atmospheric residue. Properties
of the fresh and aged catalysts from this study are
shown in Table 29. A marked decrease in the surface
area and pore volume was quite evident. At the same
time, little change was observed in the average pore
diameter. The activity tests of these catalysts are
summarized in Table 30. Interestingly enough, after
regeneration of catalyst E, HYD and HDN activities
were partly recovered, whereas the HDS activity
remained unchanged. Also, for all functionalities,
no difference was observed between the extrudate
and crushed samples, in contrast to large differences
in diffusivities measured with coronene. Apparently,
the test molecules were suf®ciently small that diffu-
sion did not in¯uence their activities.
A signi®cant loss in porosity, surface area and HDS
activity of spent catalysts used in commercial opera-
tions was reported by Babcock et al. [269] and by
Alvarez et al. [77]. In the former case, the activity
could be recovered by leaching V and Ni from the
catalyst, while the activity recovery on oxidative
regeneration was much less. Almost complete recov-
ery of the pore volume, average pore diameter and
HDS activity was achieved after the leaching of a
spent NiMo/Al2O3 catalyst with an acid by Hildeb-
randt et al. [270], while the catalyst still contained
more than 50% of the deposited Vand Ni. The catalyst
was used in an ebullated bed for hydroprocessing of a
vacuum residue.
Zeuthen et al. [271] published perhaps the most
detailed results on the loss of surface area and por-
osity. They used a three-stage system for hydropro-
cessing of a Khafji vacuum residue containing
153 ppm V, 46 ppm Ni and traces of Fe with a
CoMo/Al2O3 catalyst. At the beginning of the run,
all three stages were ®lled with the fresh catalyst.
Subsequently, samples were taken at various intervals
from stage 1 and 3 reactors. The pore size distributions
of the catalysts are shown in Fig. 115. Coke and
metals deposited more rapidly on the ®rst stage cat-
alyst after 1 day on stream, whereas that on the third
stage catalyst showed only a minor loss of pore
Table 27
Properties of spent catalysts [268]
Age Fresh 2 weeks 22 weeks
Bed No. 3 2 3 4
Catalyst No. A B C D/E F/G
Deposits, (wt.%)
Carbon 16.8 12.1 15.7/13.0 25.1/22.2
V � Ni 0.5 21.2 15.2/14.8 6.5/ 6.8
Propertiesa
Surface area, (m2/g) 205 187 187 169/169 147/160
Pore volume (cm3/g) 0.57 0.40 0.38 0.35/0.35 0.32/0.34
a Based on fresh catalyst.
Table 28
Properties of fresh, spent and regenerated catalysts [251]
Catalyst
No.
Surface area
(BET m2/g)
Pore volume
(cm3/g)
Mean pore
diameter (AÊ )
KC-28
Fresh 239 0.458 76.5
Spent U 106 0.172 65.1
Spent L 102 0.187 73.6
Regenerated U 119 0.233 78.2
Regenerated L 170 0.343 80.9
KS-83
Fresh 128 0.367 114.6
Spent U 55 0.144 105.4
Spent L 50 0.140 112.9
Regenerated U 69 0.197 114.9
Regenerated L 81 0.259 127.4
KS-97
Fresh 106 0.401 151.3
Spent U 56 0.130 92.9
Spent L 54 0.134 99.3
Regenerated U 49 0.182 148.1
Regenerated L 83 0.302 145.8
U: Upper part of bed.
L: Lower part of bed.
E. Furimsky, F.E. Massoth / Catalysis Today 52 (1999) 381±495 455
Page 76
volume after the ®rst day on stream. By Day 8,
however, the third stage sample had lost signi®cantly
more pore volume than the ®rst stage samples, i.e., by
Day 8 the ®rst-stage catalyst retained 71% of the
initial surface area compared with only 50% retention
in the third-stage catalyst. Average mesopore diameter
decreased steadily over most of the run for both stages.
Also, macropore volume in pores >1200 AÊ diameter
decreased more rapidly in third-stage samples, indi-
cating predominance of a lower density coke in the
third-stage as compared to a higher density metal
sul®de in the ®rst-stage. The porosity data on samples
taken at the end of the run clearly showed that the third
stage sample had less pore volume in both mesopores
and macropores as compared with that for the ®rst
stage spent catalyst. Further results showed that meso-
pores were almost completely ®lled with coke and/or
metal deposits.
Zeuthen et al. [271] performed an extensive activity
evaluation of the catalyst samples of Fig. 115. These
results are shown in Fig. 116 using three dimensional
plots of the relative activities (HDS, HDN and HYD)
as a function of the carbon (normalized to 21 day
samples) and V content (logarithmic scale). The
activities were determined using model compounds.
The deactivating effect of coke was not the same for
all functionalities. This is seen most clearly from the
third reactor samples, Days 0±8, which contained very
small amounts of deposited metals. Thus, the HDN
and HYD decreased rapidly, whereas HDS deactivated
only slightly up to a coke level of 55%, suggesting that
there are two different sites for these reactions [272].
Similar evaluation of the ®rst reactor samples con-
®rmed a more rapid deactivation for all functionalities.
This was attributed to a higher content of metals
compared with the third reactor samples. To distin-
guish between the deactivating effect of V and Ni,
these authors impregnated the fresh catalyst with V
and Ni and compared the activity of the resulting
catalysts with that decoked after 21 days. These results
are shown in Table 31 [271]. It is quite evident that V
had a much more detrimental effect on all function-
alities than Ni, particularly on HDS. This is in the
agreement with the results published by Yoshimura et
al. [273], con®rming that among several metals, V had
the largest deactivating effect on HYD.
Gualda and Kasztelan [274] used two sets of spent
NiMo/Al2O3 catalysts during hydroprocessing of an
Table 29
Properties of fresh and aged catalysts [222]
Catalyst Carbon
(wt.%)
Metals Surf. area
(m2/g)
Pore vol.
(cm3/g)
Avg. pore
diam. (nm)
De�1010,
(m2/s)V (wt.%) Ni (wt.%)
Fresh*
E 219 0.57 11.4 4.3
A 194 0.60 12.3 5.1
F 125 0.54 17.3 5.1
Aged
E 11.5 9.0 2.5 92 0.21 9.1 **
A 9.5 11.8 3.4 60 0.20 13.3 <0.01
F 4.3 13.7 4.1 57 0.20 14.0 <0.01
a Fresh E 2.1 Co � 6.9 Mo: A 1.9 Co � 6.9 Mo; F 1.7 Co �6.9 Mo.b Too slow to measure.
Table 30
Catalyst activities [222]
Catalyst Rate constant�103 (Rel. activitya)
HDS HYD HDN
E
Fresh extrudate 4.22 (1.00) 3.35 (1.00) 1.13 (1.00)
Aged extrudate 0.65 (0.15) 0.30 (0.09) 0.18 (0.16)
Aged crushed 0.65 (0.15) 0.30 (0.09) 0.18 (0.16)
Regen. extrudate 0.65 (0.15) 0.70 (0.21) 0.30 (0.26)
F
Fresh extrudate 4.92 (1.00) 4.33 (1.00)
Aged extrudate 0.13 (0.03) 0.02 (0.01)
a Activity relative to the fresh catalyst in terms of ratios of rate
constants.
456 E. Furimsky, F.E. Massoth / Catalysis Today 52 (1999) 381±495
Page 77
atmospheric residue, i.e., one in a batch reactor under
varying pressure of H2 (symbol P) and the other in a
continuous ®xed bed unit under typical hydroproces-
sing conditions (symbol TS). In the latter case, the
samples of catalyst were withdrawn periodically. The
results in Fig. 117 (from the TS series) show the
deposition of metals and coke with time and their
effect on HDS activity. The HYD and HDS activities
of the spent catalysts were evaluated using toluene and
thiophene, respectively, as model compounds. The
effects of carbon and V content on the HYD and
Fig. 115. Pore size distribution of (a) first-stage samples; (b) third-
stage samples and (c) catalyst withdrawn after 120 days from both
stages [271].
Fig. 116. Relative fresh catalyst activities with carbon content as
normalized to 21 days of exposure and vanadium deposits
(logarithmically) as (a) HDS activity; (b) HDN activity and (c)
HYD activity [271].
Table 31
Activity data of aged catalysts relative to fresh catalysts [271]
HDS HDN HYD
Fresh 100 100 100
Fresh � 1.5% Ni 193 154 152
Fresh � 6% V 9.8 80.7 53.6
Decoked 21 days
(2.1% Ni and 7.1% V) 17.8 72.3 79.1
E. Furimsky, F.E. Massoth / Catalysis Today 52 (1999) 381±495 457
Page 78
HDS activities are shown in Fig. 118. Small amounts
of V had a dramatic effect on HYD activity regardless
the origin of the spent catalysts, whereas the effect on
the HDS activity was more gradual. At the same time,
the effect of carbon on the HDS activity of the P
samples was different than on that of the TS samples.
The comparison of the carbon contents in Fig. 117
with that in Fig. 118 shows that the HDS activity
refers to the very early stages of the test. Nevertheless,
it is evident that the origin of coke in¯uences the
residual activity, suggesting that some differences in
observations among different researchers may be
traced to the conditions to which the spent catalysts
are exposed.
Four NiMo/Al2O3 catalysts, having different unim-
odal and bimodal pore size distributions and different
proportions of mesopores and macropores (Table 32)
were compared by Absi-Halabi et al. [275]. The
decline in the HDS activity with time on stream during
the hydroprocessing of a Kuwait vacuum residue is
shown in Fig. 119. The HDS activity of the PD-M1
catalyst was signi®cantly higher than that of the PD-
M2 catalyst; however, the former was much more
active for HDM. For HDM and HDN, large pore
Fig. 117. Time on steam vs. (a) HDS conversion and metals
(V � Ni) deposition and (b) carbon content and H/C ratio of coke
[274].
Fig. 118. Relative HYD and HDS activities vs. (a) carbon content
and (b) vanadium content [274].
Table 32
Properties of catalysts [275]
Catalysts
PD-M1 PD-M2 PD-B1 PD-B2
Fresh catalysts
Bulk density (g/cm3) 0.56 0.72 0.55 0.58
Surface area (m2/g) 85 228 138 312
Pore volume (cm3/g) 0.60 0.53 0.73 0.76
Mesopore distribution (%)
3±10 nm 4 38 7 55
10-25 nm 11 60.5 34 8
25-50 nm 27 1.5 19 8
Macropore distribution (%)
50±100 nm 15 0 6 6
100±300 nm 43 0 16 21
>300 nm 0 0 18 2
Spent catalysts
Carbon (wt.%) 15.5 15.8 19.7 21.2
Vanadium (wt.%) 11.0 6.8 9.6 8.7
Loss of surface area (%) 20.5 39.7 44.5 50.0
Loss of pore volume (%) 36.5 55.0 67.0 80.0
458 E. Furimsky, F.E. Massoth / Catalysis Today 52 (1999) 381±495
Page 79
catalysts having a major proportion of the pore volume
in 100±300 nm diameter exhibited the lowest deacti-
vation rates. Bimodal pore catalysts with a large
amount of narrow pores (PD-B1) showed higher rates
of deactivation for HDS than unimodal pore catalysts
(PD-B2) with a maximum amount of medium size
mesopores. The results shown in Fig. 120 are in
support these observations [276]. In this case, the feed
contained Fe, V, Ni and Ti; therefore metals were the
main cause of the deactivation. The HDN activity
continued to decline after the steady-state level of
coke was attained.
5.2. Formation of and Deactivation by Fe and Ti
Deposits
Most of the studies on the deposition of Fe and Ti on
catalysts deal either with the liquefaction of coal or
with hydroprocessing of coal-derived liquids, and, to a
lesser extent, with other feeds as well. Both single-
stage and multi-stage liquefaction processes were
investigated. Various forms of NiMo/Al2O3 catalysts
were used in these studies. Most of the relevant
information was published in the 1980s. In this regard,
the evaluation studies on spent catalysts from the
ebullated hydrotreater in the Wilsonville Coal Lique-
faction Facility have received the most attention and
represents perhaps the most signi®cant contribution to
the ®eld.
5.2.1. Mechanism of deposit formation
The information on the formation of Fe and Ti
deposits is much less documented compared with that
for V and Ni. Similarly, as for the latter, deposition of
Fe and Ti occurs simultaneously with that of coke. The
results in Fig. 121 show that the formation of coke is
faster than that of Fe and Ti deposits [277], but the
difference seems to be less pronounced than in the
Fig. 119. HDS activities and deactivation of catalysts [275].
Fig. 120. Catalytic nitrogen conversion vs. time on stream; � ±
laboratory-prepared bimodal. * ± Unimodal containing fluoride
ions [276].
Fig. 121. Coke and metal contaminants as a function of catalyst
age [277].
E. Furimsky, F.E. Massoth / Catalysis Today 52 (1999) 381±495 459
Page 80
case of Vand Ni [97]. The use of Fe- and Ti-containing
model compounds did not attract much attention in
elucidating the mechanism of deposit formation.
Kovach et al. [278] impregnated a CoMo/Al2O3 cat-
alyst with Fe2O3 and TiCl2 in cyclopentane before
hydroprocessing a coal-derived liquid, whereas Lynch
[279] used Ti-porphyrin in a similar study. However,
these compounds may not be representative of the Fe
and Ti species in coal and coal-derived liquids.
The origin of the Fe and Ti deposits may be traced to
the forms of Fe and Ti in the coal. Pyrite (FeS2) is the
main form of Fe in coal. A small amount of mixed
structures of Fe sul®des with other elements, as well as
Fe sulfates can also be present. The existence of an
organically bound Fe in the coal cannot be excluded.
There is an indication that part of the Ti can be
organically bound, whereas the other occurs mostly
as TiO2 [280]. Under coal liquefaction conditions,
pyrite will be gradually converted to FeS, in which
case the H2S/H2 ratio is important [281]. However,
this conversion may not be complete. Thus, according
to the results published by Cable et al. [61], the Fe
deposit on a spent catalyst from coal liquefaction
comprised both FeS2 and FeS. It is believed that some
FeS was formed on the catalyst surface from the
deposited FeS2. It was suggested by Attar and Martin
[282] that the conversion of FeS2 to FeS results in a
catalytic effect of the latter on liquefaction. Thus,
during the ®rst stage, Fe may play opposing roles,
i.e., on one hand positively in¯uence liquefaction,
while at the same time decreasing liquefaction by
covering catalyst sites. TiO2 resists both reduction
and sul®dation [283]. There are some suggestions that
part of the Ti is of a porphyrin type [279]. Ti-porphyr-
ins were assumed to be present in heavy oils derived
from tar sands [284]. It is believed that during hydro-
processing, Ti-porphyrins will undergo similar reac-
tions as those occurring during HDM of V and Ni,
whereas FeS and especially FeS2 will be mostly
physically deposited on the catalyst exterior surface,
with only a small portion of the FeS entering the pores.
It is evident that FeS and TiO2 will be the pre-
dominant species in the primary metal-containing
products from liquefaction and/or during the second
liquefaction stage. During the ®rst stage, the organo-
metallic forms will release the metals, which subse-
quently will be converted either to sul®des (Fe) or
oxides (Ti). The conversion of Ti to TiO2 was con-
®rmed by Lynch [279], who studied NiMo catalyst
deposited with Ti-porphyrin. TiO2 was indeed found
on the catalyst surface after hydrogenation in creosote
oil. Apparently, there is enough oxygen in the coal for
oxidation of the Ti to occur. The species formed from
the organometallics will be very ®nely dispersed in the
primary deposits. Relatively deep penetration of TiO2
into the catalyst interior observed by Stanulonis et al.
[285] during the ®rst and second coal liquefaction
stage using a CoMo catalyst would be consistent with
its presence in an organic form. On the other hand,
most of the FeS was deposited on the external surface
of the catalyst particles (Figs. 122 and 123), particu-
larly during the ®rst stage. In another study, Stohl et al.
[286] observed that one portion of the Fe was depos-
ited on the external surface, while another was evenly
distributed, suggesting that the internal Fe deposit
originated from a different precursor. Accumulation
of coal mineral components on the catalyst surface
resulted in substantial losses in catalyst surface area
Fig. 122. Electron microprobe profiles of a catalyst particle from
the upstream end of the reactor [285].
460 E. Furimsky, F.E. Massoth / Catalysis Today 52 (1999) 381±495
Page 81
[287]. Because of the variability in the structure and
composition of coal, different relative reactivities and
diffusivities of the metal contaminants can be
expected.
5.2.2. Kinetics of Fe and Ti deposition
Much less attention has been paid to the kinetics of
the deposition of Fe and Ti compared with that of V
and Ni. This applies both to diffusion controlled and
intrinsic kinetics of deposition. The effective diffusiv-
ities of fresh, spent and regenerated coal liquefaction
NiMo/Al2O3 catalysts were investigated by Stephens
and Stohl [288]. For the spent catalysts, a signi®cant
decrease in effective diffusivity was observed.
The results shown in Figs. 124 and 125 demon-
strate, a linear accumulation of Fe and Ti during
hydroprocessing of several feeds obtained during a
two-stage liquefaction of coal [88]. At the same time,
the coke build-up was initially rapid and then reached
a steady-state. The catalyst consisted of NiMo/Al2O3
extrudates of 4 mm length and 0.8 mm diameter. The
run numbers in these ®gures indicate different catalyst
pretreatment and/or experimental conditions. Typical
trends in Fe and Ti distributions in catalysts were
observed, with the maxima of both Fe and Ti slightly
displaced towards the interior of the particle. Depths
of penetration of Fe and Ti appear to correlate with
their bulk concentrations, i.e., the higher the concen-
tration, the deeper the penetration. Thakur et al. [289]
also showed that both Fe and Ti penetration increased
with time on stream (Fig. 126).
Adkins et al. [290] developed a diffusion-limited
model to predict deposition of Fe and Ti in 1/32-in.
diameter NiMo/Al2O3 catalysts used in the Wilson-
ville pilot plant ebullated hydrotreater. The authors
recognized the importance of the characterization of
Fig. 123. Electron microprobe profiles of a catalyst particle from
the downstream end of the reactor [285].
Fig. 124. Iron content of aged catalyst [88].
Fig. 125. Titanium content of aged catalyst [88].
E. Furimsky, F.E. Massoth / Catalysis Today 52 (1999) 381±495 461
Page 82
the catalyst, in particular the spatial distribution of the
metals, as well as time trends in the distributions. The
level of metal accumulation was much lower (no more
than 1 to 2 wt.%) than that of coke (up to 14 wt.%).
Initially, the coke deposition occurred rapidly, causing
a signi®cant change in pore size, and then remained
constant during the metal deposition period. During
the later period, the catalyst pore structure showed
little change, supporting the view that the effective
diffusivity remained constant during the entire metal
accumulation period. The model used had the form of
two ordinary differential equations and was based on a
®rst-order adsorption of metal with linear site block-
ing and subsequent saturation, assuming one site
deactivated per molecule of contaminant.
5.2.3. Effect of Fe and Ti on catalyst activities
Deactivation by Fe and Ti is a common phenom-
enon occurring during coal liquefaction and hydro-
processing of coal-derived feeds. Also in this case,
deactivation by coke occurs simultaneously. The
higher aromaticity of the coal derived feeds suggests
a higher contribution of coke to the overall deactiva-
tion, compared with the conventional feeds. In a
single-stage coal liquefaction process, catalyst con-
tacts both coal and solvent [291]. In the two-stage
con®guration, coal dissolution occurs in the ®rst stage,
while upgrading of the products occurs in the second
stage [277]. It was shown by Stanulonis et al. [285],
that catalyst deactivation in the ®rst stage differs from
that in the second stage. Deactivation by Fe and Ti
may also occur during hydroprocessing of the other
feeds. As was indicated earlier, most of the Fe and Ti
are of inorganic origin, although organometallic forms
may also be present. The difference between the cross-
sectional distribution of Fe and Ti indicates different
deactivating effects. In any case, the loss in porosity,
accompanied by the decrease in the effective diffu-
sivity, occurs similarly as for V and Ni. The ultimate
result of Fe and Ti deposits is coverage of active sites.
An extensive evaluation of a CoMo/Al2O3 catalyst
used for the processing of a coal was conducted by
Cable et al. [292]. The properties of the aged catalysts
are given in Table 33. It is quite evident that as coke
and metals deposited, the pore volume and surface
area decreased and the average pore diameter
Fig. 126. Metal (Fe±Ti) concentration profiles for samples with different ages [289].
462 E. Furimsky, F.E. Massoth / Catalysis Today 52 (1999) 381±495
Page 83
increased. Catalytic functions such as HDS, HYD and
cracking (CKG) were evaluated for catalyst extrudate
and crushed samples using model compounds. The
results of the activity evaluations are presented in
Table 34, where kT, kH and kC are ®rst-order rate
constants for HDS, HYD and CKG, respectively.
The catalysts in Table 33 were regenerated to deter-
mine recovery of the activity. As shown in Fig. 127,
after regeneration of the catalyst exposed to coal for 1
day, almost all hydrogenation (HYD) activity was
restored and CKG activity was higher than that of
the fresh catalyst. However, both HDS and HDO
activity showed permanent losses. The 4-day regen-
erated catalyst showed an additional increase in crack-
ing activity and most of the hydrogenation activity was
still restored, whereas only 60% of HDS and HDO
activity was restored. After 25 days, all regenerated
activities were considerably lower. To gain more
insight into the deactivation, Cable et al. [292] impreg-
nated the catalyst extrudates with solutions containing
Fe, Ti, B, Si and Ca. Activities of the impregnated
catalysts are given in Table 35. The composite catalyst
(Fe, Ti, B) resulted in a large decrease in HDS activity
of the 9-day aged-regenerated catalyst, whereas the
HDO activity was only decreased to 85%. In addition,
the authors arti®cially coked the catalyst to attain
Table 33
Properties of fresh and aged catalyst [292]
Sample Coke (CHN)
(wt.%)
Metals (wt.%) Surface
area (m2/g)
Pore volume
(cm3/g)
Average
diameter (AÊ )Ti Fe B
Fresh 308 0.69 45
Aged
Day 1 0.48 0.16 0.12 160 0.38 48
Day 4 17.4 0.96 0.48 0.47 37 0.15 81
Day 9 19.1 1.8 0.46 0.50 28 0.12 86
Day 18 21.1 1.9 0.98 0.55 17 0.08 94
Day 25 21.9 2.1 0.64 0.42 14 0.08 114
Table 34
Catalyst activities of aged catalysts expressed on fresh basis [292]
Sample Extrudates Crushed
kT kH kC kT kH kC kO
Fresh 17.3 62.4 109 20.3 64.6 124 378
Aged Day 1a 10.0 ± 5 10.5 26.0 8 ±
1 4.7 14.6 2 8.8 24.9 7 26
4 3.3 13.4 14 4.7 16.6 21 10
9 0.5 6.2 10 1.9 8.6 8
a Exposed to recycle oil only.
Fig. 127. Relative activities of regenerated extrudates [292].
E. Furimsky, F.E. Massoth / Catalysis Today 52 (1999) 381±495 463
Page 84
about 24% of coke. As the results in Table 36 show,
the coked catalyst was totally deactivated for HDS,
CKG, and HDO, and hydrogenation was decreased to
about 10%. On regeneration, nearly all HDS and HDO
activities were restored and HYD and CKG increased.
In a similar study, Stephens and Stohl [288] inves-
tigated the effect of aging of an extrudate (0.8 mm)
NiMo/Al2O3 catalyst on its activity for the hydroge-
nation of perylene. Both the aged and regenerated
catalysts were evaluated. Properties of the catalysts
and rate constants from this study are shown in
Tables 37 and 38, respectively. A steady loss of sur-
face area and porosity on deposition of the contami-
nants was observed. The average pore diameter
decreased as well, but, as seen in Fig. 128, it could
be mostly restored by regeneration. Inspite of restor-
ing nearly all the pore volume, the activities of the
regenerated catalysts were markedly lower than those
of the fresh catalysts, indicating permanent deactiva-
tion by metals. Also, the activities of the crushed
catalysts were signi®cantly higher than those of the
extrudates, indicating diffusional limitations caused
by both the coke and metal deposits.
Another set of the activity data published by Stohl
et al. [286] involved two spent NiMo/Al2O3 catalysts
used for the upgrading of a mixture containing 70%
solvent re®ned coal and 30% prehydrogenated creo-
sote oil. The properties of the fresh, aged and regen-
erated catalysts from this study are shown in Table 39.
The rather high level of recovery of surface area and
Table 35
Catalyst activities of metal impregnated catalysts [292]
Metal Content in catalyst (wt.%) Catalyst activity
kT kH kC kO
None ± 18.4 80.9 143 378
Ti 0.75 11.6 65.7 156 ±
Ti 2.0 12.0 74.4 270 ±
Fe 0.2 18.0 76.5 189 ±
Fe 0.8 11.4 72.2 100 ±
B 0.25 23.2 81.1 230 ±
B 0.50 23.4 71.9 427 ±
Ca 1.0 7.6 53.0 194 ±
Si 1.0 18.1 66.8 396 ±
Ti, Fe, B 2.0, 0.8, 0.5 8.4 61.8 341 313
Table 36
Catalyst activity of artificially coked catalysta [292]
Catalyst Catalyst activityb
kT kH kC kO
Fresh, calcined 25.7 70.8 204 430
Artificially cokedc 0.2 8.7 6 6
Regenerated 24.7 104 267 416
a Data for crushed catalysts.b Calculated at 25% conversion.c Coked with isooctene/He (about 24% coke).
Table 37
Properties of fresh and aged catalysts [288]
Age of catalyst (lb of
feed/lb of catalyst)
Major contaminants (wt.%) Surface
area (m2/g)
Pore volume
(cm3/g)C Fe Ti
Fresh 150 0.49
43 8.2 0.14 0.14 125 0.32
88 9.3 0.22 0.21 113 0.29
133 9.6 0.28 0.30 108 0.28
381 9.2 0.67 0.46 102 0.27
527 9.4 0.72 0.56 100 0.27
464 E. Furimsky, F.E. Massoth / Catalysis Today 52 (1999) 381±495
Page 85
pore volume with regeneration should be noted. How-
ever, the activities of the regenerated catalysts
(Table 40) were much lower than that of the fresh
catalysts, con®rming extensive deactivation by metals.
Similar results obtained at near atmospheric pressure
showed a marked difference between the activities of
the extrudate and crushed catalyst, the latter being
much more active. At high pressure, the HDS and
HYD activities for the extrudates and crushed catalyst
were comparable, indicating the absence of diffu-
sional limitations due to the outer barrier. The pore
volume distribution for one of the investigated cata-
lysts is shown in Fig. 129. In this case, a shift to lower
Table 38
Rate constants for crushed and extrudate catalysts [288]
Age of catalysts (lb/lb) Rate constants (sÿ1 gÿ1 � 102)
Aged catalysts Regenerated catalysts
Crushed Extrudates Crushed Extrudates
Fresh 15.9 4.1 17.6 4.7
41 1.6 0.39 13.6 1.3
88 1.2 0.59 12.1 1.7
133 0.88 0.37 11.8 0.98
381 0.49 0.32 7.2 0.85
527 0.49 0.26 5.2 0.45
Fig. 128. Pore volume distribution for fresh. aged and regenerated
catalysts [288].
Table 39
Surface area and total pore volume of fresh, aged and regenerated catalysts [286]
Surface area (m2/g) pore volume (cm3/g)
Measured Fresh basis Measured Fresh basis
Fresh 147 147 0.44 0.44
Aged 1 107 143 0.23 0.31
Aged 2 86 113 0.19 0.25
Regenerated 1 112 123 0.35 0.39
Regenerated 2 127 132 0.41 0.43
Table 40
Activity testing in high pressure reactor [286]
Catalyst Relative activity
HDS HYD HDO HDN
Extrudates
Fresh 1 1 1 1
Aged 2 0.21 0.03 0.11 0.14
Regeneated 1 0.10 0.02 0.06 0.11
Regenerated 2 0.25 0.16 0.18 0.25
Crushed
Fresh 1 1 1 1
Aged 1 0.07 0.01 0.04 0.16
Aged 2 0.17 0.01 0.04 0.17
Regenerated 1 0.14 0.04 0.14 0.20
Regenerated 2 0.20 0.08 0.27 0.41
E. Furimsky, F.E. Massoth / Catalysis Today 52 (1999) 381±495 465
Page 86
pore diameter is seen, suggesting that larger pores
were ®lled. On regeneration, the pore volume distri-
bution was similar to that of the fresh catalyst. With
respect to the change in pore diameter, properties of
the catalyst are important. Thus, either an increase or a
decrease in average pore diameter is possible. This
was con®rmed by Ihnatowicz and Worsztynowicz
[293], who tested 11 catalysts of different structure
used for upgrading a coal derived feed. In this study,
the loss of surface area and pore volume were con-
sistent for all catalysts, whereas both increases and
decreases in pore diameter were observed.
Thakur et al. [289] studied the deactivation of a
CoMo/Al2O3 catalyst (1.5 mm extrudate) during the
hydroprocessing of a coal-derived feed lasting 30
days. The focus was on the HDO activity determined
from the content of phenolic ±OH, as well as on the
hydrogenation activity measured by the ratio of aro-
matic to aliphatic protons determined by NMR.
Fig. 130A presents the dependence of the activities
on surface area; while Fig. 130B presents plots of the
composition of residue (coke, metal contents and H/C
ratio) against surface area and time on stream. In the
®rst region, corresponding to the initial 4 days of the
run, the surface area decreased by a factor of 8,
indicative of ®lling of micropores. In this region,
the phenolic -OH concentration curve shows a parallel
behavior with the Fe content and the H/C ratio of the
coke.
Surprisingly, the decrease in the surface area from
308 to 37 m2/g did not have a signi®cant in¯uence on
HDO. On the other hand, the aromatic/aliphatic proton
ratio and coke concentration curve exhibited a parallel
trend. This suggests that the HDO activity does not
greatly depend on the surface area, whereas the hydro-
genation activity appears to be related to the surface
area. The second region corresponds to the period of 4
days to 24 days on stream. In this region, activities and
chemical composition of the catalyst deposit exhibit a
parallel behavior. Thus, the catalytic activities are
closely related to the coke and metal contents and
Fig. 129. Pore volume distribution for fresh (±), aged 1 (±) and
aged 2 (±) catalysts [286].
Fig. 130. Variation of HDO and HYD activities with surface area
(A) and composition of catalyst residue against surface area; 5 ±
phenolic-OH content, * ± aromatic/aliphatic proton ratio, � ± Fe
content. * ± Ti content, ~ ± H/C ratio, ~ ± coke content [289].
466 E. Furimsky, F.E. Massoth / Catalysis Today 52 (1999) 381±495
Page 87
the H/C ratio. It is noted that in this region, a small
change in surface area and/or pore volume is accom-
panied by a sharp decline in activity.
Information on the deactivating effect of Ti is
limited. According to the results published by Lynch
[279], Ti when added to the NiMo/Al2O3 catalyst from
hydrogenated creosote oil had only a minor adverse
effect on the activity compared with the same catalyst
which was deactivated in creosote oil without Ti
present (Fig. 131). In this case, coke was mainly
responsible for the loss of activity. However, surface
area and pore volume were lower for the Ti deposited
catalyst. Results in Table 35[292] suggest that at about
0.8% of metals, Ti and Fe had a similar deactivating
effect on HDS, but Fe was less detrimental to HYD
activity. A signi®cant difference was observed in
cracking activities, where Ti increased while Fe
decreased the activity. Kovach et al. [278] impreg-
nated a CoMo/Al2O3 catalyst with water soluble salts,
such as chlorides and nitrates to different levels of
various metals, which were then roasted to obtain the
corresponding oxides, and subsequently presul®ded
prior to their use in hydroprocessing a coal- derived
feed. The effect of metal loading on relative activities
is shown in Fig. 132. These results suggest no deac-
tivating effect of Ti, whereas Fe decreased activity
with metal loading. In addition, these authors exposed
the catalyst to several minerals by suspending them in
a hydrogen donor solvent before the hydroprocessing
experiments. These results are shown in Fig. 133.
Initially, Ti-containing species had little effect; how-
ever, after a certain time on stream, the activity
decreased rapidly. In the case of Fe, a rapid decrease
in the relative activity began at the start of the experi-
ment before reaching a steady state at about 30% of
the original activity. An interesting observation was
made by Bogdanor and Rase [294]. These authors
attrited outer layers of a spent NiMo/Al2O3 catalyst
and performed activity tests on both spent catalyst and
attrited material. The activity of the latter was sig-
ni®cantly lower, presumably because of the presence
of large quantities of Fe. It was further concluded that
Fig. 131. Model compounds conversion on fresh regenerated, spent (#94966), regenerated and Ti doped catalysts [279].
E. Furimsky, F.E. Massoth / Catalysis Today 52 (1999) 381±495 467
Page 88
Fe was associated with the part of the coke which was
the most dif®cult to oxidize during regeneration.
5.3. Deactivation by other deposits
Analyses of spent catalysts from various hydropro-
cessing operations indicate the presence of other
metals in the deposits. The content and type of metals
vary from feed to feed. The feeds derived from con-
ventional crudes may be contaminated by alkalis if the
crude was not properly desalted prior to its processing.
This might be case for the spent CoMo/Al2O3 catalyst
from HDS of an atmospheric residue having a high
content of NaCl [222]. Relatively high content of Na
was found in spent catalysts used for upgrading coal-
derived feeds [295]. Cable et al. [61] have determined
the depth pro®le in an aged catalyst used for upgrading
a coal-derived feed. As the results in Fig. 134 show,
the presence of Ca and Mg was con®rmed. Compared
with Fe and Ti, Ca and Mg accumulated on the
exterior of the particles. The high content of Ti
resulted from its higher content in the feed compared
with Fe. The coal ash could be the only source of Ca
and Mg. The presence of Ca and Mg, in addition to Fe,
Ti and Na in the spent catalyst from hydroprocessing
of a coal-derived feed, was also con®rmed by Kovach
Fig. 132. Relative HYD activity vs. metal oxides on catalyst [278]. Fig. 133. Relative HYD activities vs. content of minerals on
catalyst [278].
Fig. 134. Depth profile for aged catalyst [61].
468 E. Furimsky, F.E. Massoth / Catalysis Today 52 (1999) 381±495
Page 89
et al. [278] and Stanulonis et al. [285]. Holloway et al.
[296] reported a spatial correlation between alkali
metals and Si, indicating the presence of alkali sili-
cates. One report indicates the presence of Cr and Zn
in the spent catalyst from coal liquefaction [285].
Berebi et al. [297] have analyzed a series of spent
catalysts from hydroprocessing light feeds and con-
®rmed the presence of arsenic, whereas Thakur et al.
[289] found boron.
The amount of metals which end up in the deposit
on the catalyst can be in¯uenced by the feed prepara-
tion. In the case of coal, the level of its de-ashing is
important. Heavy crudes derived from tar sands are
usually contaminated by clay-like species originating
from the sand. Also, a caustic agent is added during
the separation of the tar from the sand. Part of this
agent enters the organic phase. Both clay-like species
and Na from the caustic agent affect the catalyst
performance during upgrading, in addition to adverse
effects caused by metals in the organic phase. In some
cases, silicon type antifoaming agents are added to the
crude before distillation [298]. Part of this agent may
end up in the distillate and affect catalyst performance
during subsequent upgrading. Feeds derived from oil
shale may also be contaminated by metal elements
originating from the shale.
5.3.1. Effect of other metals on catalyst activity
The alkalis are the most common metals found on
spent hydroprocessing catalysts, aside from the major
metals such as V, Ni, Ti and Fe. Their deactivating
effect has been studied to a much lesser extent than
that of the major metals. As the results in Fig. 134
show, Ca and Mg tend to accumulate on the external
surfaces. Similar information on the other alkalis is
not available. Nevertheless, the presence of alkalis in
the feeds should not be underestimated. Yoshimura et
al. [273,299] have established the order of deactiva-
tion as follows:
V > Fe > Na > Mg > Ni for hydrogenation
Na� Mg > Ni > Fe for hydrocracking
The detrimental effect of alkalis on hydrocracking
is not surprising in view of the importance of acidic
sites on the catalyst. Thermodynamic analyses con-
ducted by these authors suggested a possibility of the
formation of double oxides between the oxides of Mo
and Na, and Mg and Ca upon regeneration. This may
lead to irreversible structural changes in the catalyst
and lowering of the activity. The results in
Table 35[292] suggest that Ca enhanced cracking
activity but had a signi®cant deactivating effect on
HDS, HDO and hydrogenation activities. Based on the
results in Fig. 135 [278], the following order in cat-
alyst deactivation was established at about 5% metal
loading:
Na > Ca > Mg � Fe
However, when the minerals were impregnated on the
catalyst, this order was changed (Fig. 133).
Other possible mineral species in the feeds are
clays, such as silicates and aluminosilicates, usually
present in heavy feeds derived from tar sands.
Figs. 132 and 133 [278] show a loss in hydrogenation
activity when such species are present in the feed. This
is in an agreement with the results in Table 35, which
indicate loss of hydrogenation activity on the deposi-
tion of SiO2 on the catalyst. At the same time, cracking
activity was signi®cantly enhanced and HDS activity
remained unaffected. Clay-like materials are expected
to deposit on the front of the ®xed bed of the catalyst.
This may lead to the formation of a crust and ulti-
mately to the malfunctioning of the bed due to increas-
ing the pressure drop. Boron is a common element in
coals and is expected in coal-derived feeds. As the
Fig. 135. Summary of trends for intraparticle Mo/Al; Ni/Al and
Mo/Ni profiles (in Ni{Mo}/Al max.) for different catalyst
treatments [294].
E. Furimsky, F.E. Massoth / Catalysis Today 52 (1999) 381±495 469
Page 90
results of Table 35 show, boron at certain levels
affected hydrogenation activity but enhanced the
HDS and cracking activities.
A rather unique case represents catalyst deactiva-
tion by silica gel, which is formed from silicone oil
used during hydroprocessing of a coker naphtha [300].
Part of the silicone oil, which is added to the coker unit
to suppress foaming, ends up in the naphtha. During
hydroprocessing of the naphtha, silicone oil trans-
forms into modi®ed silica gels, which adsorb on the
catalyst surface. This leads to an irreversible loss of
activity. In another case, caustic is added to the water
during the hot water separation of bitumen from tar
sands. Part of the caustic ends up in the bitumen and
causes catalyst deactivation during the subsequent
upgrading step [298].
It was suggested by Rase [301] that several other
elements, notably lead and arsenic can poison hydro-
processing catalysts. Apparently, poisoning with these
elements is irreversible and the contaminated catalyst
cannot be regenerated for reuse.
6. Deactivation due to change in catalyststructure
The stability of the active phase is essential for
maintaining desirable lifetime of the catalyst. In this
regard, temperature appears to be the most important
parameter. Changes in catalyst structure are very slow
at temperatures used during hydroprocessing opera-
tions. However, in some cases, the catalyst remains in
operation for a long period of time, sometimes as
much as several years. Although temperatures may be
relatively low, prolonged exposure can lead to struc-
tural changes, which have an adverse effect on the
catalyst activity. These changes are for the most part
irreversible, causing permanent loss of the activity.
This may include segregation of the active phase,
followed by the diffusion of active metals to the
support and/or recrystallization. When metals are
present in the feed, they can interact with the promo-
ters in the active phase, in addition to the deactivating
effects discussed earlier.
The deactivation of CoMo/Al2O3 and NiMo/Al2O3
catalysts from upgrading of coal liquids was attributed
to the gradual conversion of a more active type II
Co(Ni)MoS phase into the type I Co/NiMoS phase
[147]. The former consists of multilayer slabs of MoS2
with Co/Ni at its edges, while type I phase consists
predominantly of the monolayer slabs. The higher
activity of the type II phase was attributed to the
decreasing interaction between the support and
MoS2 in multilayer slabs compared with that between
the support and monolayer slabs. This increases the
amount of edges in the MoS2 crystallites, which are
believed to be the active sites. The lack of the multi-
layer slabs on spent catalysts was attributed to the
preferential removal of sulfur from the multilayers by
hydrogenation [147]. Yueqin et al. [302] measured the
stack density (number of MoS2 sheets per 1000 nm2),
length and number of slabs in fresh and spent NiMo/
Al2O3 catalysts by TEM. Compared to the fresh
catalyst, the spent catalyst showed a decrease in the
stack density and an increase in the average slab
length, while the layer thickness increased only
slightly.
Cable et al. [292] used ESCA to determine the state
of the active metals in aged catalysts which were
regenerated. The technique can determine the ratio
of the active metal to Al in the fresh and aged-
regenerated catalysts. In the case of Mo, the Mo/Al
ratio is an indication of the MoS2 dispersion. The
values of the experimental Mo/Al ratios are compared
in Table 41 with the theoretical monolayer values
[303]. The relative ratio of 0.85 for the fresh catalyst
compared with the theoretical 0.92 indicates a high
dispersion of MoS2. The relative values for the aged-
regenerated catalysts declined to 0.74 after 25 days.
This is a rather small change to account for the loss of
activity (Fig. 127). Because a signi®cant three-dimen-
sional growth of the Mo phase has not occurred, the
deactivation may be ascribed to lateral growth of the
Mo phase with attendant loss of active edge sites, in
agreement with other studies [304,305]. The ESCA
Table 41
ESCA results on aged±regenerated catalystsa [301]
Ratio Fresh catalyst Aged±regenerated catalyst
1 day 9 days 25 days
Mo/Al 0.78 (0.92) 0.87 (0.94) 0.77 (1.02) 0.87 (1.17)
Co/Al 0.19 0.11 0.07 0.10
Co/Mo 0.24 0.13 0.07 0.10
a Values in parenthesis are calculated for monolayer dispersion
of Mo.
470 E. Furimsky, F.E. Massoth / Catalysis Today 52 (1999) 381±495
Page 91
results showed that the Co/Mo ratio decreased sharply
after one day and then more gradually with time on
stream. This can affect the activity of the catalyst,
since it is the Co associated with Mo phase, which
facilitates the activity. The Co/Mo ratio for the fresh
catalyst was less than one-half of the theoretical value
of 0.58 Table 41. This means that part of the Co is not
in the Co±Mo±S phase, but is most likely residing in
the support. A similar decrease in the Ni/W ratio
accompanied by a lateral growth of the WS2 crystal-
lites was ascribed to the cause of deactivation in a
study published by Makishima et al. [305].
Aged NiMo/Al2O3 catalysts used for the upgrading
of coal-derived feeds containing different amounts of
preasphaltenes were evaluated by Matsubayashi et al.
[306] using EXAFS and XPS. Catalyst samples were
taken from the inlet, middle and exit of the ®xed bed.
The decomposition of the catalytically active Ni-Mo-S
phase was observed in the samples taken from the inlet
of the bed. This decomposition was enhanced when
high preasphaltene feeds were hydroprocessed.
Apparently, polar groups in the preasphaltene, i.e.,
±OH or ±NH2, occupied some of the sulfur vacancies
at the edge of the MoS2 slabs.
Such decomposition was not observed in the sam-
ples taken from the exit of the bed, because at this
point all the preasphaltenes in the feed were already
converted. However, at the exit of the bed, the catalyst
was deactivated due to agglomeration of MoS2 crys-
tallites. This was attributed to higher temperatures
caused by exothermic hydrogenation reactions.
Yoshimura et al. [299,307] evaluated an aged
CoMo/Al2O3 catalyst used in a commercial operation
for about one year and the corresponding fresh catalyst
by EXAFS. They observed a signi®cant enhancement
of Mo±S and Mo±Mo coordinations, indicating an
increase in the size of the basal plane of the MoS2
crystallites. This would be consistent with the lateral
growth of the MoS2 crystals reported by Cable et al.
[292]. On regeneration and subsequent sul®dation, the
MoS2 crystallites were redispersed, but the original
dispersion was not achieved. This was attributed to the
segregation of Co from the active phase, resulting in
the agglomeration of Co9S8 crystallites during hydro-
processing. Kure et al. [308] have also reported lateral
growth of WS2 crystallites as the cause of deactiva-
tion. However, on regeneration and subsequent sul®-
dation of the spent NiW/Al2O3 catalyst, the
redispersion of the WS2 slabs approached that of
the fresh catalyst. Eijbouts and Inoue [309] noted a
loss in homogeneity of an aged NiMo/Al2O3 catalyst
due to a similar segregation of Ni2S3, resulting in a
decrease in activity of the catalyst. Yoshimura et al.
[299,307] observed an increase in the basal plane size
of WS2, similar to that of MoS2. However, on regen-
eration and subsequent sul®dation, WS2 was redis-
persed to the level of the fresh catalyst. The data
obtained by EXFAS was complemented by the XPS
data shown in Table 42. It is seen that after regenera-
tion of the aged catalysts followed by resul®dation, the
Co/Mo and Ni/W ratio did not return to the original
values. This suggests that the amount of Co/Ni located
around the MoS2/WS2 crystals was less than that of the
fresh sul®ded catalysts. The redispersion of Co rela-
tive to Mo was similar to the redispersion of Ni relative
to W, suggesting that the degree of recovery of the
active phase was similar for both catalysts, inspite of
the higher redispersion of WS2 compared with MoS2.
The sulfur remaining after regeneration is most likely
in the form of Co and Ni sulfates and small amounts of
unoxidized sul®des.
Catalyst samples from the Wilsonville coal lique-
faction facility were characterized by Stohl and Ste-
phens employing ESCA [88]. The results of this study
are shown in Table 43. The catalysts are from two runs
identi®ed as 242 and 246. The other numbers indicate
the amount of the processed feed in lb/lb of catalyst.
Prior to the analysis, the aged catalysts were regen-
erated. The fresh catalyst was subjected to the same
treatment as applied during the regeneration. In addi-
tion, the fresh catalyst was sul®ded and regenerated
(242-PS regenerated). The results of the fresh, regen-
erated fresh, 242-PS and 242-43 catalysts gave the
Table 42
Surface composition of catalysts [307]
Al S Co Mo Co/Mo
CoMo/Al2O3 fresh 100 14.6 3.6 6.5 0.55
Regenerated 100 2.2 3.8 7.9 0.48
Regenerated sulfur 100 15.0 3.6 7.3 0.49
Al S Ni W Ni/W
NiW/Al2O3 fresh 100 21.6 5.0 10.8 0.46
Regenerated 100 3.4 4.3 10.9 0.39
Regenerated sulfur 100 22.5 4.6 11.6 0.40
E. Furimsky, F.E. Massoth / Catalysis Today 52 (1999) 381±495 471
Page 92
same Mo/Al and Ni/Al ratios. This suggests that there
were no measurable changes in the active metals due
to either regeneration procedure or early stages of
processing. However, sample 242±527 showed a
decrease in the Mo/Al ratio and especially in the
Ni/Al ratio. The decrease in the ratios was attributed
to sintering because the quantitative bulk analysis of
Mo and Ni, corrected to a catalyst fresh basis, indi-
cated no loss of metals. Stohl et al. [286] showed that
Fe and Ti deposits on the catalysts did not cause
decreases in either the Mo/Al or Ni/Al ratio. Sample
246±592 showed a Mo/Al ratio comparable to 242-
527, but did not show any sintering of the Ni. Run 246
sample was exposed to signi®cantly lower temperature
(3358C) than run 242 (about 4008C). Moreover, during
the latter, a temperature excursion up to about 4708C,
lasting about 50 min, occurred. This indicates that
sintering of the Ni species is enhanced at higher
temperatures. An ultimate result of the Ni sintering
is the signi®cant decrease in the ratio of Ni/Mo,
suggesting some loss of active phase during the
operation. Stanislaus et al. [310] observed that a
NiMo/Al2O3 catalyst is more sensitive to temperature
compared with a CoMo/Al2O3 catalyst. Using diffuse
re¯ection spectroscopy, Gellerman et al. [311] pro-
posed that Ni may be in the form of an aluminum-
nickel spinel type (NiAl2O4). In this case, the aged
NiMo/Al2O3 catalyst was used in the operation for
about one year. A spinel form of Ni was observed
in a heat-treated sample of a NiMo/Al2O3 catalyst
[310].
Rase et al. [294,301] conducted a detailed study of
the migration of the active metals in 1/16-in. extru-
dates of a NiMo/Al2O3 catalyst aged in a hydropro-
cessing operation. The unit, consisting of four ®xed
beds in series, was operated for one year on a blend of
heavy coker and virgin gas oils. The fresh and aged
catalysts were subjected to the same laboratory treat-
ment, involving sul®ding and activity tests which
lasted between 10 and 15 h. A mixture of cyclohexene
and thiophene was used for the activity testing. The
catalysts were subjected to extensive evaluations using
scanning electron microscopy (SEM) and XPS. A
summary of the SEM results is displayed in
Fig. 135 [294]. It is evident that for the fresh catalyst,
the concentration of both Mo and Ni increased towards
the exterior of the extrudate, giving a ¯at Mo/Ni ratio.
After sul®ding and reacting with the test feed, the
pro®les of Mo and Ni exhibited dramatic changes,
giving a concave Mo/Ni ratio. In the spent catalyst, the
Mo concentration slightly increased towards the inter-
ior and that of Ni showed a pronounced decrease,
giving a convex pro®le for the Mo/Ni ratio. Regenera-
tion at 3808C again changed the Mo and Ni pro®les.
Subsequent exposure to the reaction mixture resulted
in pro®les which approached those of the spent cat-
alyst. The pro®les were further changed by increasing
the temperature of regeneration. These observations
have some implications for the activity of the catalyst.
Thus, it is evident that the optimal Mo/Ni ratio, which
might have been attained in the fresh catalyst, no
longer existed in the aged and/or regenerated catalysts.
However, the temperature used for the sul®dation of
the regenerated catalysts had a signi®cant impact on
the metals pro®les. Apparently, if a proper tempera-
ture is chosen, an optimal metal distribution across the
extrudate can be achieved. V and Fe were also present
in the aged catalysts. The concentrations of these
metals increased signi®cantly towards the exterior.
The results of the SEM analysis complemented the
XPS analysis, which con®rmed agglomeration of Mo
components as another cause of deactivation.
Migration of active metals during hydroprocessing
of coal-derived liquids was reported by Yoshimura et
al. [312]. These authors studied extrudate and pow-
dered forms of NiMo/Al2O3 and CoMo/Al2O3 cata-
lysts having similar contents of Mo and Ni/Co and
similar surface area and pore size distribution. The
XPS results of these catalysts are shown in Table 44.
The migration of the metals in the spent catalysts to
the catalyst exterior is quite evident. The migration of
Mo was more pronounced than that of Ni and Co. The
higher concentrations of S and O on the exterior result,
almost certainly, from the higher content of coke on
the particle exterior.
Table 43
ESCA results of fresh and regenerated catalysts [88]
Catalysts Ni/Al Mo/Al
Fresh 1.0 1.0
Fresh regenerated 1.1 0.9
242-PS regenerated 0.9 1.0
242-43 regenerated 1.0 1.0
242-527 regenerated 0.5 0.8
246-592 regenerated 0.9 0.7
472 E. Furimsky, F.E. Massoth / Catalysis Today 52 (1999) 381±495
Page 93
An extensive modi®cation of the active phase,
leading to decrease in activity, may occur after metals
from the feed are deposited on the catalyst. For
example, according to Ledoux and Hantzer [263], V
atoms can compete with Ni and/or Co on the MoS2
edges and interfere with their promoting effect by
diminishing the electronic transfer from the promoters
to Mo, which according to Harris and Chianelli
[313,314] is the origin of the high activity. A potential
formation of the topotatic structures on the basal
planes of MoS2, leading to a structure resembling
V5S8 and VMo4S8 phases, was proposed as well
[263]. This could block bonding of the Ni atoms
around the small MoS2 crystallites, thus allowing
the growth of larger, less active MoS2 crystallites. It
is not expected that Ni, after deposition on the catalyst
from the feed, will have similar negative effects as V
when a certain level of the deposited Ni is exceeded.
Thus, it was shown earlier that to a certain extent, Ni,
which always accompanies V in the feed, may have
bene®cial effects on the activity. In fact, it was sug-
gested that both V and Ni sul®des are catalytically
active before a critical V � Ni concentration is
reached [245,315]. After this point, Ni and V form
relatively inactive mixed sul®des, such as NiV2S4 and
NiV3S4. Gualda and Kasztelan [274] made a theore-
tical estimate of the amount of V required for a
complete contamination and/or promoter ion substitu-
tion in the MoS2 slabs. They assumed two sizes of
slabs, i.e., 2 and 5 nm. Assuming a 100% dispersion of
V, a complete contamination of MoS2 would be
reached at about 1% loading of V. Yoshimura et al.
[316] observed a signi®cant decrease in the Mo/Al
ratio on the addition of alkalis to Ni(Co)/Al2O3 cat-
alysts due to the growth of the MoS2 crystallites.
The results shown in Fig. 91 represent an extreme
example of catalyst deactivation by metals and coke
[239]. Thus, the amount of deposited metals
(V � Ni � Fe) ranged from about 15% at the exit
to almost 110% of the fresh catalyst at the entrance
of the catalyst bed. The ESCA results con®rmed the
presence of Mo in all samples, suggesting that even in
the most heavily deposited catalyst some Mo is still
available for reaction. The presence of mixed metal
sul®des such as (Vx(Fe,Ni))3ÿxS4 was suggested,
where x represents a small deviation from ideality
resulting from structural defects. Besides MoS2, other
Mo containing species were proposed, i.e., MoO2,
NiMoO4 and MoVS4. Ni was detected as Ni3S2,
NiSO4, NiAl2O4 and NiO.
Thermodynamics indicate the possibility of forma-
tion of several compounds, if other metals deposit on
the catalyst from the feed [299,307]. Signi®cant mod-
i®cations of the catalyst surface are predicted, espe-
cially after regeneration of aged catalysts. If Fe is
present, thermodynamics predict the possible forma-
tion of several species, e.g., FeMoO4, FeWO4,
CoFe2O4, NiFe2O4, FeAl2O4 and CoFeO4. The pre-
sence of FeMoO4 in an aged-regenerated catalyst was
indeed experimentally con®rmed by Kim et al. [317].
A probability for the formation of several compounds
was indicated in the presence of alkalis, e.g.,
Na2MoO4, Na2Mo2O7, Na2WO4, Na2W4O13,
Na2W6O19, NaAlO2, Na2Al22O34, CaMoO4, CaWO4,
CaAl4O7, MgAl2O4, MgWO4 and MgMoO4. Arsenic
is a possible contaminant in the feeds. If deposited on
the catalyst, the following compounds can be formed:
AsMoO4, Co3As2O8 and AlAsO4. There is virtually no
information on the stability, activity and behavior of
these compounds under hydroprocessing conditions.
Table 44
Surface composition of fresh and spent catalysts (relative intensities of atomic ratio to Al) [312]
Catalyst Al C O S Ni Co Mo Ni/Mo Co/Mo
NiMo/Al2O3
Fresh, pw 1 0.32 2.49 0.20 0.06 ± 0.09 0.73 ±
Spent, pw 1 0.84 2.40 0.17 0.06 ± 0.08 0.71 ±
Spent, ex 4.46 5.02 0.71 0.11 ± 0.27 0.40 ±
CoMo/Al2O3
Fresh, pw 1 0.38 2.38 0.20 ± 0.06 0.08 ± 0.70
Spent, pw 1 1.01 2.39 0.18 ± 0.06 0.09 ± 0.68
Spent, ex 1 4.10 3.08 0.41 ± 0.09 0.20 ± 0.42
pw: Powder form; ex: Extrudate.
E. Furimsky, F.E. Massoth / Catalysis Today 52 (1999) 381±495 473
Page 94
Of particular importance is the release of Mo/Wand/or
Co/Ni from these compounds during sul®ding. The
amount of active phase would be decreased if these
metals remain bound in the compounds having either
low or no activity.
Residual sulfur as sulfates in the aged-regenerated
catalysts can also modify the activity. The most prob-
able sulfates include NiSO4, CoSO4 and Al2(SO4)3.
Fig. 136 shows sulfate formation during regeneration
[318]. The sulfate survives during the subsequent
utilization in the operation. The sulfate ion was also
detected in a spent catalyst withdrawn from the reac-
tor. However, its formation during the operation is not
possible. Therefore, most likely, the sulfate was
formed on the exposure of the spent catalyst to air
while still hot [319,320]. The effect of sulfate on the
performance of the aged-regenerated catalyst is not
well understood. Ramaswamy et al. [321] have
observed a signi®cant increase in the surface acidity
in the aged-regenerated catalyst as determined by NH3
adsorption, when compared with the fresh catalyst.
These authors attributed this observation to the pre-
sence of sulfate. Little difference between the acidity
of the fresh and aged-regenerated catalysts was
observed when the adsorption was performed with
2,6 dimethyl pyridine, suggesting that the Lewis acid-
ity on the catalyst was affected, whereas the Brùnsted
acidity was not. A potential effect of the increased
acidity on coke formation during operation had not
been investigated until the study by Yoshimura et al.
[318] was published. These authors showed that sur-
face acidity can also be modi®ed by some metals in the
feed. Thus, alkalis reduced acidity of the catalysts.
This resulted in a decrease in coke formation. On the
other hand, Fe, Ti and V increased the catalyst acidity,
presumably through the formation of acidic double
oxides with Mo and/or Al. This resulted in an increase
in hydrocracking activity. However, a decrease in
hydrogenation activity enhanced coke formation.
Hydroprocessing of bio-derived feeds is accompa-
nied by the formation of relatively large amounts of
H2O. The effect of H2O on the properties of catalysts
has attracted little attention except for the work by
Laurent and Delmon [55±57]. In an investigation of a
NiMo/Al2O3 catalyst, these authors observed that in
the presence of H2O, the g-Al2O3 was transformed into
boehmite, resulting in a loss of catalyst surface area.
However, the surface area loss was not large enough to
account for all the loss in catalyst activity. XPS
evaluation of catalysts after parallel treatments with
and without H2O con®rmed that in the former case,
part of the Ni was in the form of an oxide and/or
sulfate, whereas the MoS2 phase remained unchanged.
This is consistent with loss of promotor activity. In
particular, it is believed that part of the Ni which
decorates the MoS2 is particularly sensitive to oxida-
tion. The Ni oxide formed will be converted to Ni
aluminate and become unavailable for promotion. It
was proposed that Ni sulfate may form a protective
layer above the sul®de phase [322,323]. It may be
more dif®cult to maintain the required level of sul®-
dation of the active phase in the presence of large
quantities of H2O. The initial loss of sulfur during the
HDO of THF in the presence of a CoMo/Al2O3
catalyst (Fig. 137) was attributed to the loss of incom-
pletely coordinated sulfur in the CoMoS phase [79].
The loss of sulfur coincided with a rapid initial
Fig. 136. XPS spectra of S2p for the fresh and spent catalysts: (1)
oxidic; (2) presulfided; (3) spent; (4) spent-degassed; (5) spent-
degassed-regenerated; (5) spent-degassed-regenerated; (6) spent-
degassed-regenerated-presulfided [318].
474 E. Furimsky, F.E. Massoth / Catalysis Today 52 (1999) 381±495
Page 95
decrease in the conversion, as well as a rapid coke
build up.
7. Remedies
The impact of catalyst deactivation during hydro
processing can be minimized by an optimal combina-
tion of catalyst properties, feed properties and type of
reactor. In the case of light feeds derived from con-
ventional crudes, the choice of processing conditions
is quite straightforward. However, this becomes more
complex with increasing average molecular weight or
boiling range of the feed. For this purposes, a new
generation of catalysts has been developed. Also,
several different types of reactors available commer-
cially enable processing high-asphaltenes and high-
metals feeds. A modi®cation of the catalyst may be
needed to process non-traditional feeds. Changes in
fuel speci®cations to comply with new environmental
regulations require continuous attention to develop-
ment of new catalysts possessing higher activity and
selectivity, as well as resistance to deactivation.
7.1. Selection of catalysts
As was indicated in the previous chapters, catalysts
of varying properties exhibit different deactivation
patterns. The traditional HDS catalysts are not suitable
for processing heavier feeds. In this regard, physical
properties, such as pore volume and size distribution,
shape and size of catalyst particles, become perhaps
more important than chemical composition, provided
adequate activity is available. The selection of cata-
lysts and reactors suitable for hydroprocessing various
feeds was recently reviewed in detail by Furimsky
[324].
Fig. 138 shows signi®cant differences in pore size
distribution required for processing a light feed com-
pared with that for processing a heavy feed [325]. In
the latter case, the presence of meso- and macro-
porosity is essential to offset the effects of restrictive
diffusion and to increase the metal storage capacity of
the catalysts, i.e., to increase the catalyst utilization. In
this regard, an important study published by Absi-
Halabi and Stanislaus [326] is noted. It is believed that
for a given feed to a given process, there is an optimal
pore size distribution. Fig. 139 illustrates, that there is
an optimal combination of the catalyst activity, surface
area and pore diameter for a particular feed, giving the
highest activity [92]. This assumes the catalytic activ-
ity (or number of active sites) is proportional to the
surface area, which is not always true for hydropro-
cessing catalysts. An optimal presul®ding procedure
can result in further increase in the activity of hydro-
processing catalysts, as well as an improved metal
foulant distribution throughout the catalyst particle
[327,328]. Moyse et al. [178] investigated a series of
catalysts of a similar chemical composition but vary-
ing in pore size distribution, during hydroprocessing
of two heavy vacuum gas oils and one light gas oil.
The trends shown in Fig. 58 for the heavy feeds differ
markedly from those for the light feed. A macroporous
bimodal catalyst performed better than a microporous
unimodal catalyst, with the former accumulating
much more coke but at the same time maintaining
its activity for a much longer period of time than the
unimodal catalyst [329,330]. These results show that a
universal multifunctional catalyst possessing a high
activity for all functionalities (e.g., HDS, HDN, HDM
and asphaltene conversion), suitable for hydroproces-
sing of a wide range of feeds, still needs to be
developed. Thus, the design of the most suitable
physical properties of the catalyst for a particular feed
requires expert advice from those involved in catalyst
development.
In the case of heavy feeds, special attention has to
be paid to the shape and size of the catalyst particles.
This can be crucial for achieving an ef®cient catalyst
utilization and a smooth reactor performance. The
operation may be affected if the size and shape of
Fig. 137. Sulfur content of catalyst vs. time on stream [79].
E. Furimsky, F.E. Massoth / Catalysis Today 52 (1999) 381±495 475
Page 96
the catalyst particles are not matched properly with the
feed properties and reactor. Various shaped hydropro-
cessing catalysts discussed in the literature were
reviewed by Pereira et al. [331]. Traditional shapes,
such as pellets and cylinders are suitable for hydro-
processing light feeds; however, for heavy feeds, the
selection of the size and shape is more complex. In this
case, small particles are more suitable because they
present a shorter path to the catalyst interior. This
ensures a more ef®cient utilization of the active sur-
face. However, if used in ®xed beds, small particles
may affect the operation due to the occurrence of
unwanted pressure drops. Ring-shaped particles are
used when an increased voidage in the catalyst bed is
required. Polylobe and minilith particles were devel-
oped with the aim of improving the accessibility to the
catalyst interior [331].
Cooper et al. [332] compared relative HDS activ-
ities of the different sizes and shapes of catalysts. In
this case, the catalyst particle size (Lp) was de®ned as
Lp � Vp
Sp
(7.1)
Fig. 138. Effect of catalyst pore size distribution on hydroprocessing [325].
Fig. 139. Effect of pore diameter on reaction rate [92].
476 E. Furimsky, F.E. Massoth / Catalysis Today 52 (1999) 381±495
Page 97
where Vp and Sp are the particle volume and external
surface area, respectively. The results of these mea-
surements are shown in Table 45. The trend of
increasing activities correlates well with decreasing
Vp/Sp.The authors developed a computer model to
calculate the effect of the size and shape on the
pressure drop. For these calculations, particle size
(Dp) was de®ned by
Dp � 6Vp=Sp
�s
(7.2)
where �s is the shape factor de®ned as the ratio of the
surface area of a sphere of equal volume to the surface
area of the particle. DeBruijn et al. [333] found that Lp
correlated with the Thiele modulus (�L) de®ned as:
�L � LpkiC
nÿ1
Deff
� �0:5
(7.3)
where ki is the intrinsic rate constant, C the concen-
tration of the reactant, n the reaction order and Deff is
the effective diffusivity.
7.2. Selection of reactors
Three types of hydroprocessing reactors are avail-
able commercially, i.e., ®xed bed, moving bed and
ebullated bed. It is unlikely that a smooth and con-
tinuous performance can be achieved with the same
catalyst in any of these reactors. In this regard, phy-
sical properties of the catalyst particles are the deter-
mining factor in ®nding the most optimal match of the
catalyst with the reactor.
Fixed bed reactors have been traditionally used for
hydroprocessing light feeds. Performance of these
reactors can be increased by loading more catalyst
per unit volume of reactor, so called dense loading
[334,335]. For example, the relative HDS activity of a
®xed bed prepared by dense loading of spheres,
cylinders and quadrolobe particles was increased from
5 to 8%, 10 to 15% and 20 to 25%, respectively,
compared with sock loading. In the case of sock
loading, particles lay against one another, form
bridges and maintain random patterns as the result
of the faster addition of the catalyst to the reactor
compared to the dense loading. This leads to creation
of oversized voids. If some forces are created on such a
bed, e.g., pressure drop, the bridges may collapse,
resulting in the shrinkage of the catalyst bed. This
increases the danger of channeling and malperfor-
mance of the bed. A negative effect of dense loading
is an increased pressure drop at start of run. For a given
®xed bed, there is a limit to the maximum pressure
drop at which the reactor can operate. Thus, an
optimal combination of bed void and activity per
reactor volume is needed, for which the pressure drop
is within acceptable limits. Fig. 140 shows that the
pressure drop can be controlled by selecting the proper
size and shape of the catalyst particles [336]. An
example of the effect of the shape and size of the
particles on the fraction of bed void and catalyst
surface area per reactor volume is given in Table 46
[337]. It is important that a comparison of the bed
performance, including catalyst activity, for different
shapes and sizes is made on an equal pressure drop
basis.
The occurrence of pressure drop can be diminished
by pretreatment of the feed. Conventional crudes have
been traditionally desalted to remove water soluble
alkalis. Sikonia et al. [338] reported the use of auto-
Table 45
Effect of particle size and shape on HDS activity [332]
Shape Code Dimensions (mm) Vp/Sp (mm) Activitya
Cylinder 1/32 0.83 OD � 3.7 length 0.189 9.7
Cylinder 1/20 1.2 OD � 5.0 0.268 7.9
Cylinder 1/16 1.55 OD � 5.0 0.345 5.7
Ring 1/16 1.62 OD � 0.64 ID � 4.8 0.233 8.7
Ellipse 1/16 1.9 � 1.0 � 5.0 0.262 8.4
3-lobe 1/12 Diameter � 1.0; length � 5.0 0.295 8.2
Crushed ± 0.25±0.45 ÿ0.04 14.0
a HDS activity on catalyst weight basis (heavy gas oil, 622 K, 7 MPa)
E. Furimsky, F.E. Massoth / Catalysis Today 52 (1999) 381±495 477
Page 98
matic back-wash ®lters to remove atmospheric resi-
dues. In any case, metals and clays present in feeds are
the main cause of pressure drop occurring during the
operation. It is apparent that little of the organically
bound metals can be removed during desalting and/or
®ltering. This problem can be partly overcome by
using guard reactors containing macroporous material
having a high metal storage capacity. In this case,
HDM of the feed would be the primary objective. The
study published by van Zijl Langhout et al. [156,339]
suggests that feeds containing less than 100 ppm of
metals can be processed by a ®xed-bed reactor. They
suggested that a narrow pore catalyst can be used for a
feed containing less than 25 ppm of metals. For feeds
containing between 25 and 50 ppm of metals, a dual
catalyst system may be required, i.e., the front end
catalyst should possess a high metals tolerance,
whereas the tail-end a high catalytic activity. For
metals content between 50 and 100 ppm, a triple
catalyst system with the front end HDM catalyst
having a high metal storage capacity may be needed.
The features of the quick catalyst replacement reactor
(QCR) designed for this purpose enable quick and
complete catalyst unloading.
Beaton et al. [340] concluded that the history of
commercial ®xed-bed units with vacuum residues was
not suf®cient to con®rm good operability; whereas, for
atmospheric residues and light feeds the units operate
reliably. A major concern was the excessive number of
catalyst replacements required and tight schedules
involved when using multiple reactor trains, especially
for poor quality feeds. These problems were overcome
by developing moving bed and ebullated bed reactors.
In this case, the addition and withdrawal of catalyst is
carried out during the operation avoding any inter-
ruption.
The `bunker reactor' developed by Shell [339] is the
best known moving-bed reactor. In this trickle-¯ow
system, the catalyst moves downwards; however, its
movement is slow compared with the linear velocity of
the feed. Catalyst addition and withdrawal are per-
formed via sluice systems at the top and at the bottom
of the reactor. The advantage of the bunker reactor is
that the top layer of the moving bed consists of fresh
catalyst. Thus, metals and salts deposited on the top of
the bed move downwards with the catalyst and are
removed at the bottom. The tolerance to metals and
other contaminants is, therefore, much greater than in
a ®xed-bed reactor. One commercial unit was
designed for 4000 tons/day of a straight run vacuum
residue containing about 760 ppm metals [341]. The
unit consists of two parallel strings of ®ve reactors
each. The ®rst three reactors of each string are bunker
reactors ®lled with HDM catalysts. The last two
reactors of each string are of a ®xed-bed type, contain-
ing HDS and hydrocracking catalysts. This plant
Fig. 140. Effect of particle shape and size on pressure drop [336].
Table 46
Packed-bed properties of catalyst particles [337]
Description of particlesa Bed void
fraction
Geometric surface area per
reactor volume (cmÿ1)
Minilith (D � 2.54 mm, L/D � 1) 0.52 23
Trilobe (1.3 mm size, L/D � 3) 0.41 30
Cylindrical (D � 1.6 mm, L/D � 3) 0.41 18
Cylindrical (D � 1.3 mm, L/D � 3) 0.43 23
a L: Length; D: diameter.
478 E. Furimsky, F.E. Massoth / Catalysis Today 52 (1999) 381±495
Page 99
demonstrates the potential of combining ®xed-bed
reactors with moving bed reactors to achieve a high
performance on feeds dif®cult to processs.
The ebullated-bed reactor represents the culmina-
tion in the development of hydroprocessing reactors. It
was successfully tested on vacuum residues and heavy
oils as well as for coprocessing mixtures of coals and
heavy feeds. These reactors have a provision for
periodic addition and withdrawal of catalyst without
interrupting the operation. The bed design ensures
ample free space between particles, allowing
entrained solids to pass through the bed without
accumulation, plugging or increased pressure drop.
Thus, the feed and H2 enter at the bottom and move
upwards through a distributor plate at suf®cient velo-
city to expand the catalyst above the grid into a
random and turbulent motion. This is achieved by
controlling the speed of the recycle oil pump. These
conditions are ideal for utilization of catalyst particles
having a diameter less than 1 mm (e.g., 1/32-in.
extrudates), and results in a considerable increase in
reaction rate due to signi®cantly diminished diffusion
limitations. The process is ¯exible and can operate
either in a high conversion or low conversion mode,
i.e., for hydrocracking and HDS, respectively. The
most established processes employing ebullated bed
reactors include the LC-Fining process licensed by
Lummus [340,341], the H-Oil process licensed by
Hydrocarbon Research Inc. (HRI) [342,343] and the
Texaco process [344,345]. Dozens of commercial
ebullated-bed reactors have been operated in various
parts of the world. Both LC-Fining and H-Oil reactors
can be used in a multistage mode. Usually, three
reactors are used in series. The ®rst is for HDM,
whereas the second and third are for HDS and/or
hydrocracking.
7.3. Multiple catalyst beds
Trends in re®ning industry indicate on a growing
use of the graded catalyst systems consisting of multi-
ple beds [346,347]. In this case, the ®rst bed provides
HDM activity, the second some HDM but signi®cant
HDS and the third is responsible for hydrocracking as
well as HDS and HDN. It is obvious that pore size of
the catalyst will decrease towards the second and third
bed. Also, each bed may require different chemical
composition of the catalyst. Thus, selection of the
catalyst has to consider change in the feed composi-
tion from bed to bed. Koyama et al. [348] reported the
results from hydroprocessing of a residue using two
reactors in series, containing two catalyst beds each.
The ®rst bed consisted of an HDM catalyst and
accounted for about 30% of the total catalyst volume.
The remaining three beds consisted of HDS catalysts.
A multiple-catalyst bed system may be required also
for a metal free feed if a high hydrocracking conver-
sion is the primary objective [339]. In this case, a
catalyst on top of a zeolite-based hydroprocessing
catalyst furnishes the necessary HDS and HDN activ-
ities. The latter is required to reduce the level of N-
containing compounds to prevent poisoning of crack-
ing sites.
The production of low aromatic fuels requires
multiple-bed systems. The ¯owsheet of the process
developed by Haldor Topsoe A/S [349] is shown in
Fig. 141. In this case, hydrotreating is provided in the
®rst bed comprising a high activity base metal catalyst.
H2S and NH3 produced in the ®rst stage are removed
by stripping. Hydrogenation of aromatics is completed
in the second stage using a sulfur-tolerant noble metal
catalyst. The aromatic hydrogenation topic was
reviewed in detail by Stanislaus and Cooper [350].
7.4. Next generation catalysts
Attempts have been made to develop new hydro-
processing catalysts to improve the performance of the
currently used commercial catalysts. In this regard, at
least two approaches have been used. In one, research
has concentrated on modi®cation of g-Al2O3 supports
or use of other oxides as the support, while using the
same active metals (Co/Ni and Mo/W). In the other
approach, focus has been on modi®cation of the active
phase by adding other metals, such as the platinum
group metals. Hydrogenation catalysts used for the
production of reformulated fuels may require a che-
mical composition which differs signi®cantly from
that of the typical hydroprocessing catalysts. Because
this area of catalyst research is not a primary objective
of this review, only a brief summary of some relevant
studies will be given.
It was shown by Breysse et al. [351] that perfor-
mance of hydroprocessing catalysts can be in¯uenced
by the support. They concluded that a modi®cation
of the support could be one of the approaches for
E. Furimsky, F.E. Massoth / Catalysis Today 52 (1999) 381±495 479
Page 100
Fig
.141.
Tw
o-s
tage
pro
cess
for
die
sel
dea
rom
atiz
atio
n[3
49].
480 E. Furimsky, F.E. Massoth / Catalysis Today 52 (1999) 381±495
Page 101
developing better catalysts. In recent years, this ave-
nue of research has been explored by several research-
ers. Reardon et al. [352] showed that the g-Al2O3
surface can be tailored for ef®cient use of supported
MoS2. Phosphorus is among potential modi®ers of the
g-Al2O3 support that have been investigated. Halachev
et al. [353] showed that the addition of 0.6 wt.% P2O5
increased hydrogenation activity of a NiW/Al2O3
catalyst. These authors stressed the importance of
the conditions used during the preparation of the
catalysts. Chen et al. [354,355] reported an improve-
ment in activity of phosphorus doped CoMo/Al2O3
catalysts for HDS and HDM of an atmospheric gas oil.
As Fig. 142 shows, the HDM rate depends on the Al/P
ratio, i.e., the highest HDM was observed at an Al/P
ratio of about 8. Kemp and Adams showed [356] that
highly ef®cient Co/Mo and Ni/Mo hydroprocessing
catalysts can be prepared in a simple synthesis using
alumina hydrogel or phosphated alumina hydrogel.
The ®nal catalysts had extremely high surface area.
Also, various pore structures could be attained. Chen
and Tsai [357,358] investigated effects of the addition
of boron to CoMo/Al2O3 and NiMo/Al2O3 catalysts.
As the results in Fig. 143 show, the addition of boron
signi®cantly improved HDS activity. The HDS opti-
mum was achieved at a B2O3 content of about 4 wt.%,
which corresponds to an Al/B ratio of about 10.
Hydrogenation activity of the same catalysts was
improved as well. The addition of ¯uoride to an
NiW/Al2O3 catalyst resulted in a marked improve-
ment in HDN activity [359,360]. Ramos-Galvan et al.
[361] compared the NiMo catalysts supported on Al-
and Ti-pillared clays with a conventional NiMo/Al2O3
catalyst during the hydroprocessing of residual oils.
The activity (HDS and hydrocracking) of the NiMo/
Ti-pillared clay was signi®cantly higher than that of
the NiMo/Al2O3 catalyst. An NiMo/Al2O3 catalyst
supported on ®brillar alumina showed both high
activity for HDM and much longer lifetime compared
with a commercial NiMo/Al2O3 catalyst [362]. Other
potential supports include silica-ceria [363] and sili-
con-amine intercalated titanates [364]. Zeolites and
silica-alumina supports were also evaluated [365,366].
In this regard, the method of the addition of the active
metals to the support can be crucial. Thus, zeolite-
supported catalysts prepared by an ion exchange with
the Mo and Mo-Ni sul®de clusters were much more
active for HDS than a conventional NiMo/Al2O3
catalyst [367]. Nomura et al. [368] showed that the
activity and crushing strength of catalysts can be
improved by blending g-Al2O3 with a sepiolite sup-
port. This is signi®cant for HDM catalysts which need
to posses a suf®cient macroporosity
Another approach to develop novel hydroproces-
sing catalysts is based on the study published by
Pecoraro and Chianelli [369] who showed that some
unsupported noble metal sul®des exhibit signi®cantly
higher HDS activity than MoS2. Recent developments
in this ®eld, including supported transition metal
sul®des, as well as their combination with Mo, were
reviewed in detail by Vasudevan and Fierro [370] and
Topsoe et al. [14]. More recently, Raje et al. [371]
observed that RuS2 and RhS2 were more active than
MoS2 during simultaneous HDS, HDN and HDO of a
coal-derived naphtha. However, to be cost competitive
with the commercial Co(Ni)/Mo(W) catalysts, the
Fig. 142. Effect of Al/P ratio on metal removal [355]. Fig. 143. Effect of boron content on sulfur removal [357].
E. Furimsky, F.E. Massoth / Catalysis Today 52 (1999) 381±495 481
Page 102
content of the noble metal in the catalyst would have
to be less than 1%. Also, to achieve a desirable sulfur
tolerance, supports having a higher acidity than g-
Al2O3 are required [372]. Raje et al. [373] have
compared a Ru/zeolite catalyst containing 0.77%
Ru with a commercial CoMo/Al2O3 catalyst during
hydroprocessing of a coal-derived naphtha between
275 and 4008C. The former was much more active for
HDN, whereas the commercial catalyst exhibited
better HDS activity. A platinum (0.95%) supported
on an amorphous SiO2±Al2O3 and a zeolite exhibited
higher HDS and HYD activities than commercial
CoMo/Al2O3 and NiMo/Al2O3 catalysts during hydro
processing of a diesel fuel and HDS of dibenzothio-
phene [374,375]. A strong dependence of the catalyst
activity on the type of support was reported by Song
and Schmitz [376]. In this case, Pd and Pt supported on
zeolites were compared with the corresponding cata-
lysts supported on g-Al2O3 during low temperature
(2008C) hydrogenation of naphthalene. The former
were more active and more sulfur tolerant. Similar
observation was made by Corma et al. [377] during
low temperature hydrogenation of a gas oil. In view of
these results, the potential for further improvement in
the performance of commercial hydroprocessing cat-
alysts consisting of noble metals and acidic supports is
believed to be promising. In fact, noble metal-based
catalysts have been used commercially for producing
low-aromatic diesel fuels. In this case, the operation at
low temperatures, where thermodynamic limitations
are not severe, is advantageous [378]. Deep HDS of
the feed is necessary to achieve good catalyst perfor-
mance. It is, however, apparent that progress is being
made in developing sulfur tolerant catalysts enabling
processing the feeds containing up to 1000 ppm of
sulfur [379,380]. Nevertheless, a two stage process
comprising deep HDS in the presence of a suitable
conventional catalyst, followed by a low temperature
hydrogenation in the presence of a noble metal based
catalyst has been widely adapted for these purposes
[381].
It is anticipated that new metal compounds posses-
sing a high catalytic activity for hydroprocessing
reactions will be identi®ed. In this regard, metal-
containing carbides, nitrides, oxynitrides and oxycar-
bonitrides have attracted attention [382±386]. It was
shown by Oyama et al. [382,383] that Mo2C, WC and
Mo2N were comparable in their activity for HDN of
quinoline to a commercial sul®ded NiMo/Al2O3,
whereas the latter was more active for the HDS of
dibenzothiophene. A VN catalyst exhibited a good
activity for the HDO of benzofuran. An examination
of the spent catalysts con®rmed their resistance to
sulfur, as the content of sulfur was well below that
required for the presence of MoS2. Subsequently,
Sajkowski and Oyama [387] compared unsupported
Mo2N and Mo2C/Al2O3 catalysts with commercial
MoS2/Al2O3 and NiMo/Al2O3 catalysts during hydro-
processing of a coal derived gas oil and residue. The
HDN results obtained for the gas oil are shown in
Fig. 144. The Mo2N catalyst was particularly active
for hydroprocessing of the residue. The resistance of
both Mo2C and Mo2N to sul®dation was also con-
®rmed. Mo2C and Mo2N supported on g-Al2O3 were
more hydrogen ef®cient than the corresponding MoS2/
g-Al2O3 catalyst [388]. McCrea et al. [389] observed
that Mo2N and Mo2C supported on Al2O3 were more
active for HDS of thiophene than the corresponding
MoS2/Al2O3. Relative HDS activities from this study,
shown in Table 47 were complemented by O2 and CO
chemisorption data. Park et al. [390] made an attempt
to promote Mo2N with Co and Ni.
Fig. 144. Change of HDN activity of novel catalysts with time on
stream [387].
482 E. Furimsky, F.E. Massoth / Catalysis Today 52 (1999) 381±495
Page 103
However, the addition of Ni and Co to Mo2N had
little promoting effect in contrast with MoS2. Djega-
Mariadassou et al. [391] observed an Mo-oxynitride to
be catalytically active during hydrogenation of propyl
benzene with its activity progressively increasing
during the run. At the end of the run, the composition
of the catalyst approached that of an Mo-oxycarboni-
tride, suggesting that the new structure is more active
than the oxynitride. It is apparent that commercial
catalysts based on metal nitrides and carbides still
need to be developed and their long term performance
under commercial operating conditions has to be
demonstrated.
8. US patent literature on remedies
The patent literature on various aspects of hydro-
processing catalysts is rather extensive. The book
published by Satriana [392] gives descriptive infor-
mation on 225 US patents issued between 1974 and
1981. Preparation of hydroprocessing catalysts
varying in chemical and physical properties is the
predominant part of this collection. Remedies are
addressed in some 15 of these patents. More than
70 additional patents relevant to remedies were
identi®ed by a thorough examination of patents issued
by US Patent of®ce between 1980 and 1997. This
may not be a complete list of patents issued on
these aspects of hydroprocessing catalysts in the
world. Nevertheless, as Satriana [392] states, the
US patent literature is the largest and most com-
prehensive collection of technical information in
the world. An important part of this collection
are patents disclosed in other parts of the world.
Therefore, it is an adequate and perhaps the best
source for identifying trends in the development
of more ef®cient catalytic systems to be applied
for hydroprocessing of various feeds.
Guard beds are among several options used to
alleviate problems with catalyst deactivation. Single
beds of mixed catalysts and/or consisting of several
layers of different catalysts can also be used success-
fully for particular feeds. Multi-bed systems consist-
ing of several beds in the same reactor account for a
large number of patents. For more dif®cult feeds, two
or more reactors in a series can be used to slow down
deactivation and to extent the operation cycle. Novel
reactors, ensuring an improved operation, have been
developed. The development of novel catalysts has
been continuing and in this regard, the patent literature
is quite extensive. However, this topic will not be
included in this patent summary.
8.1. Guard beds
In this case, a guard bed of a suitable solid is
employed above one or more individual beds of
catalyst particles in the same reactor. A separate guard
reactor placed before the catalyst reactor can also be
used. Porous solids, such as activated bauxite or
alumina, are used in the systems disclosed by Wolk
et al. [393,394]. In one case, a signi®cant improve-
ment in hydrocracking conversion of an atmospheric
residue containing 100 ppm of metals is achieved by
passing the feed and H2-rich gas upward through the
®rst bed of alumina having pore diameter in excess of
125 AÊ . Both guard bed and catalyst bed are maintained
under the same processing conditions. Alumina is
employed as the guard material in the processes
patented by Hilbert et al. [395] and Howell [396].
A number of other low cost solids suitable for this
purpose may be available. In the system disclosed by
Hutchings [397], the feed stream is divided into a
number of portions, each of which passes through a
different annular guard bed. After exiting through the
bottom of the guard bed, the feed stream passes
through a lower and much larger catalyst bed. The
guard bed developed by Jones [398] has a provision
for sensing the differential pressure across the bed. In
this system, vapor components are withdrawn from the
reactor chamber above the guard bed at a rate propor-
tional to the differential pressure. The withdrawn
vapor components are reintroduced into a particle-
free void volume below the guard bed and above the
bed of catalyst particles. Fukui et al. [399] disclosed a
two-step process, in which the ®rst bed (guard bed)
Table 47
Relative HDS activities [389]
Catalyst RA
MoS2/Al2O3 1.00
Mo2C/Al2O3 1.41
MoC(1ÿx)/Al2O3 1.04
Mo2N/Al2O3 1.22
E. Furimsky, F.E. Massoth / Catalysis Today 52 (1999) 381±495 483
Page 104
of the process consists of magnesium silicate as a
major component and/or supported on one or more
catalytic metal components selected from the metals
of Groups V-A, VI-A and VIII. With this arrangement,
a signi®cant improvement in the performance of the
second bed (catalyst bed) is achieved. Several patents
cite adsorption process for removal of arsine
[400,401].
8.2. Mixed and layer beds
In the case of mixed beds, the bed consists of a
mixture of two or more catalysts. The invention dis-
closed by Habib et al. [402] comprises a mixture of
two distinctly different catalyst particles in the same
bed. The ®rst catalyst has a high HDN and HDS
activity, whereas the second catalyst is active for
hydrocracking. Both catalysts have the same size
and shape. This arrangement provids surprisingly
good selectivity for liquid products and resistance
to catalyst deactivation. Wolk and Rovesti [393]
reported an improved performance of the bed, metal
removal from the feed in particular, by mixing the
catalyst particles with the activated bauxite and alu-
mina. Another example of a mixed bed comprising
two catalysts of different chemical composition is the
invention disclosed by Ho [403]. An enhanced hydro-
processing conversion is achieved using a ®xed bed of
nonuniformly sized grade of catalyst particles of a
similar chemical composition [404]. In this case, the
graded particles are arranged with the largest particles
in either the upstream or downstream portion of the
bed. In either case, the performance of the graded bed
is better than that of the convectional bed consisting of
the same size particles. The process disclosed by
Bartholdy [405] comprises a physical mixture of high
void and low void catalyst particles mixed in different
amounts and different layers of the ®xed bed of
catalyst.
The system developed by Kukes et al. [406±409]
employs a single bed consisting of a layer of spherical
alumina on the top of the catalyst layer. The former
is pretreated to improve crush strength retention by
impregnating the alumina with either ammonium
or magnesium salts followed by heating at about
4508C. The alumina layer removes V and Ni from
the feed. The performance of the bed is better com-
pared with that without the alumina layer. The
two-layer system patented by Winslow and Sullivan
[410] was developed for hydrocracking of vacuum
gas oil to produce various fuels. The ®rst layer consists
of Ni(Co)MoP/Al2O3 catalysts possessing a high
HDN activity, while the second layer consists of
NiW(Mo)/SiO2-Al2O3-zeolite catalysts. The ®rst
layer catalyst has a relatively large pore size, i.e.,
more than 60 AÊ . The inventors claim that the
layered system increased the catalyst life and had
other advantages.
8.3. Multiple bed systems
The patent literature on multiple beds in the same
reactor is rather extensive. In this case, processing
conditions such as temperature and pressure in the
beds are similar. A dual-bed system patented by Banta
[411] consists of a ®rst large-pore catalyst bed and a
second small-pore catalyst bed of CoMo/Al2O3. In a
similar process, a heavy feed is mixed with a recycle
oil before being contacted with the ®rst bed containing
a larg-pore catalyst [412]. Preferably both catalysts
have a quadrulobal shape. The system disclosed by
Gillespie [413] employs two beds of which the second
bed contains the catalyst having, on a gram equivalent
weight basis, 1.5 times or more of catalytically active
metals and the average effective diameter of 0.75
times or less than that of the ®rst bed catalyst. A large
number of other patents on two-bed systems were
issued [414±420]. The main difference among these
systems are different chemical compositions and phy-
sical properties of the catalysts employed. It is appar-
ent that these reactors were developed to suit
hydroprocessing of the particular feeds. The multi-
bed process patented by Cash [421] has a provision
for withdrawal of vapor between the stages and
replacing it with H2. Such withdrawal and replace-
ment reduces the partial pressure of NH3 and H2S
in the reaction mixture entering the bed succeeding
each interspace, thereby increasing the rate of hydro-
processing reactions. An improvement in the opera-
tion was achieved by removing lighter fractions
which were not heavily hydroprocessed in the ®rst
bed to be hydroprocessed in the second bed in the
absence of heavy components [422]. The process
for converting a gas oil feed to lighter hydrocar-
bon fractions comprises two ®xed beds of a hydro-
cracking catalyst in one reactor [423]. The product
484 E. Furimsky, F.E. Massoth / Catalysis Today 52 (1999) 381±495
Page 105
from the ®rst bed is fractionated to obtain a heavy
fraction which is hydrocracked in the second bed. A
heavy fraction after the fractionation of the second bed
product is recycled to the ®rst bed. For more dif®cult
feeds, three beds are needed to meet the ®nal product
speci®cations [424,425].
8.4. Multi stage systems
In this case, processing conditions and types of
catalysts used in the different stages are signi®cantly
different. Thus, the operation cannot be conducted in
the same reactor. An example of a multi-stage process
is the dewaxing of feeds to decrease the pour point of
the ®nal products. This usually requires two steps,
where in the ®rst step the feed is dewaxed and sub-
sequently hydrotreated. If nitrogen and sulfur are
present in the feed, a hydrotreating step precedes
the dewaxing step to prevent poisoning of the dewax-
ing catalyst, which is usually zeolite based. An exam-
ple of this approach is the patent awarded to Albinson
et al. [426]. Several patents were disclosed on pro-
cesses in which the dewaxing step precedes the hydro-
treating step [427±429]. It is evident that properties of
the feeds are the determining factor in selecting a
suitable combination. In one case, the feed is extracted
by N-methyl-2-pyrrolidone to remove aromatics and
heterorings [430]. The raf®nate is then passed through
a hydrotreating reactor followed by the dewaxing
reactor. The process described by Chen and Degnan
[431] comprises two trickle bed reactors in series
containing a dewaxing catalyst and a hydroprocessing
catalyst in the ®rst and the second reactor, respec-
tively. The dewaxing catalyst is supported on verti-
cally tiered and staggered trays while H2 is
concurrently injected into the catalyst on each of
the trays. A similar arrangement of trays in the second
reactor allows trickling of the liquid while H2 intro-
duced into each tray ¯ows upwardly together with the
light fractions stripped from the liquid stream.
A combination of several reactors is required to
produce ultra clean fuels. A three-stage process
invented by Trachte et al. [432] employs a conven-
tional hydrotreater to remove sulfur and nitrogen in
the ®rst step, followed by further hydrotreating in the
second stage over a noble metal zeolite catalyst. The
ultimate product quality is determined in the last
hydrocracking step. A three-stage process for conver-
sion of a residue to a higher cetane number fuel was
invented by Angevine [433]. In this case, the feed is
demetallized and desulfurized in the ®rst stage in the
presence of a conventional catalyst, followed by
hydrocracking in the second stage over a zeolite based
catalyst. The required speci®cations of the fuel are
attained in the last stage. A three-stage process to
produce low sulfur and low aromatic fuels, disclosed
by Haun et al. [434], employs a conventional HDS
catalyst in the ®rst stage, followed by H2S stripping
from the reactor ef¯uent before the latter enters the
second and third reactors containing sulfur sensitive
noble metal catalysts. Three ®xed-bed reactors in
series are part of the process patented by Melconian
[435]. The operating temperature of each bed is higher
than that of the preceding bed. Once a predetermined
temperature is reached, the third bed is removed from
the system, reactivated or replaced by a fresh catalyst,
and then used as the ®rst bed.
Several dual ®xed-bed reactor processes for con-
version of heavy feeds to products, which require
additional hydrotreating, were disclosed. For example,
the process patented by Wolk et al. [436] has a
provision for removing light fractions from the ef¯u-
ent of the ®rst stage to minimize naphtha concentra-
tion and potentially avoid precipitation of heavy
components in the second reactor. Various modi®ca-
tions of the two-reactors upgrading process were
patented by Nelson and Wray [437] and Hamner et
al. [438±440]. In the former case, a gas oil fraction is
removed from the ef¯uent of the ®rst stage. A two-
reactor and dual-component process [440] employs a
large pore and a small pore catalyst. The feed is
divided into a �5508C and ÿ5508C fractions which
are processed in the separate reactors. A ®xed-bed
hydrotreating reactor which precedes an expanded bed
reactor, are part of the process described by Hagashi
[441]. The process described by Henke and McKinney
[442] is suitable for upgrading heavy oils and residues.
In this case, three ®xed-bed reactors in series are used.
A macroporous NiMo/Al2O3 catalyst used in the ®rst
reactor contains a relatively small amount of active
metals. The amount of active metals increases and H2
pressure decreases towards the third reactor.
It was indicated earlier that problematic feeds can-
not be successfully processed in a ®xed-bed system.
For this purpose, several patents were disclosed
employing more than one ebullated bed reactors in
E. Furimsky, F.E. Massoth / Catalysis Today 52 (1999) 381±495 485
Page 106
a series [443,444], or one ebullated bed reactor in a
series with one or more ®xed bed reactors [445]. The
latter approach is the basis of the process described by
Kunesh [446]. In this case, shale oil is hydrocracked in
the ebullated-bed reactor, followed by hydrotreating in
a ®xed bed reactor under more severe conditions.
After the phase separation, the resulting product has
properties of jet fuels and diesel fuels. In the process
described by Beret et al. [447], a thermal hydrocrack-
ing step, performed in the presence of a coke suppres-
sing agent, precedes hydrocracking step performed in
the ebullated bed reactor.
8.5. Novel systems and reactors
The performance of hydroprocessing units can be
improved by maintaining and/or attaining an ef®cient
contact of the feed with H2 and catalyst. For this
purpose, several ideas were put forward and were
identi®ed among US Patents. For example, Trimble
et al. [448] described a system comprising a packed
bed of a catalyst whose entire volume is ®lled during a
continuous ¯ow of uniformly distributed H2 and feed.
In addition, part of the feed, stripped of the light
fractions, is injected into the bed to increase penetra-
tion in and contact time of the feed with the catalyst. In
the dewaxing process disclosed by Kyan and Oswald
[449], the feed is divided into a lower-boiling stream
and a heavier-boiling stream. The latter is hydro-
cracked in the top bed. The ef¯uent from the top
bed enters an interbed redistributor, where it is com-
bined with the lighter fraction before entering the
dewaxing bed at the bottom. Goebel et al. [450]
patented an apparatus for mixing ¯uids ¯owing down-
ward concurrently. The apparatus can be placed
between two ®xed beds in the same reactor. The
system is suitable particularly for containing tempera-
ture within the acceptable limits by admixing H2. An
improved operation of the reactor can be achieved by
an ef®cient supply of H2. In the multi-bed reactor
described by Harrison et al. [451], the make up H2 is
supplied to the second bed, whereas H2-containing gas
from this bed is used in the ®rst bed. The H2-contain-
ing gas recovered from the ®rst bed is purged and
introduced into the third bed. Temperature control
across the reactor is important to ensure a smooth
operation. In the reactor described by Pool [452], the
feed is split into two streams, one of which is intro-
duced into the ®rst bed and the other into the second
bed to cool the ef¯uent from the ®rst bed. In another
system [453], the H2 quench is introduced concur-
rently into the ef¯uent from dewaxing beds to control
temperature during the hydrotreating step in the last
®xed bed.
Uniform distribution of the feed and H2 is an
important requirement to achieve smooth operation
of catalyst beds. This issue is addressed by a number
of US Patents. For example, the reactor described by
Chou [454] employs a packed bed with redistribution
screens spaced in the bed to prevent channeling.
Plugging can be prevented by placing removable
partition forms and/or permanent interbed baskets
in the bed [455]. This creates gradual transition zones
between the layers of catalyst and increases the open
area available for ¯ow at the inreface of such zones.
An upright multi-bed reactor patented by Wijffels
et al. [456] contains a permeable ®lter between the
beds to prevent carryover of catalyst particles to the
next bed. Den Hartog and Van Vliet [457] developed a
chamber which can be placed between the adjacent
catalyst beds of a multi-bed down¯ow reactor. This
chamber includes a device for injecting additional
liquid and/or gas for controlling temperature, a tray
for receiving liquid and compartments for receiving
gas, a distribution tray comprising passages allowing
liquid and gas to pass downwardly over an adjacent
bed, and guiding channels to direct liquid into a
mixing zone before entering the other bed. A special
feed distributor, comprising an octagonal manifold
with tangential outlet openings, was designed by
McDaniel et al. [458]. It is claimed that the operation
of an expanded bed is improved with this distributor
employed. The separator-distributor system designed
by Smith [459] comprises an upper foraminous wall
allowing gaseous components to escape outwardly
into an upper reactor portion, and a lower distribution
means for receiving liquid and dividing it into several
streams towards the catalyst bed. This device can be
placed between the reactor inlet and catalyst bed.
Systems incorporating multiple-®xed beds in a
vertical stripping tower were described by several
inventors. Such systems are suitable for hydroproces-
sing light feeds, e.g., naphtha. The stripping tower
designed by Harandi [460] has an upper catalytic
contact zone and lower catalytic contact zone. The
light gas stream containing H2, stripped from the feed
486 E. Furimsky, F.E. Massoth / Catalysis Today 52 (1999) 381±495
Page 107
at the top, is introduced into the lower contact zone,
whereas the liquid portion of the feed is introduced to
the upper contact zone. Hydroprocessing occurs in the
upper contact zone by ¯owing the liquid stream and
gas stream countercurrently. A column described by
Yeoman et al. [461] includes distillation trays which
allow accumulation of liquid from a liquid stream and
passage of a vapor stream through the liquid. The
catalyst beds, housed in perforated containers, extend
downwardly from the trays. A portion of the liquid can
bypass the catalyst bed and be directed to the adjacent
catalyst bed, so that higher volumetric ¯ows are
achieved. The tower described by Al-Saigh [462]
employs catalyst beds in the form of removable bas-
kets with a grid at the bottom allowing downwardly
¯ow of the liquid.
For hydroprocessing heavy feeds, continuous mov-
ing multiple-bed systems attracted attention of several
inventors [463±466]. In this case, the catalyst is dis-
posed in an annular-form bed, moving downwardly
through the reaction zone. H2 can be added separately
into the beds so that different H2/liquid ratios can be
attained. Catalyst addition (at the top) and withdrawal
(at the bottom) can be carried out during the operation.
Monticelli [467] disclosed a process which employs
two HDS reactors. The ®rst reactor is suitable for HDS
of the reactive sulfur-containing compounds. In the
second reactor, the feed is subjected to biocatalytic
desulfurization in the presence of the biocatalyst such
as a culture of Rhodococus rhodocrous bacteria or its
active lysate, extract, fraction or subfraction. The
bacteria is capable of catalyzing cleavage of thiophe-
nic rings.
References
[1] P.W. Tamm, H.P. Harnsberger, A.G. Bridge, Ind. Eng.
Chem. Proc. Des. Dev. 20 (1981) 262.
[2] C.H. Bartholomew, Chem. Eng. 12 (1984) 96.
[3] D.S. Thakur, M.G. Thomas, Appl. Catal. 15 (1985) 197.
[4] D.S. Thakur, M.G. Thomas, Ind. Eng. Chem. Prod. Res.
Dev. 23 (1984) 349.
[5] P.G. Menon, J. Mol. Catal. 59 (1990) 207.
[6] M. Absi-Halabi, A. Stanislaus, D.L. Trimm, Appl. Catal. 72
(1991) 193.
[7] G. Gualda, H. Toulhoat, Rev. Inst. Fr. du Petrol. 43 (1988)
567.
[8] F.M. Dautzenberg, M. Frits, J.C. de Deken, ACS Symp.
Series 344, ACS, Washington, DC, p. 233.
[9] J. Wei, in: C.H. Bartholomew, J.B. Butt (Eds.), Catalyst
Deactivation, Elsevier, Amsterdam, 1991.
[10] C.H. Bartholomew, in: M.C. Oballa, S.S. Shih (Eds.),
Catalytic Hydroprocessing of Petroleum and Distillates,
Marcel Dekker, New York, 1994.
[11] P. Grange, Catal. Rev. -Sci. Eng. 21 (1980) 135.
[12] F.E. Massoth, G. Muralidhar, in: H.F. Barry, P.C. Mitchell
(Eds.), Fourth Climax Int. Conf. Chemistry and Uses of
Molybdenum, Climax Molybdenum Co., Ann Arbor, MI,
1982, p. 343.
[13] P. Ratnasamy, S. Sivashanker, Catal. Rev. -Sci. Eng. 22
(1980) 401.
[14] H. Topsoe, B.S. Clausen, F.E. Massoth, in: J. Anderson, M.
Boudart (Eds.), Catalysis, Science and Technology, vol. 11,
Springer, 1996, p. 1.
[15] H. Topsoe, B.S. Clausen, E. Pedersen, Ind. Eng. Chem.
Fund. 25 (1986) 25.
[16] D.L. Trimm, Design of Industrial Catalysts, Elsevier,
Amsterdam, 1980.
[17] G. Poncelet, P. Grange, P. Jacobs (Eds.), Preparation of
Catalysts III, Elsevier, Amsterdam, 1983.
[18] V.J. Lostaglio, J.D. Carruthers, Chem. Eng. Progr. March
1986, p. 46.
[19] D.L. Trimm, A. Stanislaus, Appl. Catal. 21 (1986) 215.
[20] M.J. Girgis, B.C. Gates, Ind. Eng. Chem. Res. 30 (1991)
2021.
[21] E. Furimsky, Erdoel und Kohle 36 (1983) 518.
[22] L.C. Gutberlet, R.J. Bertolacini, Ind. Eng. Chem. Prod. Res.
Dev. 22 (1983) 246.
[23] P. Desikan, C.H. Amberg, Can. J. Chem. 42 (1964) 843.
[24] F.E. Massoth, C.L. Kibby, J. Catal. 47 (1977) 300.
[25] J.M.J.G. Lipsch, G.C.A. Schuit, J. Catal. 15 (1969) 179.
[26] H.C. Lee, J.B. Butt, J. Catal. 49 (1977) 320.
[27] C.N. Satterfield, M. Modell, J.A. Wilkens, Ind. Eng. Chem.
Proc. Des. Dev. 19 (1980) 154.
[28] C.N. Satterfield, M. Model, J.F. Mayer, AIChE J. 21 (1975)
1100.
[29] N. Topsùe, H. Topsùe, F.E. Massoth, J. Catal. 119 (1989)
252.
[30] M. Lacroix, C. Dumonteil, M. Breysse, Am. Chem. Soc.
Div. Petrol. Chem. (Preprints) 43 (1998) 35.
[31] V. LaVopa, C.N. Satterfield, J. Catal. 110 (1988) 375.
[32] M. Nagai, T. Sato, A. Aiba, J. Catal. 97 (1986) 52.
[33] J. Miciukiewicz, W. Zmierczak, F.E. Massoth, in: Proc. 8th
Int. Congr. on Catalysis, Berlin, 1984, vol. 2, p. 671.
[34] T.C. Ho, A.A. Montagna, J.J. Steger, in: Proc. 8th Int.
Congr. on Catalysis, Berlin, 1984, vol. 2, p. 257.
[35] J. Yang, F.E. Massoth, Appl. Catal. 34 (1987) 215.
[36] M. Nagai, T. Kabe, J. Catal. 81 (1983) 440.
[37] E.O. Odebunmi, D.F. Ollis, J. Catal. 80 (1983) 76.
[38] R. Ramachandran, F.E. Massoth, Chem. Eng. Commun. 18
(1982) 239.
[39] D. Dong, S. Jeong, F.E. Massoth, Catal. Today 37 (1997)
267.
[40] B. Muegge, F.E. Massoth, in: C.H. Bartholomew, J.B. Butt
(Eds.), Catalyst Deactivation, Elsevier, Amsterdam, 1991, p.
297.
E. Furimsky, F.E. Massoth / Catalysis Today 52 (1999) 381±495 487
Page 108
[41] S.H. Yang, C.N. Satterfield, Ind. Eng. Chem. Proc. Des.
Dev. 23 (1984) 20.
[42] S.C. Kim, FE Massoth, unpublished data.
[43] F.E. Massoth, J. Miciukiewicz, J. Catal. 101 (1986) 505.
[44] S. GuÈltekin, S.A. Ali, C.N. Satterfield, Ind. Eng. Chem.
Proc. Des. Dev. 23 (1984) 179.
[45] M.J. Girgis, B.C. Gates, Ind. Eng. Chem. Res. 33 (1994)
2301.
[46] R. Hughes, G.J. Hutchings, C.L. Koon, B. McGhee, C.E.
Snape, in: B. Delmon, G.F. Froment (Eds.), Catalyst
Deactivation, Elsevier, Amsterdam, 1994, p. 377.
[47] R. Hughes, G.J. Hutchings, C.L. Koon, B. McGhee, C.E.
Snape, D. Yu, Appl. Catal. 144 (1996) 269.
[48] R.A. Ware, J. Wei, J. Catal. 93 (1985) 122.
[49] J.M. Jones, R.A. Kydd, P.M. Boorman, P.H. van Rhyn, Fuel
74 (1995) 1875.
[50] M.W. Vogelzang, C.-L. Lee, G.C.A. Schuit, B.C. Gates, L.
Petrakis, J. Catal. 84 (1983) 170.
[51] S. Krishnamurthy, Y.T. Shah, Chem. Eng. Commun. 16
(1982) 109.
[52] E.O. Odebunmi, D.F. Ollis, J. Catal. 80 (1983) 65.
[53] C.N. Satterfield, S.H. Yang, J. Catal. 81 (1983) 335.
[54] C.N. Satterfield, C.M. Smith, M. Ingails, Ind. Eng. Chem.
Proc. Des. Dev. 24 (1985) 1000.
[55] E. Laurent, B. Delmon, Ind. Eng. Chem. Res. 32 (1993)
2516.
[56] E. Laurent, B. Delmon, Appl. Catal. 109 (1994) 31.
[57] E. Laurent, B. Delmon, in: B. Delmon, G.F. Froment (Eds.),
Catalyst Deactivation, Elsevier, Amsterdam, 1994, p. 459.
[58] A. Fonseca, P. Zeuthen, J.B. Nagy, Fuel 75 (1996) 1363.
[59] M. Marafi, A. Stanislaus, Appl. Catal. 159 (1997) 259.
[60] D.A. Netzel, F.P. Miknis, J.M. Mitzel, T. Zhang, P.D.
Jacobs, H.W. Haynes Jr., , Fuel 75 (1996) 1397.
[61] T.L. Cable, F.E. Massoth, M.G. Thomas, Fuel Process.
Technol. 4 (1981) 265.
[62] E. Furimsky, Fuel Process. Technol. 6 (1982) 1.
[63] E. Furimsky, Ind. Eng. Chem. Prod. Res. Dev. 18 (1979)
206.
[64] E. Furimsky, Ind. Eng. Chem. Prod. Res. Dev. 17 (1978)
329.
[65] P. Wiwel, P. Zeuthen, A.C. Jacobsen, in: C.H. Bartholomew,
J.B. Butt (Eds.), Catalyst Deactivation, Elsevier, Amster-
dam, 1991, p. 257.
[66] E. Furimsky, AIChE J. 25 (1979) 306.
[67] P. Magnoux, C. Canaff, F. Machado, M. Guisnet, J. Catal.
134 (1992) 286.
[68] P. Zeuthen, J. Bartholdy, P. Wiwel, B.H. Cooper, in: B.
Delmon, G.F. Froment (Eds.), Catalyst Deactivation, Else-
vier, Amsterdam, 1994, p. 199.
[69] I. Mochida, X.Z. Zhao, K. Sakanishi, S. Yamamoto, H.
Takashuira, S. Vemura, Ind. Eng. Chem. Res. 28 (1989) 418.
[70] H. Beuther, B.K. Schmidt, in: Proc. 6th World Petroleum
Congr. 1963, Section 3, p. 297.
[71] F.M. Dautzemberg, J.C. de Deken, Am. Chem. Soc. Div.
Petrol. Chem. (Preprints) 30 (1985) 8.
[72] D.K. Banerjee, K.J. Laidler, B.N. Nandi, D.J. Patmore, Fuel
65 (1986) 480.
[73] H. Nagaishi, E.W. Chan, E.C. Sanford, M.R. Gray, Energy
Fuels 11 (1997) 402.
[74] S. Eser, R.G. Jenkins, F. Derbyshire, M. Malladi, Carbon 24
(1986) 77.
[75] E. Furimsky, Ind. Eng. Chem. Prod. Res. Dev. 22 (1983)
641.
[76] T. Suzuki, M. Itoh, Y. Takegami, Y. Watanabe, Fuel 61
(1982) 402.
[77] D. Alvarez, R. Galiasso, P. Andreu, J. Japan Petr. Inst. 22
(1979) 234.
[78] E. Laurent, A. Centeno, B. Delmon, in: B. Delmon, G.F.
Froment (Eds.), Catalyst Deactivation, Elsevier, Amster-
dam, 1994, p. 573.
[79] E. Furimsky, Ind. Eng. Chem. Prod. Res. Dev. 22 (1983)
34.
[80] W.G. Appleby, J.W. Gibson, G.M. Good, Ind. Eng. Chem.
Proc. Des. Dev. 2 (1962) 102.
[81] E. Furimsky, Erdol und Kohle 35 (1982) 455.
[82] A.W. Scaroni, R.G. Jenkins, J.R. Utrilla, P.L. Walker Jr., ,
Fuel Process. Technol. 9 (1983) 103.
[83] G.M.K. Abotsi, A.W. Scaroni, Fuel Proces. Technol. 22
(1989) 107.
[84] T.C. Ho, Catal. Rev. -Sci. Eng. 30 (1988) 117.
[85] A.W. Scaroni, R.G. Jenkins, P.L. Walker Jr., , Appl. Catal.
14 (1985) 173.
[86] K.P. de Jong, D. Reinalda, C.A. Emeis, in: B. Delmon, F.G.
Froment (Eds.), Catalyst Deactivation, Elsevier, Amster-
dam, 1994, p. 155.
[87] M. Ternan, E. Furimsky, B.I. Parsons, Fuel Process.
Technol. 2 (1979) 45.
[88] F.V. Stohl, H.P. Stephens, Ind. Eng. Chem. Res. 26 (1987)
2466.
[89] I. Mochida, X.-Z. Zhao, K. Sakanishi, Fuel 67 (1988) 1101.
[90] J. van Dorn, J.L. Bosch, R.J. Bakkun, J.A. Moulijn, in: B.
Delmon, G.F. Froment (Eds.), Catalyst Deactivation, Else-
vier, Amsterdam, 1987.
[91] S.M. Richardson, H. Nagaishi, M.R. Gray, Ind. Eng. Chem.
Res. 35 (1996) 3940.
[92] J.M. Oelderik, S.T. Sie, D. Bode, Appl. Catal. 47 (1989) 1.
[93] G. Gualda, S. Kasztelan, J. Catal. 161 (1996) 319.
[94] R.A. Bakulin, M.E. Levinter, F.G. Unger, Int. Chem. Eng.
18 (1978) 89.
[95] F. Beguin, R. Setton, Carbon 10 (1972) 539.
[96] P. Kovacic, J. Oziomek, J. Org. Chem. 29 (1964) 100.
[97] M. Meot-Ner, J. Phys. Chem. 88 (1980) 2724.
[98] B.D. Flockart, I.M. Sesay, R.C. Pink, J. Chem. Soc. Chem.
Comm. 10 (1980) 439.
[99] B.C. Gates, J.R. Katzer, G.C.A. Schuit, Chemistry of
Catalytic Processes, McGraw Hill, New York, 1979.
[100] A.W. Scaroni, R.G. Jenkins, Am. Chem. Soc. Div. Petrol.
Chem. (Preprints) 30 (1985) 544.
[101] I.C. Lewis, L.S. Singer, Am. Chem. Soc. Div. Petrol. Chem.
(Preprints) 31 (1986) 834.
[102] I.C. Lewis, Carbon 20 (1981) 519.
[103] J.W. Bunger, Am. Chem. Soc. Div. Petrol. Chem. (Preprints)
30 (1985) 549.
[104] D. Nohara, T. Sakai, Ind. Eng. Chem. Res. 31 (1992) 14.
488 E. Furimsky, F.E. Massoth / Catalysis Today 52 (1999) 381±495
Page 109
[105] F. Diez, B.C. Gates, J.T. Miller, D.J. Sajkowski, S.G. Kukes,
Ind. Eng. Chem. Res. 29 (1990) 1999.
[106] D.J. Sajkowski, M.A. Pacheco, T.H. Fleisch, B.L. Meyers,
in: Proc. 9th Int. Congr. on Catalysis, 1998, vol. 1, p. 223.
[107] N.O. Egiebor, M.R. Gray, C. Natsuko, Appl. Catal. 55
(1989) 81.
[108] A. Fonseca, P. Zeuthen, J.B. Nagy, Fuel 75 (1996) 1413.
[109] T.E. Myers, F.S. Lee, B.L. Meyers, T.H. Fleisch, G.W.
Zajac, AIChE Symp. Series No. 273, vol. 85, 1989, p. 21.
[110] J.G. Weissman, J.C. Edwards, Appl. Catal. 142 (1996) 289.
[111] M. Marafi, A. Stanislaus, Am. Chem. Soc. Div. Petr. Chem.
(Preprints) 42 (1997) 573.
[112] C.N. Satterfield, Mass Transfer in Heterogeneous Catalysis,
Kreiger, Melbourne, FL, 1981.
[113] C.N. Satterfield, C.K. Colton, W.H. Pitcher Jr., , AIChE J.
19 (1973) 628.
[114] A. Chantong, F.E. Massoth, AIChE J. 29 (1983) 725.
[115] R.E. Beck, J.S. Schultz, Science 170 (1970) 1302.
[116] C.-H. Tsai, F.E. Massoth, S.Y. Lee, J.D. Seader, Ind. Eng.
Chem. Res. 30 (1991) 22.
[117] G. Seo, F.E. Massoth, AIChE J. 31 (1985) 494.
[118] S.Y. Lee, J.D. Seader, C.-H. Tsai, F.E. Massoth, Ind. Eng.
Chem. Res. 30 (1991) 1683.
[119] J.M. Smith, Chemical Engineering Kinetics, 3rd ed.,
McGraw-Hill, New York, 1981.
[120] E. Ruckenstein, A.S. Vaidyanathan, G.Y. Youngquist, Chem.
Eng. Sci. 26 (1971) 1305.
[121] C.R. Wilke, P. Chang, AIChE J. 1 (1995) 264.
[122] S.Y. Lee, J.D. Seader, C.-H. Tsai, F.E. Massoth, Ind. Eng.
Chem. Res. 30 (1991) 29.
[123] B.D. Prasher, G.A. Gabriel, Y.H. Ma, Ind. Eng. Chem. Proc.
Des. Dev. 17 (1978) 266.
[124] B.D. Prasher, G.A. Gabriel, Y.H. Ma, AIChE J. 24 (1978)
1118.
[125] B.D. Prasher, Y.H. Ma, AIChE J. 23 (1977) 303.
[126] C.N. Satterfield, C.K. Colton, W.H. Pitcher, AIChE J. 19
(1973) 628.
[127] D.M. Malone, J.L. Anderson, Chem. Eng. Sci. 33 (1978)
1429.
[128] S.Y. Lee, J.D. Seader, C.-H. Tsai, F.E. Massoth, Ind. Eng.
Chem. Res. 30 (1991) 607.
[129] C.H. Tsai, F.E. Massoth, S.Y. Lee, J.D. Seader, Fuel Process.
Technol. 29 (1991) 153.
[130] R. Hughes, Deactivation of Catalysts, Academic Press, New
York, 1984.
[131] A.S. Krishna, Catal. Rev. -Eng. Sci. 32 (1990) 279.
[132] A. Voorhies Jr., , Ind. Eng. Chem. 37 (1945) 318.
[133] J.B. Butt, Adv. Chem. Series 109 (1972) 259.
[134] E.E. Wolf, F. Alfani, Cat. Rev. -Sci. Eng. 24 (1982) 329.
[135] J.W. Beekman, F. Gilbert, Ind. Eng. Chem. Fund. 18 (1979)
245.
[136] E. Newson, Ind. Eng. Chem. Proc. Des. Dev. 14 (1975) 27.
[137] S. Masamune, J.M. Smith, AIChE J. 12 (1966) 384.
[138] K.P. deJong, Ind. Eng. Chem. Res. 33 (1994) 821.
[139] K.P. deJong, Ind. Eng. Chem. Res. 33 (1994) 3141.
[140] H.W. Haynes Jr., K. Leung, Chem. Eng. Commun. 23
(1983) 161.
[141] K. Leung, H.W. Haynes jr, , Chem. Eng. Commun. 31
(1984) 1.
[142] J. van Dorn, J.A. Moulijn, Fuel Process. Technol. 35 (1993)
275.
[143] K.-S. Chu, D. Dong, F.V. Hanson, F.E. Massoth, Ind. Eng.
Chem. Res. 35 (1996) 4012.
[144] R.G. Haldeman, M.C. Botty, J. Phys. Chem. 63 (1959) 489.
[145] J.V. Sanders, J.A. Spink, S.S. Polack, Appl. Catal. 5 (1983)
66.
[146] J.R. Fryer, Carbon 19 (1981) 431.
[147] J. van Dorn, J.A. Moulijn, G. Djega-Mariadassou, Appl.
Catal. 63 (1990) 77.
[148] T.H. Fleisch, B.L. Meyers, J.B. Hall, G.L. Ott, J. Catal. 86
(1984) 147.
[149] J. van Dorn, H.A.A. Barbolina, J.A. Moulijn, Ind. Eng.
Chem. Res. 31 (1992) 101.
[150] A.E. Hughes, K.C. Pratt, P. Tsai, Appl. Catal. 90 (1992) 117.
[151] K.-S. Chu, F.V. Hanson, F.E. Massoth, Fuel Process.
Technol. 40 (1994) 79.
[152] B.D. Muegge, F.E. Massoth, Fuel Process. Technol. 29
(1991) 19.
[153] C.H. Tsai, M.D. Deo, F.V. Hanson, A.G. Oblad, Fuel Sci.
Technol. Int. 10 (1992) 1437.
[154] A.W. Aldag, AIChE Symp. Series 273, vol. 85, 1989, p. 32.
[155] K.P. de Jong, H.P.C.E. Kuipers, J.A.R. van Veen, in: C.H.
Bartholomew, J.B. Butt (Eds.), Catalyst Deactivation, Else-
vier, Amsterdam, 1991 p. 28.
[156] A.D. van Langeveld, E.L.J. ArieÈns, J.A. Moulijn, Am.
Chem. Soc. Div. Petrol. Chem. (Preprints) 42 (1998) 55.
[157] Y. Yoshimura, T. Sato, H. Shimada, A. Nishijima, Fuel Sci.
Technol. Int. 4 (1986) 621.
[158] W.C. van Zijl Langhout, C. Ouwerkek, K.M. Pronk, Oil Gas
J. 1 (1980) 120.
[159] X. Yang, J.A. Guin, Appl. Catal. 141 (1996) 153.
[160] F.V. Stohl, H.P. Stephens, Am. Chem. Soc. Div. Fuel Chem.
(Preprints) 30 (1985) 148.
[161] J.M. Ammus, G.P. Androutsopoulos, A.H. Tsetseku, Ind.
Eng. Chem. Res. 26 (1986) 1323.
[162] Y. Yamamoto, F. Kumata, F.E. Massoth, Fuel Proc. Technol.
19 (1988) 253.
[163] G.F. Froment, K.B. Bischoff, Chemical Reactor Analysis
and Design, Wiley, New York, 1979, Chap. 3.
[164] E.K. Reif, J.R. Kittrell, Ind. Eng. Chem. Fund. 19 (1980)
126.
[165] I.-S. Nam, J.W. Eldridge, J.R. Kittrell, Chem. Eng.
Commun. 31 (1984) 121.
[166] J.R. Kittrell, P.S. Tam, J.W. Eldridge, Hydroc. Proc. 8
(1985) 63.
[167] A. Artega, J.L.G. Fierro, F. Delannay, B. Delmon, Appl.
Catal. 26 (1986) 227.
[168] A. Artega, J.L.G. Fierro, P. Grange, B. Delmon, in: B.
Delmon, G.F. Froment (Eds.), Catalyst Deactivation, Else-
vier, Amsterdam, 1987, p. 59.
[169] F.V. Stohl, H.P. Stephens, Am. Chem. Soc. Div. Fuel Chem.
(Preprints) 30 (1985) 251.
[170] S.M.A.M. Bouwens, D.C. Koningsberger, V.H.J. de Beer, R.
Prins, Catal. Lett. 1 (1988) 55.
E. Furimsky, F.E. Massoth / Catalysis Today 52 (1999) 381±495 489
Page 110
[171] B.S. Clausen, H. Topsoe, R. Candia, J. Villadsen, B.
Lengeler, J. Als-Nielsen, F. Christensen, J. Phys. Chem.
85 (1981) 3868.
[172] T.F. Hayden, J.A. Dumesic, J. Catal. 103 (1987) 366.
[173] H.P. Stephens, H.P. Stohl, Am. Chem. Soc. Div. Fuel Chem.
(Preprints) 30 (1985) 465.
[174] C.W. Curtis, J.A. Guin, R. Nalitham, A. Mohain, A.R.
Tarrer, Am. Chem. Soc. Div. Fuel Chem. (Preprints) 26
(1981) 164.
[175] P.A. Hertan, F.P. Larkins, W.R. Jackson, Fuel Proc. Technol.
10 (1985) 121.
[176] F.E. Massoth, in: C. Bartholomew, G. Fuentes (Eds.), Proc.
Symp. on Catalysis Deactivation, Elsevier, New York, 1997,
p. 275.
[177] C.T. Adams, A.A. Del Paggio, H. Schaper, W.H.J. Stork,
W.K. Shiflett, Hydroc. Proc. 9 (1989) 57.
[178] B.M. Moyse, B.H. Cooper, A. Albjerg, in: NPRA Annual
Meeting, Paper AM-84-59, San Antonio, TX, March
1984.
[179] Y. Yoshimura, K. Mayamizu, T. Sato, H. Shimada, A.
Nishijima, Fuel Process. Technol. 16 (1987) 55.
[180] A. Ocampo, J.T. Schrodt, S.M. Kovach, Ind. Eng. Chem.
Prod. Res. Dev. 17 (1978) 56.
[181] S. Kobayashi, S. Kushiyama, R. Aizawa, Y. Koinuma, K.
Imoue, Y. Shimizu, K. Egi, Ind. Eng. Chem. Res. 26 (1987)
2245.
[182] T.E. Myers, F.S. Le, B.L. Myers, T.H. Fleisch, G.E. Zajac,
AIChE Symposium Series 273, vol. 85, 1989, p. 32.
[183] A.C. Jacobsen, B.H. Cooper, P.N. Hannerup, in: 12th Petrol
World Congr, vol. 4, 1987, 97.
[184] J. Goulon, A. Retournard, P. Friant, C. Ginet-Goulon, C.
Berthe, J.F. Muller, J.L. Poncet, R. Guilard, J.C. Escalier, B.
Neff, J. Chem. Soc. Dalton Trans. 6 (1984) 1095.
[185] T.F. Yen (Ed.), Chemical aspects of metals in native
petroleum, Ann Arbor Science, Ann Arbor, MI, 1975, p.
221.
[186] R.H. Filby, D. Strong, in: S.S. Shih, M.C. Oballa, (Eds.), Tar
Sand and Oil Upgrading Technology, AIChE Symp. Series
282, vol. 87, 1991, p. 1.
[187] J.P. Janssens, G. Elst, E.G. Schrikkema, A.D. van Lange-
veld, S.T. Sie, J.A. Moulijn, Recl. Trav. Chim. Pays Bas 115
(1996) 465.
[188] W.I. Beaton, R.J. Bertolacini, Catal. Rev. -Sci. Eng. 33
(1991) 281.
[189] P.C.H. Mitchell, Catal. Today 7 (1990) 439.
[190] R.D. Grigsby, J.B. Green, Energy Fuels 11 (1997) 602.
[191] K. Sakanishi, N. Yamashita, D.D. Witehurst, I. Mochida,
Am. Chem. Soc. Div. Petr. Chem. (Preprints) 42(2) (1997)
373.
[192] M. Loos, I. Ascone, P. Friant, M.F. Ruiz-Lopez, J. Goulon,
J.M. Barbe, N. Seglet, R. Guilard, D. Faure, T. des
Courieres, Catal. Today 7 (1990) 497.
[193] M. Loos, I. Ascone, C. Goulon-Ginet, J. Goulon, C. Guilard,
M. Lacroix, M. Breysse, D. Faureand, T. des Courieres,
Catal. Today 7 (1990) 515.
[194] P.C.H. Mitchell, C.E. Scott, Catal. Today 7 (1990) 467.
[195] B. Vielhaber, H. Knozinger, Appl. Catal. 26 (1986) 375.
[196] H. Knozinger, D. Cordischi, B. Vielhaber, Catal. Today 7
(1990) 447.
[197] C.-W. Huang, J. Wei, Ind. Eng. Chem. Proc. Des. Dev. 19
(1980) 250.
[198] C.-W. Huang, J. Wei, Ind. Eng. Chem. Process. Des. Dev. 19
(1980) 257.
[199] R. Agrawal, J. Wei, Ind. Eng. Chem. Process. Des. Dev. 23
(1984) 505.
[200] R.A. Ware, J. Wei, J. Catal. 93 (1985) 100.
[201] F. Vandeneeckoutte, R. Hubaut, S. Pietrzyk, T. Des
Courieres, J. Grimlot, Reac. Kinet. Catal. Lett. 45 (1991)
191.
[202] H.-J. Chen, F.E. Massoth, Ind. Eng. Chem. Res. 27 (1988)
1629.
[203] Y. Kamiya, S. Nagae, Fuel 64 (1985) 1242.
[204] B.R. Utz, H.R. Appell, B.D. Blaustein, Fuel 65 (1986) 1085.
[205] J. Weitkamp, W. Gerhardt, D. Scholl, in: Proc. 8th Int.
Congr. on Catalysis, vol. II, 1984, p. 269.
[206] L.A. Rankel, Am. Chem. Soc. Div Petr. Chem. (Preprints) 2
(1981) 689.
[207] C.W. Hung, Ph.D Thesis, MIT, Cambridge, MA, 1979.
[208] E. Furimsky, P.J. Champagne, Fuel Process. Technol. 6
(1982) 269.
[209] E.L. Sughrue, D.W. Hausler, P.C. Liao, D.J. Strope, Ind.
Eng. Chem. Res. 27 (1988) 397.
[210] J.C. Plumail, R. Marseu, G. Martino, H. Toulhoat, in: Proc.
Symp. on Recent Development and Challenges in Hydrotr.
Catalysts, Toronto, 6±10 June 1988.
[211] O.A. Larson, H. Beuther, Am. Chem. Soc. Div. Petrol.
Chem. (Preprints) 11 (1966) B95.
[212] K.L. Riley, Am. Chem. Soc. Div. Petrol. Chem. (Preprints)
23 (1978) 1104.
[213] J.M. Pazos, L. Aquino, J. Pachano, Am. Chem. Soc. Div.
Petrol. Chem. (Preprints) 26 (1981) 456.
[214] J.F. Mosby, G.B. Heokstra, T.A. Kleinhertz, J.M. Sroka,
Hydroc. Process. 52 (1973) 93.
[215] S.M. Oleck, H.S. Sherry, Ind. Eng. Chem. Process. Des.
Dev. 16 (1977) 525.
[216] S.M. Oleck, S.H. Sherry, Ind. Eng. Chem. Process. Des.
Dev. 16 (1977) 263.
[217] C.D. Chang, A.J. Silvestri, Ind. Eng. Chem. Process. Des.
Dev. 13 (1974) 315.
[218] C.D. Chang, A.J. Silvestri, Ind. Eng. Chem. Process. Des.
Dev. 15 (1976) 161.
[219] K. Rajagopalan, D. Luss, Ind. Eng. Chem. Process. Des.
Dev. 18 (1979) 459.
[220] E.L. Sughrue, R. Adarme, M.M. Johnson, C.J. Lord, M.D.
Phillips, in: C.H. Bartholomew, J.B. Butt (Eds.), Catalyst
Deactivation, Elsevier, Amsterdam, 1991, p. 281.
[221] J.J. Yu, J.B. Butt, in: Catalyst Deactivation, Elsevier,
Amsterdam, 1991, p. 343.
[222] B.G. Johnson, F.E. Massoth, J. Bartholdy, AIChE J. 32
(1986) 1980.
[223] J. Bartholdy, P.N. Hannerup, Am. Chem. Soc. Div. Petrol.
Chem (Preprints) 35 (1990) 619.
[224] P. Bourseau, G. Muratet, C. Saillour, H. Toulhoat, Rev. Inst.
Fr. Petr. 40 (1985) 595.
490 E. Furimsky, F.E. Massoth / Catalysis Today 52 (1999) 381±495
Page 111
[225] S. Kobayashi, S. Kushiyama, R. Aizawa, Y. Koinuma, K.
Inoue, Y. Shimizu, K. Egri, Ind. Eng. Chem. Res. 26 (1987)
2241.
[226] L. Reyes, C. Zerpa, J.H. Krasuk, in: B. Delmon, G.F.
Froment (Eds.), Catalyst Deactivation, Elsevier, Amster-
dam, p. 85.
[227] C. Takeuchi, Y. Fukui, Y. Shiroto, M. Nakamura, in: Proc.
11th World Petroleum Congr., London, UK, 1993, vol. 4, p.
87.
[228] C.J. Pereira, J. W Beeckman, Ind. Eng. Chem. Res. 28
(1989) 422.
[229] C.J. Pereira, R.G. Donnelly, L.L. Hegedus, in: E.E. Petersen,
A.T. Bell (Eds.), Catalyst Deactivation, Marcel Dekker, New
York, 1987, p. 315.
[230] J.C. Spry, W.H. Sawyer, in: Proc. 68th AIChE Annual
Meeting, Los Angeles, 1975, paper 30C.
[231] Y.T. Shah, J.A. Paraskos, Ind. Eng. Chem. Process. Des. Dev
14 (1975) 266.
[232] N. Midoux, J.C. Charpentier, Chem. Eng. Sci. 28 (1973)
2108.
[233] J.W. Beeckman, G.F. Froment, Ind. Eng. Chem. Fund. 18
(1979) 245.
[234] J.W. Beeckman, G.F. Froment, Chem. Eng. Sci. 35 (1980)
805.
[235] A. Wheeler, A.J. Robell, J. Catal. 13 (1969) 299.
[236] P.B. Weisz, Chem. Eng. Prog. 25 (1954) 55.
[237] O. MaceÂ, J. Wei, Ind. Eng. Chem. Res. 30 (1991) 909.
[238] T. Takatsu, Y. Wada, S. Inoue, in: P. O'Connor, T. Takatsu, G.L.
Woolery (Eds.), Deactivation and Testing of Hydrocarbon-
Processing Catalysts, ACS Symp. Series, 634, 1996, p. 414.
[239] H.D. Simpson, in: C.H. Bartholomew, J.B. Butt (Eds.),
Catalyst Deactivation, Elsevier, Amsterdam, 1991, p. 265.
[240] J. Wei, in: C.H. Bartholomew, J.B. Butt (Eds.), Catalyst
Deactivation, Elsevier, Amsterdam, 1991, p. 333.
[241] B.J. Smith, J. Wei, J. Catal. 132 (1991) 1.
[242] N. Nourbakhsh, B.J. Smith, I.A. Webster, J. Wei, T.T.
Tsotsis, J. Catal. 132 (1991) 178.
[243] J.P. Jannsens, A.D. van Langeveld, S.T. Sie, J.A. Moulijn,
in: P. O'Connor, T. Takatsuka, G.L. Woolery (Eds.),
Deactivation and Testing of Hydrocarbon-Processing Cata-
lysts, ACS Symp. Series 634, 1996, p. 238.
[244] H. Toulhoat, J.C. Plumail, G. Martino, Am. Chem. Soc. Div.
Petrol. Chem. (Preprints) 27 (1985) 85.
[245] H. Toulhoat, R. Szymanski, J.C. Plumail, Catal. Today 7
(1990) 531.
[246] C. Hung, R.L. Howell, D.R. Johnson, Chem. Eng. Prog.,
March 1986, p. 57.
[247] R. Agrawal, J. Wei, Ind. Eng. Chem. Process. Res. Dev. 23
(1984) 515.
[248] R.A. Ware, J. Wei, Ind. Eng. Chem. Res. 93 (1985) 135.
[249] F. Audibert, P. Duhaut, in: Proc. 35th Meeting of American
Petroleum Instistute, 13±15 May 1970, Houston, TX.
[250] A.H. Hardin, R.H. Packwood, M. Ternan, Am. Chem. Soc.
Div. Petrol. Chem. (Preprints) 23 (1978) 1450.
[251] M. Inoguchi, S. Sakurada, Y. Satomi, K. Inaba, H. Kagaya,
K. Tate, T. Mizutori, R. Nishiyama, T. Nagai, S. Onishi,
Bull. Jap. Petrol. Inst. 14 (1972) 153.
[252] W.F. Arey, N.E. Blackwell, A.D. Reichle, in: 7th World
Petroleum Congr. vol. 4, Mexico, 1967, p. 167.
[253] T. Kwan, M. Sato, Nippon Kagaku Zasshi 91 (1970) 1103.
[254] M. Sato, N. Takayoma, S. Kurita, T. Kwan, Nippon Kagaku
Zasshi 92 (1971) 834.
[255] L.O. Oyekunle, R. Hughes, Ind. Eng. Chem. Res. 62 (1984)
339.
[256] N. Todo, T. Kabe, K. Ogawa, M. Kurita, T. Sato, K.
Shimada, Y. Kuriki, T. Oshima, T. Takemats, Y. Kotera,
Kogyo Kagaku Zasshi 74 (1971) 563.
[257] B. Ahn, J. Smith, AIChE J. 30 (1984) 739.
[258] M. Sahimi, T.T. Totsis, J. Catal. 96 (1985) 552.
[259] J.M. Pazos, J.C. Gonzales, A.J. Salazar, Ind. Eng. Chem.
Process. Des. Dev. 25 (1983) 653.
[260] R.R. Melkote, K.F. Jensen, Chem. Eng. Sci. 44 (1989)
649.
[261] J.P. Janssens, B.J. Bezemer, A.D. van Langeveld, S.T. Sie,
J.A. Moulijn, in: B. Delmon, G.F. Froment (Eds.), Catalyst
Deactivation, Elsevier, Amsterdam, 1994, p. 335.
[262] M. Sahimi, G.R. Gavels, T.T. Tsotsis, Chem. Eng. Sci. 45
(1990) 1443.
[263] M.J. Ledoux, S. Hantzer, Catal. Today 7 (1990) 479.
[264] S. Dejonghe, R. Hubaut, J. Grimblot, J.P. Bonelle, T. des
Courieres, Catal. Today 7 (1990) 569.
[265] C. Guillard, M. Lacroix, M. Vrinat, M. Breysse, B. Mocaer,
J. Grimblot, T. des Courieres, D. Faure, Catal. Today 7
(1990) 587.
[266] C.-S. Kim, F.E. Massoth, Fuel Process. Technol. 35 (1993)
289.
[267] J.E. Wukasch, H.F. Rase, Ind. Eng. Chem. Prod. Res. Dev.
21 (1982) 558.
[268] H. Koyama, E. Nagai, H. Kumagai, Am. Chem. Soc. Div.
Petrol. Chem. (Preprints) 40 (1995) 446.
[269] K.W. Babcock, L. Hiltzik, W.R. Ernst, J.D. Carruthers,
Appl. Catal. 51 (1989) 295.
[270] S.J. Hildebrandt, R.O. Koseoglu, J.E. Duddy, D.E. Sher-
wood, Am. Chem. Soc. Div. Petrol. Chem. (Preprints) 38
(1993) 40.
[271] P. Zeuthen, B.H. Cooper, F.T. Clark, D. Arters, Ind. Eng.
Chem. Res. 34 (1995) 755.
[272] G. Muralidhar, F.E. Massoth, J. Shabtai, J. Catal. 85 (1984)
44.
[273] Y. Yoshimura, T. Sato, H. Shimada, N. Matsubayashi, M.
Imamura, A. Nishijima, S. Yoshitoni, Am. Chem. Soc. Div.
Petrol. Chem. (Preprints) 38 (1993) 32.
[274] G. Gualda, S. Kasztelan, in: B. Delmon, F.G. Froment
(Eds.), Catalyst Deactivation, Elsevier, Amsterdam, 1994, p.
145.
[275] M. Absi-Halabi, A. Stanislaus, T. Al-Mughni, S. Khan, A.
Qamra, Fuel 74 (1995) 1211.
[276] D.-S. Yang, R. Dureau, J.-P. Charland, M. Ternan, Fuel 75
(1996) 1199.
[277] D.S. Thakur, M.G. Thomas, Ind. Eng. Chem. Prod. Res.
Dev. 23 (1984) 349.
[278] S.M. Kovach, L.J. Castle, J.V. Bennett, Ind. Eng. Chem.
Prod. Res. Dev. 17 (1978) 62.
[279] A.W. Lynch, Appl. Catal. 24 (1986) 227.
E. Furimsky, F.E. Massoth / Catalysis Today 52 (1999) 381±495 491
Page 112
[280] L.B. Clarke, Trace elements-emissions from coal, IEA Coal
Research Report IEACR/49, July 1992.
[281] R.A. Davidson, IEA Coal Research Report ICTIS/TR22,
1983.
[282] A. Attar, J.B. Martin, Am. Chem. Soc. Div. Fuel Chem.
(Preprints) 26 (1981) 73.
[283] I. Barin, O. Knacke, Thermochemical Properties of
Inorganic Substances, Springer, Dusseldorf, 1973.
[284] J.B. Speight, The Chemistry and Technology of Petroleum,
Marcel Dekker, New York, 1980.
[285] J.J. Stanulonis, B.C. Gates, J.H. Olson, AIChE J. 22 (1976)
576.
[286] F.V. Stohl, Q.A. Qader, F.E. Massoth, D.S. Thakur, Ind. Eng.
Chem. Res. 26 (1987) 846.
[287] F. DõÂez, D.J. Sajkowski, B.C. Gates, Fuel Process. Technol.
31 (1992) 43.
[288] H.P. Stephens, F.V. Stohl, Am. Chem. Soc. Div. Fuel Chem.
(Preprints) 29 (1989) 79.
[289] D.S. Thakur, F.E. Massoth, M.G. Thomas, in: in: Proc. 4th
Int. Conf. on Chemistry and Uses of Molybdenum, Climax
Molybdenum Company, 1982, p. 48.
[290] B.D. Adkins, D.R. Milburne, B.H. Davis, Ind. Eng. Chem.
Res. 27 (1988) 796.
[291] M.B. Neuworth, F.C. Moroni, Fuel Process. Technol. 8
(1984) 231.
[292] T.L. Cable, F.E. Massoth, M.G. Thomas, Fuel Process.
Technol. 10 (1985) 105.
[293] M. Ihnatowicz, A. Worstynowicz, Przegl. Gorn. 37 (1981)
459.
[294] J.M. Bogdanor, H.F. Rase, Ind. Eng. Chem. Prod. Res. Dev.
25 (1986) 220.
[295] J.P. Goodman, B.D. Adkins, D.R. Milburn, B.H. Davis, Fuel
Process. Technol. 22 (1989) 65.
[296] P.H. Holloway, B. Granoff, E.J. Nowak, A.W. Mullendore,
M.L. Liberman, Chemical studies in synthoil process,
Report. No. SAND76-0644 to ERDA, 1976.
[297] G. Berebi, P. Dufresne, Y. Jacquier, Environ. Progr. 12
(1993) 97.
[298] L. Kellberg, P. Zeuthen, H.J. Jackobsen, J. Catal. 143 (1993)
45.
[299] Y. Yoshimura, T. Sato, H. Shimada, N. Matsubayasi, M.
Imamura, A. Nishijima, S. Yoshitoni, T. Kameoka, H.
Yanase, Energy Fuels 8 (1994) 435.
[300] Q. Dai, K.H. Chung, J. Can. Petr. Technol. 35 (1996) 57.
[301] H.F. Rase, Chemical Reactor Design for Process Plants,
Wiley, New York, 1977.
[302] N. Yueqin, Z. Jingling, Z. Yan, W. Jifeng, in: B. Delmon,
G.F. Froment (Eds.), Catalyst Deactivation, Elsevier,
Amsterdam, 1994.
[303] F.E. Massoth, G. MuraliDhar, J. Shabtai, J. Catal. 85 (1984)
53.
[304] Y. Yokoyama, N. Ishikawa, K. Nakanishi, K. Satoh, A.
Nishijima, H. Shimada, N. Matsubayashi, M. Nomura,
Catal. Today 29 (1996) 261.
[305] H. Makishima, Y. Tanaka, Y. Kato, S. Kure, H. Shimada, N.
Matsubayashi, A. Nishijima, M. Nomura, Catal. Today 29
(1996) 267.
[306] N. Matsubayashi, H. Shimada, T. Sato, Y. Yoshimura, M.
Imamura, A. Nishijima, Fuel Process. Technol. 41 (1995)
261.
[307] Y. Yoshimura, T. Sato, H. Shimada, N. Matsubayashi, M.
Imamura, A. Nishijima, S. Yoshitomi, Am. Chem. Soc. Div.
Petr. Chem. (Preprints) 38 (1993) 32.
[308] S. Kure, Y. Yokoyama, H. Makishima, H. Shimada, N.
Matsubatashi, A. Nishijima, M. Nomura, J. de Physique III
C2-929, April 1997.
[309] E. Eijsbouts, Y. Inoue, Science and Technology in Catalysis
1994, 76 (1995) 429.
[310] A. Stanislaus, M. Absi-Halabi, K. Al-Dolama, A. Katrib, M.
Ismail, Appl. Catal. 41 (1988) 109.
[311] N.M. Gellerman, R.R. Aliev, V.G. Sidelkovskaya, Chem.
Process. Fuels 10 (1994) 391 (in Russian).
[312] Y. Yoshimura, H. Shimada, T. Sato, M. Kubota, A. Nisijima,
Appl. Catal. 29 (1987) 25.
[313] S. Harris, R.R. Chianelli, J. Catal. 86 (1984) 400.
[314] S. Harris, R.R. Chianelli, J. Catal. 98 (1986) 17.
[315] C. Takeuchi, S. Asaoka, S.I. Nakata, Y. Shiroto, Am. Chem.
Soc. Div. Petr. Chem. (Preprints) 30 (1985) 96.
[316] Y. Yoshimura, S. Endo, S. Yoshitoni, T. Sato, H. Shimada,
N. Matsubayashi, A. Nishijima, Fuel 70 (1991) 733.
[317] C.-S. Kim, F.E. Massoth, E. Furimsky, Fuel Process.
Technol. 32 (1992) 39.
[318] Y. Yoshimura, E. Furimsky, T. Sato, H. Shimada, N.
Matsubayashi, A. Nishijima, in: Proc. 9th Int. Congr. on
Catalysis, Calgary, 1988.
[319] J.S. Brinen, W.D. Armstrong, J. Catal. 54 (1978) 57.
[320] T.G. Parham, R.P. Merril, J. Catal. 85 (1984) 295.
[321] A.V. Ramaswamy, L.D. Sharma, A. Singh, M.L. Singhal, L.
Sivasanker, Appl. Catal. 13 (1985) 311.
[322] Y. Yoshimura, H. Yakokawa, T. Sato, N. Shimada, N.
Matsubayashi, A. Nishijima, Appl. Catal. 73 (1991) 39.
[323] M. Montes, M. Genet, D.K. Hodnett, W.E. Stone, B.
Delmon, Bull. Soc. Chim. Belg. 95 (1986) 1.
[324] E. Furimsky, Appl. Catal. 171 (1998) 177.
[325] J.P. Peries, A. Billon, A. Hennico, E. Morrison, F. Morel,
Inst. Fr. Petr. Rapport IFP #34 297, June 1986.
[326] M. Absi-Halabi, A. Stanislaus, in: P. O'Connor, T.
Takatsuba, G.L. Woolery (Eds.), Deactivation and Testing
of Hydrocarbon-Processing Catalysts, ACS Symp. Series
634, 1996, p. 229.
[327] P. Dufresne, N. Brahma, F. LabruyeÁre, M. Lacroix, M.
Breysse, Catal. Today 29 (1996) 251.
[328] W.-P. Wang, J.A. Guin, Fuel Process. Technol. 28 (1991)
149.
[329] A. Stanislaus, M. Absi-Halabi, Z. Khanin, in: M. Absi
Halabi (Ed.), Catalysts in Petroleum Refining and
Petrochemical Industries, Elsevier, Amsterdam, 1995,
p. 189.
[330] C.J. Pereira, R.G. Donnelly, L.L. Hegedus, in: E.E. Petersen,
A.T. Bell (Eds.), Catalyst Deactivation, Marcel Dekker,
1987, p. 315.
[331] C.J. Pereira, L.L. Hegedus, US Patent 4510263 (1985).
[332] B.H. Cooper, B.B.L. Donis, B.M. Moyse, Oil Gas J. 8
(1986) 39.
492 E. Furimsky, F.E. Massoth / Catalysis Today 52 (1999) 381±495
Page 113
[333] A. de Bruijn, I. Naka, J.W.M. Sonnemans, Ind. Eng. Chem.
Process. Des. Dev. 20 (1981) 40.
[334] F.M. Nooy, Oil Gas J. 12 (1984) 152.
[335] J.T. Wooten, S.R. Kauffman, Oil Gas J. 28 (1986) 81.
[336] B.M. Moyse, Oil Gas J. 15 (1986) 108.
[337] C.J. Pereira, W.-C. Chang, J.W. Beeckman, W. Suarez,
Appl. Catal. 42 (1988) 47.
[338] J.G. Sikonia, F. Stolfa, L.E. Hutchings, W.L. Jacobs, V.P.
Burton, Oil Gas J. 5 (1981) 141.
[339] W.C. van Zijl Langhout, P.B. Kwant, G.J. Lambert, in: Proc.
Symp. on Oil Refining, October 1985, La Plata, Argentina.
[340] W.I. Beaton, N.K. McDaniel, W.E. McWhirter, R.D.
Petersen, R.P. Van Driesen, Oil Gas J. 7 (1986) 47.
[341] K.W. RoÈbschlaÈger, W.J. Deelen, J.E. Naber, in: 4th
UNITAR/UNDP Int. Conf. on Heavy Crudes and Tar Sands,
August 1988, Edmonton, Canada, vol. 5, p. 249.
[342] R.P. Van Driesen, J. Caspers, A.R. Campbell, G. Lunin,
Hydroc. Process. 5 (1975) 107.
[343] R.E. Boening, N.K. McDaniel, R.D. Petersen, R.P. van
Driesen, Hydroc. Process. 9 (1987) 59.
[344] R. M Eccles, A.M. Gray, W.B. Livingstone, Oil Gas J. 12
(1982) 121.
[345] T.E. Johnson, J.R. Murphy, K.G. Tasker, Oil Gas J. 1 (1985)
50.
[346] R.L. Howell, C. Hung, K.R. Gibson, H.C. Chen, Oil Gas J.
29 (1985) 121.
[347] C.T. Adams, A.A. Del Paggio, H. Schaper, W.H.J. Stork,
W.K. Shiflett, Hydroc. Process. 9 (1989) 57.
[348] H. Koyama, E. Nagaiana, H. Kumagai, in: P. O'Connor, T.
Takatsu, G.L. Woolery (Eds.), Deactivation and Testing
Hydrocarbon Processing Catalysts, ACS Symp. Series 634,
1996, p. 208.
[349] B.H. Cooper, P. Sùgaard-Andersen, P. Nielsen-Hannerup, in:
M.C. Oballa, S.S. Shih (Eds.), Catalytic Hydroprocessing of
Petroleum and Distillates, Marcel Dekker, New York, 1994,
p. 279.
[350] A. Stanislaus, B.H. Cooper, Catal. Rev. -Sci. Eng. 36 (1994)
75.
[351] M. Breysse, J.L. Portefaix, M. Vrinat, Catal. Today 10
(1991) 489.
[352] J. Reardon, A.K. Datye, A.G. Sault, J. Catal. 173 (1998) 145.
[353] T. Halachev, P. Atanasova, A. Lopez-Agudo, M.G. Arias, J.
Ramirez, Appl. Catal. 136 (1996) 161.
[354] Y.W. Chen, W.C. Hsu, C.S. Lin, B.C. Kang, S.T. Wu, L.J.
Leu, J.C. Wu, Ind. Eng. Chem. Res. 29 (1990) 1830.
[355] Y.W. Chen, W. C Hsu, Ind. Eng. Chem. Res. 36 (1997)
2526.
[356] R.A. Kemp, C.T. Adams, Appl. Catal. 134 (1996) 299.
[357] Y.W. Chen, M.C. Tsai, Ind. Eng. Chem. Res. 36 (1997)
2521.
[358] Y.W. Chen, M.C. Tsai, Am. Chem. Soc. Div. Petrol. Chem.
(Preprints) 42 (1997) 577.
[359] J. Yang, F.E. Massoth, Appl. Catal. 34 (1987) 215.
[360] J.M. Jones, R.A. Kydd, P.M. Boorman, P.H. van Rhyn, Fuel
74 (1995) 1875.
[361] C.E. Rmos-Galvan, G. Sandoval-Robles, A. Castillo-Mares,
J.M. Dominguez, Appl. Catal. 150 (1997) 37.
[362] Z.-S. Ying, B. Gevert, J.-A. Otterstedt, J. Sterte, Appl. Catal.
153 (1997) 69.
[363] Z. Vit, Appl. Catal. 125 (1995) 61.
[364] R.G. Anthony, S. Udomsak, S.E. Lott, Appl. Catal. 122
(1995) 111.
[365] I.S. Sambi, R.S. Mann, Can. J. Chem. Eng. 67 (1989)
337.
[366] R. Cid, F. Orellana, A. Lopez-Agudo, Appl. Catal. 32 (1987)
327.
[367] T. Tatsumi, M. Taniguchi, S. Yasuda, Y. Ishii, T. Murata, M.
Hidai, Appl. Catal. 139 (1996) 5.
[368] S. Inoue, T. Takatsu, Y. Wada, T. Ono, Am. Chem. Soc. Div.
Petrol. Chem. (Preprints) 42 (1997) 351.
[369] T.A. Pecoraro, R.R. Chianelli, J. Catal. 67 (1981) 430.
[370] P.T. Vasudevan, J.L.G. Fierro, Catal. Rev. -Sci. Eng. 38
(1996) 161.
[371] A.P. Raje, S.-J. Liaw, R. Srinivansan, B.H. Davis, Appl.
Catal. 150 (1997) 297.
[372] P. Gallezot, Catal. Rev. -Sci. Eng. 20 (1979) 21.
[373] S.-J. Liaw, R. Lin, A. Raje, B.H. Davis, Appl. Catal. 151
(1997) 423.
[374] R. Navarro, B. Pawelec, J.L.G. Fierro, P.T. Vasudevan, J.F.
Cambra, P.L. Arias, Appl. Catal. 137 (1996) 269.
[375] R. Navarro, B. Pawelec, J.L.G. Fierro, P.T. Vasudevan, Appl.
Catal. 148 (1996) 23.
[376] C. Song, A.D. Schmitz, Energy Fuels 11 (1997) 656.
[377] A. Corma, A. MartõÂnez, V. MartõÂnez-Soria, J. Catal. 169
(1997) 480.
[378] S. Kasztelan, N. Marchal, S. Kresmann, A. Billon, in: 14th
World Petroleum Congr. on Catalysis, Section 9, Paper 3,
1994.
[379] N. Marchal, S. Kasztelan, S. Mignard, Catalyst Hydro-
processing of Petroleum Distillates, Marcel Dekker, New
York, 1995, p. 315.
[380] J.P. Lucien, G. van den Berg, H.M.J.H. van Hooijdonk, M.
Gjers, G.L.B. Thielemans, Catalyst Hydroprocessing of
Petroleum Distillates, Marcel Dekker, New York, 1994, p.
291.
[381] B.H. Cooper, B.B.L. Donis, Appl. Catal. 137 (1996) 203.
[382] J.C. Schlatter, S.T. Oyama, J.E. Metcalfe, J.M. Lambert Jr., ,
Ind. Eng. Chem. Res. 27 (1988) 1648.
[383] S. Ramanathan, S.T. Oyama, J. Phys. Chem. 99 (1995)
16365.
[384] S. Li, J.S. Lee, J. Catal. 173 (1998) 134.
[385] C.C. Yu, S. Ramanathan, S.T. Oyama, J. Catal. 173 (1998)
1.
[386] S. Ramanathan, C.C. Yu, S.T. Oyama, J. Catal. 173 (1998)
10.
[387] D.J. Sajkowski, S.T. Oyama, Appl. Catal. 134 (1996) 339.
[388] G.M. Dolce, P.E. Savage, L.T. Thompson, Energy Fuels 11
(1997) 668.
[389] K.R. McCrea, J.W. Logan, T.L. Tarbuck, J.L. Heiser, M.E.
Bussel, J. Catal. 171 (1997) 255.
[390] H.K. Park, J.K. Lee, J.K. Yoo, E.S. Ko, D.S. Kim, K.L. Kim,
Appl. Catal. 150 (1997) 21.
[391] G. DjeÂga-Mariadassou, M. Boudart, G. Bugli, C. Sayag,
Catal. Lett. 31 (1995) 411.
E. Furimsky, F.E. Massoth / Catalysis Today 52 (1999) 381±495 493
Page 114
[392] M.J. Satriana, Hydroprocessing Catalysts for Heavy Oil and
Coal, Noyes Data, Park Ridge, NJ, 1982.
[393] R.H. Wolk, W.C. Rovesti, US Patent 3,819,509, June 25,
1974.
[394] R.H. Wolk, G. Nogbri, W.C. Rovesti, US Patent 3,901,792,
26 August 1975.
[395] T.T. Hilbert, N.D. Mazzone, M.S. Sarli, US Patent
5,510,016, 23 April 1996.
[396] J.A. Howell, US Patent 4,659,452, 21 April 1987.
[397] L.E. Hutchings, US Patent 4,239,614, 16 December 1980.
[398] E.A. Jones, US Patent 4,234,314, 18 November 1980.
[399] Y. Fukui, Y. Shirota, M. Ando, Y. Homma, US Patent
4,166,026, 28 August 1979.
[400] N.L. Carr, F.E. Massoth, D.L. Stahlfeld, J.E. Young, Jr., US
Patent 3,782,076, January 1974.
[401] F.E. Massoth, J.E. Young, US Patent 3,812,653, May 1974.
[402] M.M. Habib, P.L. Winslow, R.O. Moore Jr,. US Patents
5,593,570, 14 January 1997 and 5,439,860, 8 August 1995.
[403] T.C. Ho, US Patent 4,973,397, 27 November 1990.
[404] T.-S. Chou, C.R. Kennedy, S.S. Shih, US Patent 4,997,544,
March 1991.
[405] J. Bartholdy, US Patent 5,368,722, November 29, 1994.
[406] L.E. Gardner, S.G. Kukes, US Patent 4,828,683, 9 May
1989.
[407] S.G. Kukes, K.K. Brandes, US Patent 4,767,523, 30 August
1988.
[408] S.G. Kukes, T. Davis, K.K. Brandes, US Patent 4,778,587,
18 October 1988.
[409] K.K. Brandes, S.G. Kukes, T. Davis, US Patent 4,778,588,
October 18, 1988.
[410] P.L. Winslow, R.F. Sullivan, US Patent 5,071,805, 10
December 1991.
[411] F. Banta, US Patent 4,447,314, 8 May 1984.
[412] S.S. Shih, D. Milstein, US Patent 4,421,633, 20 December
1983.
[413] W.D. Gillespie, US Patent 5,232,578, 1 August 1993.
[414] J.W. Ward, US Patent 4,572,778, 25 February 1986.
[415] J.W. Myers, S.L. Parrott, E.L. Sughrue, US Patent
4,619,759, October 28 1986.
[416] H.D. Simpson, D.P. McArthur, US Patent 4,431,526, 14
February 1984.
[417] H. Higashi, K. Shirono, Y. Arima, Y. Nishimura, S. Yoshida,
US Patent 4,613,425, 23 September 1986.
[418] G. Sato, H. Higashi, K. Shirono, Y. Eto, US Patent
4,925,554, 15 May 1990.
[419] M. Daage, T.C. Ho, K.L. Riley, US Patent 5,474,670, 12
December, 1995.
[420] T.C. Ho, US Patent 4,902,404, 20 February 1990.
[421] R.D. Cash, US Patent 4,430,203, 7 February 1984.
[422] A.G. Bridge, B.E. Stangeland, US Patent 4,615,789, 7
October 1986.
[423] A.J. MacLean, R.L. Holloway, V.A. Lawson, J.W. Cronen,
US Patent 4,902,405, 20 February 1990.
[424] L.E. Gardner, R.J. Hogan, E.L. Sughrue, J.W. Myers, US
Patent 4,657,663, 14 April 1987.
[425] A.L. Hensley Jr., L.M. Quick, US Patent 4,431,525,
February 14, 1984.
[426] K.R. Albinson, S. Mizrahi, D.J. Neuman, US Patent
4,913,797, 3 April 1990.
[427] J.F. Grootjans, P.J. Bredael, US Patent 4,810,356, 7 March
1989.
[428] S.M. Oleck, R.C. Wilson Jr., US Patent 4,437,976, 20 March
1984.
[429] S.M. Oleck, R.C. Wilson Jr., US Patent 4,490,242, 25
December, 1984.
[430] E.E. Unmuth, J.A. Mahoney, R.J. Bertolacini, US Patent
4,636,299, 13 January 1987.
[431] N.Y. Chen, T.F. Degnan, US Patent 4,604,261, 5 August
1986.
[432] K.L. Trachte, W. Lasko, E. Effron, G.F. Stuntz, K.D.
Chomyn, US Patent 5,198,099, 30 March 1993.
[433] P.J. Angevine, US Patent 4,415,436, 15 November 1983.
[434] E.C. Haun, G.J. Thompson, J.K. Gorawara, US Patent
5,110,444, 5 May 1992.
[435] M.G. Melconian, US Patent 4,406,777, 27 September 1983.
[436] R.H. Wolk, M.C. Chervenak, S.B. Alpert, US Patent
3,788,973, 29 January 1973.
[437] G.V. Nelso, G.C. Wray, US Patent 3,891,539, 24 June 1975.
[438] G.P. Hamner, US Patents 3,977,961, August 31, 1976 and
4,014,821, 29 March 1977.
[439] W.F. Arey Jr., G.P. Hamner, W.H. Sawyer, US Patent
3,977,962, 31 August 1976.
[440] G.P. Hamner, US Patent 4,073,718, February 14, 1978.
[441] H. Higashi, US Patent 5,591,325, 7 January 1997.
[442] A.M. Henke, J.D. McKinney, US Patent 3,936,370, 3
February 1976.
[443] W. Mounce, US Patent 3,830,728, 20 August 1974.
[444] R.H. Wolk, M.C. Chervenak, S.B. Alpert, US Patent
3,788,973, 29 January 1974.
[445] G.P. Hamner, K.R. Clem, US Patent 3,887,455, 3 June 1975.
[446] J.G. Kunesh, US Patent 4,344,840, 17 August 1982.
[447] S. Beret, S.G. Yu, C.R. Hsie, US Patent 4,761,220, 2 August
1988.
[448] H.J. Trimble, B.E. Reynolds, R.W. Bachtel, R.J. Klett,
D.N. Brossard, D.E. Earls, US Patent 5,660,715, 26 August
1997.
[449] C.P. Kyan, P.J. Oswald, US Patent 5,603,824, February 18,
1997.
[450] K.W. Goebel, V.A. Patel, E.L. Whittington, Jr., US Patent,
5,232,283, 3 August 1993.
[451] G.E. Harrison, D.H. McKinley, A.J. Dennis, US Patent,
5,292,428, 8 March 1994.
[452] J.V. Pool, US Patent 4,272,823, 9 June 1981.
[453] T.R. Forbus, US Patent 5,246,568, September 21, 1993.
[454] T.-S. Chou, US Patent 4,481,105, 6 November 1984.
[455] F.A. Aly, P.W. Snyder, US Patent 4,896,704, 30 January
1990.
[456] J.B. Wijffels, A.A. Pegels, A. Wezenberg, US Patent
4,228,418, 21 October 1980.
[457] A.P. Den Hartog, W. Van Vliet, US Patent 5,635,145, June 3,
1997.
[458] N.K. McDaniel, P.E. Stelly, R.E. Boening, W.E. McWhirter
Jr., D.E. Atkinson, R.D. Petersen, US Patent, 4,753,721, 28
June 1988.
494 E. Furimsky, F.E. Massoth / Catalysis Today 52 (1999) 381±495
Page 115
[459] F.A. Smith, US Patents 4,579,647, 1 April 1986 and
4,743,433, 10 May 1988.
[460] M.N. Harandi, US Patent 5,554,275, 10 September 1996.
[461] N. Yeoman, R. Pinaire, M.A. Ulowetz, T.P. Nace, D.A.
Furse, US Patent 5,593,548, 14 January 1997.
[462] A. Al-Saigh, US Patent 4,642,223, 10 February 1987.
[463] K.D. Peters, US Patents 4,250,018 and 4,250,019, 10
February, 1981.
[464] G.L. Scheuerman, D.R. Johnson, D.C. Kramer, US Patent
5,472,928, December 1995.
[465] B.E. Stangeland, D.C. Kramer, D.S. Smith, J.T. McCall,
G.L. Scheuerman, R.W. Bachtel, D.R. Johnson, US Patent
5,599,440, 4 February 1997.
[466] B.P. Vora, N.H. Scott, US Patent 4,869,808, 26 September
1989.
[467] D.J. Monticello, US Patent 5,387,523, 7 February 1995.
E. Furimsky, F.E. Massoth / Catalysis Today 52 (1999) 381±495 495
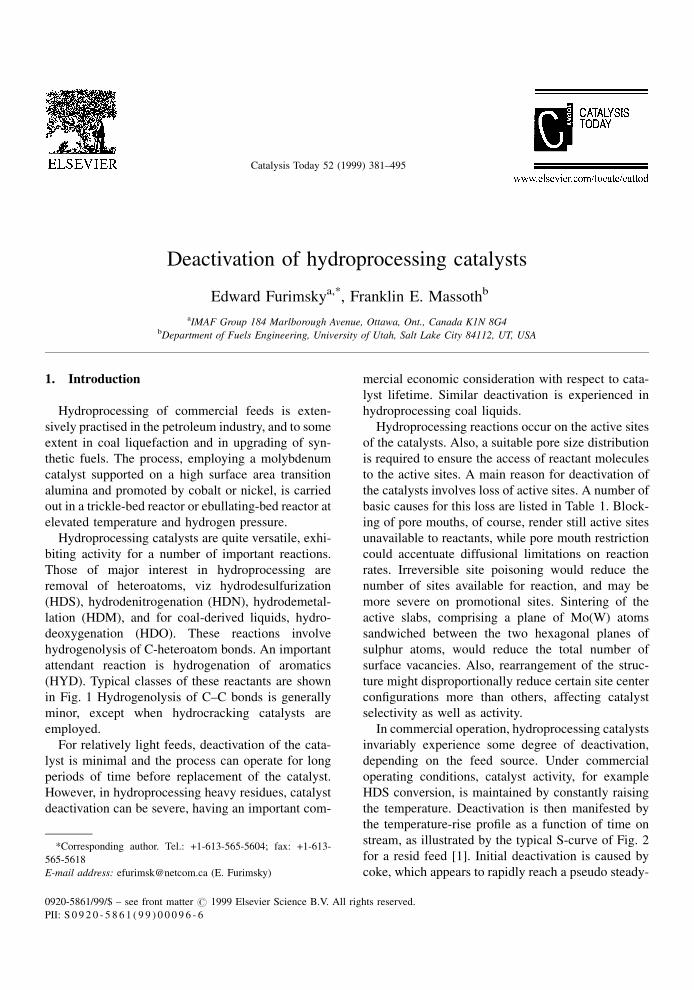
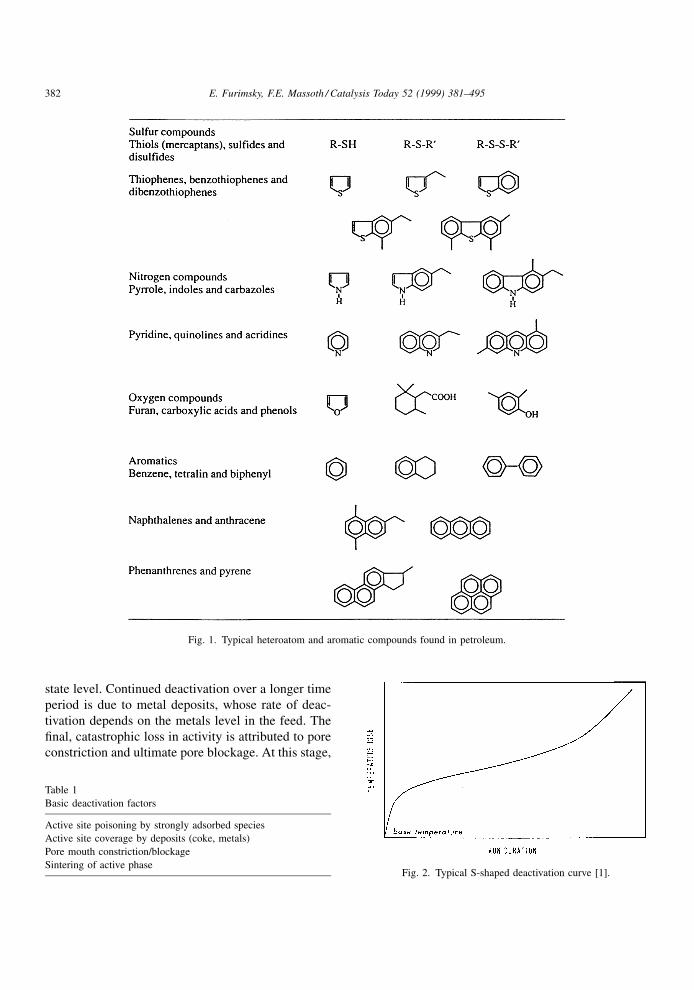
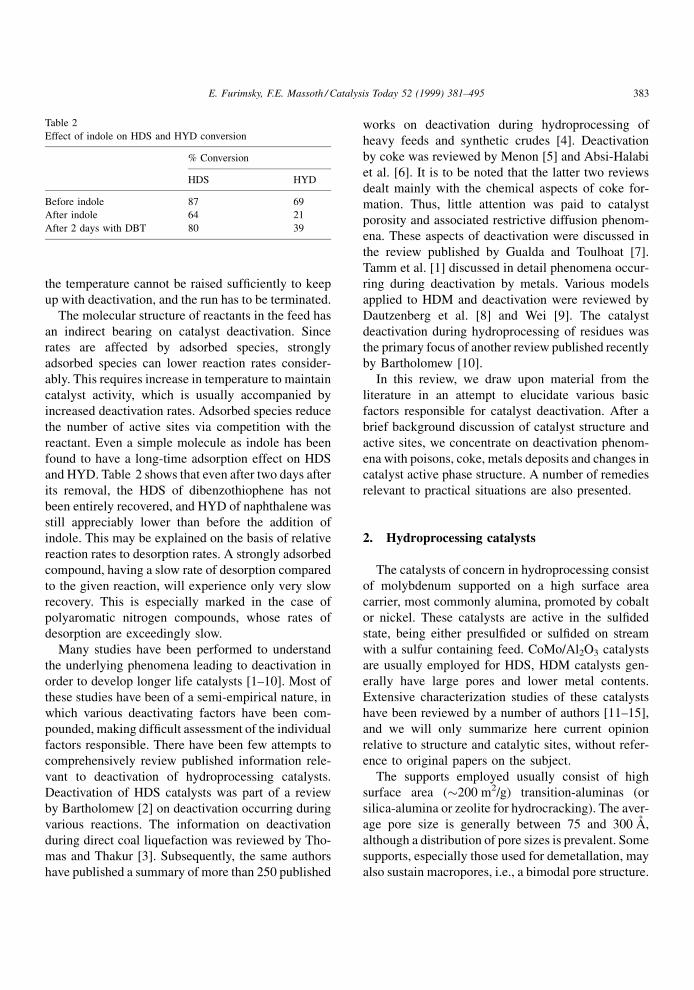
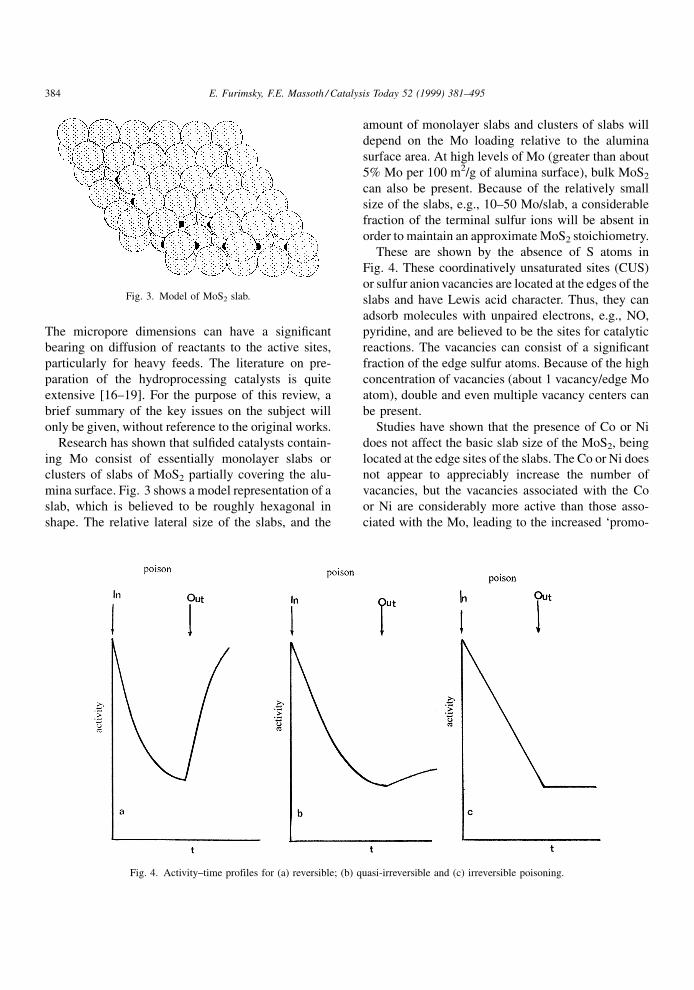
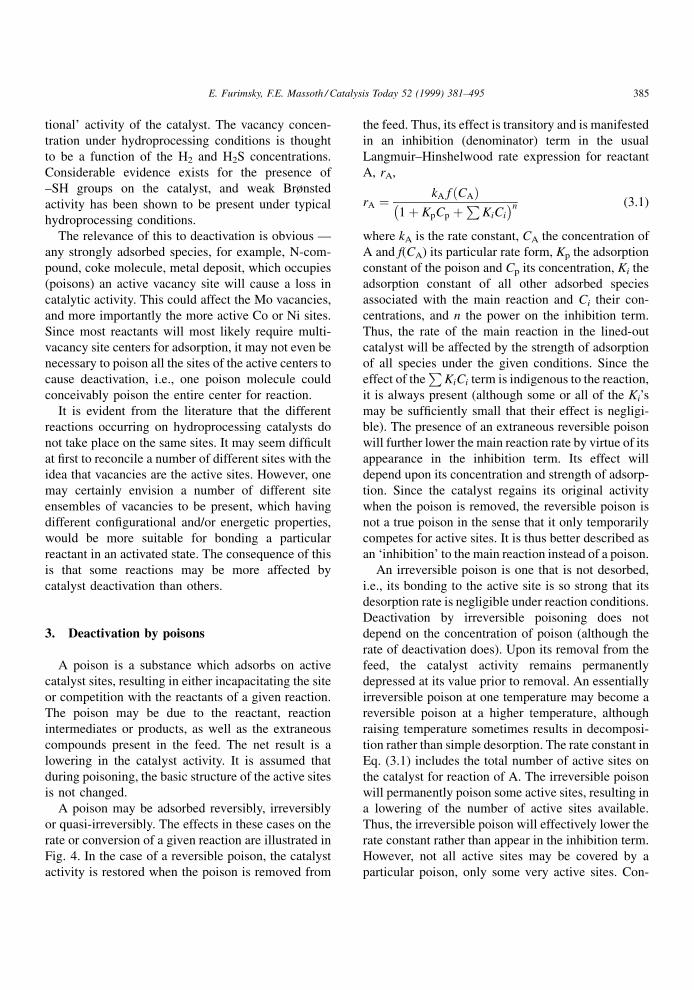
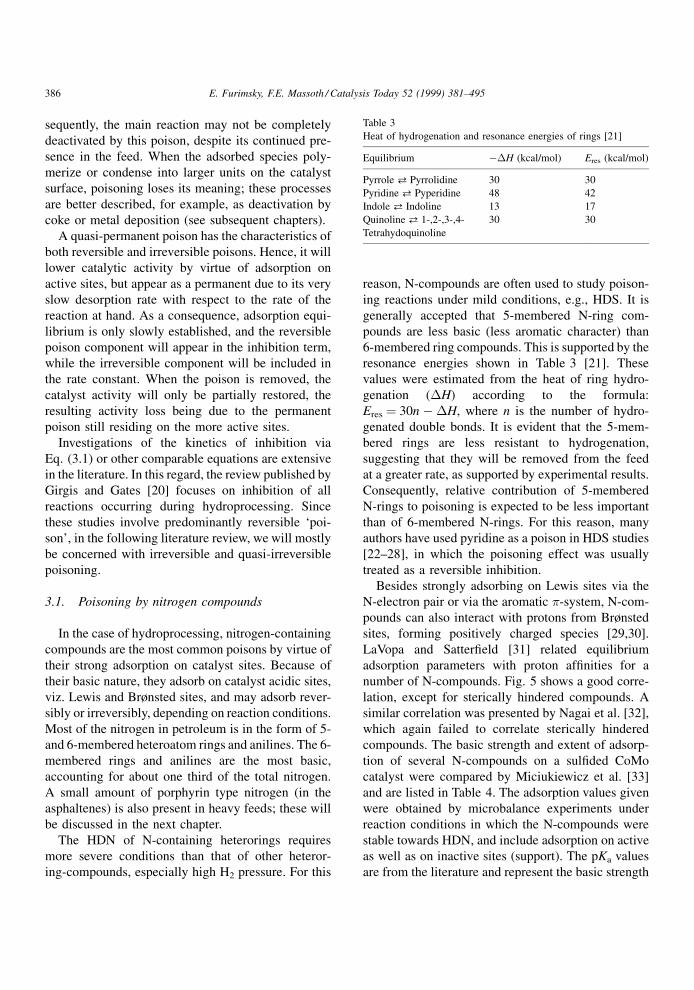
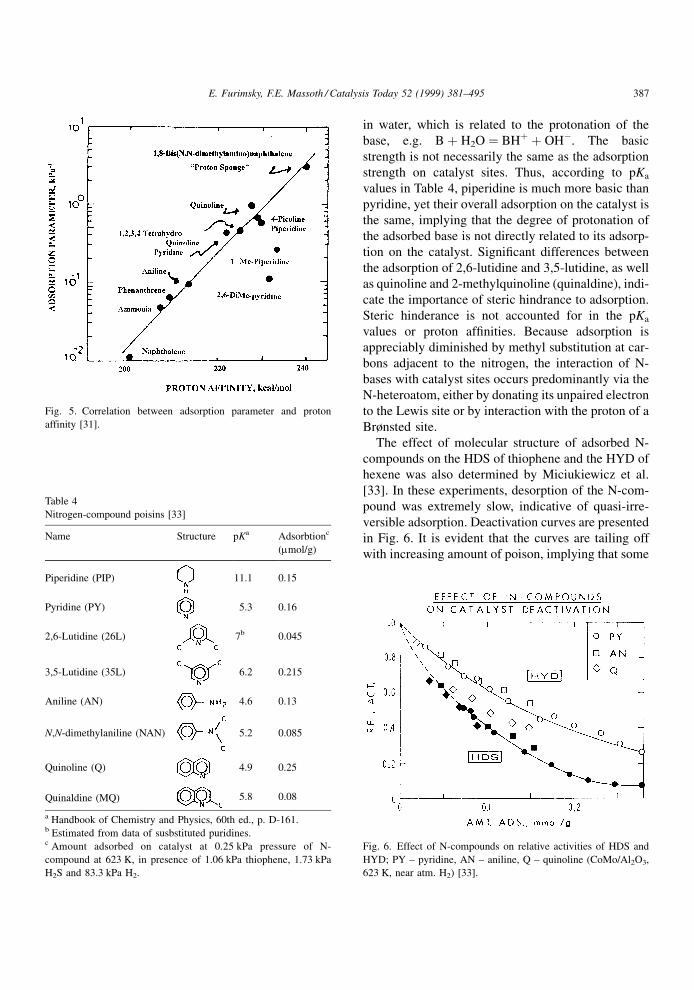
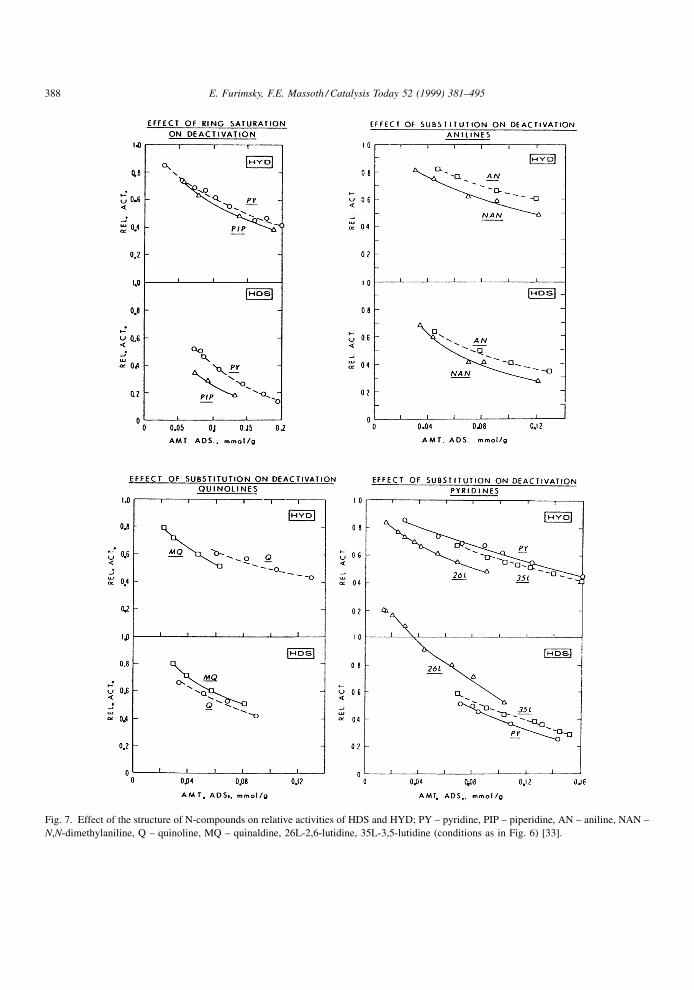
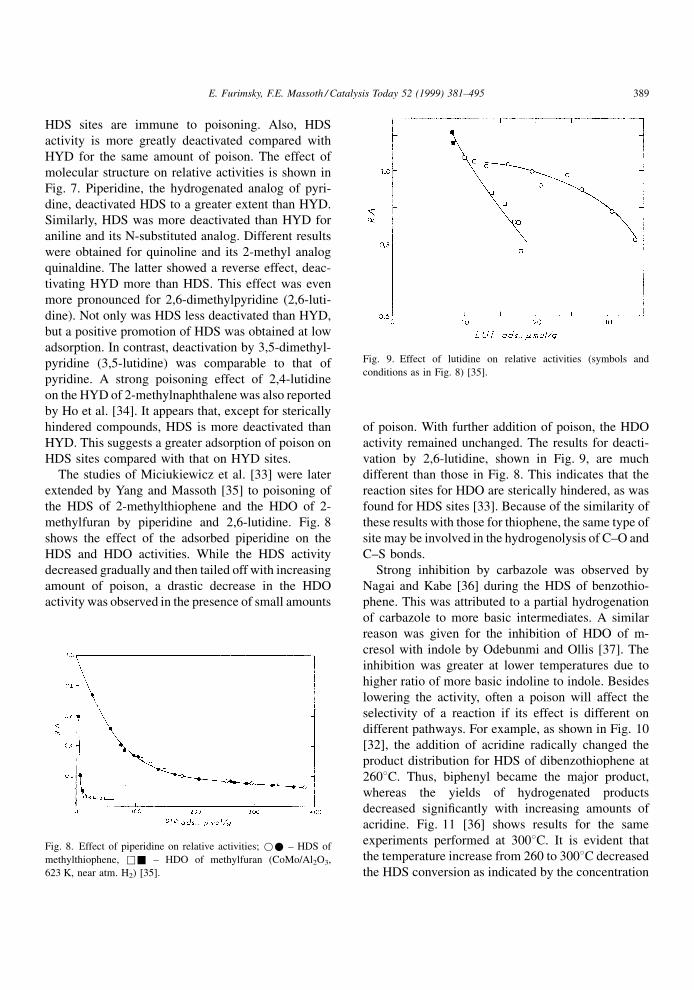
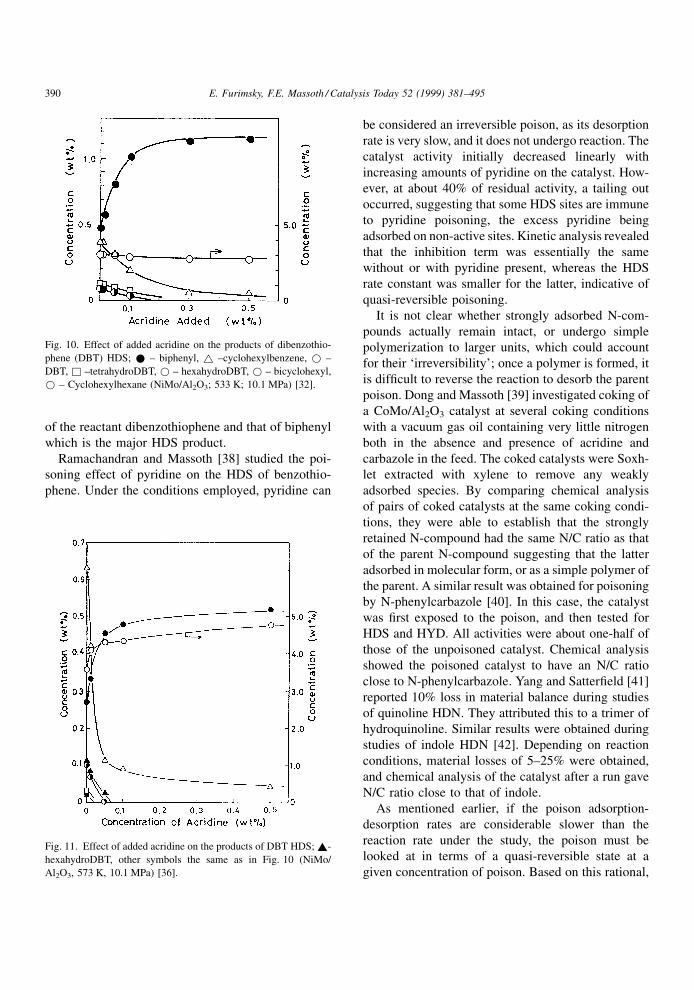
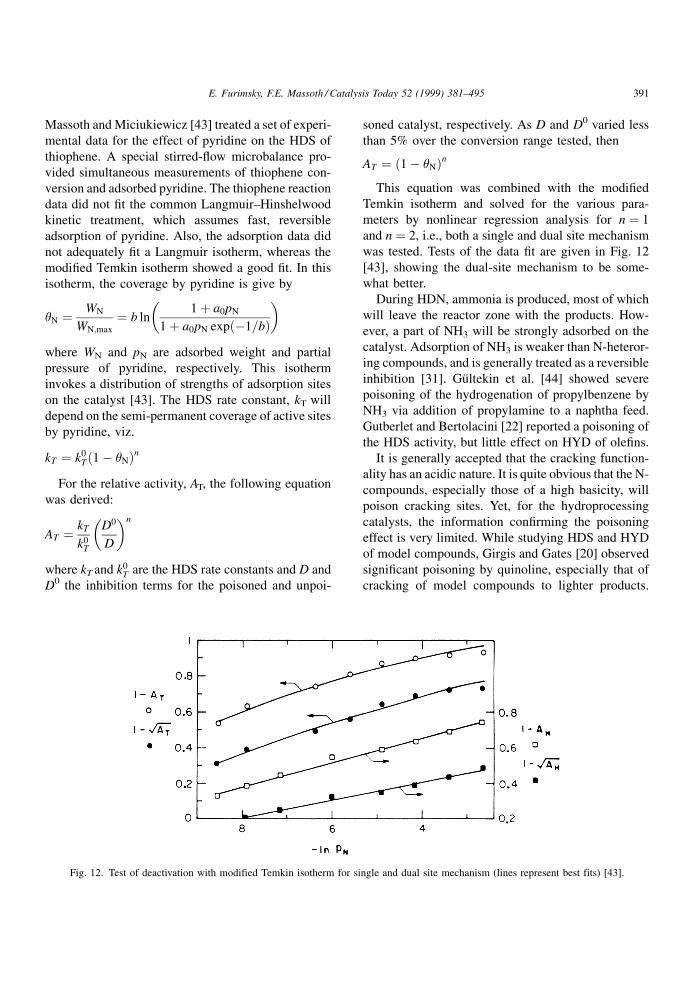
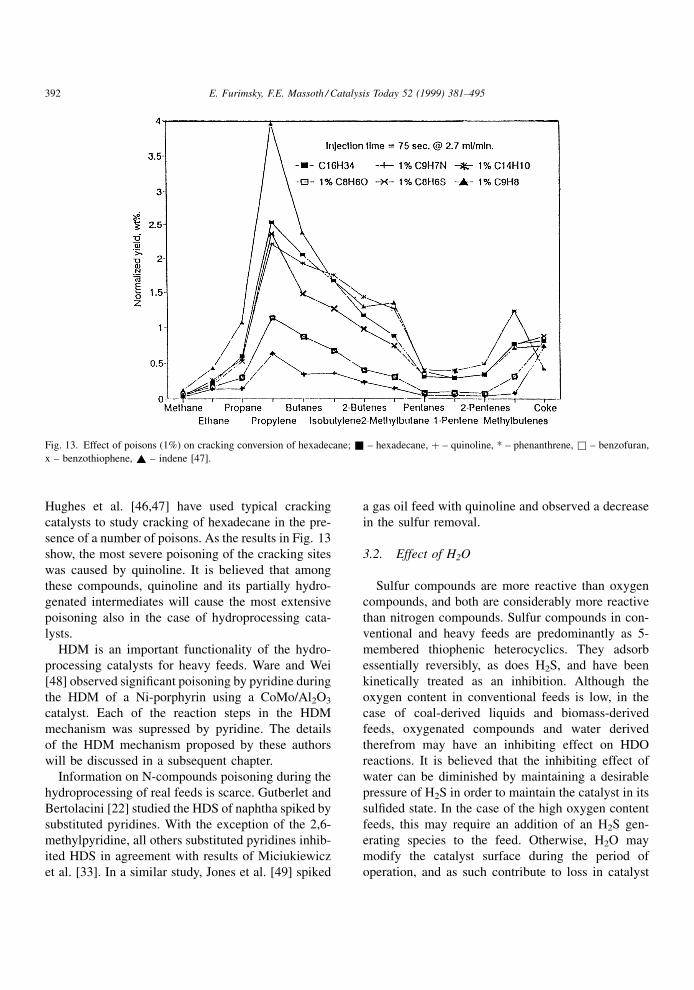
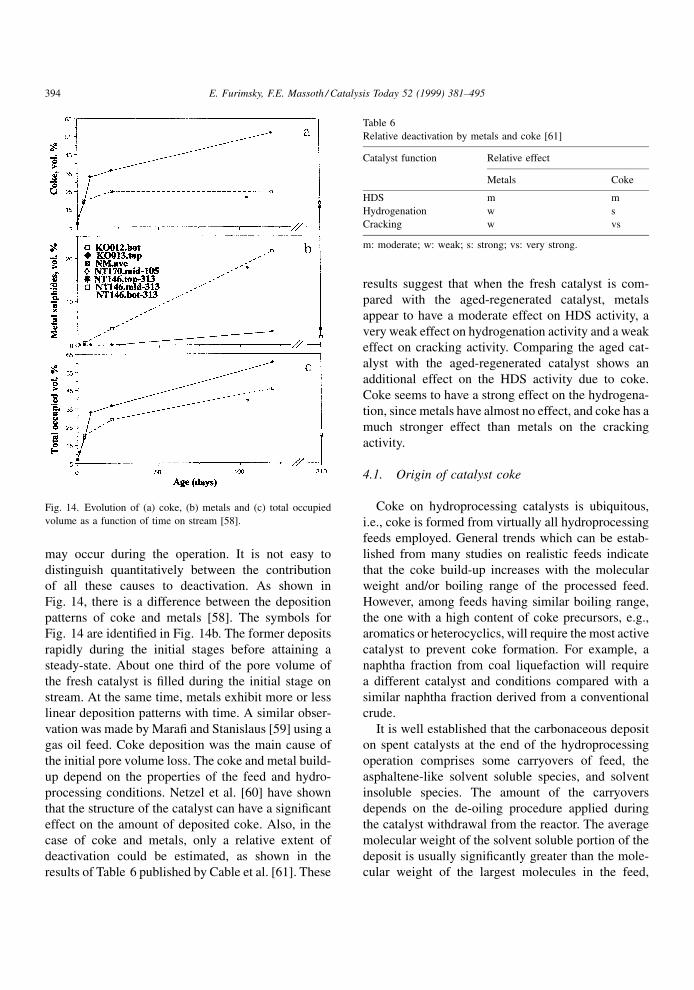
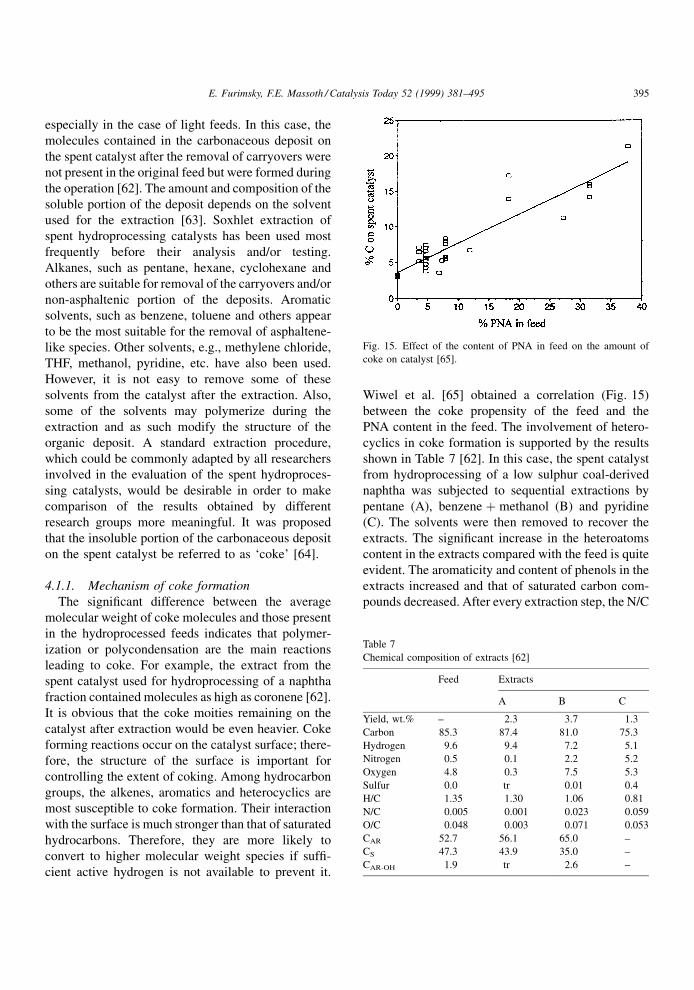
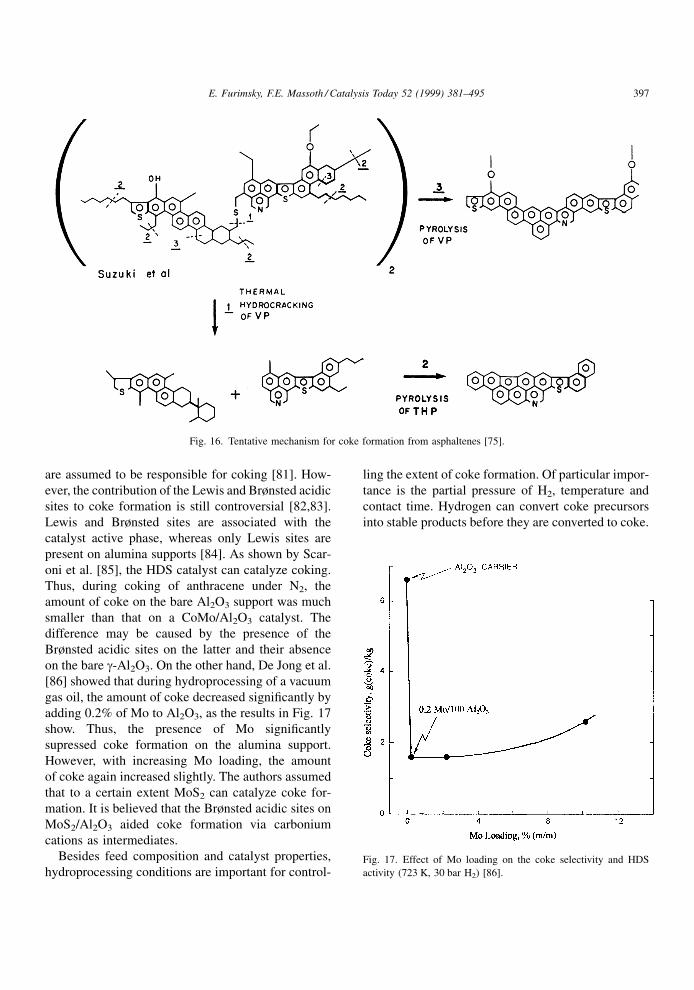
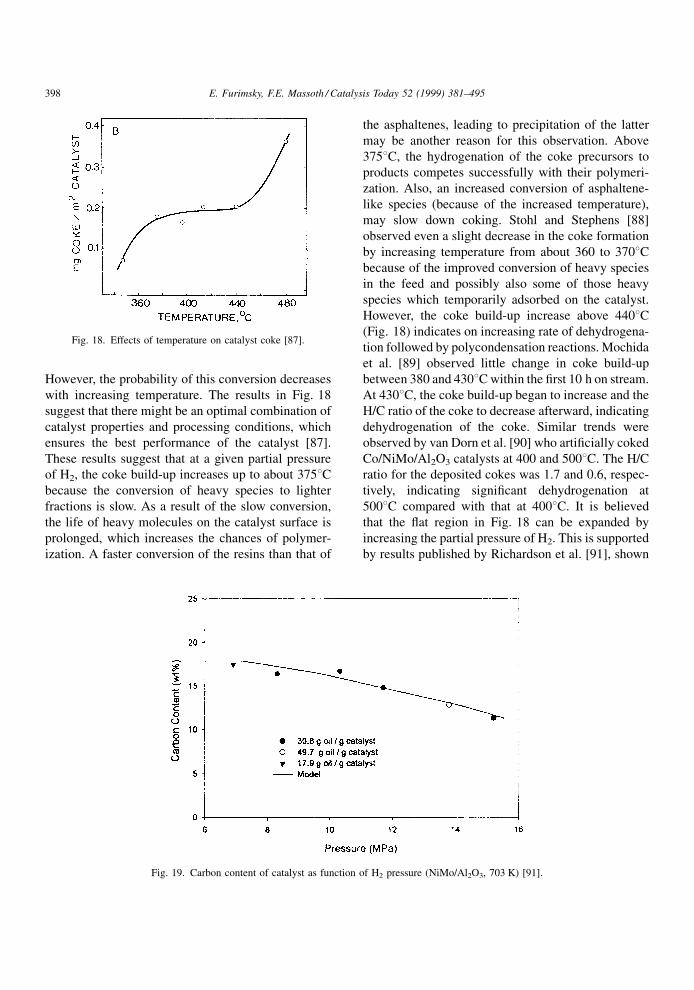
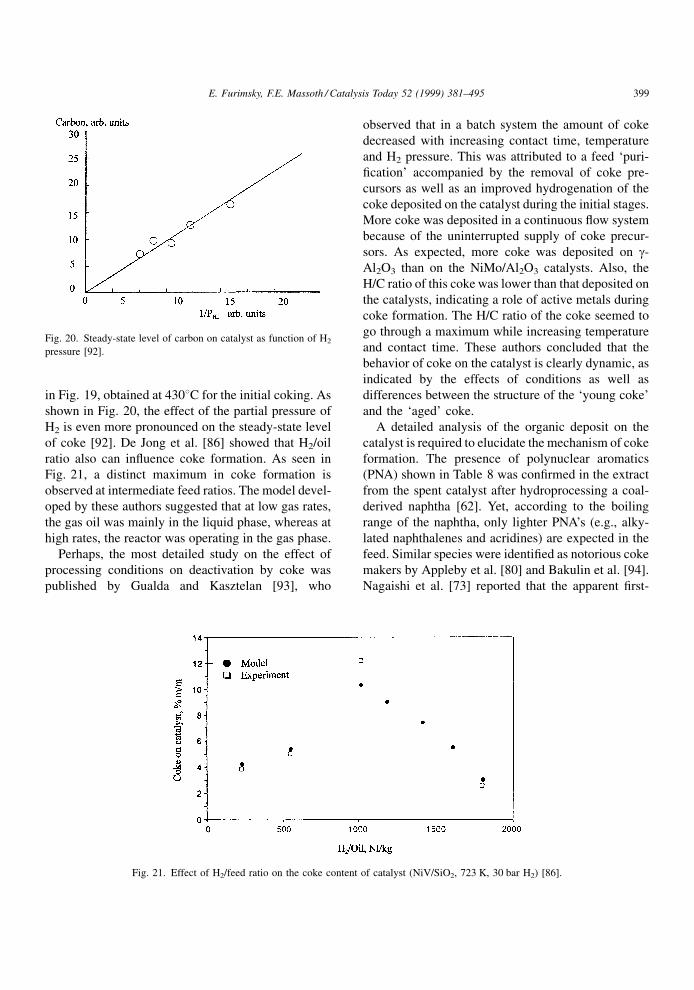
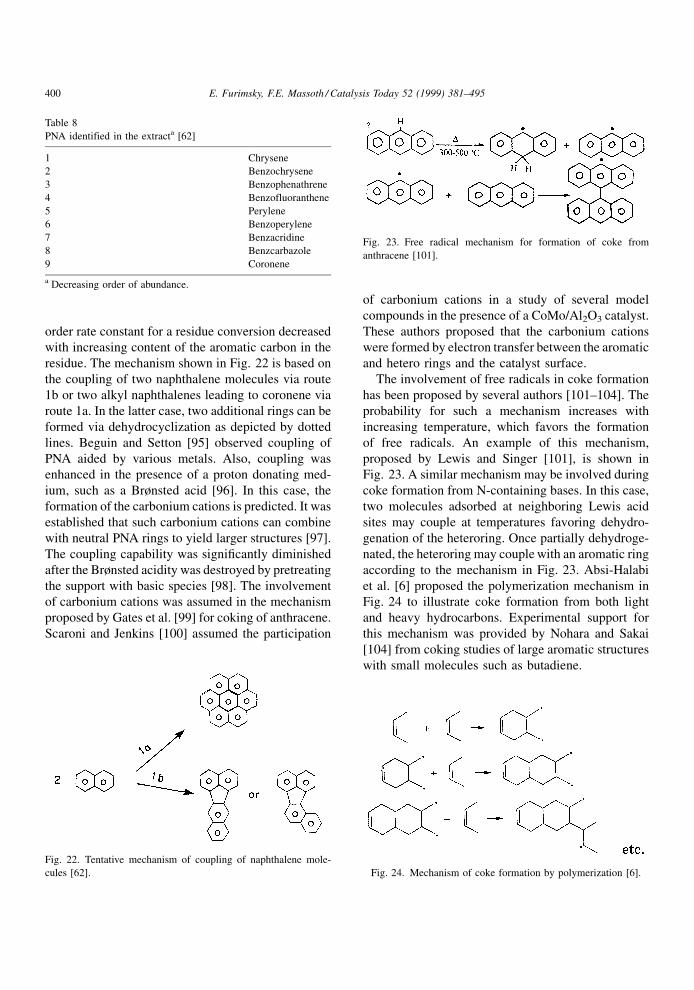
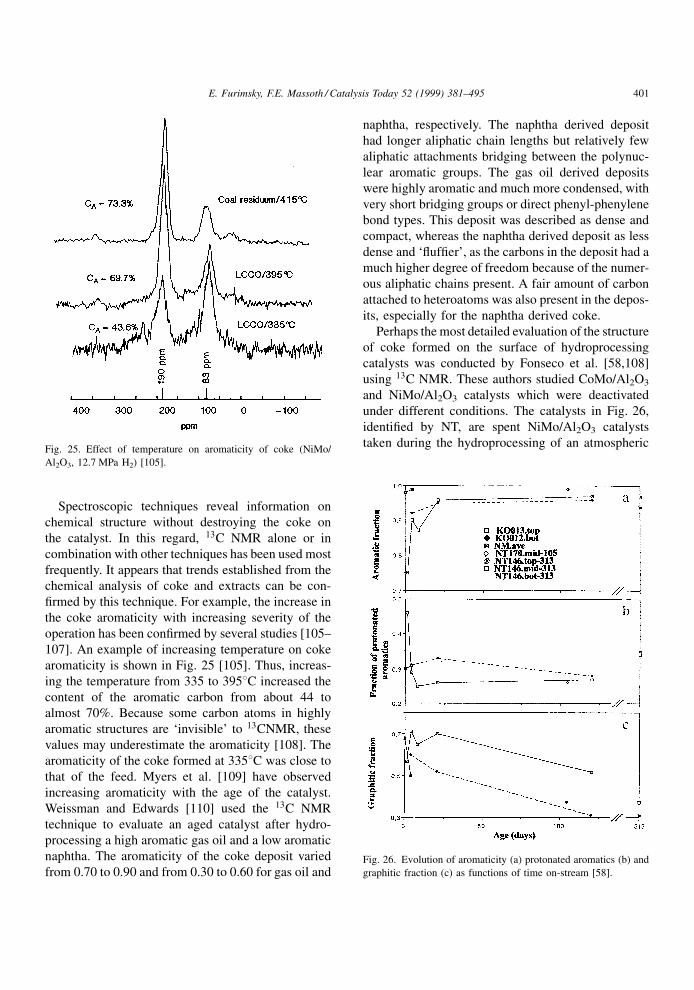
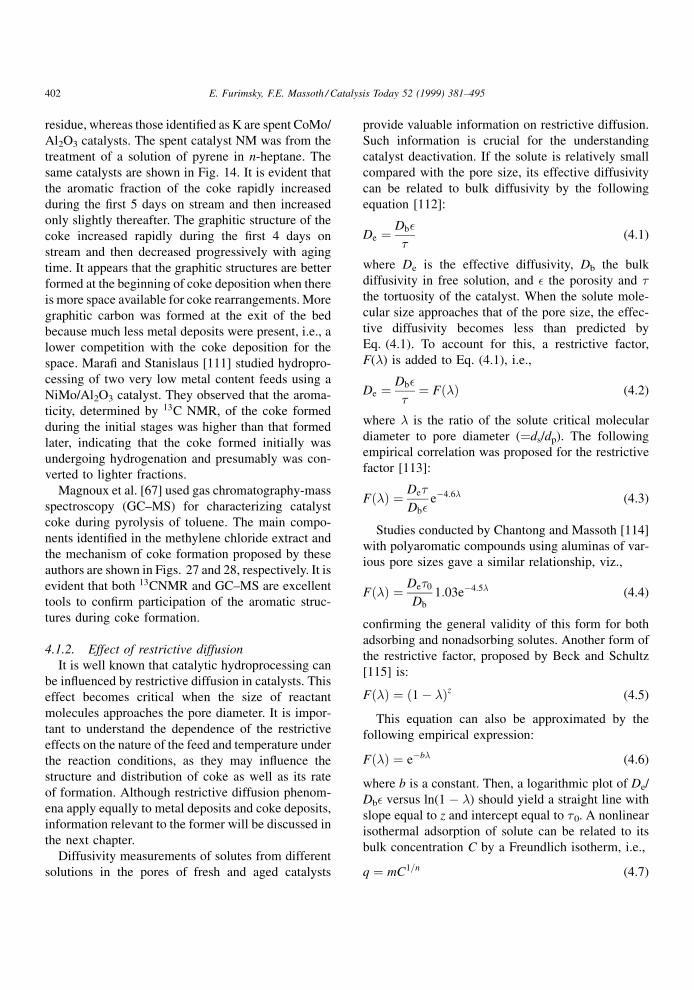
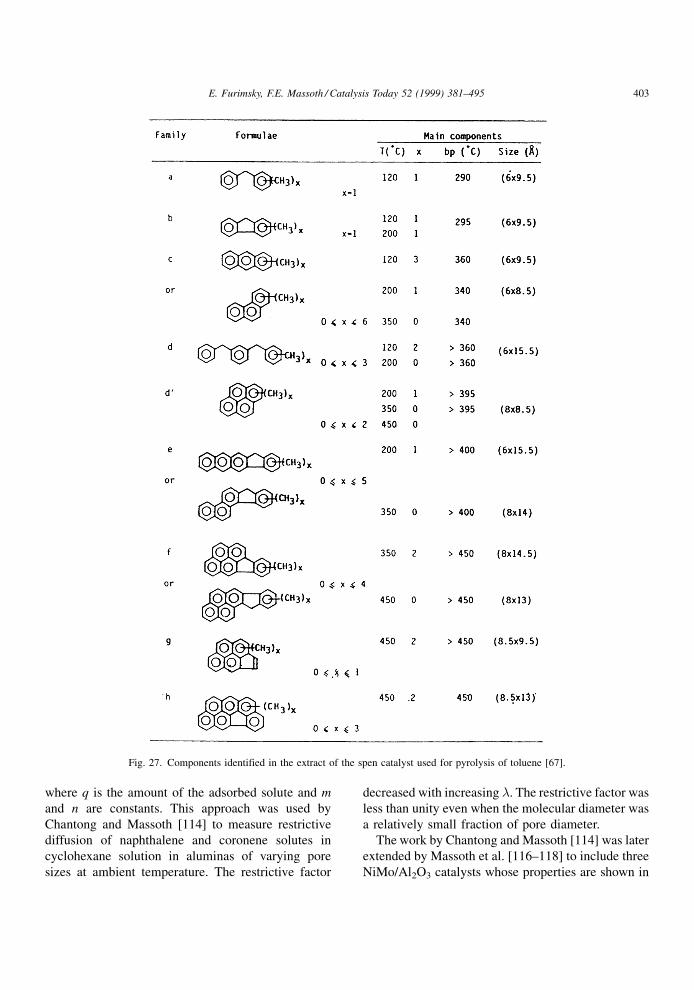
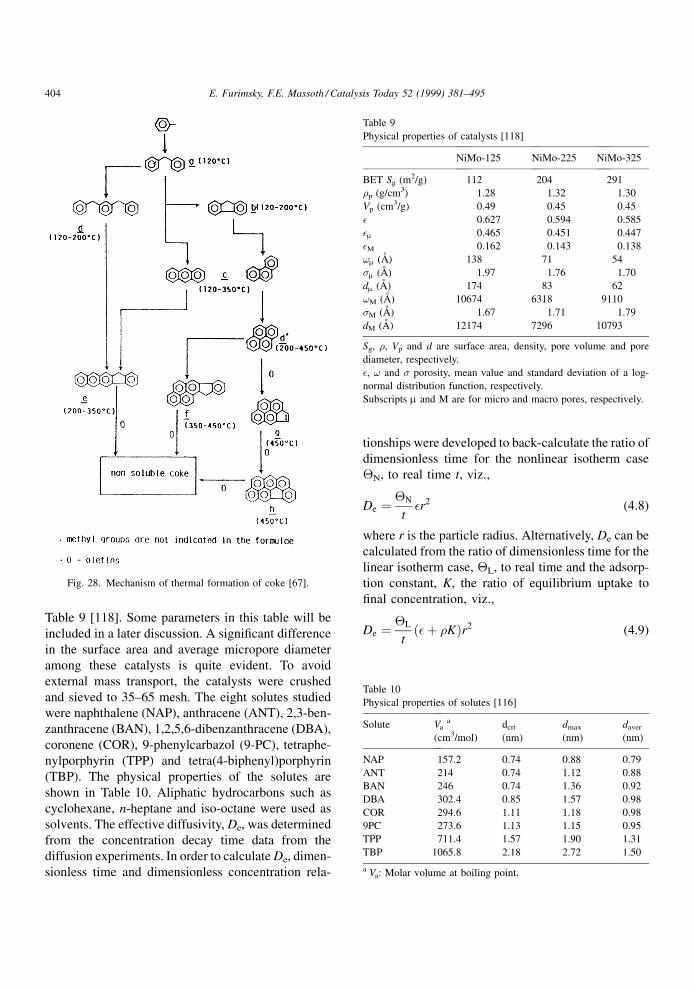
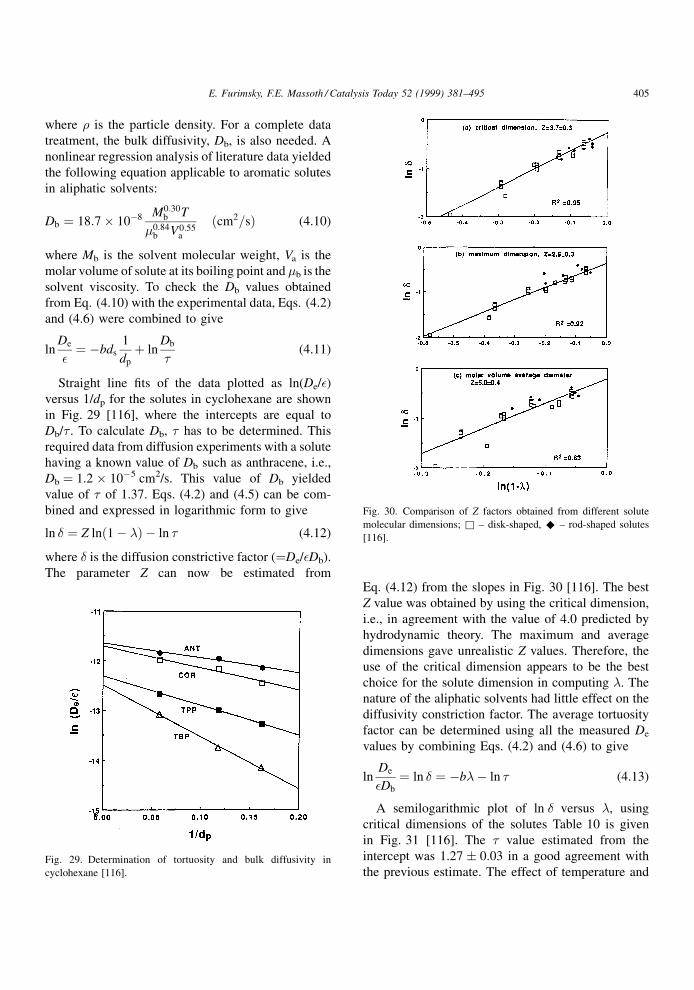
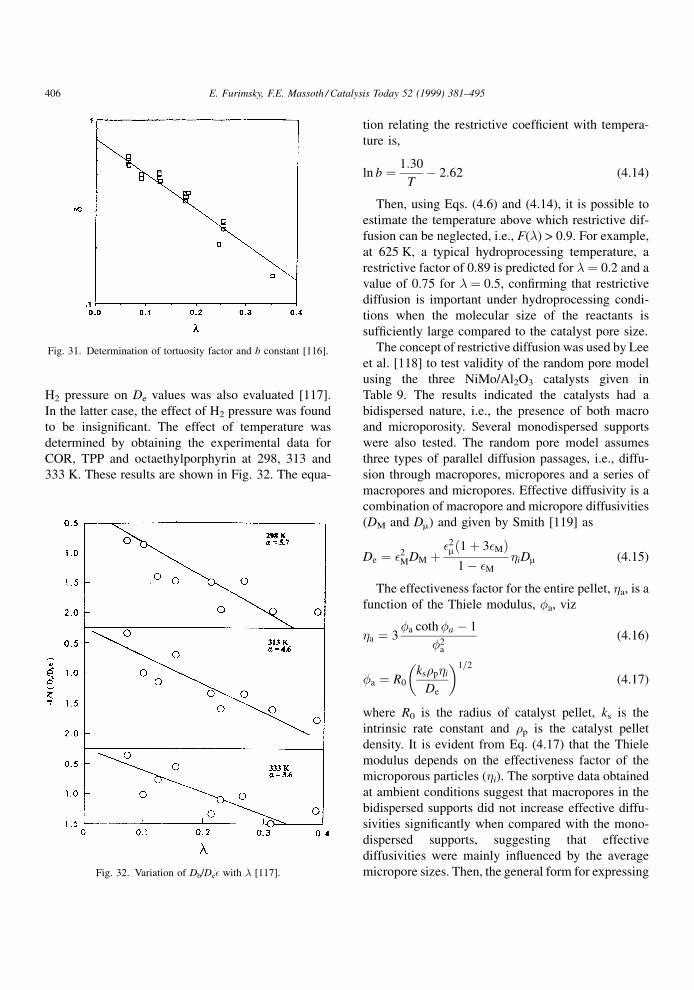
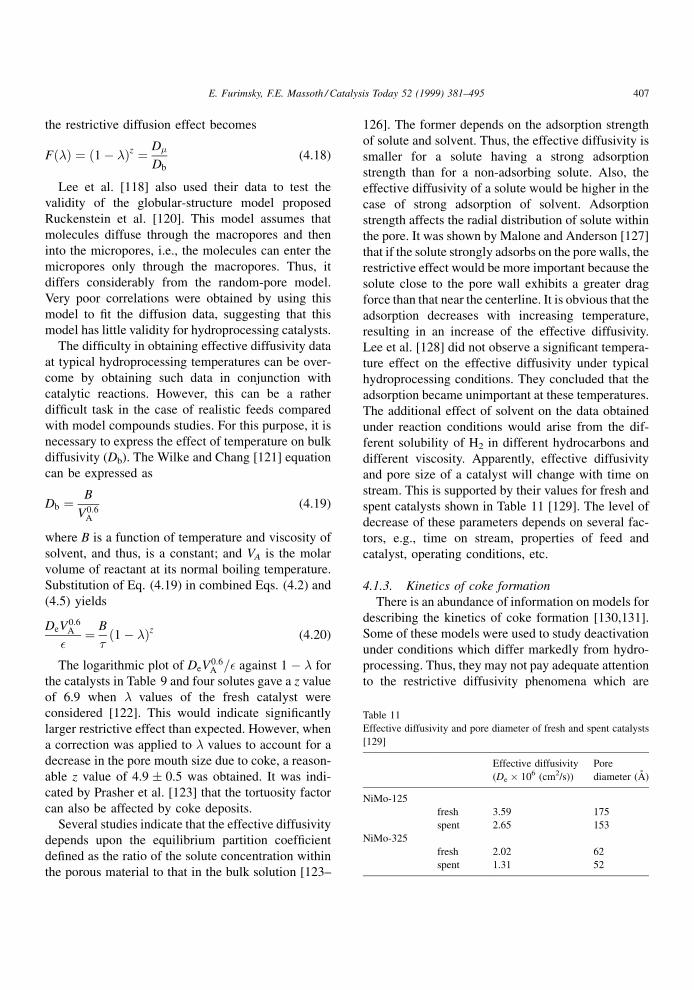
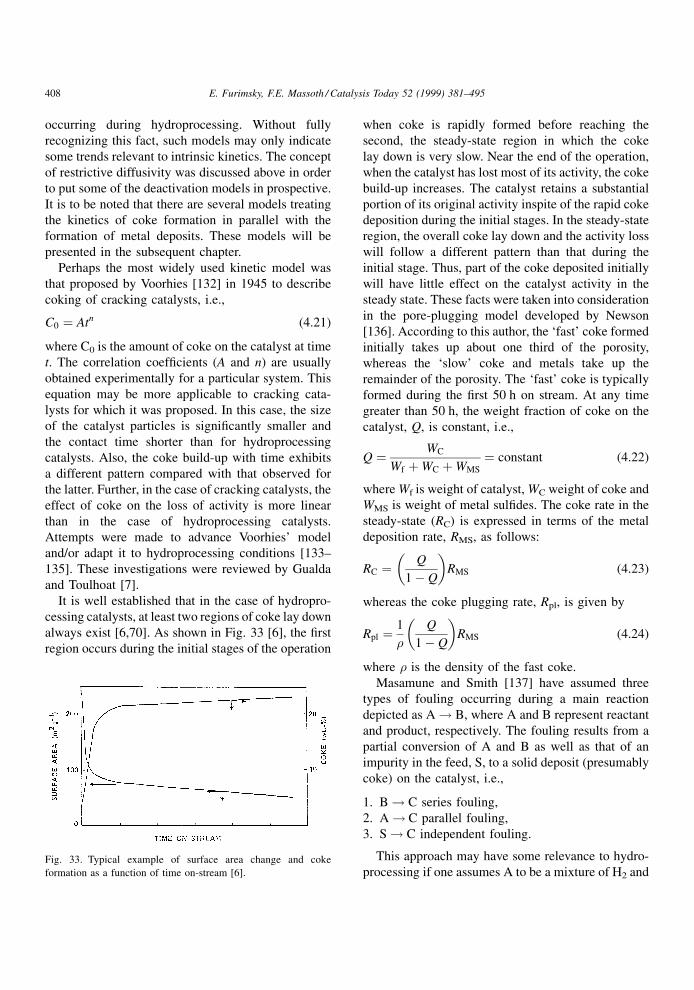
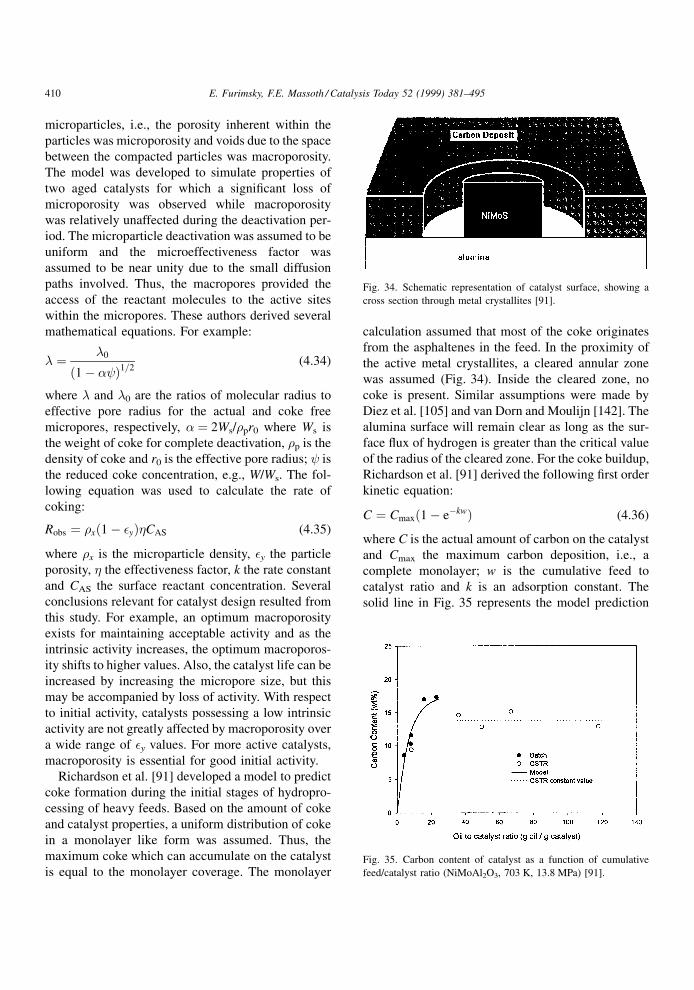
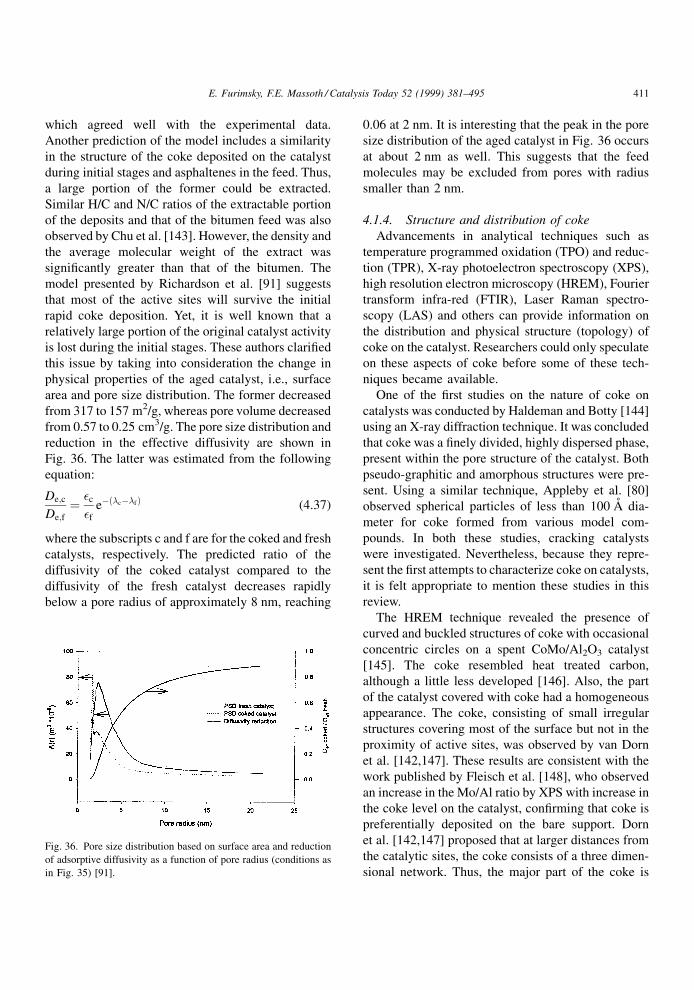
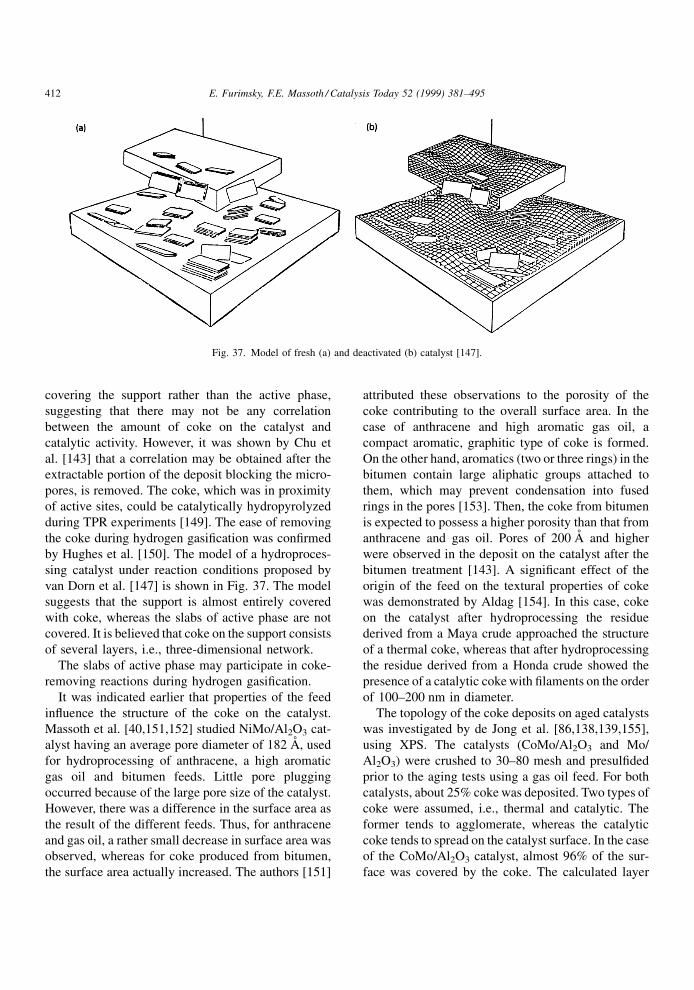
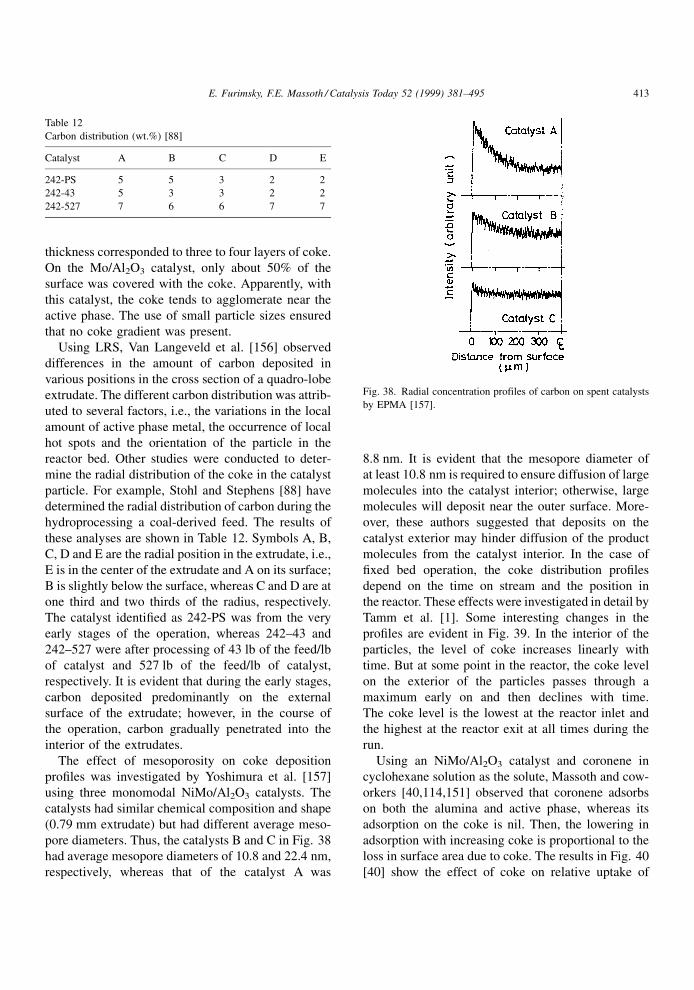
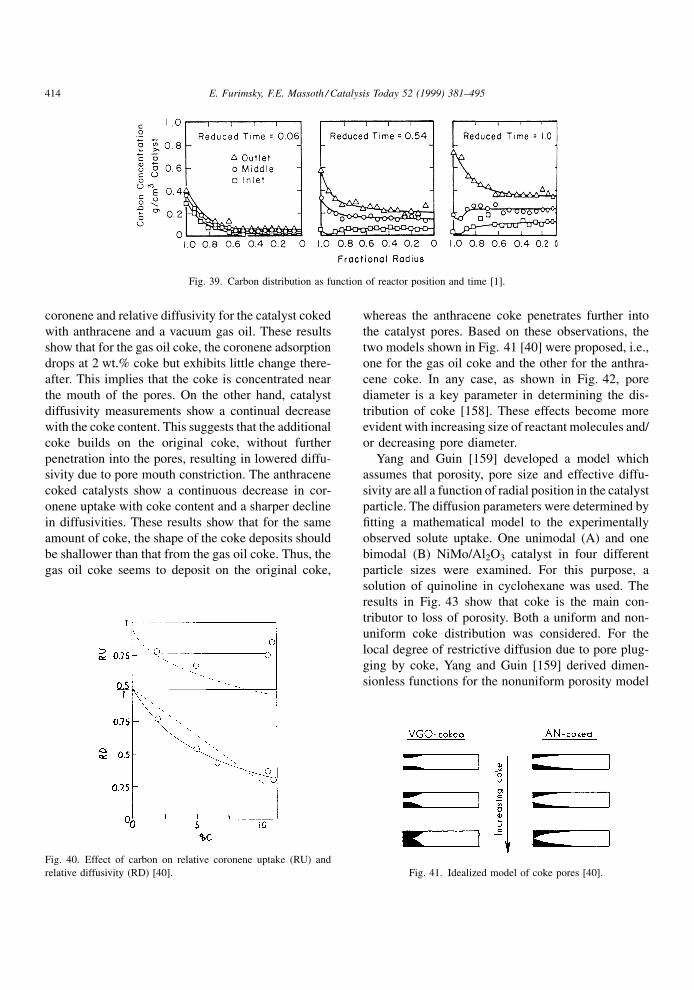
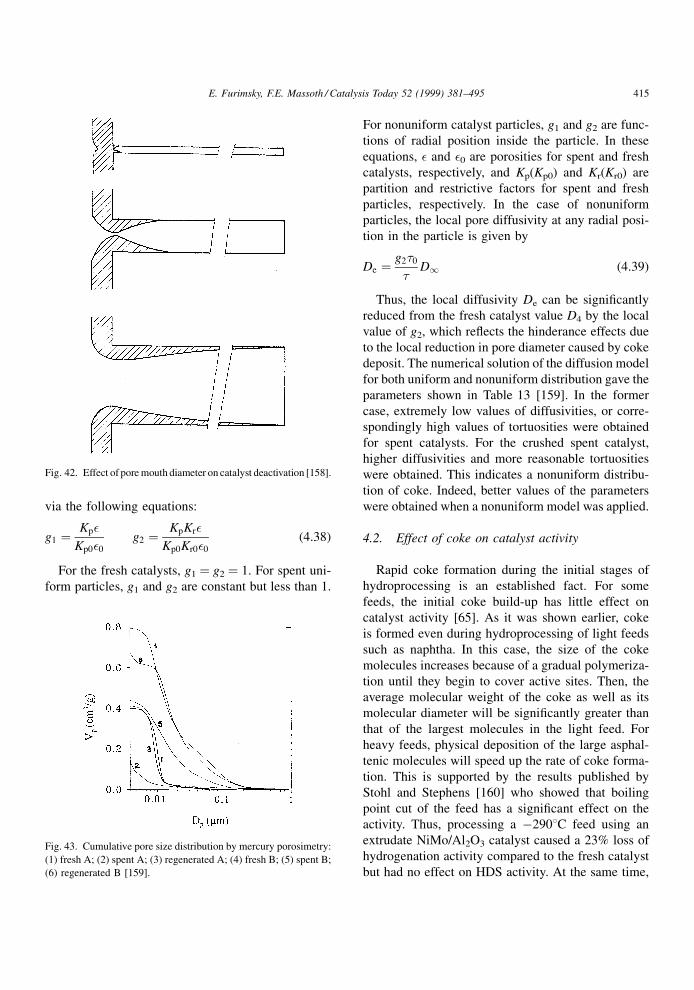
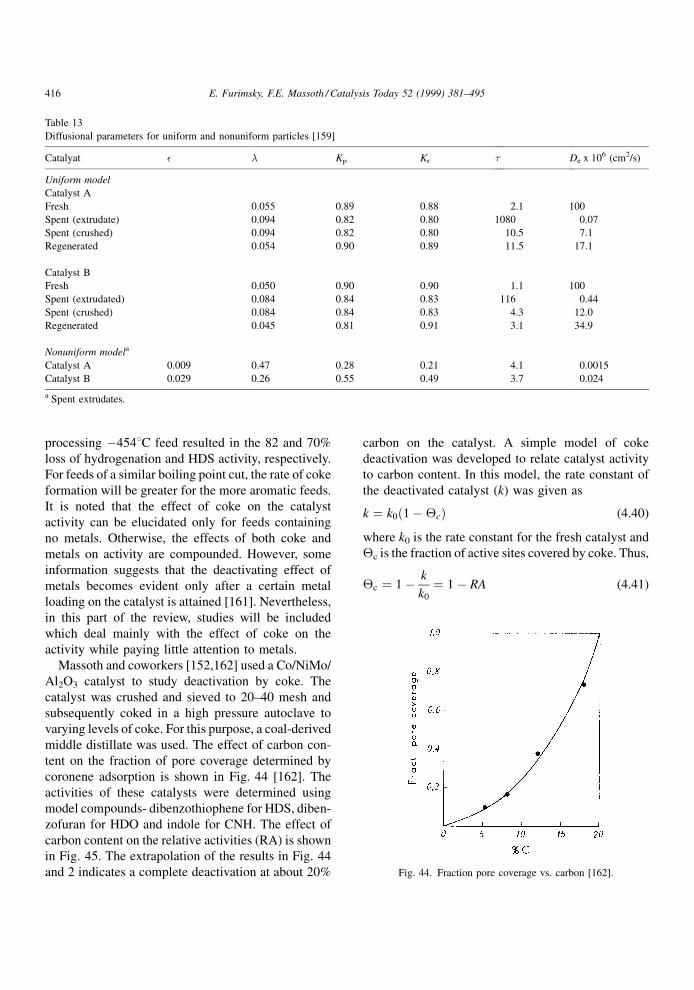
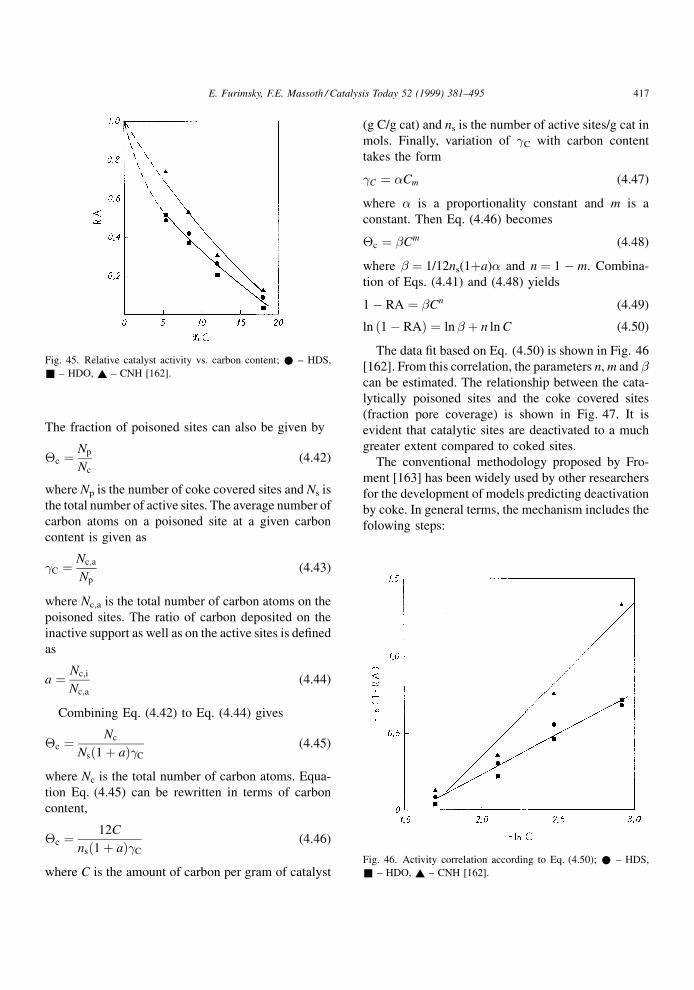
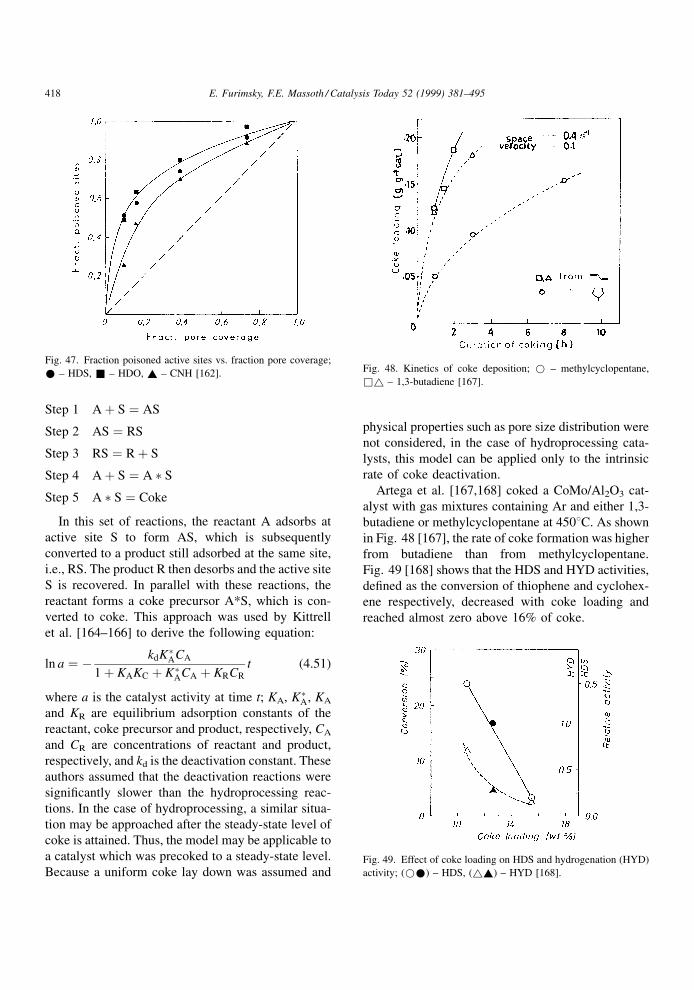
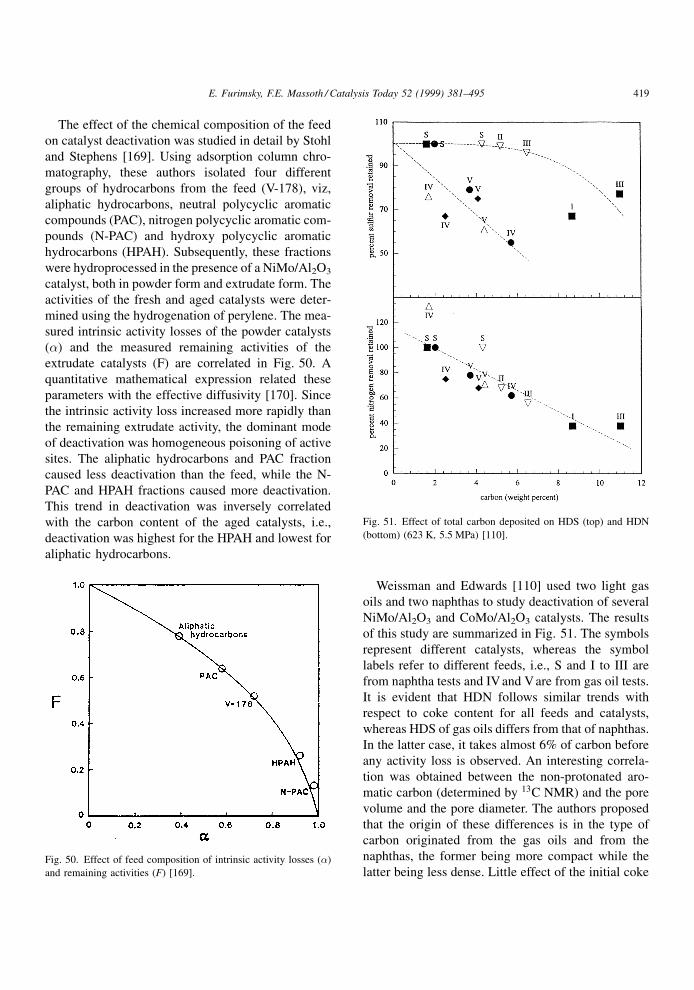
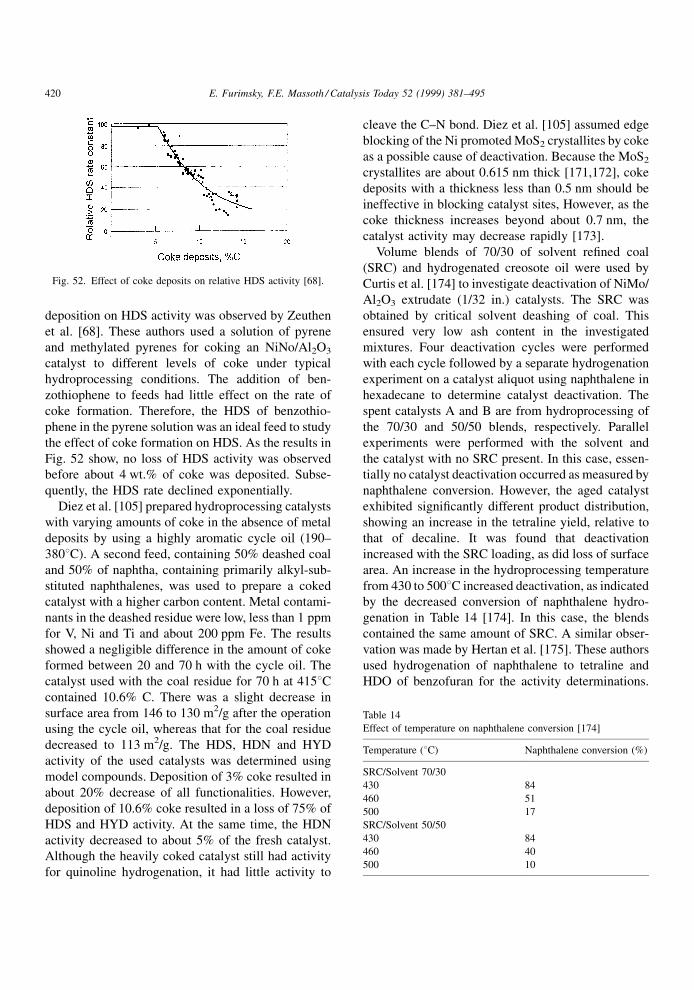
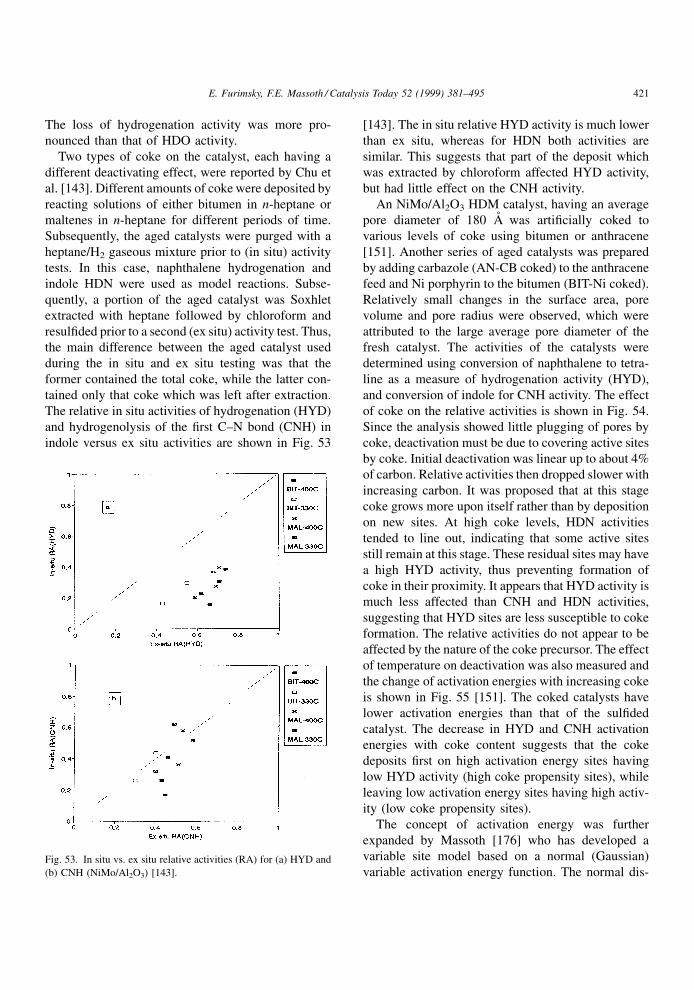
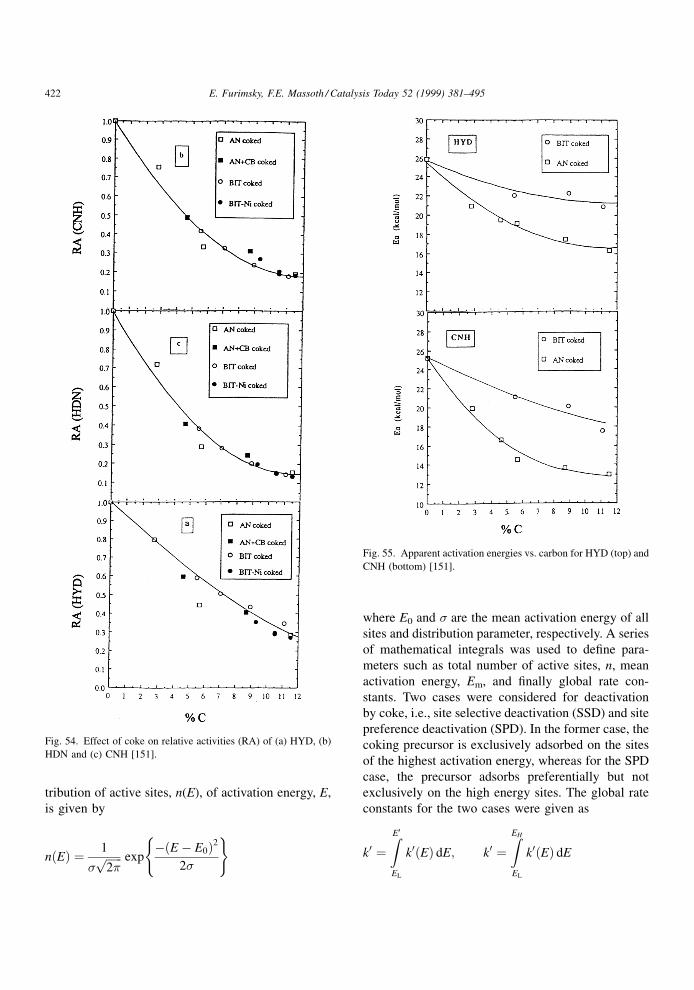
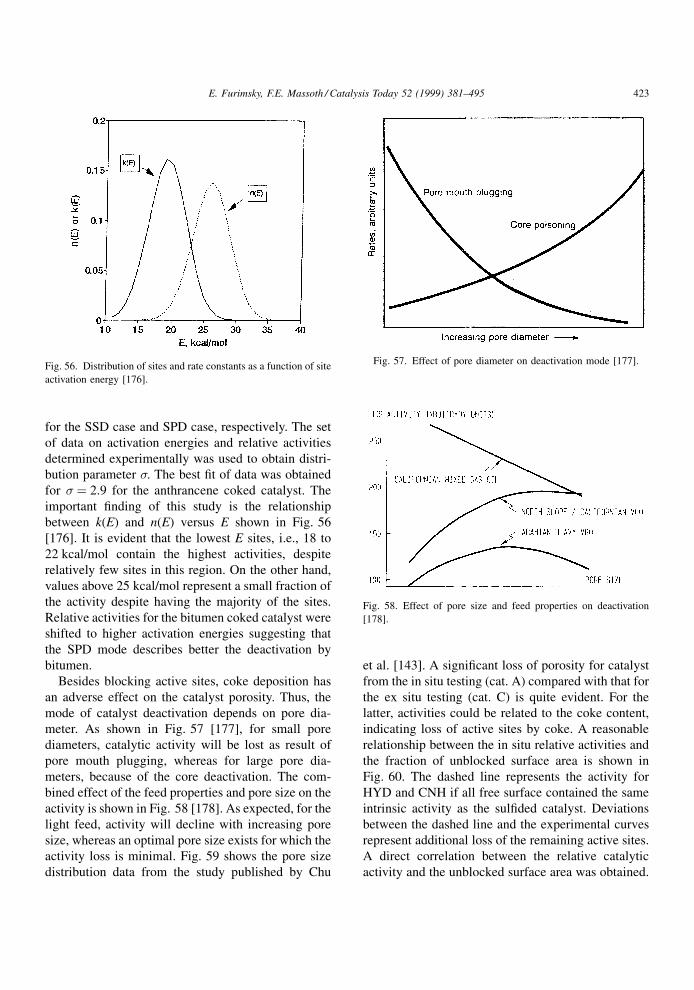
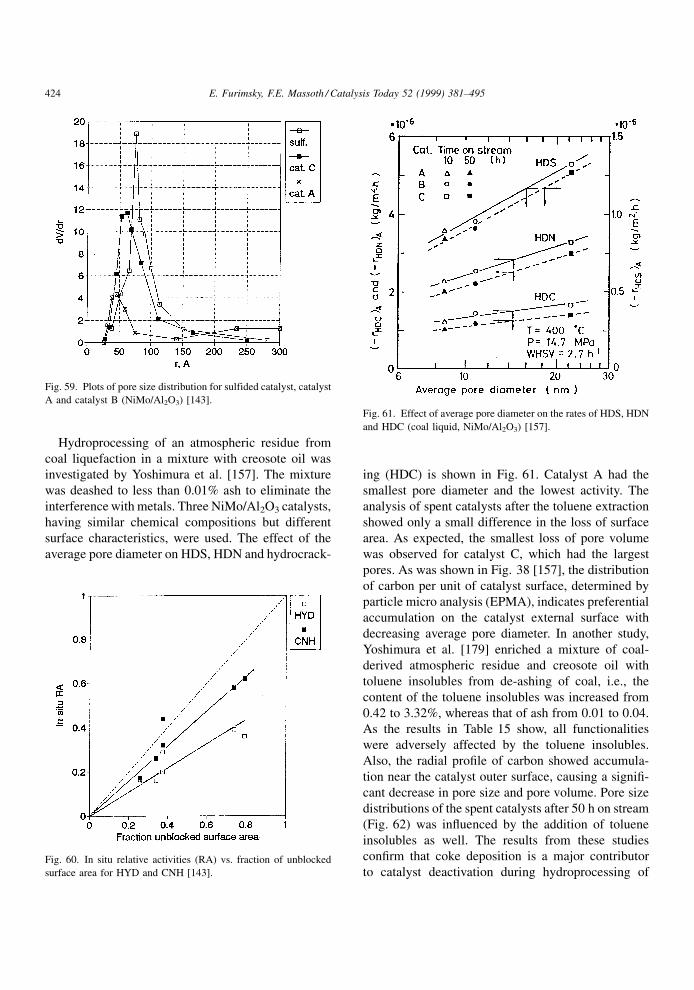
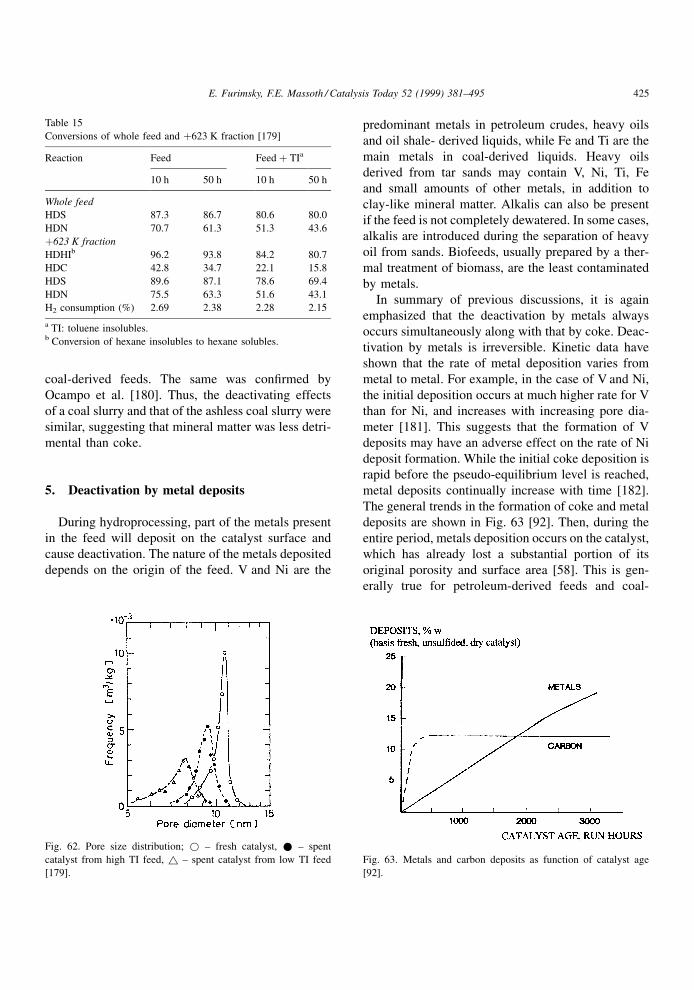
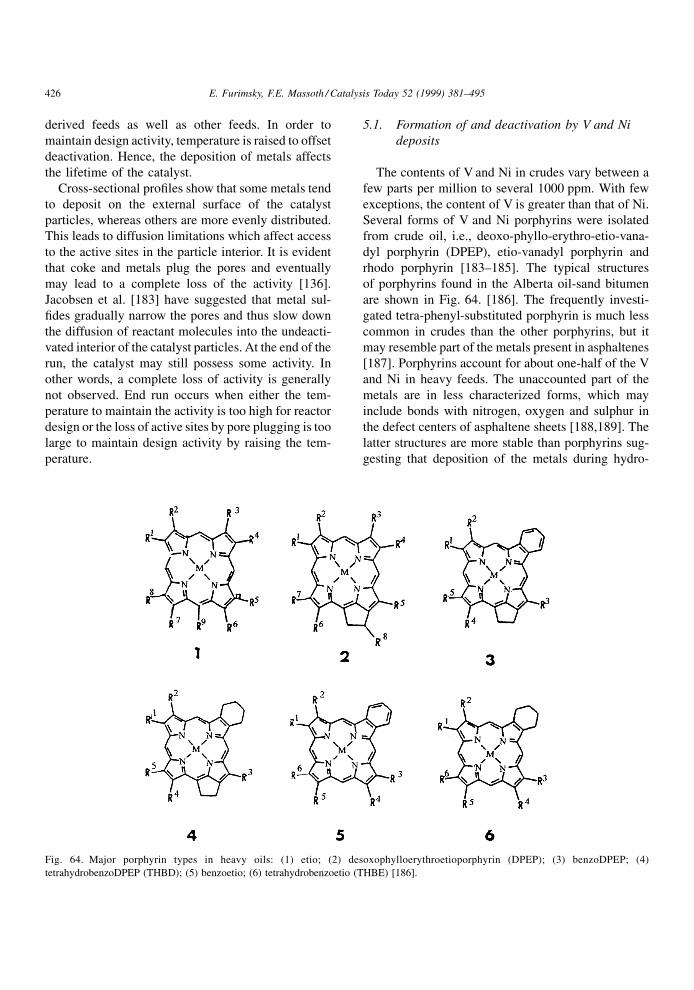
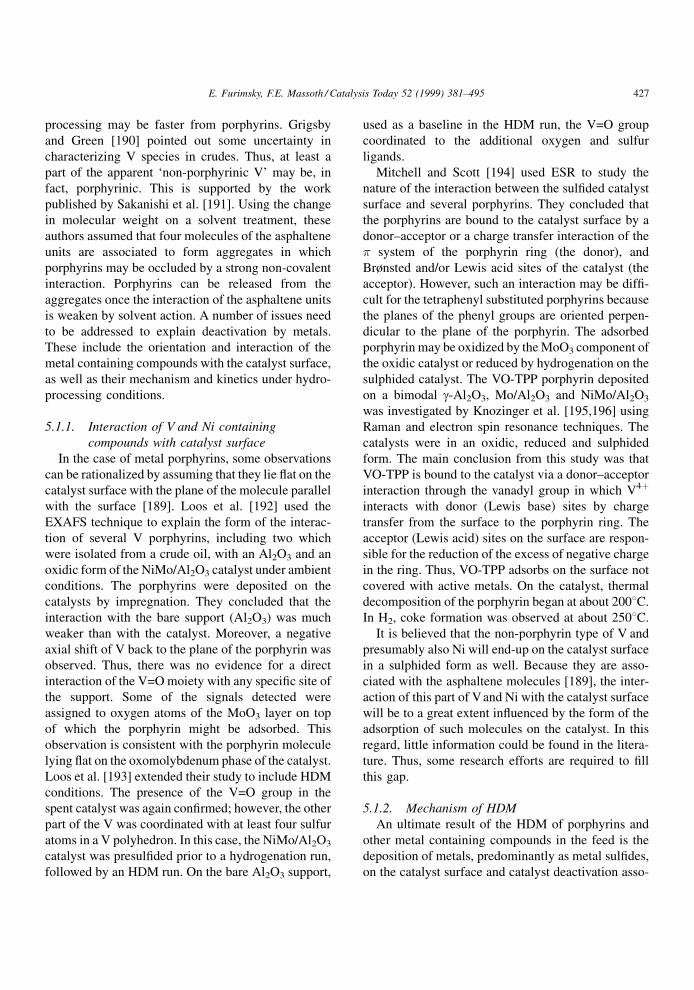
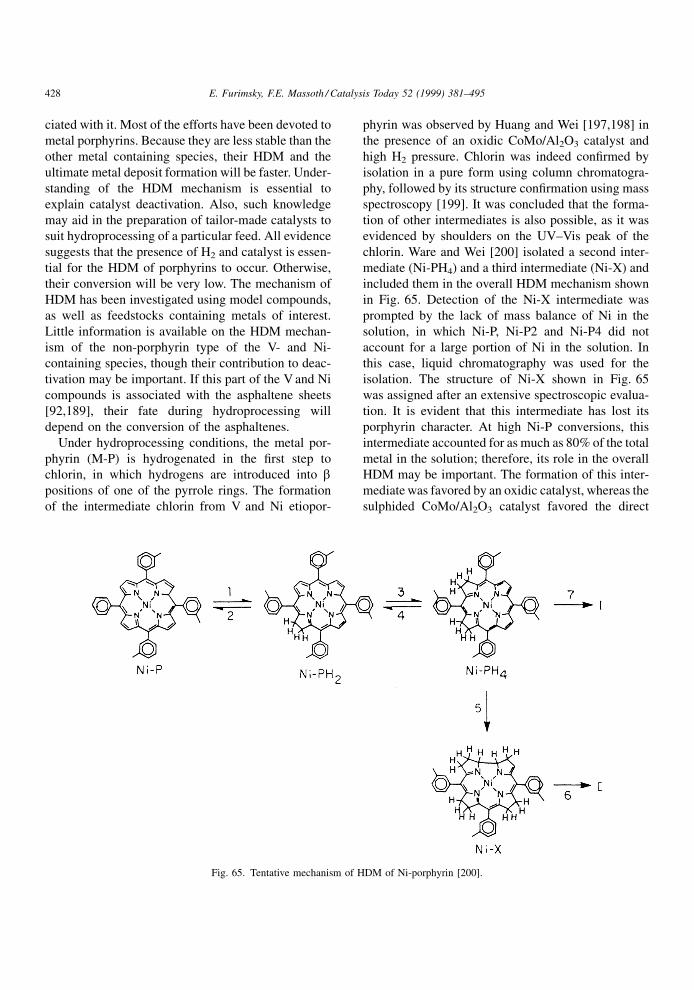
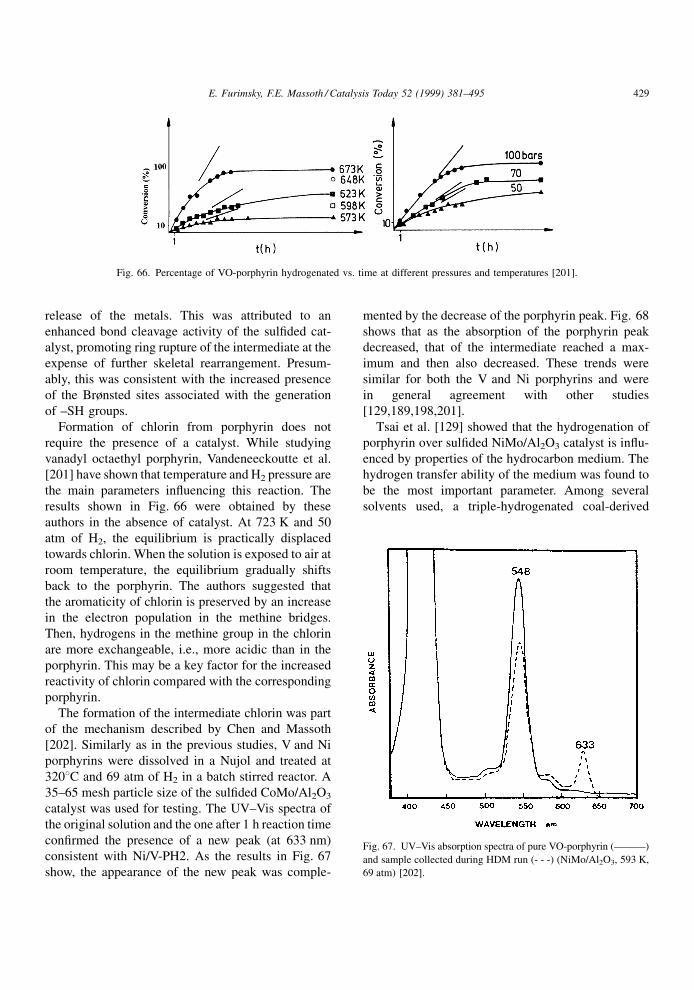
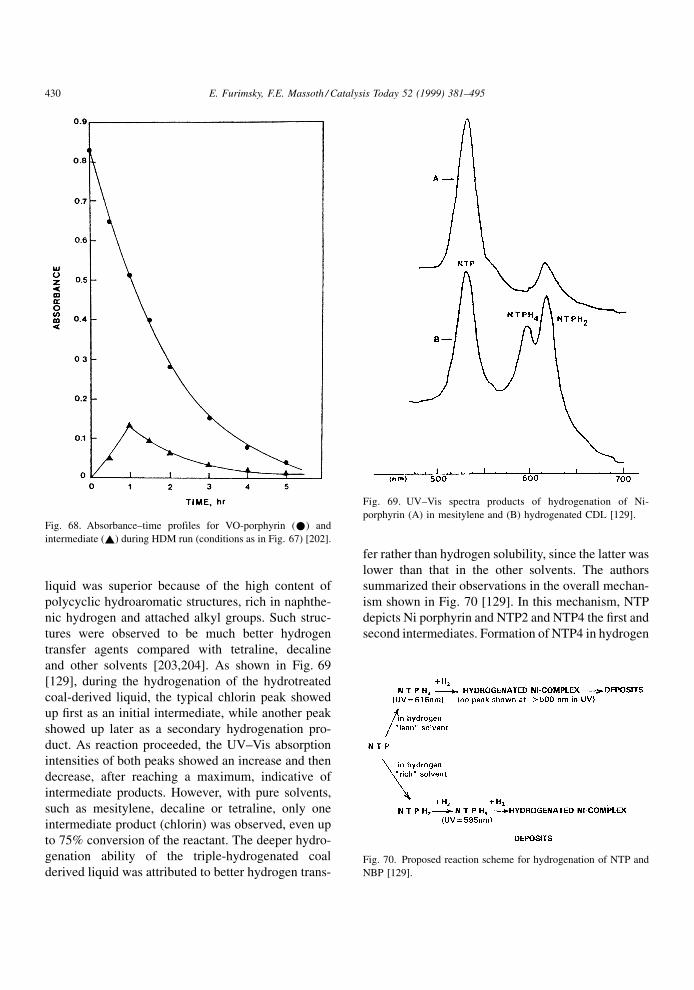
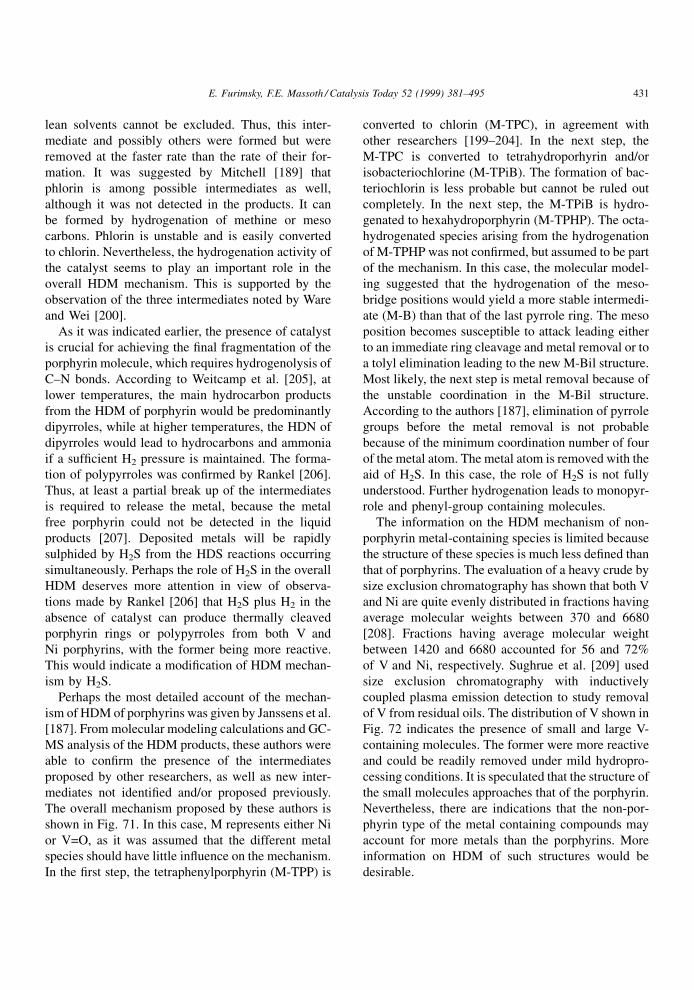

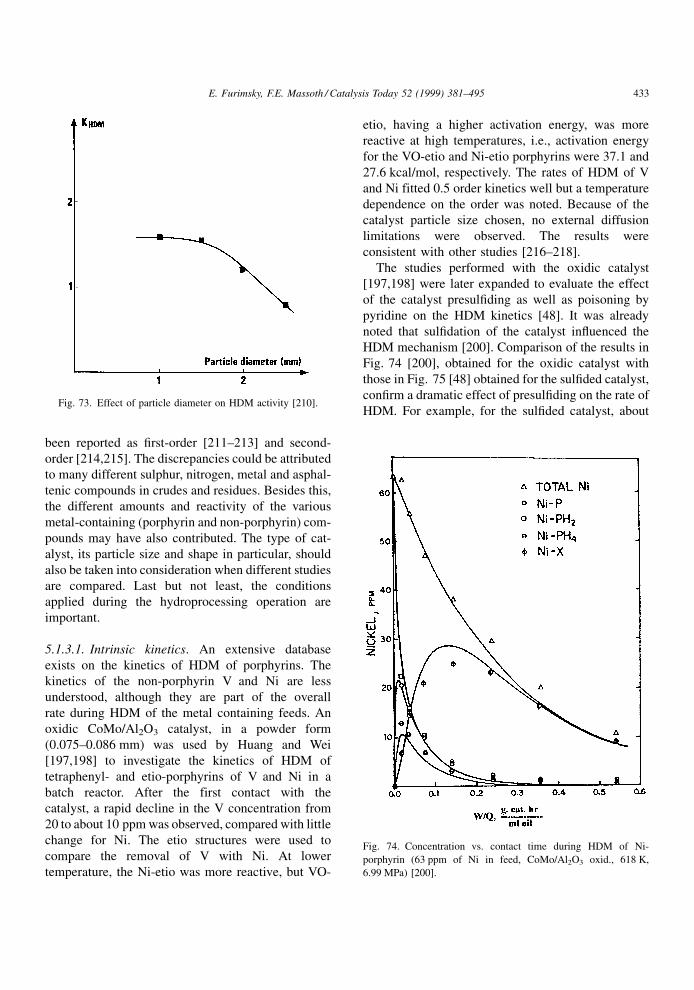
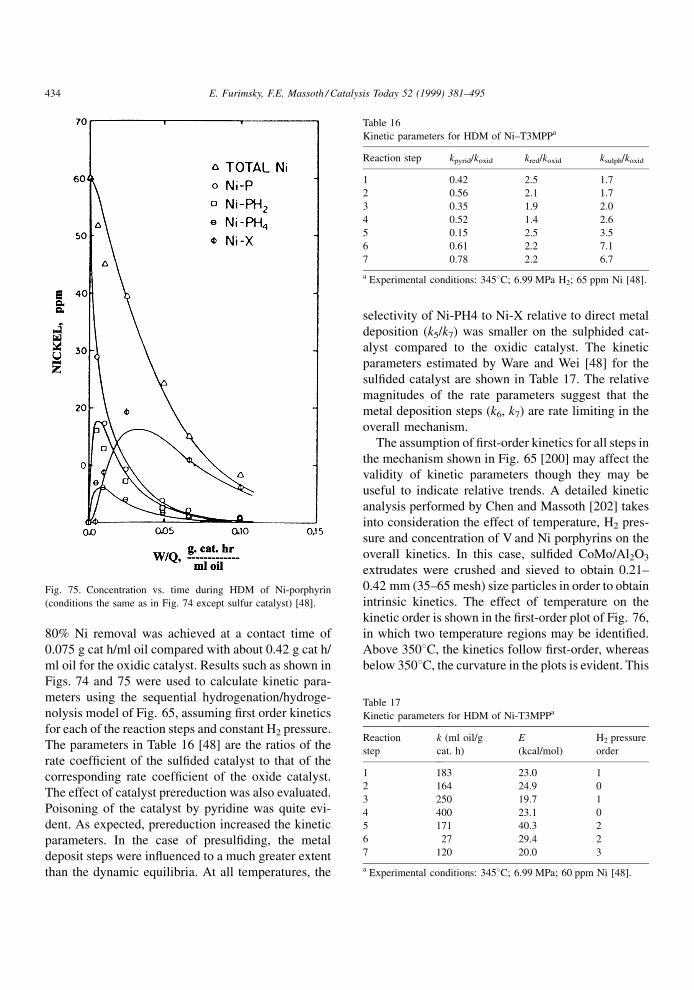
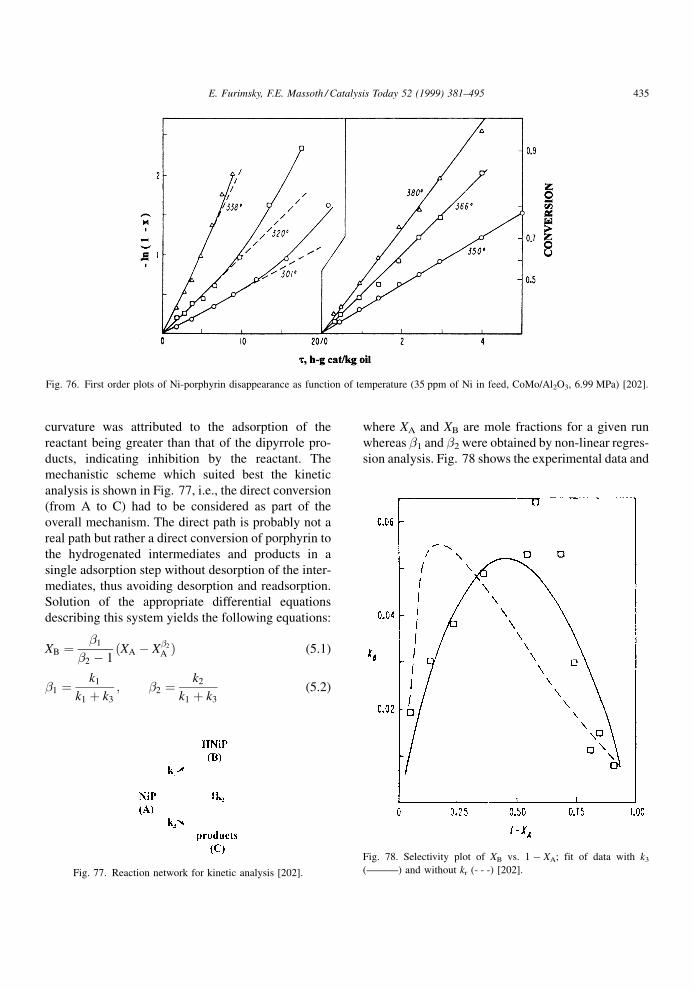
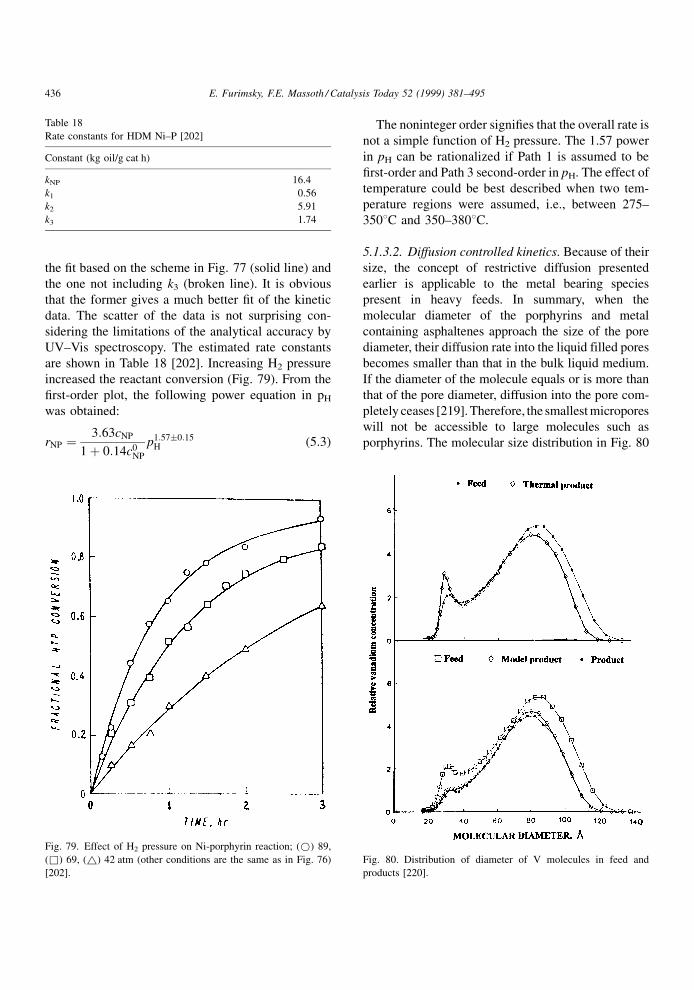
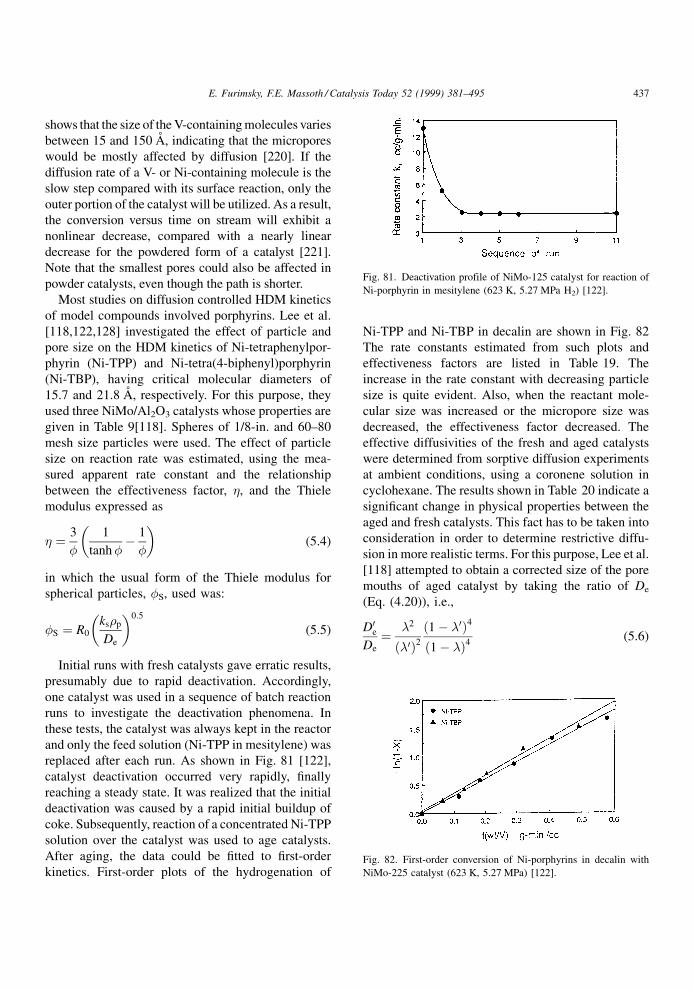
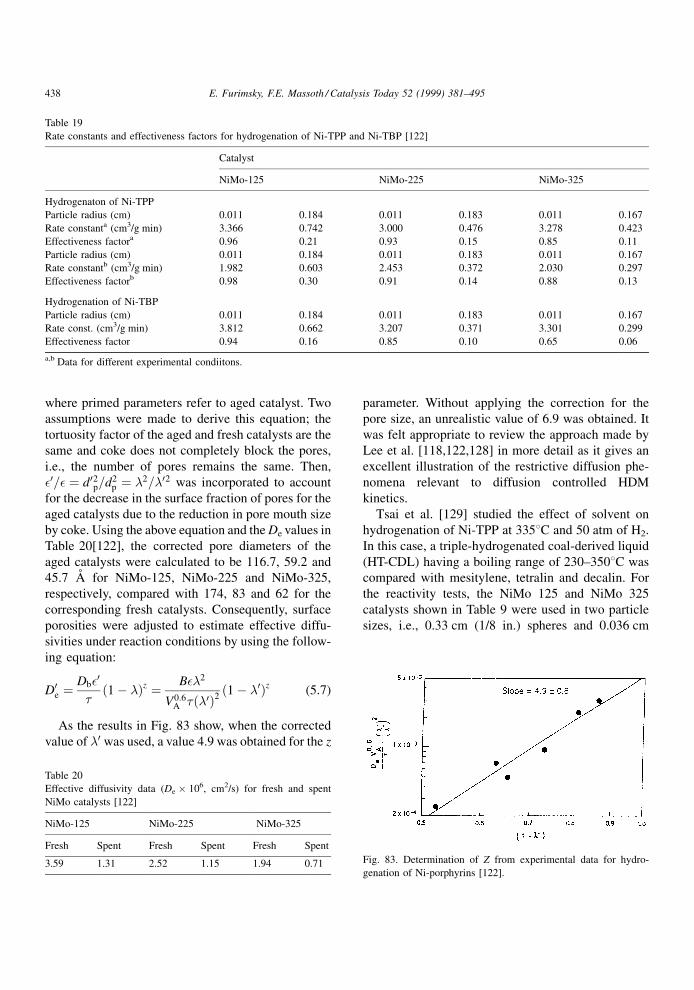
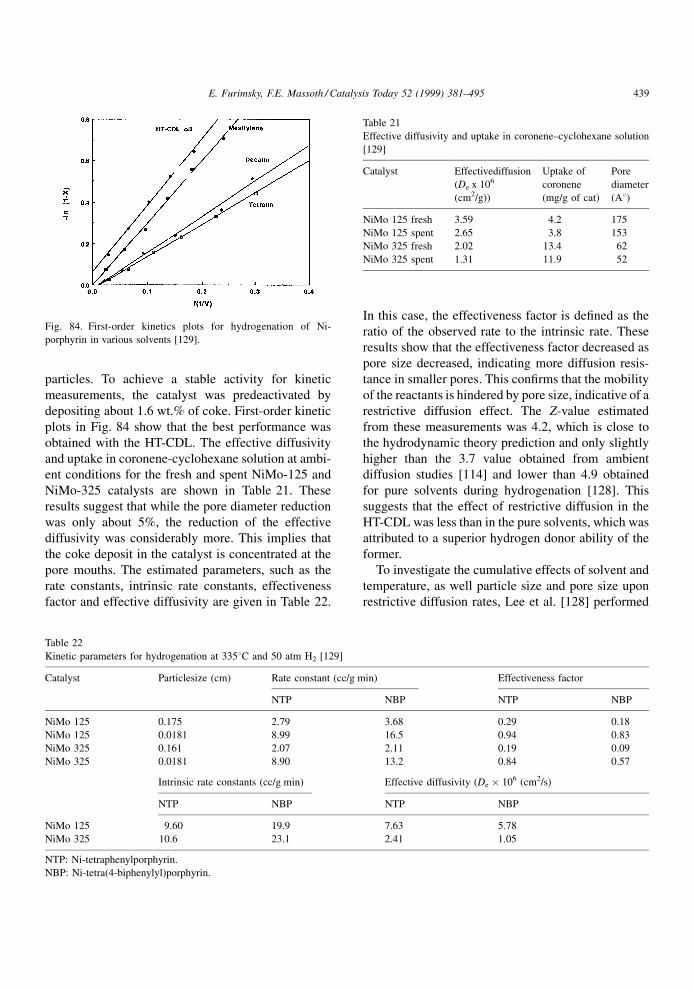
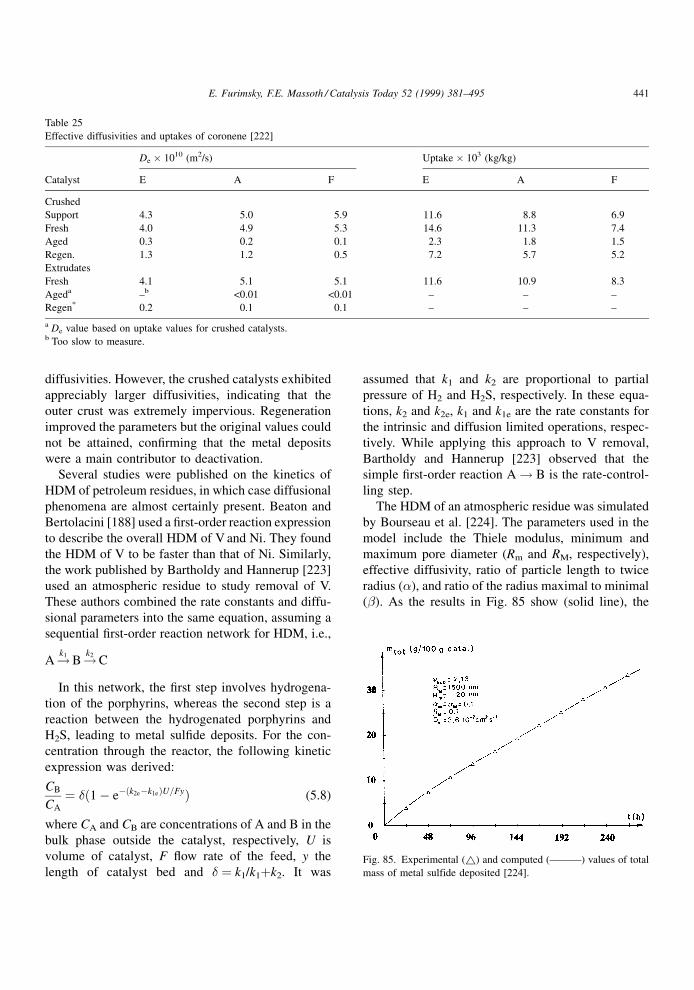
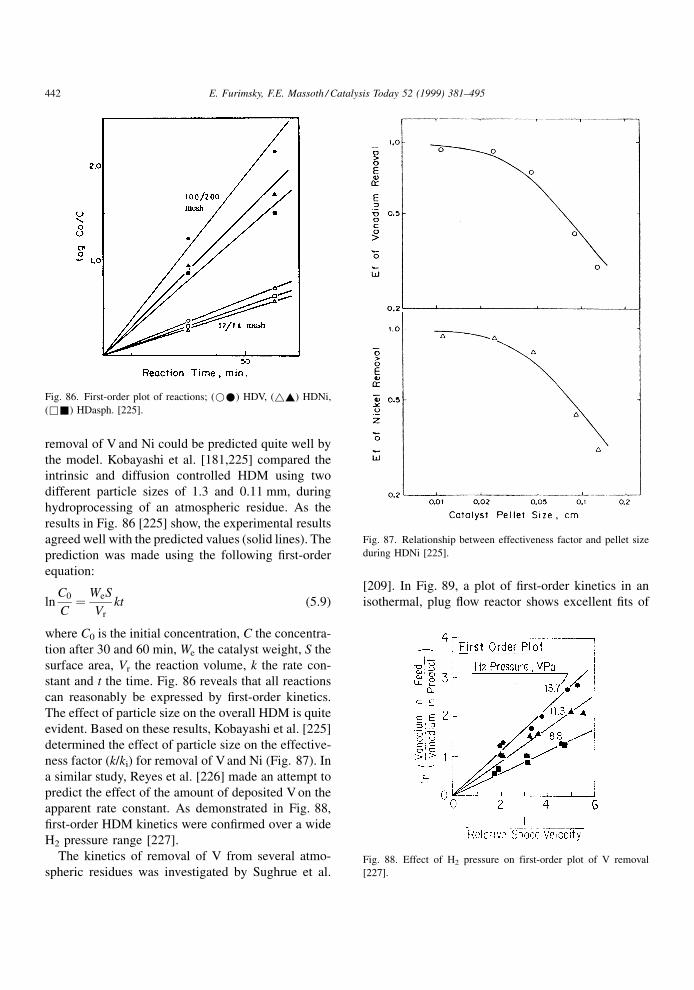
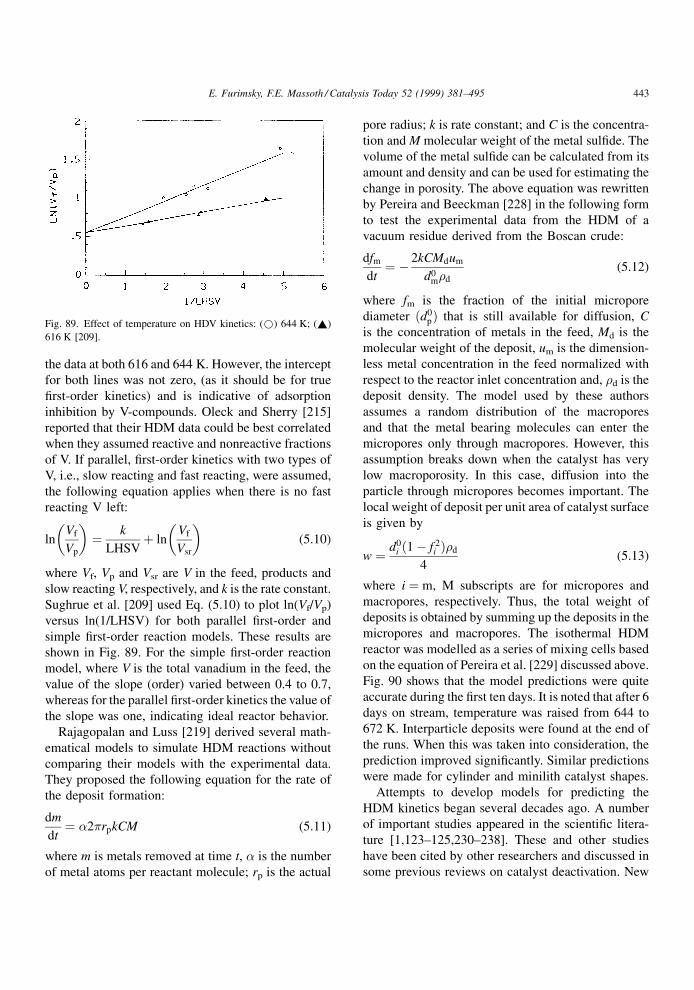
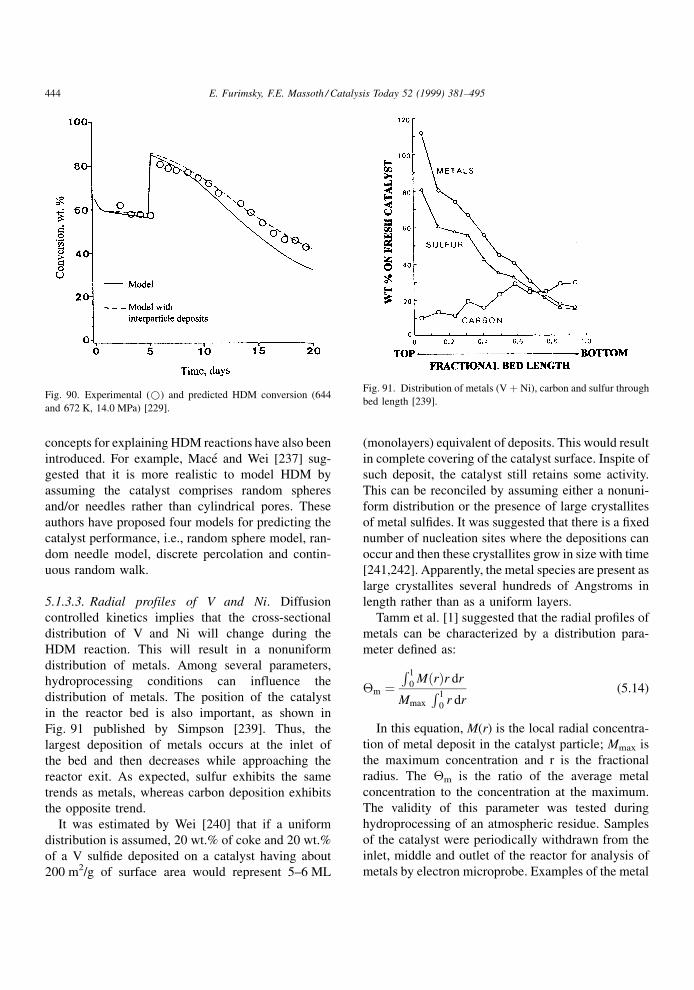
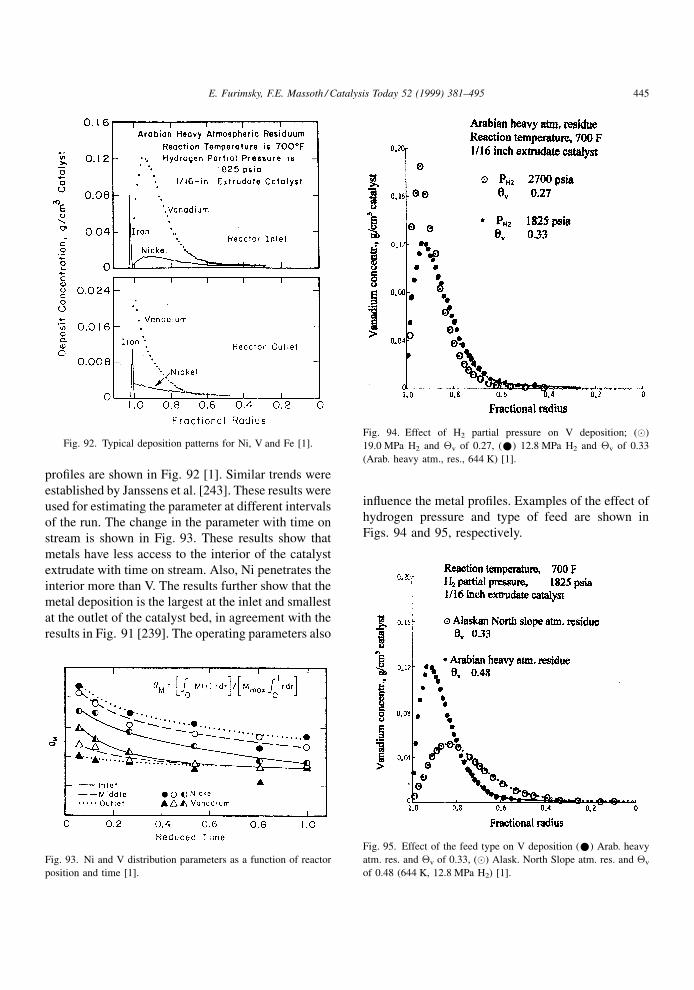
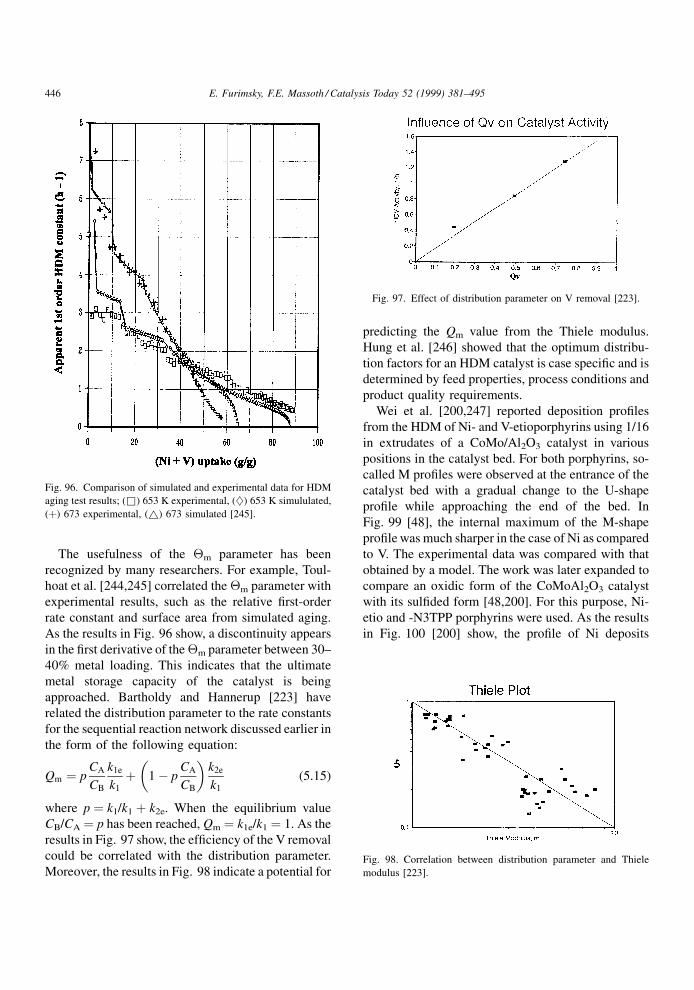
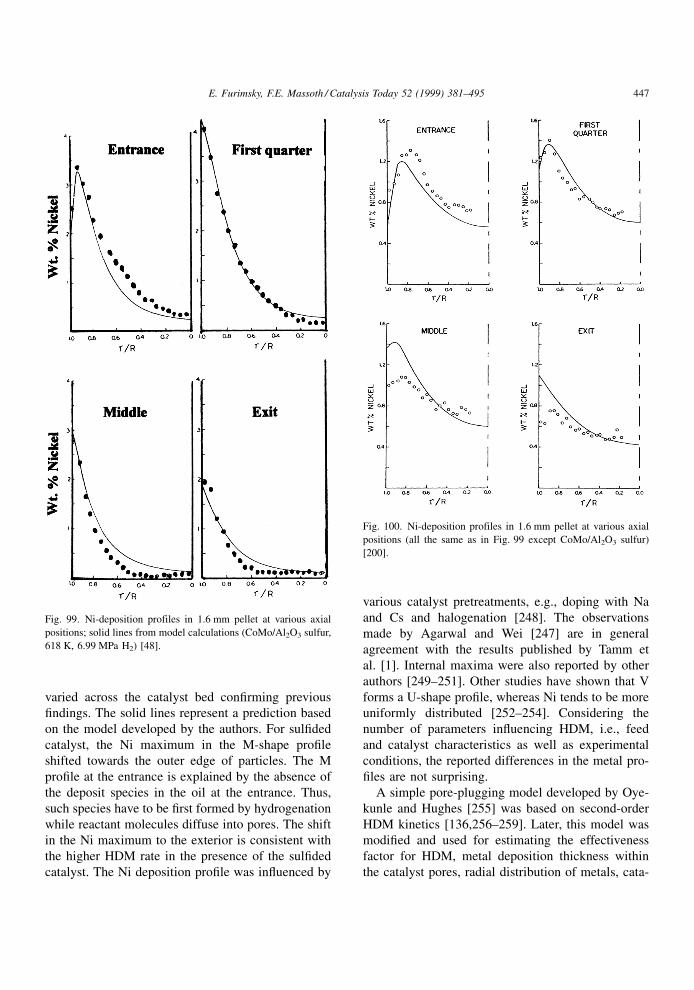
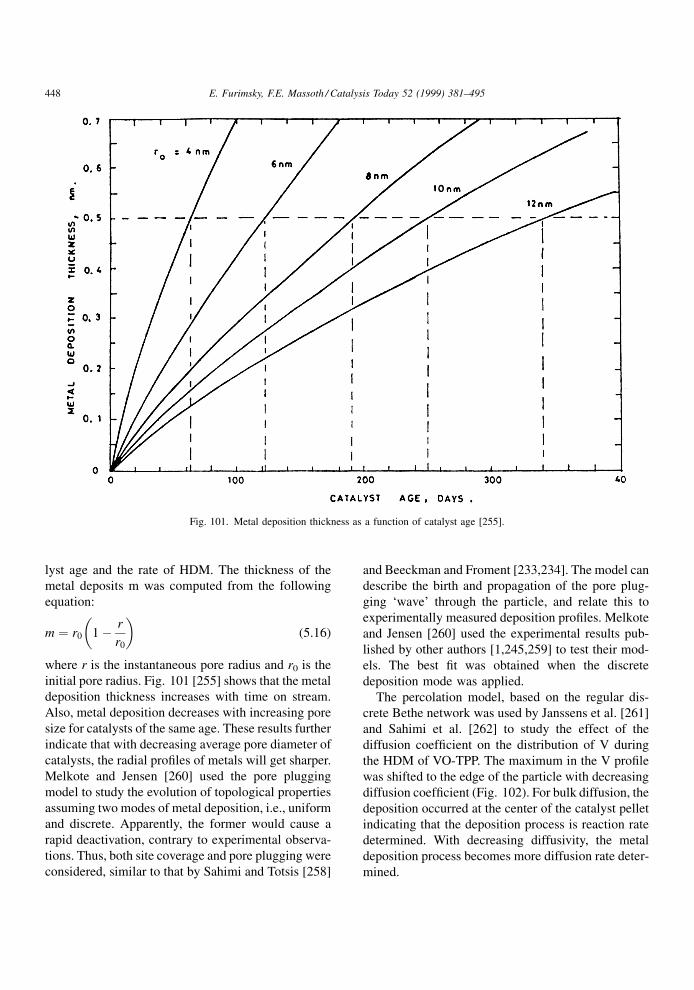
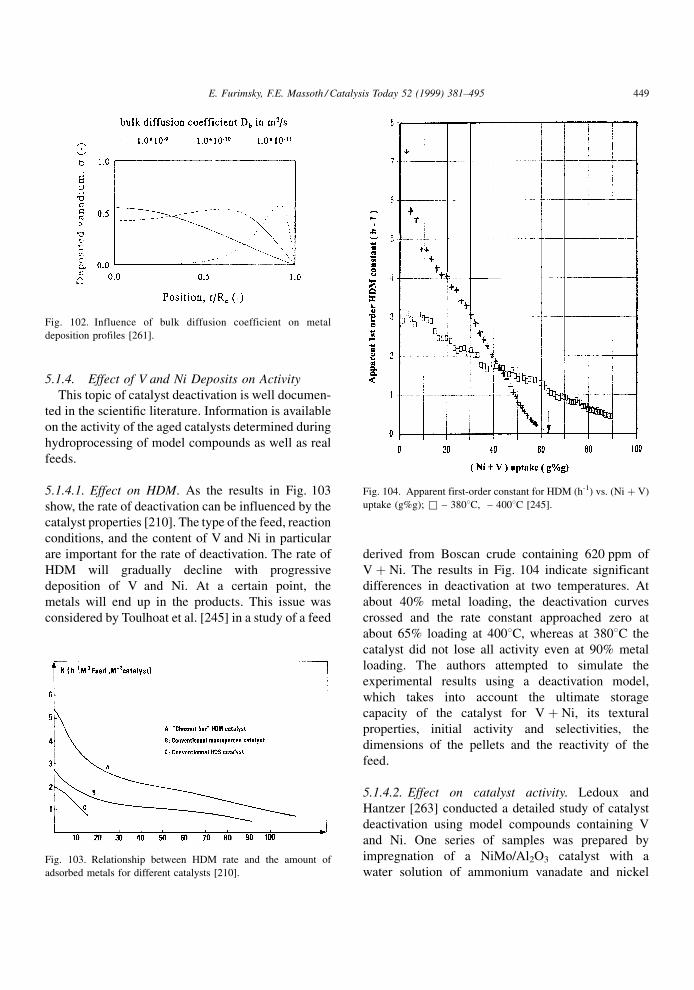
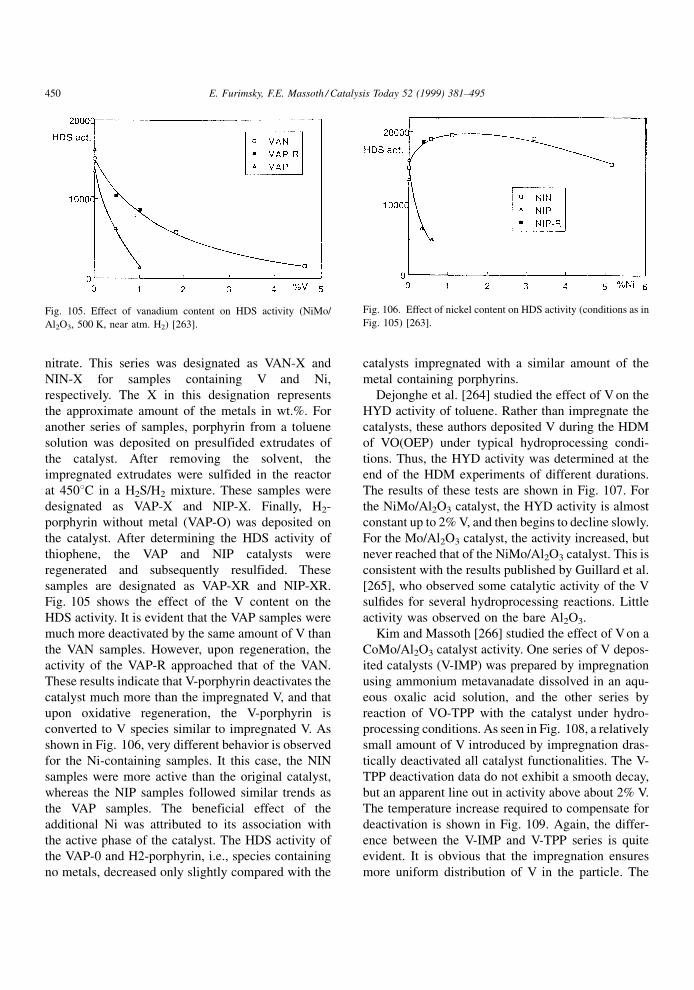
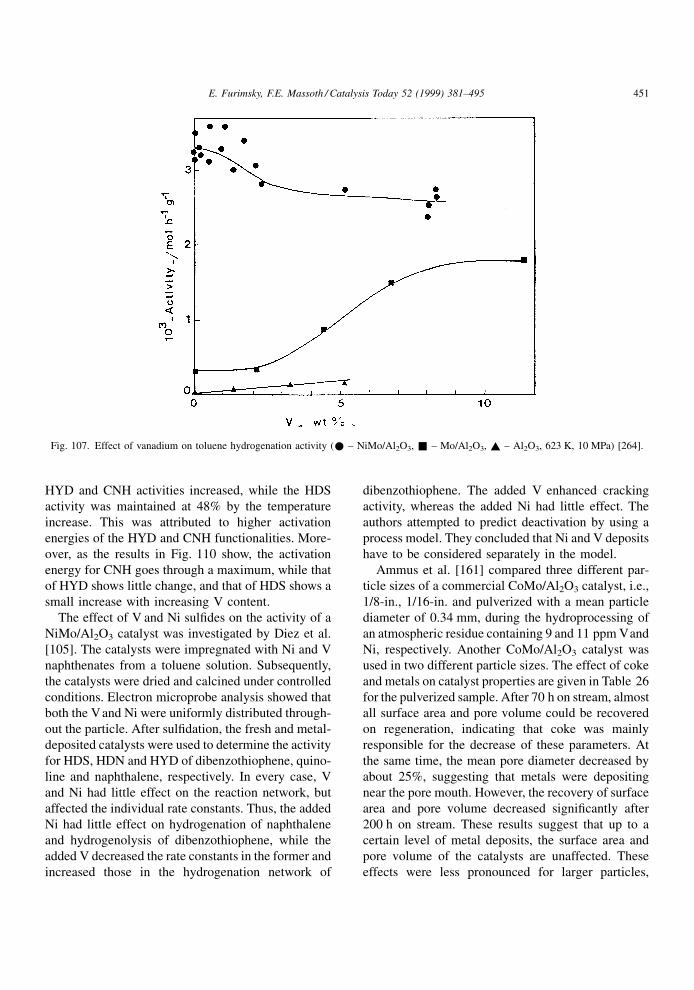
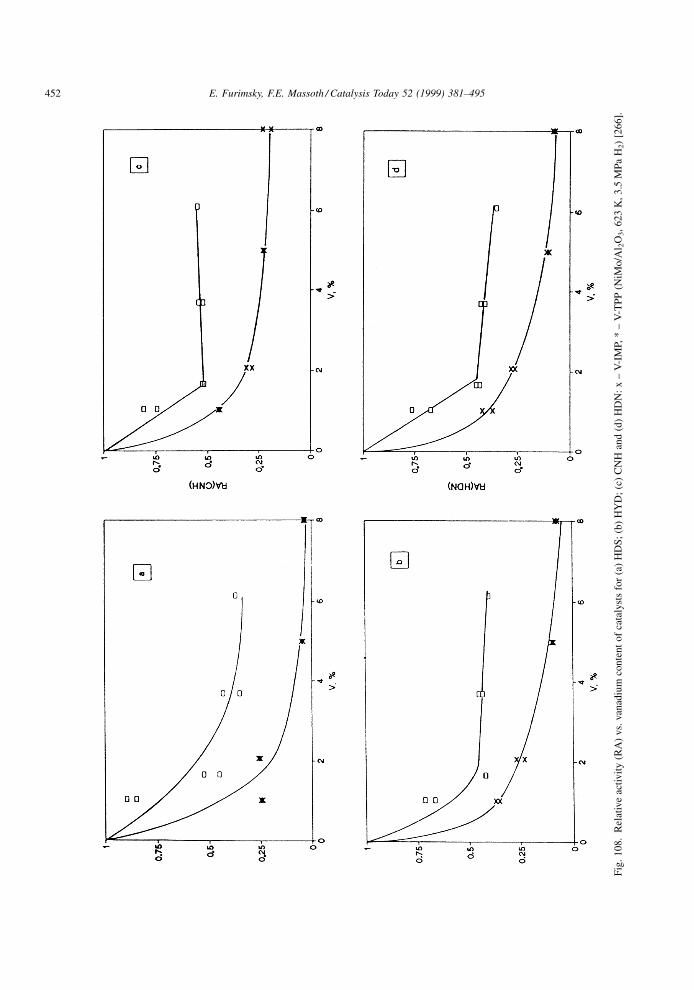
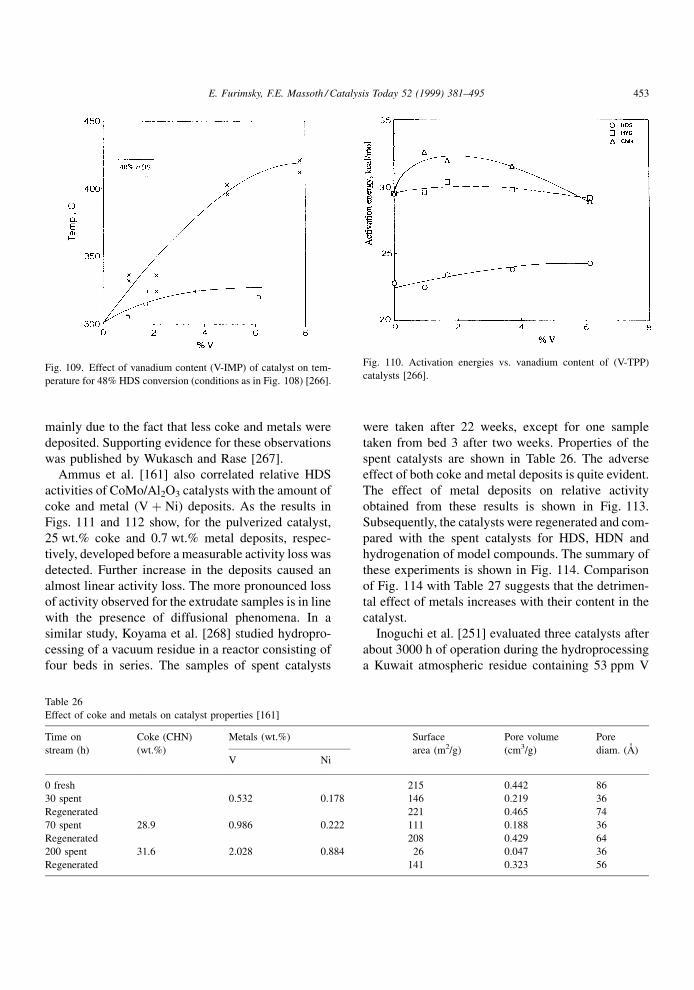
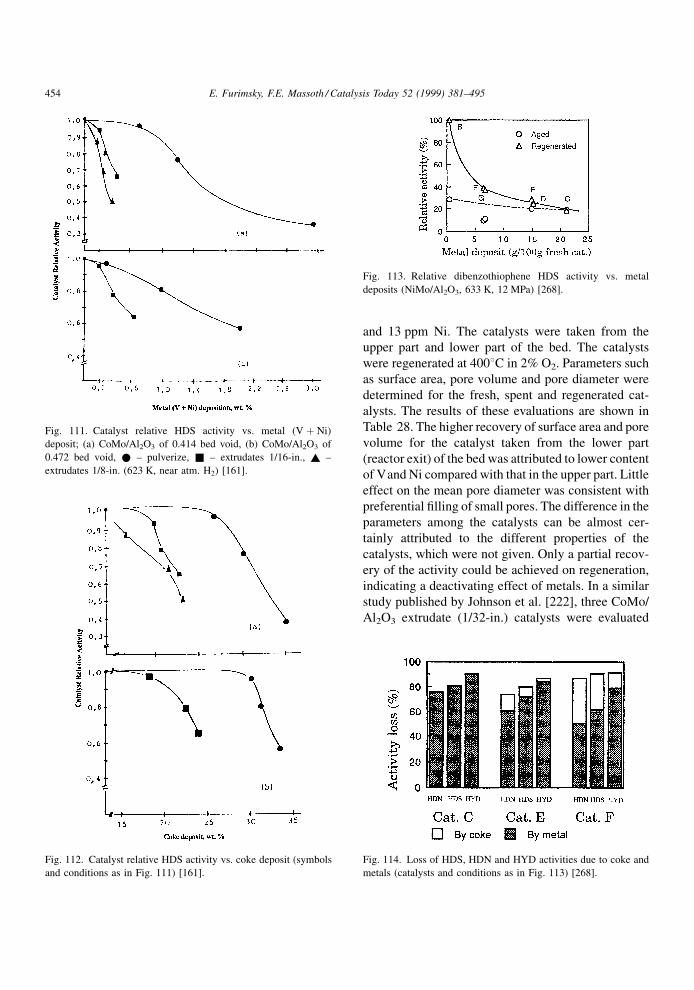
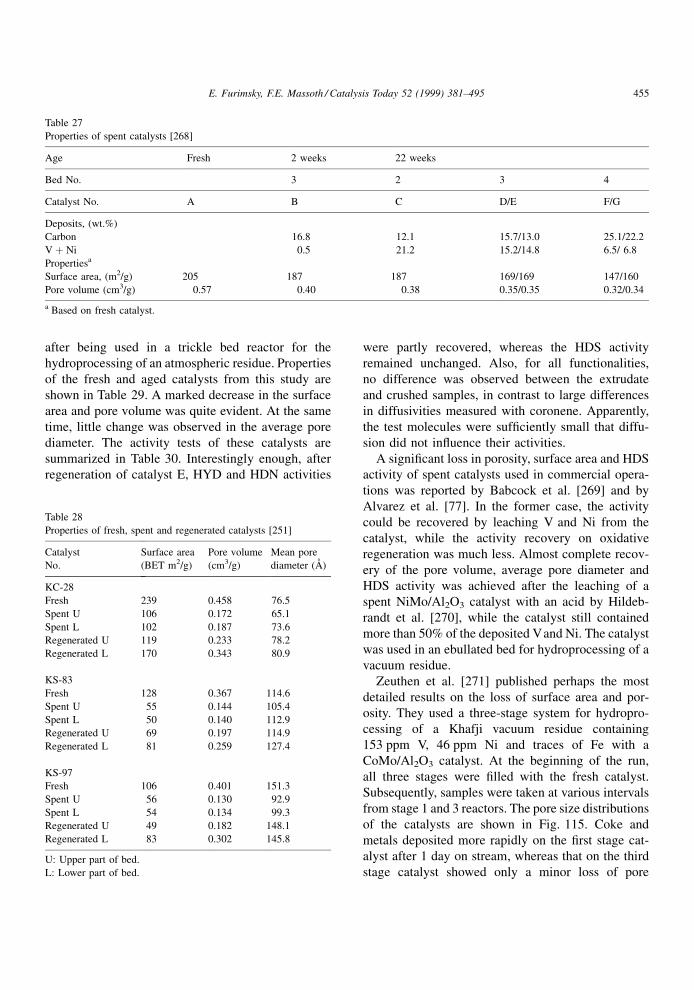
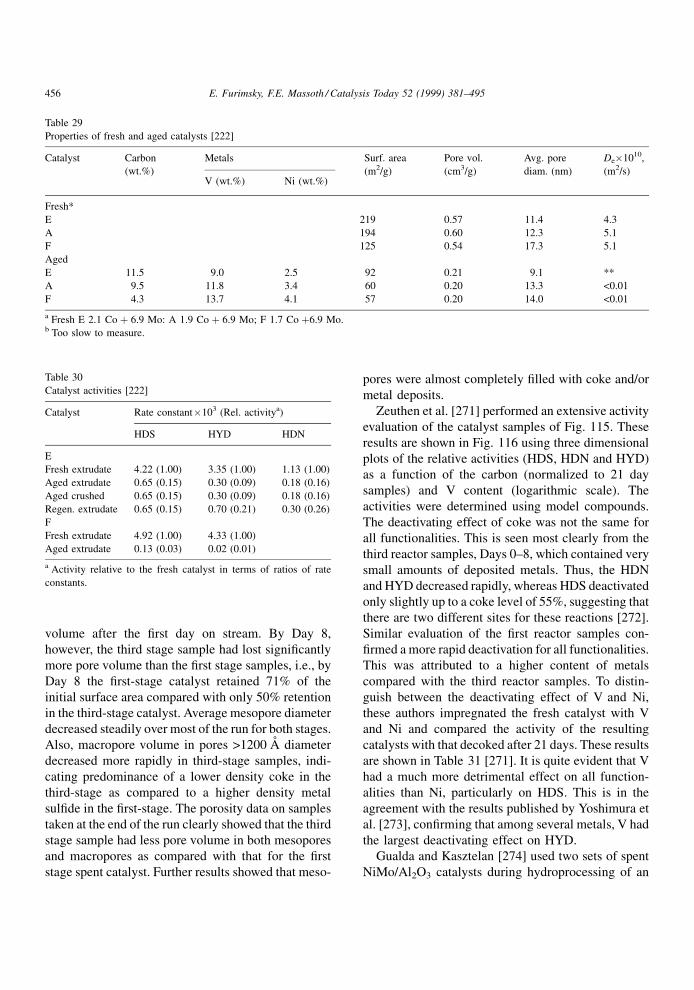
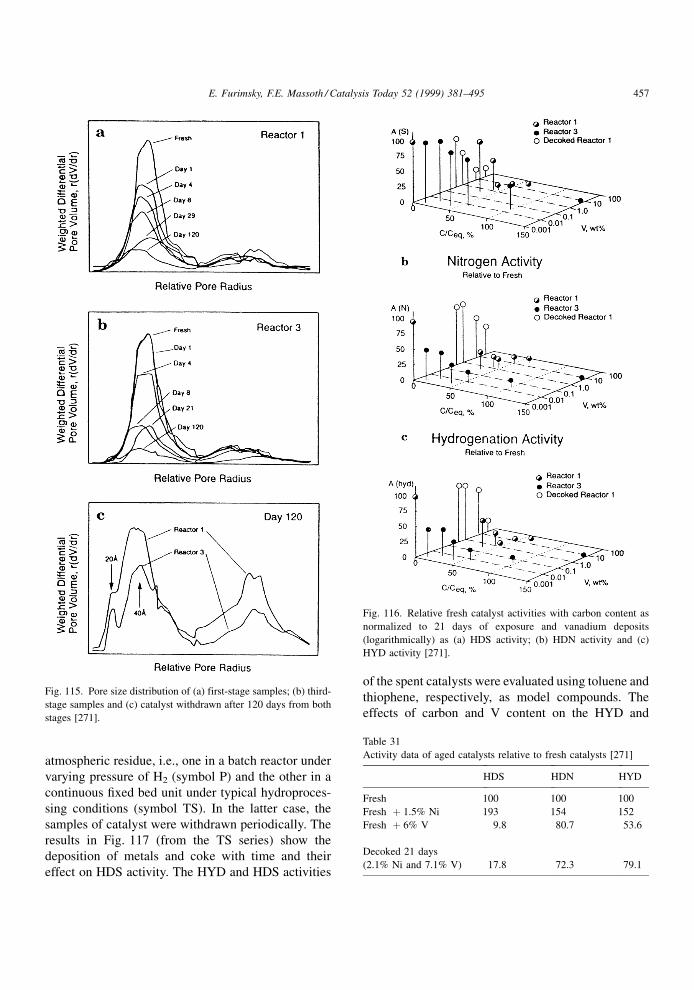
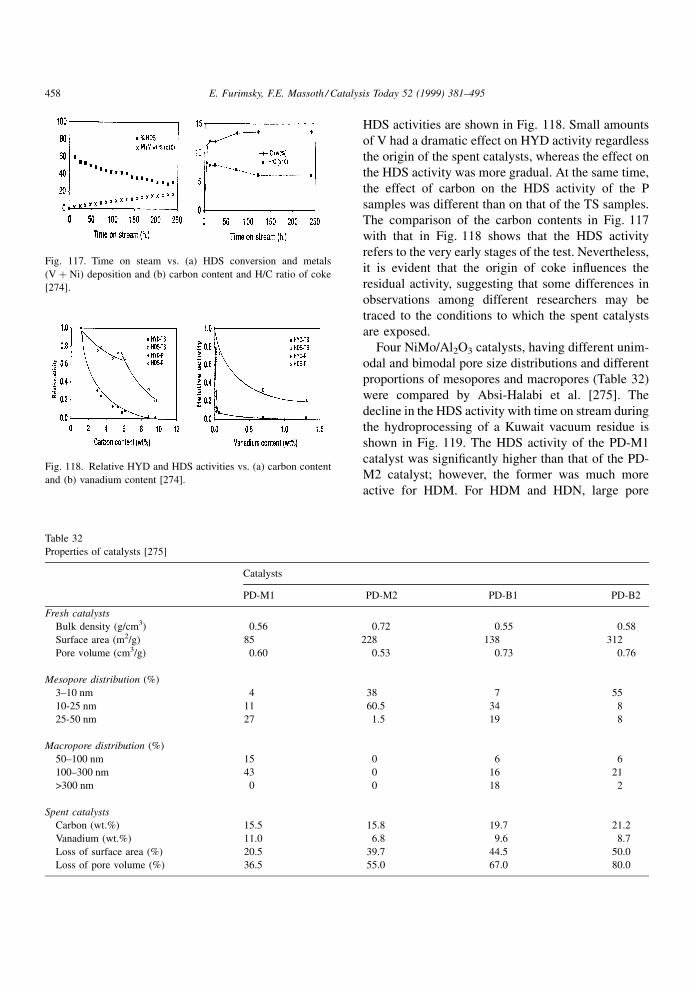
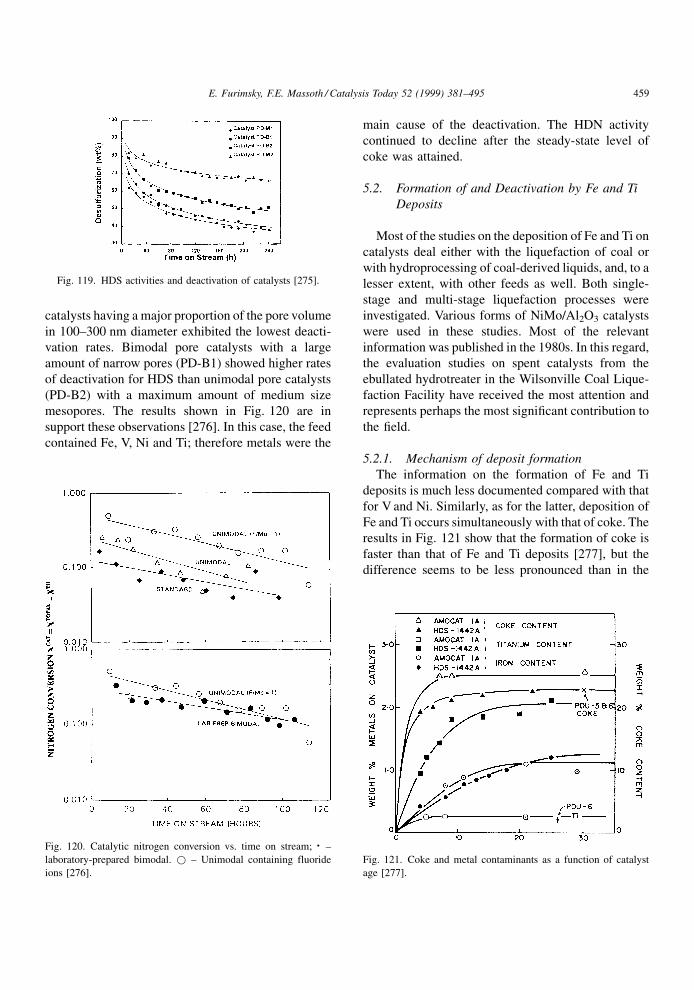
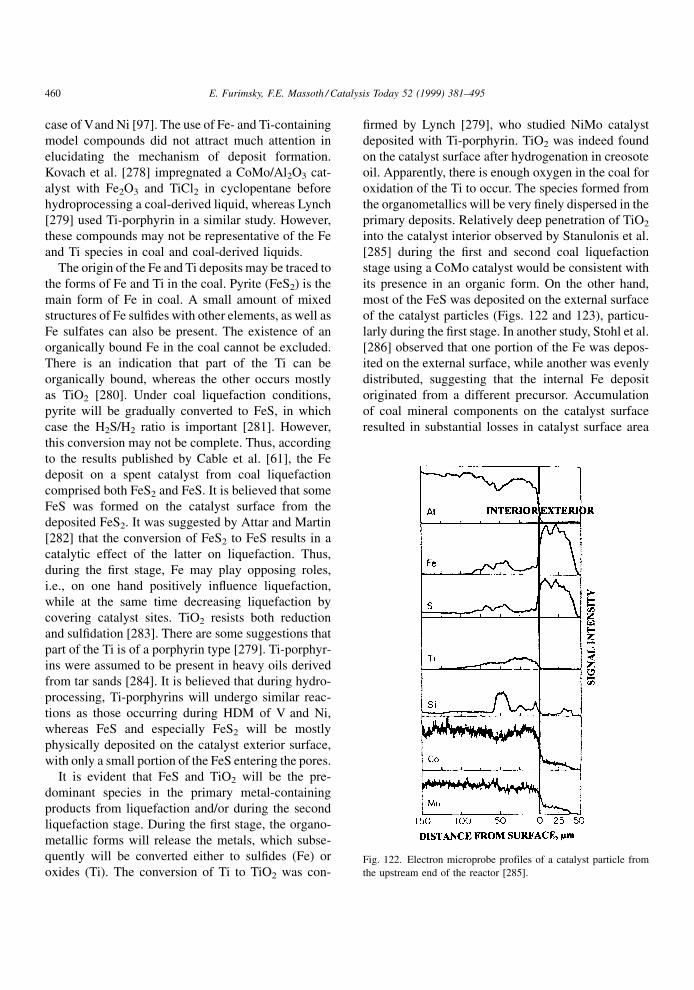

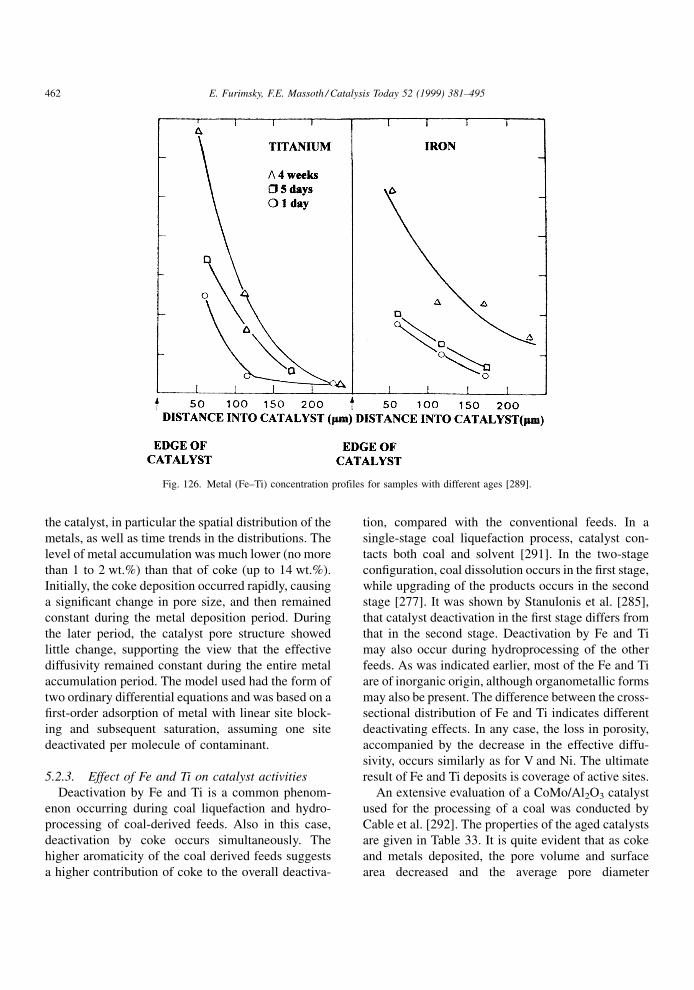
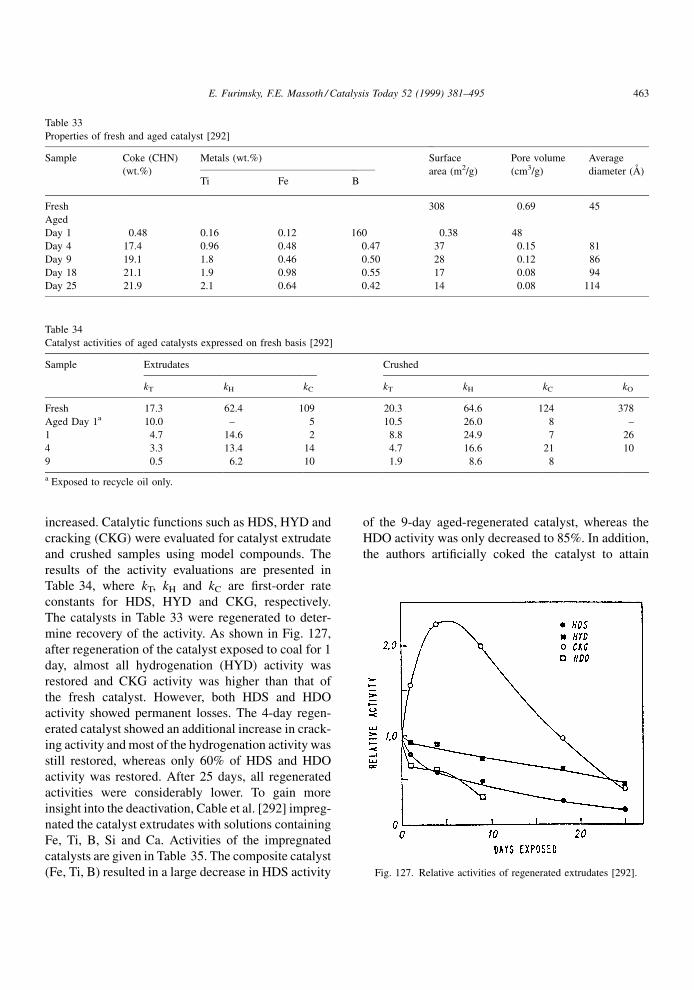
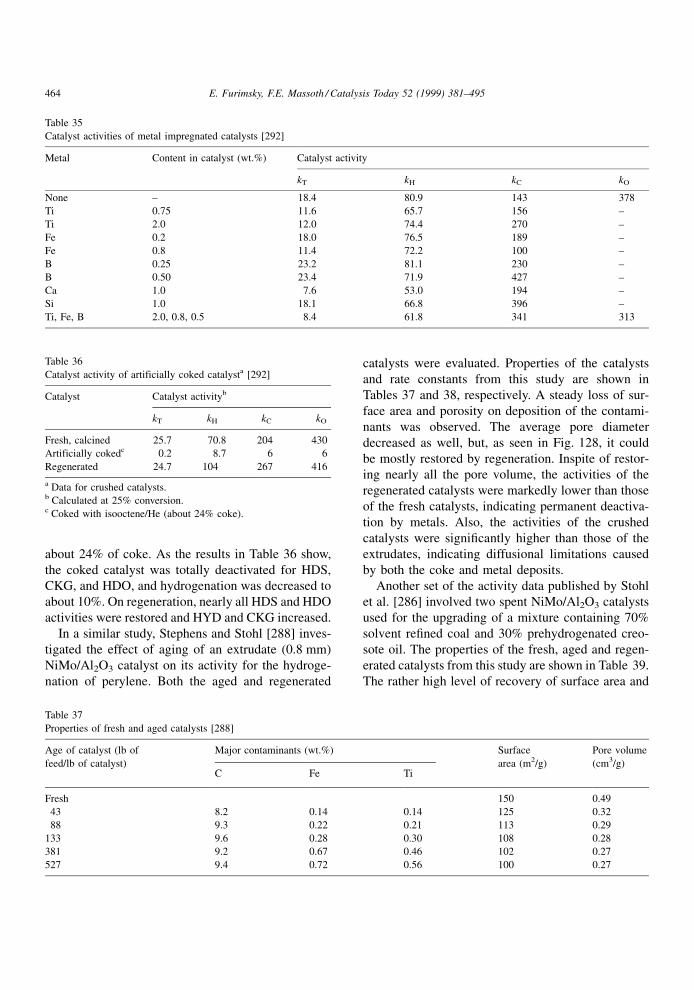
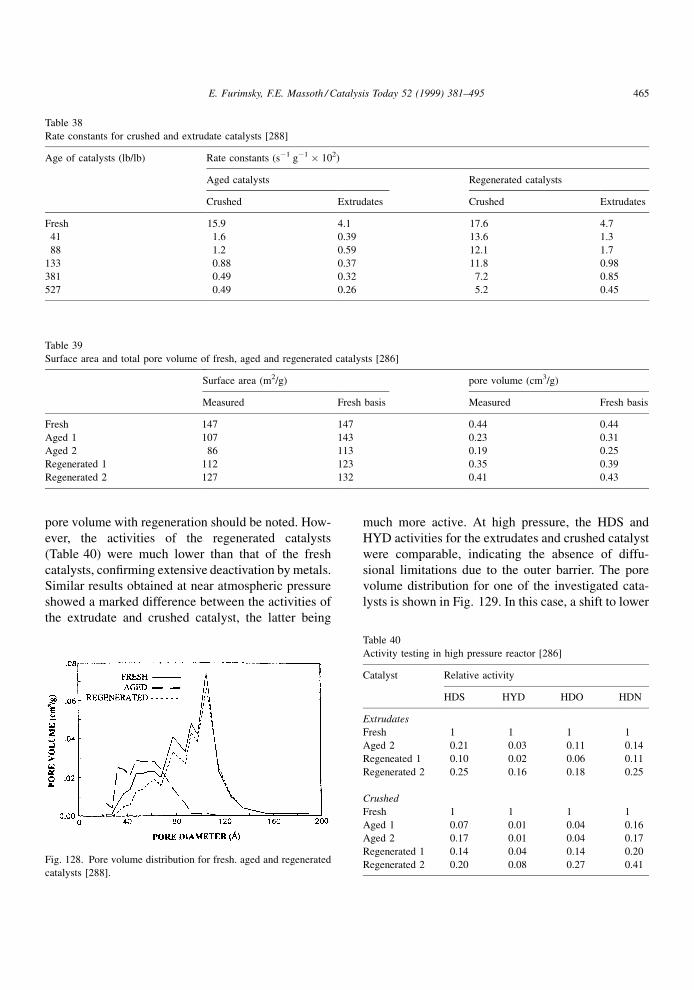
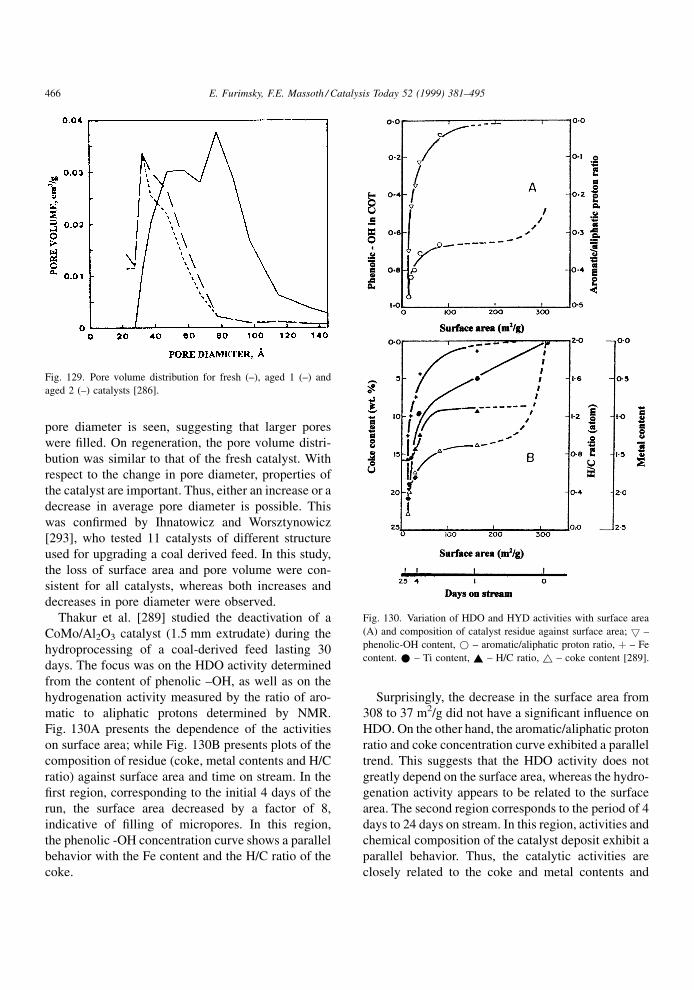
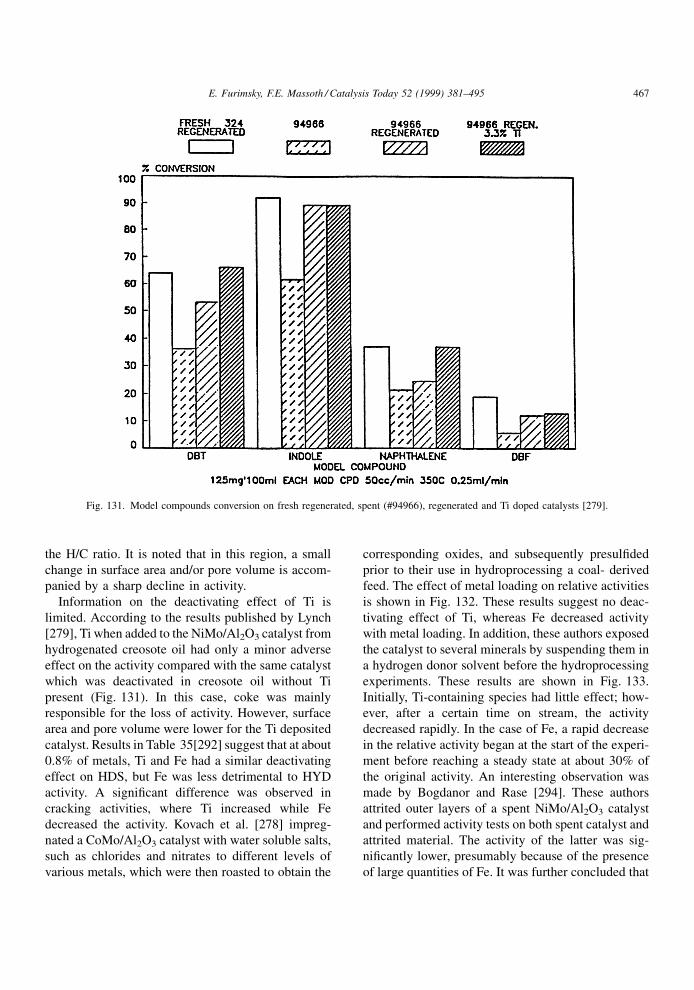
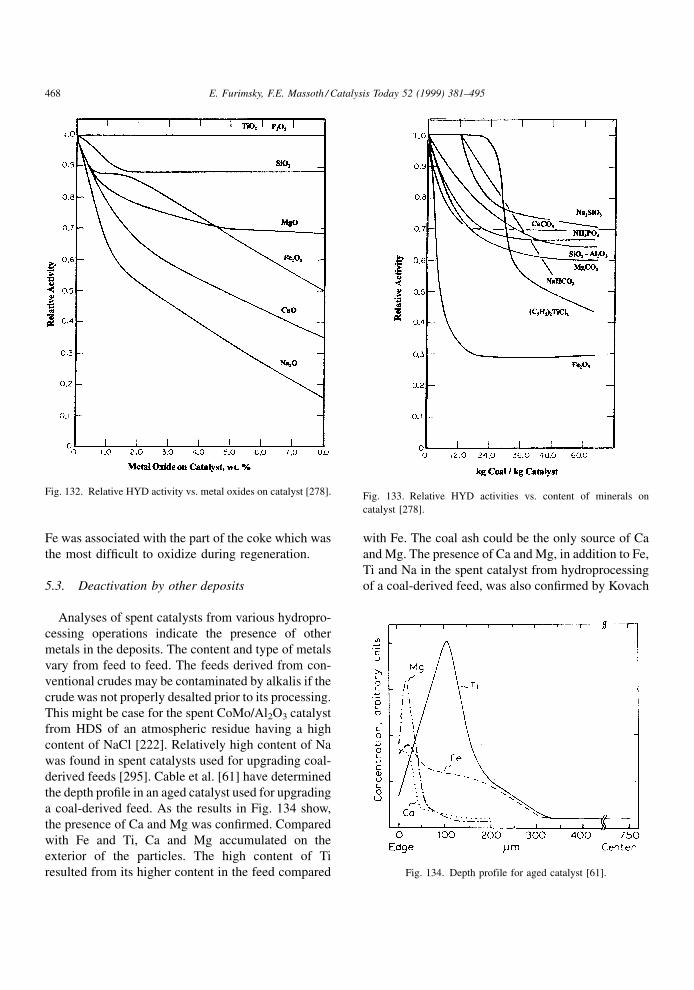
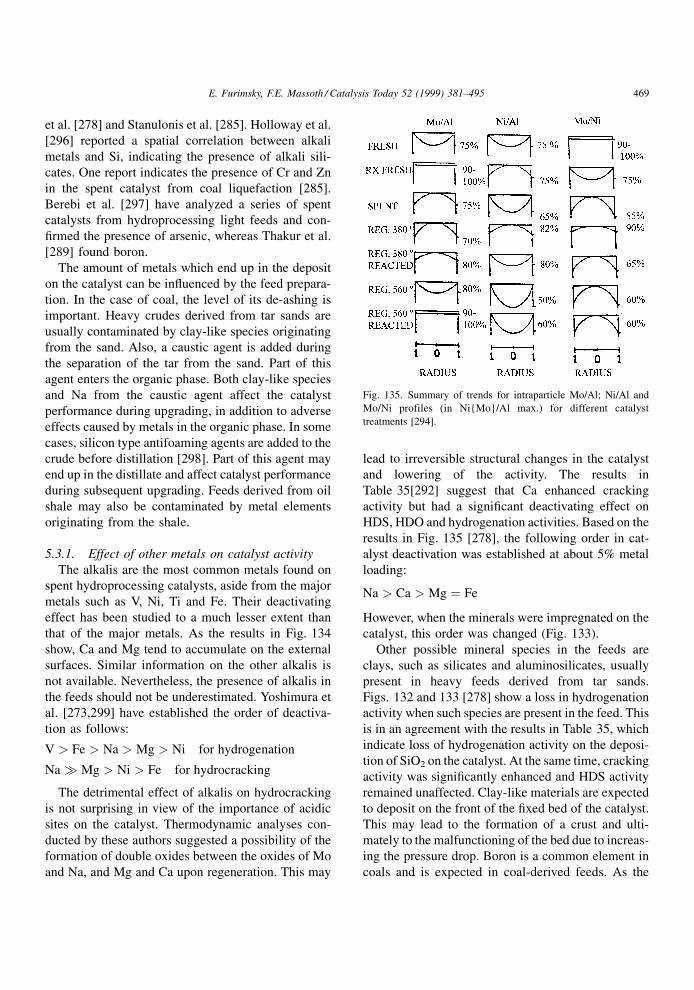
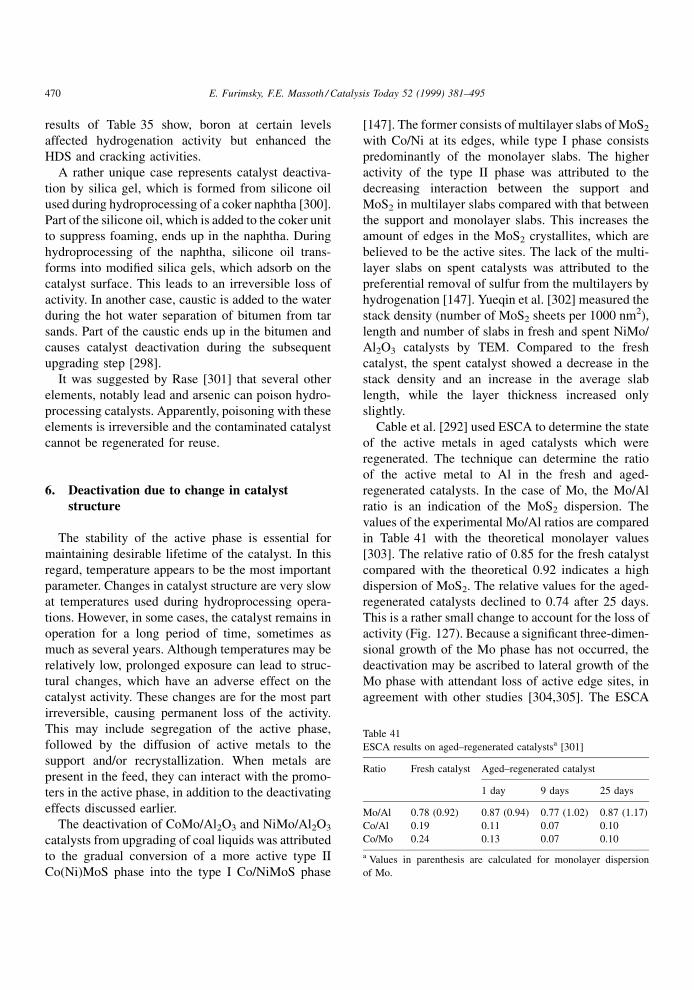
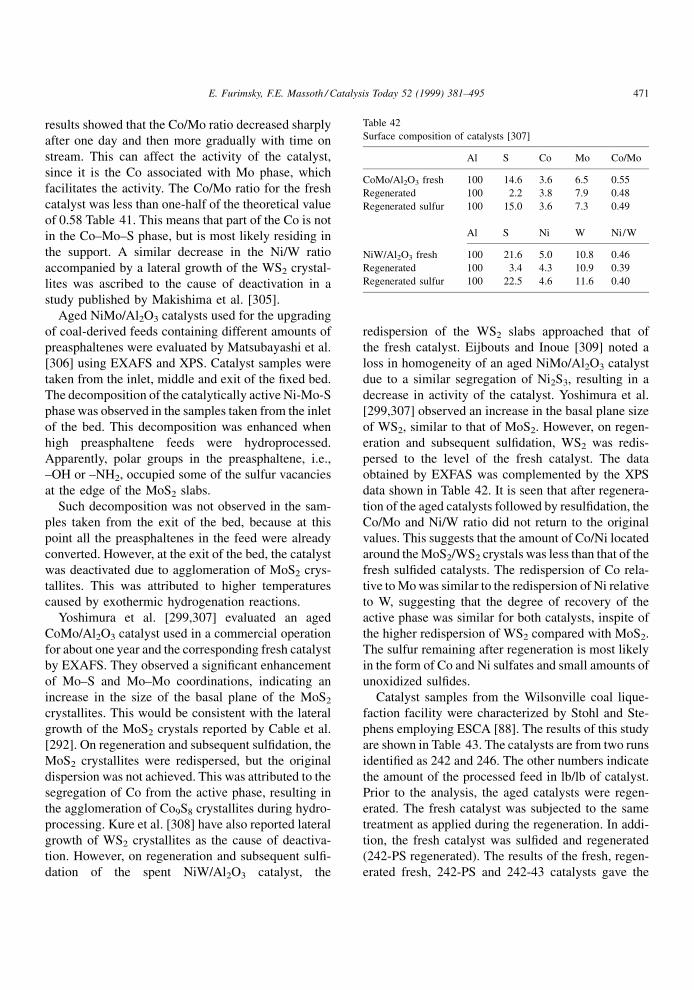
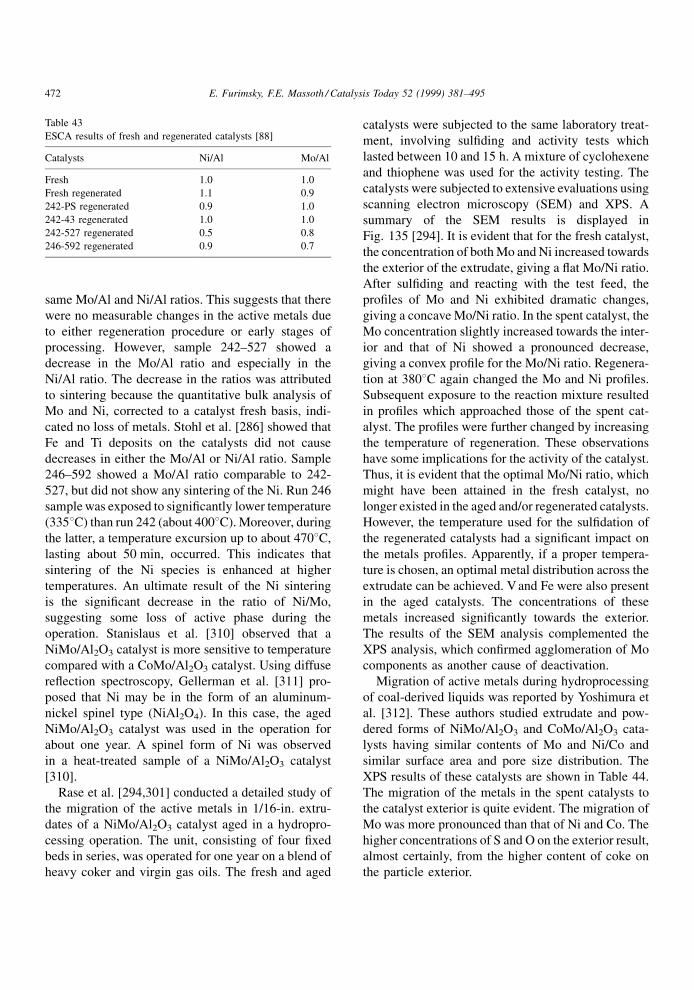
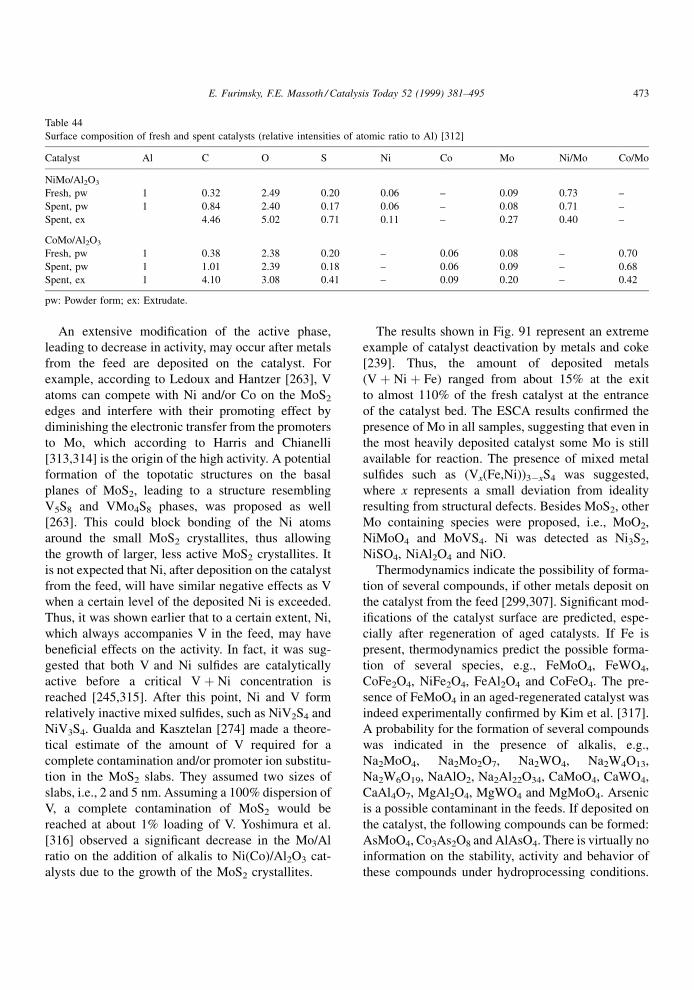
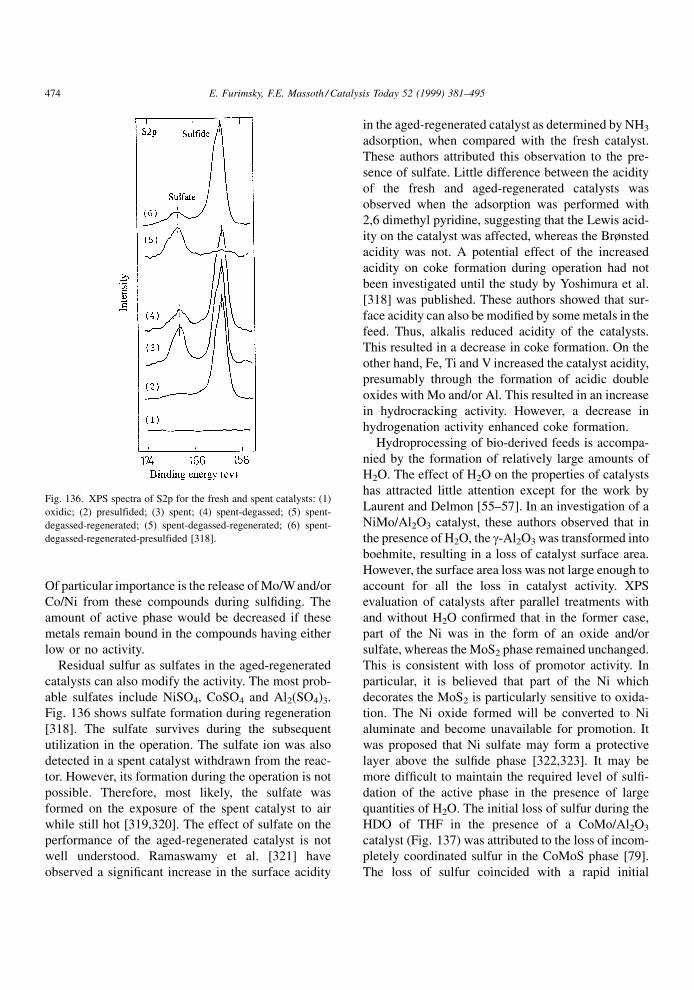
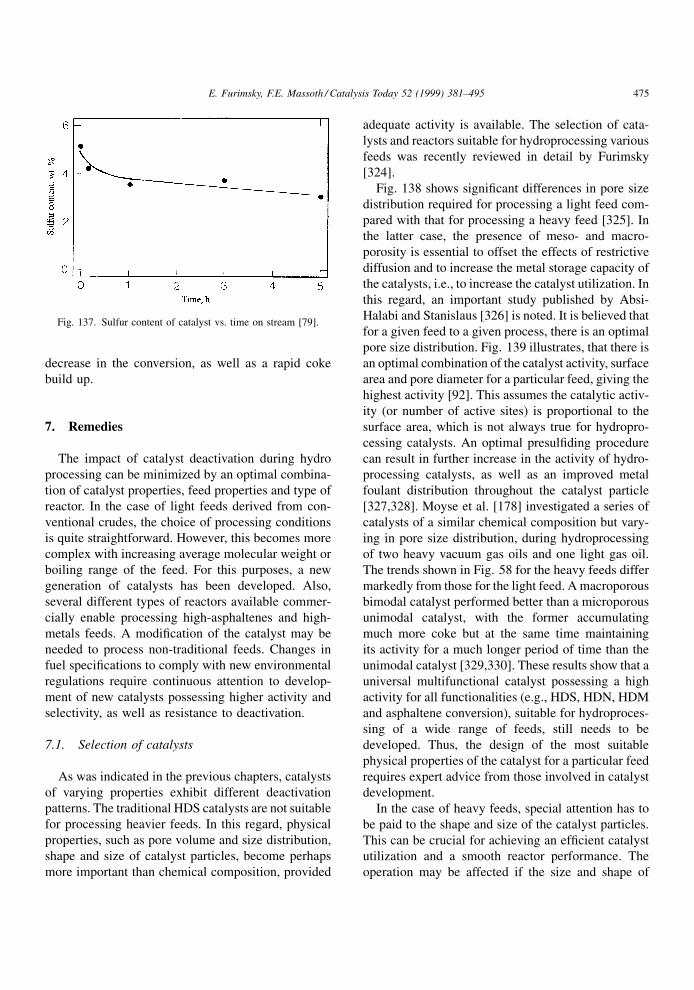
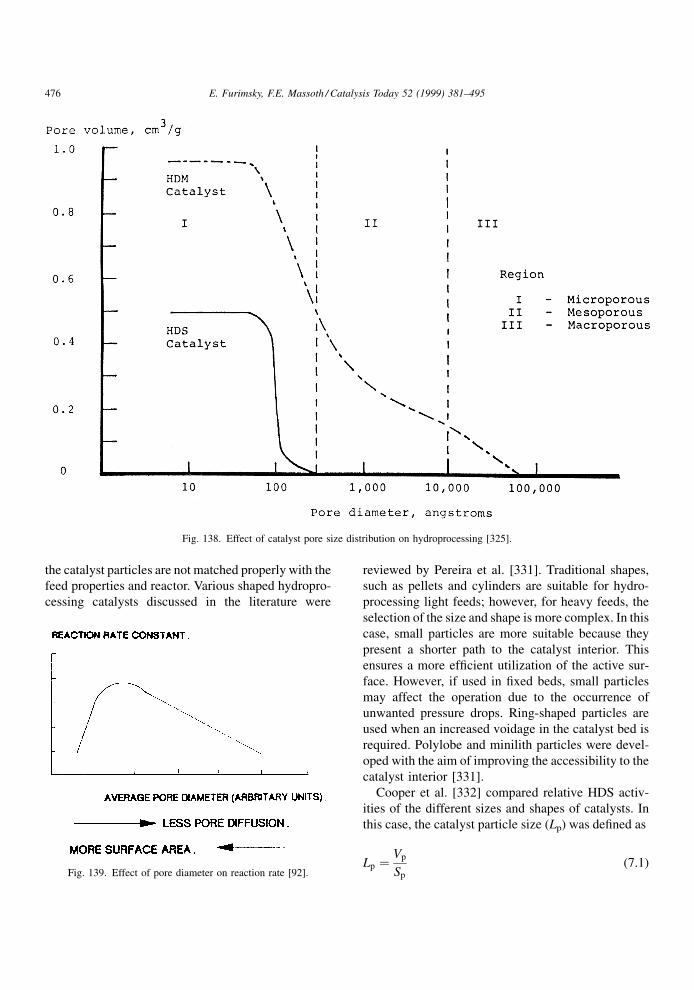
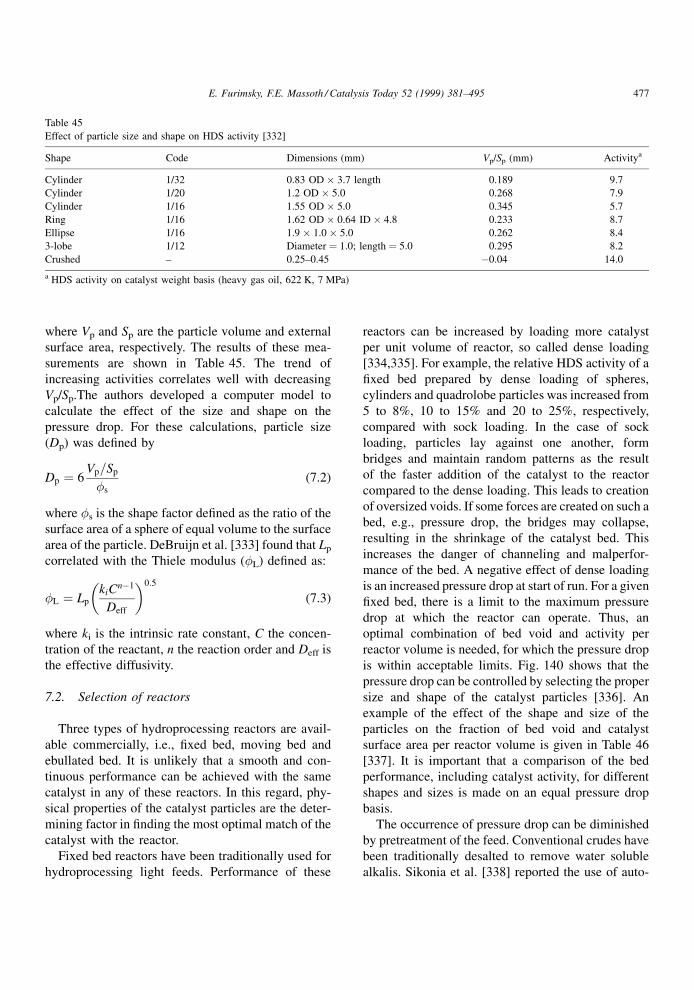
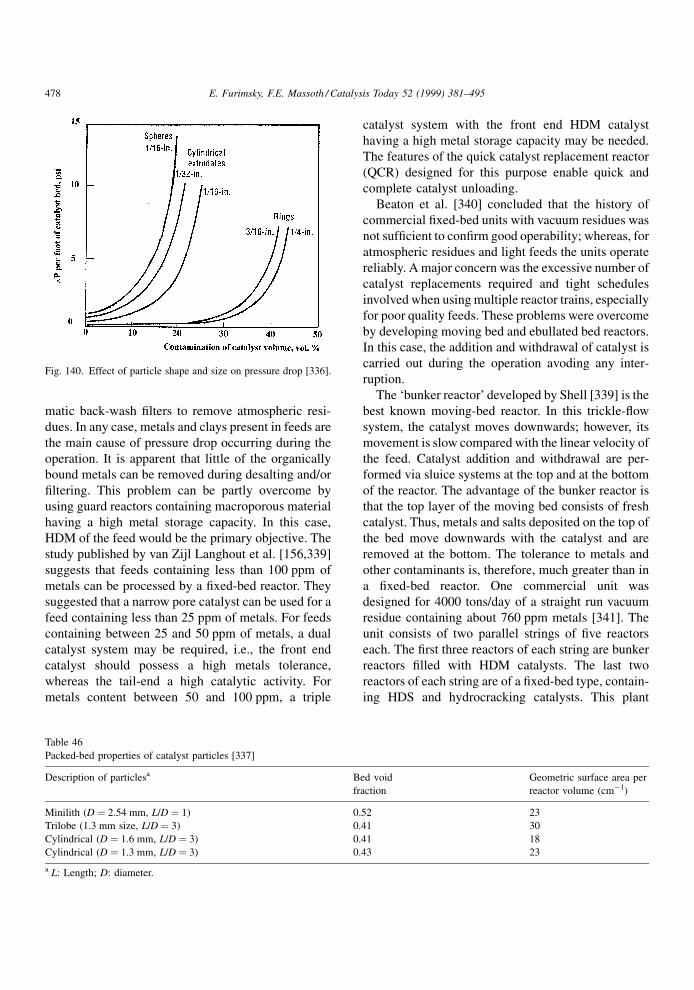
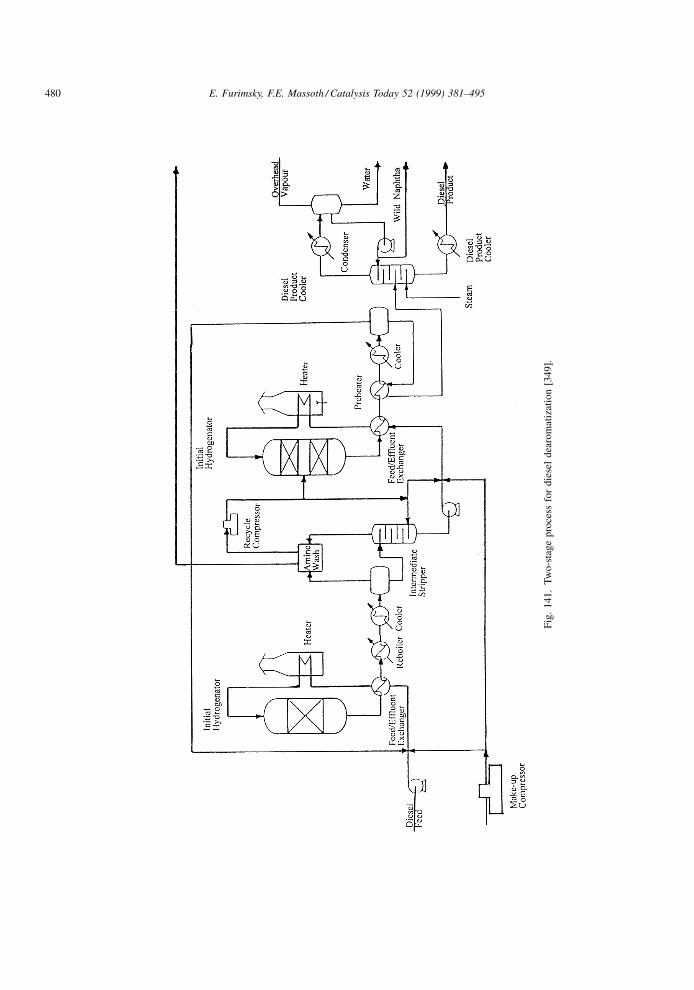
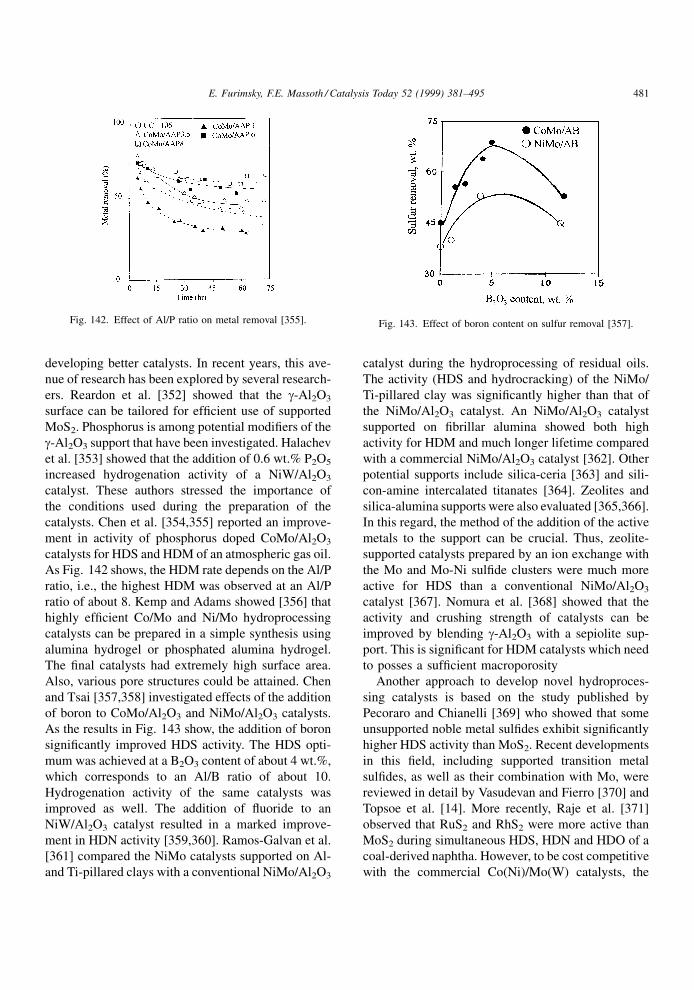
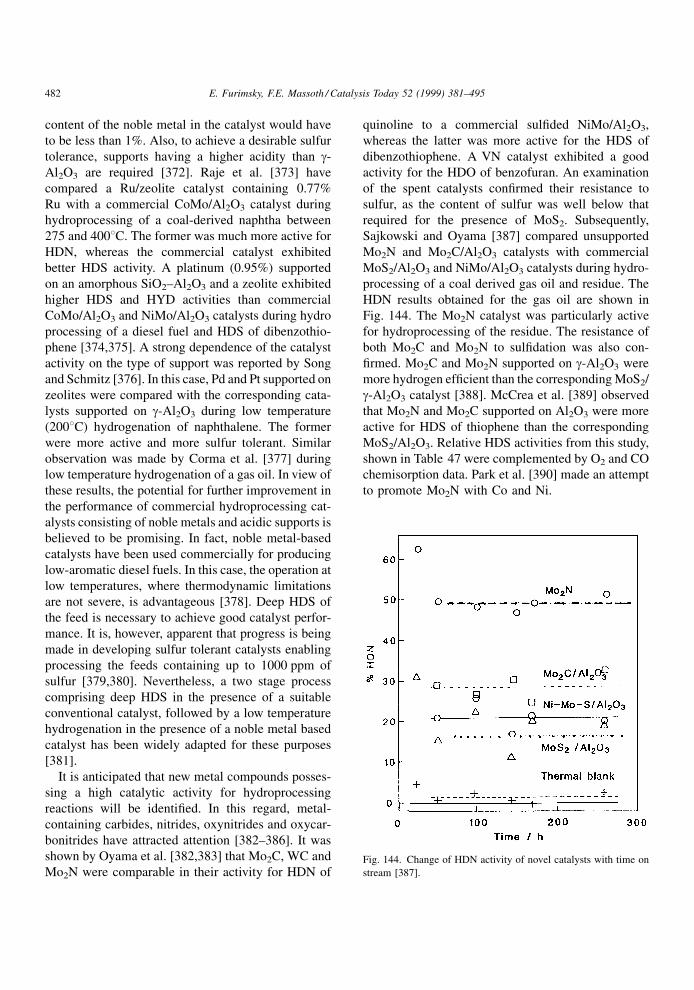
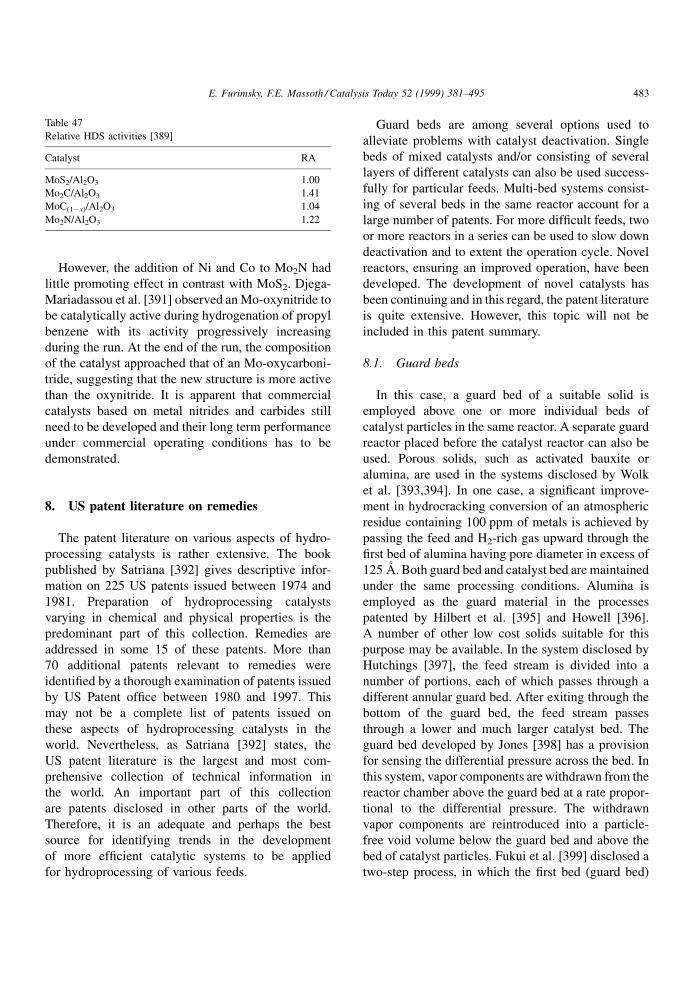
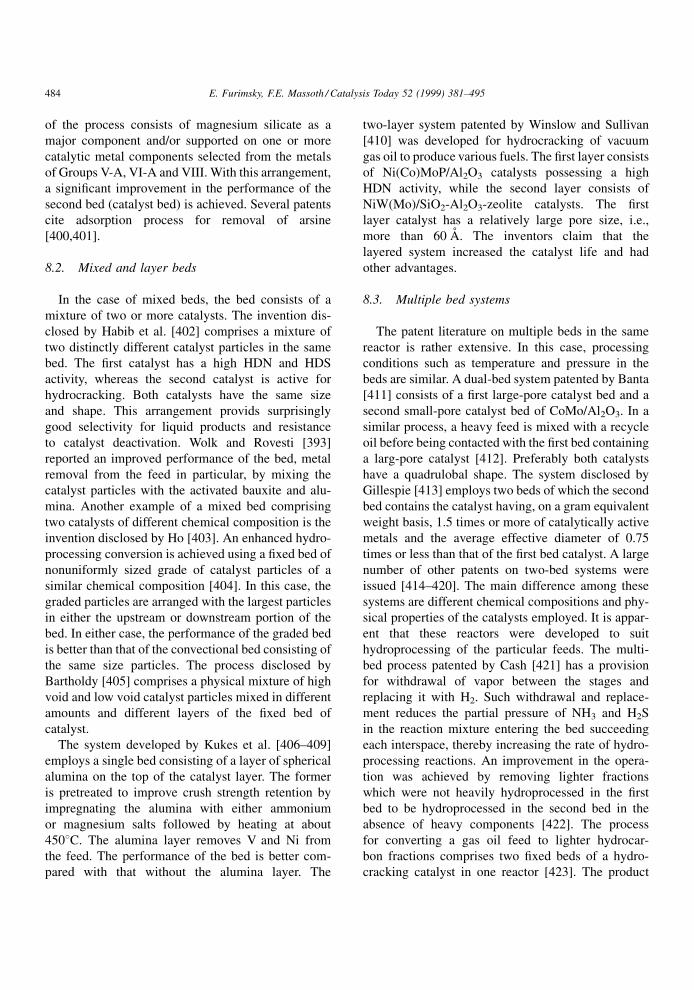
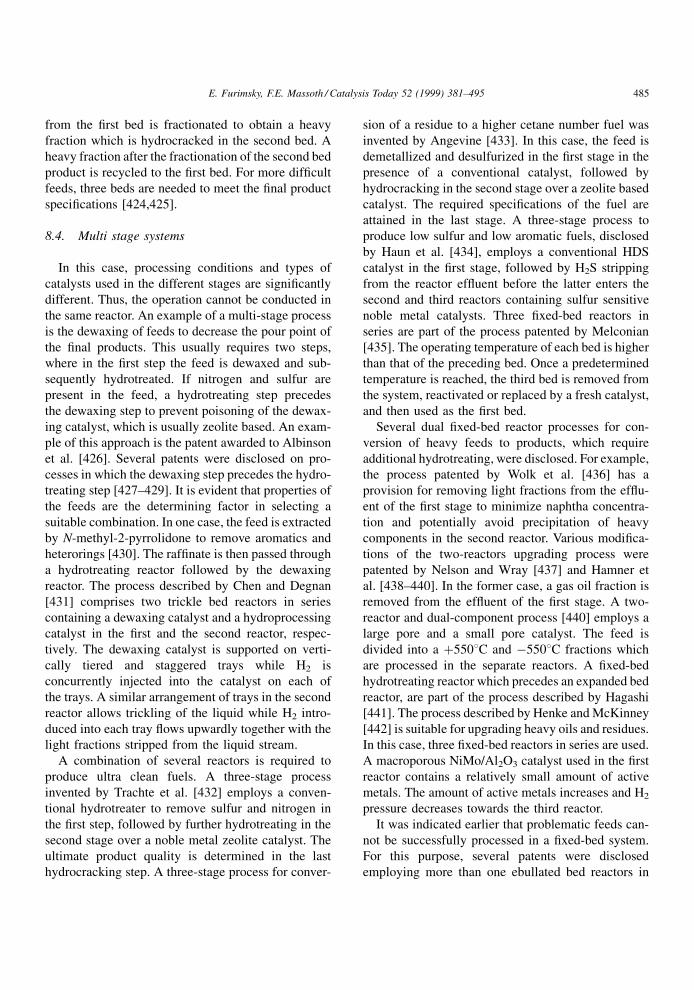
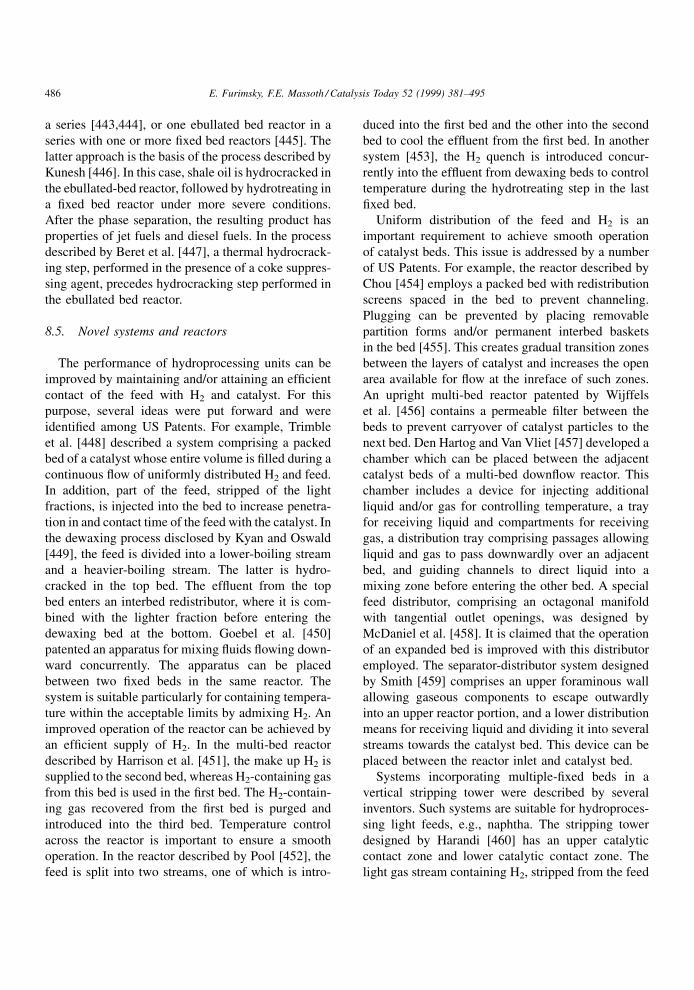


![CHEMISTRY Copyright © 2020 Highly active dry methane … · of methane (DRM)], but catalyst deactivation due to agglomeration or coking restrains the catalyst lifetime and efficiency](https://static.documents.pub/doc/80x56/6007f1561f35ac1b855bd680/chemistry-copyright-2020-highly-active-dry-methane-of-methane-drm-but-catalyst.jpg)


