Deal with the Devil: The Successes and Limitations of Bureaucratic Reform in India Iqbal Dhaliwal, MIT-JPAL Rema Hanna, Harvard Kennedy School, NBER, BREAD, JPAL December 2013 Abstract Employing a technological solution to monitor the attendance of public-sector health care workers in India resulted in a 15 percent increase in the attendance of the medical staff. Health outcomes improved, with a 16 percent increase in the delivery of infants by a doctor and a 26 percent reduction in the likelihood of infants born under 2500 grams. However, women in treatment areas substituted away from the newly monitored health centers towards delivery in the (unmonitored) larger public hospitals and private hospitals. Several explanations may help explain this shift: better triage by the more present health care staff; increased patients’ perception of absenteeism in the treatment health centers; and the ability of staff in treatment areas to gain additional rents by moving women to their private practices and by siphoning off the state-sponsored entitlements that women would normally receive at the health center at the time of delivery. Despite initiating the reform on their own, there was a low demand among all levels of government–state officials, local level bureaucrats, and locally-elected bodies—to use the better quality attendance data to enforce the government’s human resource policies due to a fear of generating discord among the staff. These fears were not entirely unfounded: staff at the treatment health centers expressed greater dissatisfaction at their jobs and it was also harder to hire new nurses, lab technicians and pharmacists at the treatment health centers after the intervention. Thus, this illustrates the implicit deal that governments make on non-monetary dimensions—truancy, allowance of private practices—to retain staff at rural outposts in the face of limited budgets and staff shortages. This project was a collaboration involving many people. We gratefully acknowledge our research managers Manaswini Rao and KB Prathap for their outstanding overseeing of the field research work. We also thank Kanika Dua, Manisha Pandita, Gowramma, Srini Vasudevan and Priyanka Kanth for their excellent work coordinating the field surveyors. We thank Jonathan Holmes, Susanna Berkouwer, and Claire Walsh for outstanding research assistance. We thank the National Rural Health Mission of the State of Karnataka (particularly its director, Selva Kumar) for their cooperation implementing this project. We thank Rohini Pande and Asim Khwaja for helpful comments on the study. This project was generously funded by grants from the Abdul Latif Jameel Poverty Action Lab at MIT (JPAL) and the United States AID’s Development Innovation Ventures (DIV). All views expressed are those of the authors and do not necessarily reflect the views of the Government of Karnataka, NRHM, USAID or JPAL.
Transcript
Deal with the Devil: The Successes and Limitations of Bureaucratic Reform in India
Abstract Employing a technological solution to monitor the attendance of public-sector health care workers in India resulted in a 15 percent increase in the attendance of the medical staff. Health outcomes improved, with a 16 percent increase in the delivery of infants by a doctor and a 26 percent reduction in the likelihood of infants born under 2500 grams. However, women in treatment areas substituted away from the newly monitored health centers towards delivery in the (unmonitored) larger public hospitals and private hospitals. Several explanations may help explain this shift: better triage by the more present health care staff; increased patients’ perception of absenteeism in the treatment health centers; and the ability of staff in treatment areas to gain additional rents by moving women to their private practices and by siphoning off the state-sponsored entitlements that women would normally receive at the health center at the time of delivery. Despite initiating the reform on their own, there was a low demand among all levels of government–state officials, local level bureaucrats, and locally-elected bodies—to use the better quality attendance data to enforce the government’s human resource policies due to a fear of generating discord among the staff. These fears were not entirely unfounded: staff at the treatment health centers expressed greater dissatisfaction at their jobs and it was also harder to hire new nurses, lab technicians and pharmacists at the treatment health centers after the intervention. Thus, this illustrates the implicit deal that governments make on non-monetary dimensions—truancy, allowance of private practices—to retain staff at rural outposts in the face of limited budgets and staff shortages.
This project was a collaboration involving many people. We gratefully acknowledge our research managers Manaswini Rao and KB Prathap for their outstanding overseeing of the field research work. We also thank Kanika Dua, Manisha Pandita, Gowramma, Srini Vasudevan and Priyanka Kanth for their excellent work coordinating the field surveyors. We thank Jonathan Holmes, Susanna Berkouwer, and Claire Walsh for outstanding research assistance. We thank the National Rural Health Mission of the State of Karnataka (particularly its director, Selva Kumar) for their cooperation implementing this project. We thank Rohini Pande and Asim Khwaja for helpful comments on the study. This project was generously funded by grants from the Abdul Latif Jameel Poverty Action Lab at MIT (JPAL) and the United States AID’s Development Innovation Ventures (DIV). All views expressed are those of the authors and do not necessarily reflect the views of the Government of Karnataka, NRHM, USAID or JPAL.
2
I. INTRODUCTION
Many of our models to analyze bureaucratic behavior derive from the principal-agent-citizen framework.
The principal—the government—designs a program around a specific goal, and the agents—various
bureaucrats—implement it (for a discussion of the literature, see Banerjee, Hanna and Mullainathan,
2013). The challenge lies in bureaucrats naturally having different incentives than the government in
terms of how they would administer the program, combined with the government’s inability to perfectly
monitor the bureaucrats’ behavior. It, thus, follows that technological improvements in monitoring to
increase the probability of getting caught engaging in a wrong behavior—along with increasing penalties
for doing so, either financial penalties or other forms of stigma that may affect one’s career trajectory—
should, in theory, better align the bureaucrat’s incentives to the government’s. However, just monitoring
along one dimension of work may not necessarily improve the program outcomes if the bureaucrat needs
to undertake a series of different tasks—and not just the monitored one—to improve outcomes. It may
even exacerbate problems if the monitoring harms the bureaucrat’s intrinsic motivation to undertake the
complementary, unmonitored tasks (Holstrom and Milgrom, 1991; Benabou and Tirole 2006).
We focus on a particular form of malfeasance: the absenteeism of public health care workers.
Bureaucratic absenteeism is a common problem around the world and one that has defied many efforts to
tackle (e.g. Chaudhury, et al, 2006). Even in the fairly well-off Indian state that we study (Karnataka),
absenteeism is a significant concern: for example, doctors in the public-sector, primary health centers
(PHCs) were present only 36 percent of the time in our baseline survey, but rarely took a “formal” leave
day. If health care workers are absent, citizens may go without essential primary care and, especially,
women may choose not to seek antenatal visits or have a delivery by a trained physician.
Due the high absentee rate, in 2010, the National Rural Health Mission (NRHM) of Karnataka –
the lead department for the delivery of health services in the state – designed a program to enforce their
attendance policy, which existed on the books for years, but was rarely adhered to in practice.
Specifically, they developed a system that utilized a biometric monitoring device to digitally capture the
thumb print for each staff member at the start and end of the day. The data were then to be uploaded
daily—via a cell phone—to a central office that was tasked with providing detailed attendance
information to supervisors in the head office and field and to the PHCs, and ensuring that the staff’s
“leave days” were properly deducted on the days that they were absent.
3
This pilot program provided a unique opportunity to study an organically developed, government
program that aimed to use the latest technology available to increase the monitoring of and incentives to
both mid-level (doctors) and lower-level bureaucrats (e.g. nurses, laboratory technicians, etc). The
government piloted the system in about 140 primary health centers (PHCs) in five diverse districts across
the state, thus allowing us to randomize which 140 out of the 322 total PHCs received it. We collected
detailed data to help understand how the system affected the bureaucrats’ behaviors—along both the
monitored and unmonitored dimensions—and to test whether the system would ultimately affect citizen
health. Note that, even as a pilot project, this was a sizable policy change: over 300 government
employees and about two and a half million citizens (in the catchment areas of the treatment PHCs) had
the potential to be impacted by the project.
The paper contributes to the literature that aims to understand how improved monitoring, coupled
with incentives, impacts absenteeism.1 Previous studies from the non-profit setting showed that these
kinds of programs can be successful (Duflo, Hanna and Ryan, 2012). The non-profit setting provides a
clean empirical test of the principal-agent model, since they are usually conducted on a relatively small
scale that requires few intermediate agents and it is relatively easy to alter the employee contracts to
provide financial incentives in these settings.2
However, when exploring these models in a government setting, additional challenges may arise
given the different overlapping institutions involved in human resources processes, the larger scale that
leads to decentralization of different tasks, and the varying incentives of different government staff. For
example, a similar intervention with sub-center nurses in a state in India produced very different results,
as middle-level bureaucrats within the chain “undid” the monitoring and incentive structure that the
government introduced for the field nurses (Banerjee, Duflo, Glennerster, 2008).
3
1This paper also builds upon the literature that explores the introduction of technological solutions to various aspects of government—with varying levels of success—including the introduction of electronic voting machines (Fujiwara, 2013), computerized land registration systems (Deininger and Goyal, 2010), electronic identification cards for the beneficiaries of social assistance programs (Niehaus, Muralidharan, and Sukhtankar, 2013), smart-phones to “monitor” officials who “monitor” lower-level bureaucrats (Callen, Gulzarz, Hasanain, Khan, 2013). This contributes by not only exploring the impact of these programs, but also exploring how the government’s conflicting goals may impact whether technology will have sustained impacts.
In this project, we
2For example, in Duflo et al, about 60 one-teacher schools were in the treatment. In fact, once the program was scaled up to the control group as well, the NGO had to decentralize the running of the program to different regional staff to administer rather than having one central office. 3 This study while building up on earlier work is still distinct from Banerjee, Duflo, Glennerster (2008) in several key ways. In that project, a schedule of penalties was introduced specifically for that experiment, whereas in this project, the government aimed to use the better attendance data to enforce existing contracts. Moreover, this project focuses on all types of staff (from clerks to doctors) at primary health centers, which are much larger than the sub-
4
study a program developed by the government to use better technology to monitor their staff at primary
health centers—who are required to be in the office on all days, not the field—and use the data to better
enforce the existing government rules. With the data that we have collected, we can test not only whether
the monitoring has an effect on absenteeism and ultimately citizen health, but we can better understand
the challenges that arise when trying to implement these theoretical models within government settings.
As new technology becomes more accessible and cheaper, governments are increasingly trying to use it to
reduce absenteeism and improve the delivery of public services. Our study allows us to better understand
the limits of technology to effect such change, and its interface with hard to change rules and regulations
that predate the availability and use of technology.
Overall, health care worker attendance increased by 14.7 percent as a result of the introduction of
the monitoring technology, despite some of the implementation challenges that we detail below. There
was substantial heterogeneity, however, within the PHCs: there were no observable treatment effects for
doctors who are in charge of the PHCs, but instead the overall treatment effect appears driven by an 18
percent increase in the attendance of the lower-level staff—the nurses, lab technicians and pharmacists.
These results are consistent with the qualitative evidence that we collected that, for doctors, public sector
jobs are increasingly becoming less attractive than private sector jobs. Therefore, the government—which
is worried about doctor recruitment—is more likely to let the rules slide for them, even when they have
very good information on their absence. On the other hand, public sector jobs for nurses continue to be
better in terms of pay, benefits and work-life balance than private sector ones and thus it is more feasible
to impose more stringent regulations on them. Note that overall treatment effect was fairly constant for
the first 10 months of follow-up, but then somewhat declined in the final months as the pilot program
wound down.4
An increase in attendance does not necessarily need to translate to an increase in citizen health.
The production function for health may require several concurrent tasks, and so just increasing attendance
may not have a large enough effect. It may even exacerbate problems if the incentives harm the intrinsic
centers and for which the staff have presumably even fewer field duties than sub-center nurses, who were only required to be at the sub-center on Mondays. Further, building on the lessons from the Rajasthan study, many steps were taken by the government in this project to restrict supervisor discretion in excusing absenteeism. Also, thanks to the innovative use of technology, data on attendance and absenteeism was now available in real time to supervisors rather than waiting for periodic reports. Finally, we have data on citizen health and health care usage to understand the relationship between better staff attendance and health outcomes. 4 There were several possible reasons that the project began to wind down. First, the head of the NRHM who introduced the program changed and there was rapid turnover of successors for whom this was no longer a priority project. Second, the research team also became less involved in the day-to-day monitoring of the system.
5
motivation of the staff to participate in these other tasks. Moreover, only nurses and pharmacists attended
more—it is possible that any gains to health would come only from doctor attendance. Finally, at the
extreme, it is possible that health care worker quality is so low (for example, see Das and Hammer, 2005;
Das, Hammer and Leonard, 2008; Das and Hammer, 2007) that any increase in attendance would not
have a noticeable effect on patient health. Thus, it is an empirical question as to whether we would
observe gains to health from increased monitoring.
We find that health outcomes indeed improve: baby birth weight increased by 67 grams in the
catchment area of the treatment PHCs, with a 4.6 percentage point decrease—or a 26 percent decline—in
the probability of being born below 2,500 grams. The level of antenatal visits was already high and did
not alter as a result of the treatment, but there is evidence that the quality of antenatal care increased in the
treatment PHCs along dimensions that were initially low (e.g. the disbursement of iron folic acid tablets).
One of the biggest changes as a result of the intervention was a change in delivery methods:
deliveries conducted by doctors increased by about 16 percent in the catchment area of the treatment
PHCs. At first, this seems at odd, as doctor attendance did not increase as a result of the treatment.
However, delivery location also changed, with more women in the treatment areas delivering in the large
public and private hospitals. Some of this may have been due to better triage by the more present nurses
and pharmacists, sending women with high-risk pregnancies to the more advanced hospitals. Moreover,
the women who had just delivered in the catchment area of the treatment PHCs were less satisfied with
staff attendance at the treatment PHCs, so it is also possible that that the treatment simply increased the
salience of the absenteeism when the women came in for their antenatal visits.
One worry in principal-agent models is that by increasing monitoring along one dimension,
employees will seek to compensate themselves along other (unmonitored) dimensions given the costs
they incur due to the additional monitoring. There is some evidence that this may have occurred, with an
overall increase in delivery costs. Some of this may have been due to doctors diverting women to their
private practices to earn additional fees, but delivery costs also increased for those who delivered at the
PHC. Moreover, women get a number of state entitlements for delivering in an institution (both cash and
in-kind payments). Women in the treatment areas were about 7 percent less likely to know about their
state entitlements than those in the control areas (significant at the 1 percent level) and they were also less
likely to actually receive their entitlements (p-value of 0.105). Thus, while the program was designed to
6
reduce one particular form of corruption (fraudulent absenteeism), it may have exacerbated other forms
(e.g. “extra” payments, lost entitlements) in response.
Our principal-agent models often have very little to say about the principal, their incentives, and
their ability to credibly implement additional monitoring and incentives. However, the principal is part of
a larger system and, in real life, faces many additional challenges in implementation. For example, in this
case, while the state government initiated and designed the pilot project with a stated goal of reducing
absenteeism, they did not actually follow through in using the better data to actually deduct the
employees’ leave balances. Some of this was due to the fact that it was also not necessarily trivial to do
so and, despite good intentions, just how difficult it was to do this was not well understood at the start. As
we detail below, it is a process that involves a multitude of stakeholders and requires much effort due to
elaborate and cumbersome civil service rules that apply to government staff.
Other challenges in implementation arose from the fact that people are still required to implement
a technology and not all people within the broader government system have the same incentives to do so.
For example, the actual implementation of human resources policy of the state government is
implemented by the sub-district health officials, who are in charge of monitoring the doctors. When
interviewed, they divulge low expectations of what is considered as good attendance: for example, they
expect doctors to be present about half of the required days of the month. When asked to rank the PHCs
under their domain from best to worst, we find that actual attendance is uncorrelated with rank,
suggesting that attendance is not a serious criterion in which they judge the PHCs. As such, they
approved most exemption requests by doctors for absences even though the state government had tried to
severely restrict supervisor exemptions.5
However, there were also more fundamental conflicts within the amorphous principal about what
the right goals are and how to achieve them. For example, there were many debates about how strongly
to actually impose the monitoring due to a fundamental tradeoff: balancing a staff that followed the rules
(e.g. being present most days of the week) with trying to retain staff and keep them motivated. Given the
Even when the state government tried to motivate the sub-
district health officials to better enforce the rules through a series of video conferences with them, an
event study analysis reveals that these attempts yielded no change in absence rates.
5 Banerjee, Duflo, Glennerster (2008) also found that the primary health center officials continually granted exemptions to the sub-centers, leading the program effect to reduce after the first six months. Interestingly, in this case, the exemptions were entered into the system by the sub-district officials and thus monitored by the state level officials; even then, they had little hesitation granting exemptions.
7
growing private sector, coupled with the fact that many PHCs are in less-desired remote locations, state
officials often claim that they have to give the staff—particularly doctors—more leeway along
dimensions other than salary in order to keep them motivated and not lose staff.6 While initially, both
types of staff were given the same level of exemptions—days they could miss without penalty—the state
government internal debates led to doctors being given more exemption days than nurses. This view is
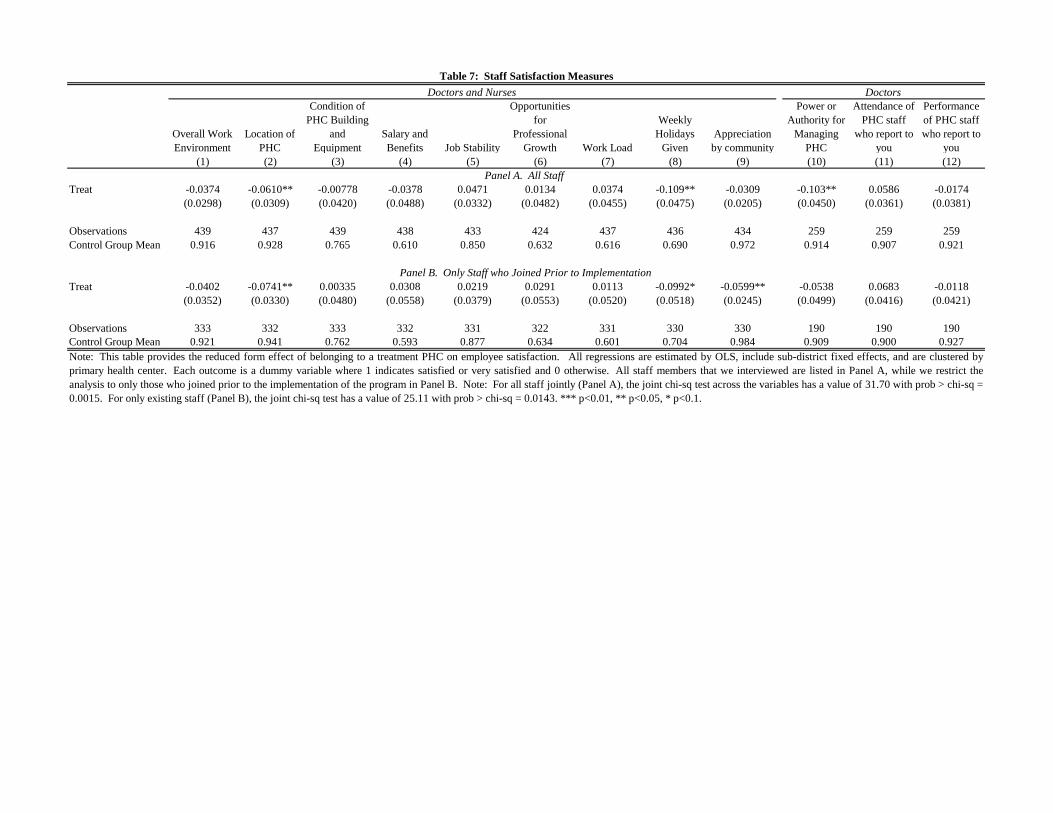
not entirely without merit: doctors and staff nurses in treatment PHCs report significantly less
satisfaction with their positions than the control just due to being monitored more, even without having
the financial penalties imposed. Moreover, the treatment PHCs attracted fewer nurses, lab technicians
and pharmacists—the very group that was most affected by the intervention— than the control PHCs,
although it is worth noting that overall treatment effect on this group is small and, even with this effect,
citizens experience large health gains.7
Similarly, the state government is not the only government body that monitors the PHCs. The
local elected government bodies (Gram Panchayat), which help monitor the PHCs and control a small
portion of their funding, could use the data and help better enforce the attendance rules since they are
beholden to citizens.
8
6 There may even be concerns about the type of staff who are recruited and stay. For example, Ashraf, Bandiera, and Lee (2014) show that higher ability staff are recruited when career benefits are posted rather than social benefits.
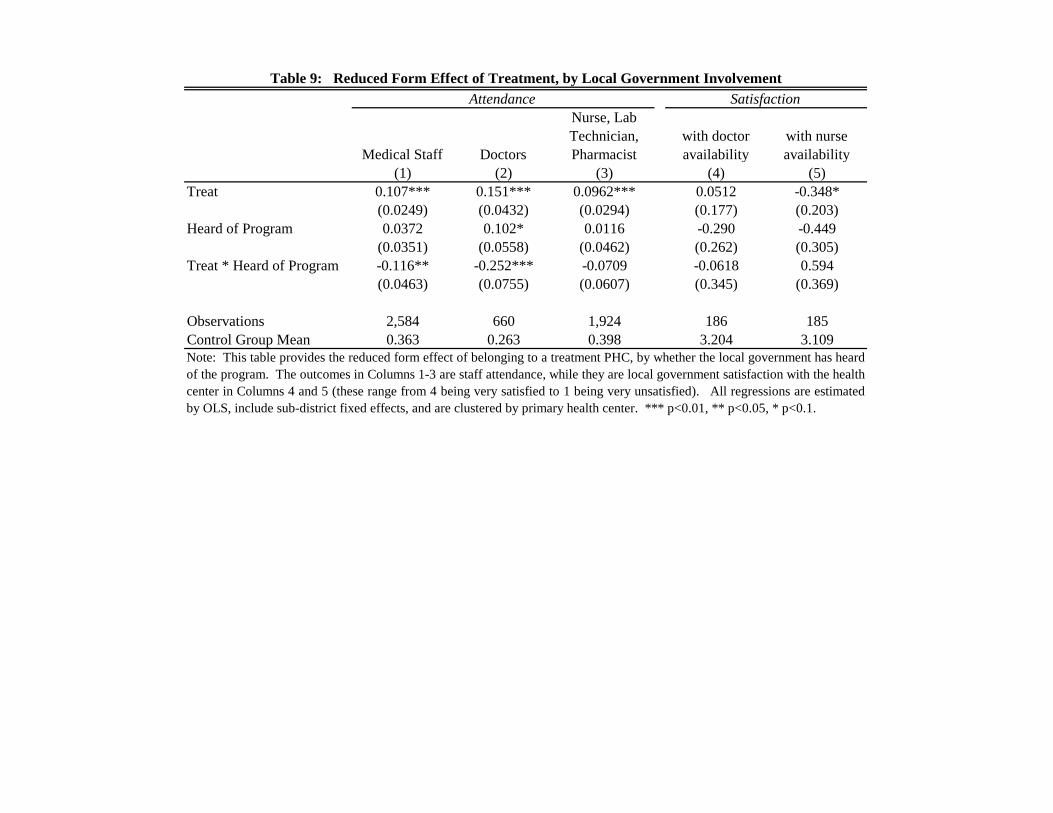
In the control group, having a more active local elected bodies—i.e. those who
have heard of the attendance program— is associated with a higher doctor attendance, by about 10
percentage points. There was a large treatment effect on doctor attendance in areas where the local
government bodies were not active, but no effect in the areas where the government bodies had heard of
the program: this suggests that even though the active local elected bodies expected higher attendance
from doctors than non-active ones, they did not expect it to increase further when provided with the tools
to do so. This was often due to their expectations of what they believed doctor attendance should be: 77
percent of the control group GPs were either satisfied or very satisfied with their attendance despite the
high truancy. Again, qualitative evidence reveals that they are worried about keeping doctors satisfied
and are, hence, hesitant to ask them to come more.
7 We cannot say for sure that we would observe doctors choosing to leave the PHCs or choosing other PHCs had the monitoring been more greatly enforced on them because we realized an equilibrium where the doctors were not penalized or stigmatized enough to attend more and the overall fees paid out to doctors by citizens increased. 8 Callen, Gulzarz, Hasanain, Khan (2013) find that doctors have better attendance in more politically competitive districts, and thus find that local politicians can improve attendance if they have an incentive to do so. However, the context here differs considerably from Callen, Gulzarz, Hasanain, Khan (2013), where the district parliaments have more say over the hiring of staff of the medical staff; in this context, a civil service process and counseling sessions with state government bureaucrats determines the staff placement and so the local elected bodies have less power over individual staff hiring and movements.
8
In short, this paper illustrates that while reforms based on principal-agent models have somewhat
clear effects in theory, in practice they are difficult to implement in real government settings due to the
complexity of the environment.9 It also shows the limits to the use of technology to improve the delivery
of public services if it is not combined with changes in the broader rules and regulations governing
bureaucrats. However, it also shows that despite this, there is real scope for improvement—in this setting,
increasing monitoring had a large effect on birth outcomes. Given the challenges of governments to
credibly monitor—and penalize—their staff, this raises many questions about the best way to improve
public sector performance. Given outside options of doctors, would improving work-life balance for
doctors (i.e. requiring fewer days, but ensuring that they attend those days) be more effective in ensuring
overall performance?10 Moreover, since we find that monitoring has an effect on staff with lower outside
options (and impacts health), can expanding public-sector nurses, rather than focusing on doctors, in rural
areas be a more efficient want to improve the health? Or should the focus move to broader reforms where
citizens are given information to better monitor local bureaucrats themselves in real time, which is now
made possible due to technology,11 or to give them choice between public and private health systems?12
The paper proceeds as follows: Section II describes the experimental design and data, while we
present the results on attendance and health in Section III. Section IV describes the reform challenges.
Section V concludes.
II. EXPERIMENTAL DESIGN, DATA COLLECTION, AND SAMPLE STATISTICS
A. Setting and Sample
India has an extensive network of about 24,000 government-run Primary Health Centers (PHCs) that
provide basic primary care to the poor, particularly those located in rural areas. These centers exhibit the
common problems observed in many government bureaucracies across the developing world: staff
vacancies, fraudulent absenteeism, limited monetary and physical resources, and so forth.
9 This also contributes to a growing literature that compares how similar program fare across NGO and government settings, such as Bold (2013). 10 For an example of this, see Banerjee, et al (2012), which explores changes in human resource practices within the police sector in India. 11 See Alatas, et al, 2013; Björkman and Svensson, 2009 for examples decentralizing the monitoring of local officials to citizens. 12 Andrabi, Das, and Khwaja (2014) showed large effects of increased competition between public and private schools, while Banerjee, Kyle, Hanna, Olken, and Sumarto (2014) showed that an increase in competition in food distribution systems was unsuccessful due to elite capture.
9
PHC Staff are required to sign in each morning with their attendance recorded on paper registers
that are maintained at the PHC and very easy to manipulate13
When questioned about their absenteeism, the health staff often mention requirements for being
in the field or in meetings, the distance of many PHCs from the district headquarters where most of the
doctors live due to the absence of “good living arrangements” near the rural PHCs, absence of reliable
and frequent public transportation, lack of demand among the local population for their work, and the lack
of appreciation among government and citizens for their service.
. As we further discuss below, there is
significant absenteeism, with employees either missing full days or attending for only limited hours. Sub-
district health officials, as well as local elected bodies (GPs), conduct surprise checks on the health
centers. Qualitatively, these checks are not very frequent, and collusion between staff means that
inspecting officials are informed either that the truant health staff is out doing field work or is sick.
14
To address the absence problem, the National Rural Health Mission (NRHM) Directorate of
Karnataka, an Indian state of about 53 million individuals, designed and raised funds to employ an
innovative biometric device to enforce the government’s actual attendance rules, which were rarely
followed in practice. They aimed to pilot the program, entitled the “Integrated Medical Information and
Disease Surveillance System” (“IMIDSS”), in 140 PHCs that were spread across five districts—Mysore,
Chitradurga, Dharwad, Dakshina Kannada, and Bidar—in order to learn how the program would function
given the diversity in income levels and institutional capacity across the state. Thus, our overall sample
consisted of the 322 PHCs in these five districts.
However, conversations with the state
government and local citizens suggest that the primary reasons for high absence is a combination of more
lucrative private practice that many doctors run on the side and the lack of effective monitoring of health
staff.
15
13 For instance when staff return to work after a few days of absence, they just add in their signature for all previous days of absence and unless a supervisor checked the records on the days the staff were absent, there is no way of detecting such “late” sign-ins.
14 One reason often cited for this lack of demand by the government was that most people prefer to either go to sub-district or district hospitals that have better facilities and specialist doctors, or to private health care (including traditional practitioners). However, in interviews with citizens, they often mentioned that they would prefer to visit the local PHC, but cited the absence of doctors (or even closed PHCs), “unsatisfactory” treatment, and the lack of medicines as the reasons for not using them. 15 The initial government listing consisted of 350 PHCs. However, upon investigation, 20 were not actually PHCs (but rather Community Health Centers or Maternity Centers), 1 was a duplicate PHC, and 1 was adopted by a medical college and not fully under the government control; these were excluded from our sampling frame. Six PHCs refused to participate in any surveys and pilot projects, leading to the final sample of 322.
10
Note that with an expected catchment area of about 18,000 individuals per PHC, even this small
pilot had the potential to affect health services delivery for the over 2.5 million individuals that belonged
to the catchment area of the treated PHCs.
C. Experimental Design
Out of the 322 PHCs, 140 were randomly assigned to be part of the pilot project, while the remaining 182
PHCs maintained the status quo. Details of each treatment are as follows:
Comparison PHCs (Status Quo): The PHCs are open daily from 9AM to 4:30 on weekdays, and 9AM to
1:00PM on Sunday and holidays. The staff are required to work seven days a week, but nurses, laboratory
technicians, and pharmacists are allowed to take the second Saturday of each month off. A fraction of the
PHCs are open for 24 hours a day (about 40 percent in our sample), with most staff present for the day
shift and additional nursing staff present at night. During work hours, the PHC employees are expected to
be physically at the PHCs, except for monthly meetings and the occasional field visit if approved by a
supervisor (the sub-district health officer for the doctor, and the doctor for all other staff).
There is an official leave policy, but it is not followed in practice. Each staff member has 15 days
of guaranteed leave a year, which they need to use that year; doctors are responsible for approving and
maintaining the records for these leave days (including for themselves). In addition, each staff member
can accumulate up to 30 days of “earned leave days” each year. Deductions of earned leave are
maintained at the state-level, Accountant General office. These days are valuable because unused days
can be carried forward to the next year and cashed out in small amounts every year or at the time of
retirement. Thus, the staff do not like to officially “use” these days to take leave and prefer instead to
cash them out.
The sub-district health officers (taluk health officers, or THOs) are administratively responsible
for implementing the health programs of Department of Health and Family Welfare within each sub-
district through the network of PHCs and a network of sub-centers that fall under the PHCs. They are
also in charge of training, as well as the day-to-day monitoring of the PHC staff. However, they do not
have the direct authority to enact disciplinary action: the power to take action against lower-level civil
servants (e.g. Nurses, Lab Technicians, Clerks) rests with the District Health Officer (DHO), while the
authority to take action against higher-level civil servants (e.g. government doctors) rests only with the
11
state. The sub-district officer can only provide complaints regarding the staff members or PHCs to the
district health office, who then also involves the state government if the problem is not within their
domain.
In addition, the local elected bodies (Gram Panchayats, or GPs) are also involved in monitoring
the PHCs: in our control group, 81 percent report conducting a monitoring visit of the PHC at least once
in the last three months and 69 percent report that a doctor had attended at least one GP meeting in the
last three months. Moreover, about 80 percent had a joint account with the PHC for certain funds, and 86
percent managed untied funds that they could use at their discretion to incentivize the PHCs.
Treatment PHCs: The government aimed to utilize the bio-metric devices to enforce the existing leave
rules for the PHC staff through improved attendance monitoring. The state government supplied each
PHC with an “IMIDSS device,” consisting of a fingerprint reader (FPR) and a multi-purpose mobile
phone device (Figure 1). Each staff member was required to scan their thumb when they arrive and when
they leave the PHC. A designated staff member at each PHC is responsible for daily uploading of the
fingerprint data to a dedicated office in the state capital that managed the pilot project. The PHC was also
required to enter in details on disease counts and information on women who gave birth at the PHC.16
There are several important contextual details: First, while the PHC employees were supposed to
primarily be present at the PHC, they were allowed some flexibility for attending meetings or for
occasional field visits. Specifically, in increments of half-days, the doctor was allowed a maximum of 5
full day exemptions for work outside the PHC each month, the staff nurse was allowed a maximum of 2
full-days, and all remaining staff was allowed a maximum of 3 full days. The doctor could approve all of
these allowed exemptions (including for himself), but any exemptions above and beyond this were to be
approved by the sub-district health officers, who were informed by the state government repeatedly that
approval for these additional exemptions should be rare and that their patterns of granting exemption
would be reviewed in turn by their supervisors. In practice, the sub-district officer approved almost all of
16 Senior officials were concerned that if the system “looked” too focused on attendance, there would be resistance. Thus, it was decided that additional health data would be collected to frame the program as a general program to improve the PHC functioning. In practice, the disease counts were never used by the government in planning. Moreover, most of the staff recognized that the machines were primarily focused on attendance: for example, one staff nurse from a treatment PHC referred to it “Punch-in and Punch-out machine.” At all levels of administration, the system was commonly known as “the Biometric Program,” showing the ultimate belief that the system was in place to address attendance, rather than collect disease counts.
12
the exemptions that were submitted. Rarely, they refused, but this was only for lower level staff and for
obvious cases of misconduct (such as absences that lasted several weeks at a time).
Second, even with the precise attendance data, it is not trivial to use these data to actually deduct
absences. Using the times and dates of the fingerprint readings, the state government can calculate the
number of working days of each staff member in a given month. At this point, the government also can
collect the exemption records from the sub-district offices and the leave days taken from the machines to
calculate whether there is a shortfall in attendance, and if so, by how many days. The shortfall is
supposed to be communicated in the form of a memo (a “show cause notice”) to each PHC staff, which
allows him or her to offer explanations as to his/her unauthorized absence. Once the memo is returned, it
is acted on by the sub-district health officer, who is authorized to debit the days exceeded from the staff
member’s leave balance. First, they deducted the guaranteed leave days that are accrued to the staff; to do
so, the sub-district officer needs to communicate the deductions to the doctor, who maintains these
records at the PHC. After the guaranteed leave days are depleted, the sub-district officer can start to
deduct the earned leave balance; this requires that the sub-district officer make a presentation to the
Director, Health and Family Welfare in Bangalore, with detailed reasons for the leave debits. If the leave
deductions are approved by them, the request is forwarded by the Director to the Accounted General
office, a different department within the government. As we discuss below, only in very rare cases did
the truant staff receive a formal “show-cause notice” from the state government and the sub-district
officers never made any real efforts to actually deduct the unauthorized absences from the leave balances.
Third, to motivate staff, the state government announced that they would also link the staff-level
and the PHC-level awards to the attendance data for those PHCs in the program. Since there were
concerns around awarding cash awards to PHCs or staff, instead the government proposed non-monetary
awards such as “Best PHC for overall attendance” and “PHC staff with highest attendance.” However,
during the Annual Doctors’ Day in 2012, none of the awards that were given out were actually linked to
the IMIDSS system data.
Fourth, to prevent damage or the misuse of the device, the government appointed one staff
member at each PHC – typically either the pharmacist or the lab technician–to be in charge of the
device.17
17 In addition, the government also appointed a Block Program Manager (BPM) from each sub-district to respond to questions on how to use the system, as well as to arrange for repairs and the replacement of broken machines. They
The government provided this person with Rs. 500 ($9.10) per month to ensure that the device
13
was functioning. However, this payment was performance-driven: for each day in a month that the
device was not functioning (and hence not uploading data), Rs. 50 ($0.91) would be deducted for that
month; thus, if a device was not functioning for ten or more days in a month, he or she would not receive
any payment for caring for the device. However, any disbursement of cash required approval of the
Program Budget by the National Mission Directorate of the Government of India by March for the
upcoming financial year and this posed a challenge. In the first fiscal year of the program, every
appointed staff member received a bulk payment for the full amount, irrespective of machine functioning;
this was done to motivate these staff members and as a promissory gesture. In the second fiscal year, the
disbursement of payments did not consistently happen on a monthly basis.
Finally, during the course of the pilot study, it would be near impossible to keep knowledge of the
experiment from the control group and vice versa. Thus, from the start, all staff members were informed
of the pilot project and informed that selection into the pilot was at random. Given the initial plans to
scale the program after one year, the government informed all staff members that they were testing the
system this year to work out the bugs in it, and that it would be expanded to all PHCs the following year.
D. Randomization Design and Timing
The unit of randomization was a Primary Health Center (PHC). Given that the government had a budget
to procure a maximum of 150 machines (including 10 spares), we randomly selected 140 PHCs from the
322 PHCs in the chosen districts, stratified by the 29 sub-districts (“taluks”). In four districts—
Chitradurga, Dharwad, Dakshina Kannada, and Bidar—we selected about half the PHCs in the district. In
Mysore, the biggest and most developed district, we selected 36 out of 120 (about 30 percent).
We had requested that staff transfers be frozen to prevent potential movement from the treatment
group into the control during the duration of the experiment, and this was agreed upon by the government.
However, people do join and leave the service. The transfer decisions and placements for new hires for
the entire department are typically decided upon each June through a systematic program called
“counseling” that is held in the capital city of Bangalore. However, while the government made efforts to
not take the treatment into account during the counseling, individuals do express location preferences were provided up to Rs 1000 ($18.18) per month for this work: each time a device was inoperable due to mishandling, Rs. 100 ($1.82) per PHC per day would be deducted from the total and they would be fined Rs. 25 ($0.45) per PHC for each day that data was not uploaded for reasons other than network or server failure. Again, the disbursement of these payments had similar budgeting and delivery issues as that of PHC level staff.
14
during the counseling meetings, and the additional monitoring at the treatment centers was well-known.
Thus, we assigned the few staff that transferred within our sample their original treatment, dropped all
new staff members from the attendance analysis, and then systematically explored the entry and exit in
the treatment PHCs.
As shown in Figure 2, in July 2010, we conducted random checks to assess the baseline
absenteeism rates and conducted a baseline facility survey. These surveys were conducted in anticipation
of the government’s plan to deploy the IMIDSS system in September 2010. In practice, the machines
were only procured in March 2011, and so we conducted a second baseline survey in the summer of 2011.
After piloting at a few PHCs to ensure the functioning of the system, the government conducted training
sessions and rolled out the system in Mysore district in July 2011. The training for the other districts (as
well as a retraining for Mysore) was conducted in September to October 2011.
After the intervention commenced, we conducted seven rounds of random checks. We conducted
the first round (August 2011) only in Mysore District, which received the system first. We conducted the
subsequent follow-up random checks between September 2011 and November 2012. In November and
December 2012, we also conducted a series of endline surveys with the various project stakeholders
(facility survey, doctors, nurses, sub-district health officials, local elected officials, and women who had
given birth within the timeframe of the experiment) to assess the impacts of the program.
E. Data Collection
We administered several types of surveys. First, we conducted “random” checks on the PHC to assess
each employee’s attendance. We conducted two rounds of unannounced checks to assess baseline
attendance and seven follow-up rounds to assess program impact. For logistical purposes, we generally
surveyed the PHCs within the same sub-district over concurrent days. We randomly assigned the time of
day that PHCs were checked so that no PHC was always checked at the same time of day.
For each random check, the enumerator conducted a surprise visit at the PHC and recorded the
attendance of all staff at the moment that he or she arrived; if it was closed on arrival, everyone was
considered absent. The enumerator then inquired about who was transferred or resigned (they were
subsequently dropped from the sample). Next, the enumerator counted the number of patients present at
the time of the visit and the number of patients in hospital beds. For treatment villages, the enumerator
additionally checked whether the IMIDSS system was in working condition and being used. Although
15
the checks were infrequent, there was a concern that the monitoring associated with the random checks
could affect attendance as well; therefore, 50 percent of sample was randomly selected to be visited only
in every other follow-up survey round so that we could test for possible Hawthorne effects.
Second, we administered a facility survey at the start (July 2011) and end (November to
December 2012) of the study. This survey was designed to gather general information about the PHCs:
hours of operation, number of staff, the number of patients, disease counts, quality of infrastructure, and
available medicines and vaccines.
While conducting the facility survey during endline, we also conducted surveys with the doctor
and one staff nurse at each health center to learn more about their background, work experience,
perception of working conditions, and the system.18
Next, we interviewed members from the local government body (Gram Panchayats, or GP) that
fell within the catchment area of the PHC to learn about the village demographics, their interactions with
and perceptions of the PHCs, their perceptions of the GP quality, and their beliefs on the IMIDSS system.
Due to monetary constraints, we interviewed GPs in all districts except Mysore. We interviewed the
president of the GP in 61 percent of the cases and we interviewed the vice president in 11 percent of the
cases; in the remaining villages, we interviewed an active member.
In addition, we also conducted interviews with the
sub-district health officers, who are responsible for monitoring all PHCs (including staff attendance) in
their sub-district to learn more about their interactions with the health centers.
Finally, we conducted a survey of women who had given birth in the last year within the
catchment area of the PHC. We randomly selected a village from the catchment area of each PHC for all
districts other than Mysore and conducted a census of all women in that village who were pregnant during
the experiment and their pregnancy outcomes. We then randomly selected 4 women per catchment area
who had given birth during the course of the experiment to learn about where they had given birth, who
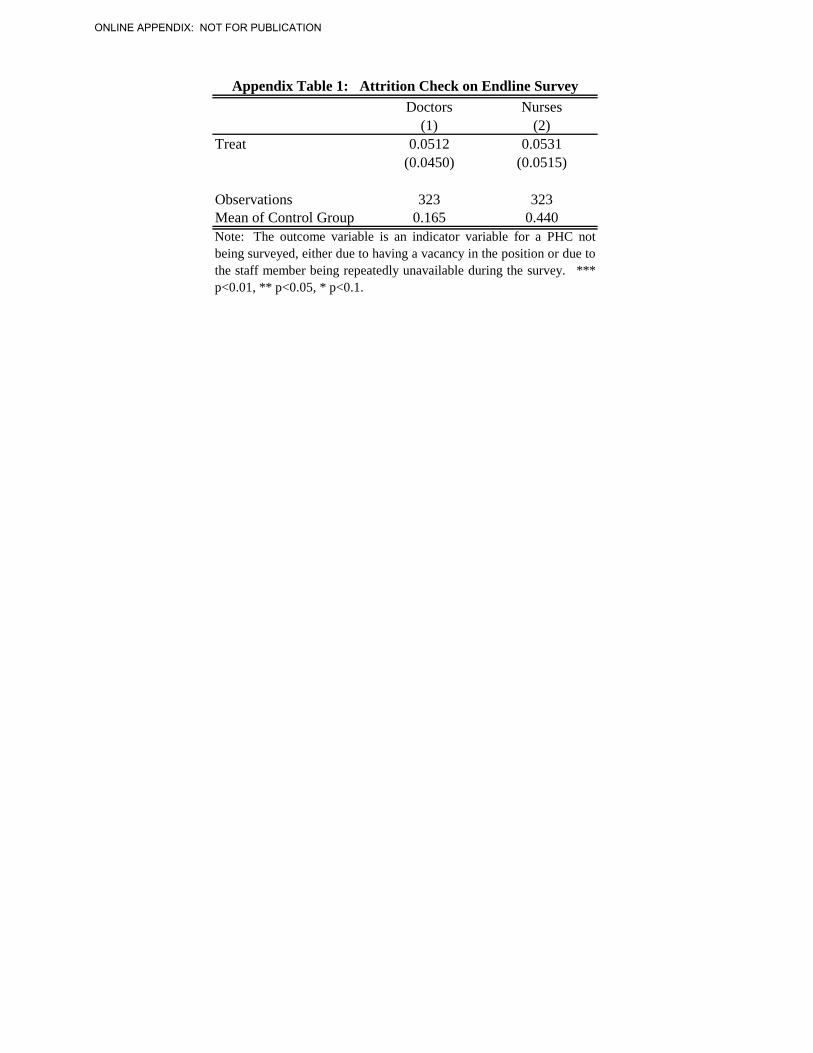
18 Not all PHCs that we attempted to interview were included in this survey. First, not all PHCs had a doctor or staff nurse employed as vacancies are common. Second, there were a small percentage of doctors and nurses who were never present during any of our attempts to interview them. In Appendix Table 1, we regress an indicator variable for whether the PHC was not interviewed on the treatment variable and sub-district fixed effects; PHC were more likely to be missing in our sample if they were in the treatment, but this is not significant. The endline surveys are primarily used to understand staff satisfaction and management of PHC. If staff left the treatment PHCs at a higher rate due to being unsatisfied with the NRHM program, then we would underestimate the level of dissatisfaction. Thus, our estimates will provide a lower bound on the dissatisfaction levels with the program.
16
conducted the delivery, how much they paid, whether they had antenatal care, their perceptions of the
PHC, and the baby’s birth weight.19
In addition to the survey data, we obtained administrative data from the government on the
program functioning. In particular, we obtained all data from the IMIDSS system, including both the
biometric records and the disease counts collected within the system.
Finally, to better understand how the program was operating in practice, our team conducted
extensive interviews with the government (state officials, district and sub-district health officers), PHCs
staff and local residents during the course of the study, as well as recorded their field observations.
F. Summary Statistics
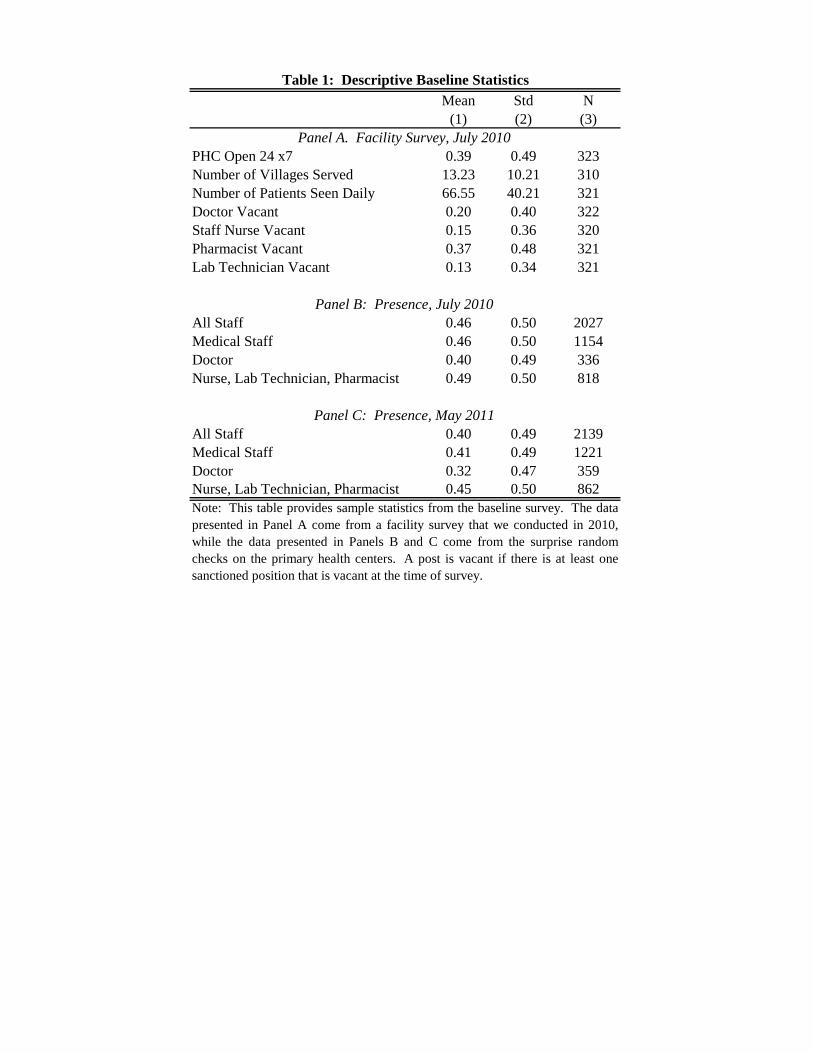
Table 1 provides baseline sample statistics from the facility survey and the first two rounds of random
checks. As shown in Panel A, the PHCs served, on average, around 13 villages, and claimed an average
of 67 patients per day (or about 24,500 patients per year). About 40 percent of them were open 24 hours
a day, while the remaining PHCs were on a 9am to 4:30pm schedule.20
Staff presence is generally low: in the first round of the random checks, the nurses, lab
technicians and pharmacists (henceforth, NLP for conciseness) were present in only 49 percent of the
checks, while the doctors were there in 40 percent of them. These rates continued to remain low ten
months later during the second round of checks: for example, the doctors were only present at the PHC in
32 percent of the random checks. While these numbers seem low, they are consistent with the
persistently high absenteeism observed in other studies: Banerjee, Deaton and Duflo (2003) reported a
54 percent attendance rate of the PHC (and the larger Community Health Centers) staff in Rajasthan,
Recruiting staff to rural or
remote areas is a challenge for the state government, especially in the presence of a growing private
health sector. This is reflected in relatively high rates of vacancies: for example, in the baseline, 20
percent of PHCs had at least one unfilled position for a doctor, 15 percent for a staff nurse, 37 percent for
a pharmacist and 13 percent for a laboratory technician.
19 We did not want to interview women who had just experienced a miscarriage, a still-birth, or sudden infant death, as it was a sensitive time for them. Thus, we only conducted in-depth interviews with women who gave birth to a living child. If the intervention reduced infant mortality, the effect of the intervention on infant mortality could be biased downwards. Thus, this would provide a lower bound estimate of the effect of the program on birth weight. Nonetheless, in Appendix Table 2, we test for the effect of the program on stillbirths, miscarriages, or infant death at the time of birth. These are low probability events, and we do not observe any difference based on treatment status. 20 9AM to 1PM on Sundays and Holidays.
17
while Chaudhury, et. al. (2006) found a 60 percent attendance rate in a nationally representative survey of
PHCs in India, with doctors more likely to be absent than lower-level staff.
These high absence rates are unlikely to be fully explained by field activities or other work
activities (e.g. trainings, meetings).21 The staff are primarily obligated to be at PHC during operating
hours, and those who have more limited field responsibilities (e.g. laboratory technician, pharmacist)
exhibit the same high rates of absenteeism as everyone else. Furthermore, Banerjee, Deaton and Duflo
(2003) tracked sub-center nurses in Rajasthan who were absent during their random checks, and found
that the nurses were only in the villages attached to their sub-centers in 12 percent of the cases.22
G. Experimental Validity
The first threat to experimental validity is that, by chance, the randomization leads to imbalanced groups.
Appendix Table 3 provides a check on the randomization; Panel A explores balance across the PHC
characteristics in the baseline facility survey, while Panel B tests for balance across the baseline
attendance measures. The treatment and control groups appear fairly balanced along these dimensions: a
joint-test across the facility measures yields a p-value of 0.81 and a joint test across the attendance
measures yields a p-value of 0.26.
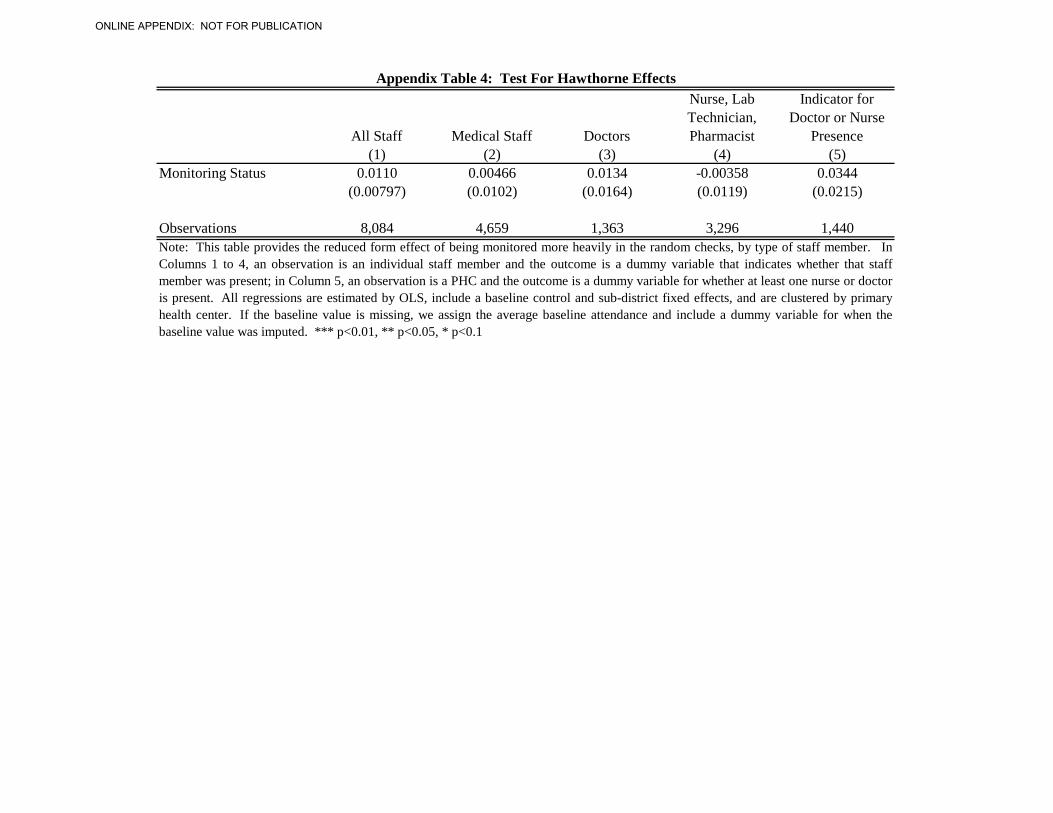
A second threat to experimental validity could stem from two potential forms of “monitoring”
effects. First, even though we conducted the random checks relatively infrequently, there could be a
concern that the checks affected attendance as well. However, because the checks were conducted
equally among the treatment and the control groups, it is unlikely that this caused a differential effect.
Nonetheless, we randomly selected 50 percent of the PHCs to be visited at a lower frequency. Appendix
Table 4 shows that the monitoring frequency does not significantly impact attendance.
Second, it is possible that others within the government system (e.g. local government bodies or
sub-district officials) change their own monitoring of the PHCs as a result of the system. The direction of
the effect is ambiguous. They may see the machines as a substitute for their own activities and monitor
the PHCs less, or the system may make the absenteeism issue more salient and thus increase their own
monitoring. This is not necessarily a threat to validity: the fact that they change their behavior based on
21 Even if we assumed that every month the doctors spent 5 days in the field and took 2 legitimate leave days (which are both unlikely), their attendance rate should still be 77 percent. Thus, there is a large scope for improvement. 22 Hanna and Wang (2013) also played a series of laboratory games with these staff nurses which and showed that absence was correlated with cheating in the laboratory games. This further suggests malfeasance.
18
the machines may occur in the actual scale-up as well, and thus may be an important policy outcome to
consider. However, the worry is that their behavior changes are just due to the experiment: for example,
suppose they have a fixed amount of time for monitoring activities, view the machine as a substitute for
their activities and thus differentially shift all of their monitoring into the control group, whereas if the
treatment was applied everywhere, there would not be a differential shift. In this case, we may
underestimate the effect of the machines.
In Appendix Table 5, we test for whether the treatment induced differential monitoring by either
the sub-district health officer or the local government body (GPs). We find no observable relationship
between the sub-district officials monitoring of the PHC and the treatment status (Columns 1 and 2).
Contact between the local government bodies and the PHCs is already high, with 81 percent of the GPs
having conducted at least one inspection of a GP in the last three months (Column 5). We find no
significant differences in contact between the GPs and the PHCs, and in fact, the signs of the coefficients
show no clear pattern in terms of direction (Columns 3 – 6).
III. RESULTS ON SYSTEM USE, ATTENDANCE AND HEALTH
A. Did the Primary Health Centers Use the IMIDSS System?
In Table 2, we document whether the treatment PHCs received the system and whether it was functional
at the time of the random check. As no PHCs in the control group received the IMIDSS system, we
simply present sample statistics for the treatment group. While all PHCs received the system, it was only
currently functioning in 66 percent of the random checks. This malfunctioning was often due to a missing
or uncharged phone: in 13.9 percent of the cases, the fingerprint reader was not in working order, whereas
the phone was not working in 28.6 percent of cases.23
If the machines were functioning, the PHCs typically used them. In the random check data, 67
percent of the PHCs report uploading data to the state government the day before the check; this is
consistent with the percentage of machines in working order. The rate of reporting data is even higher if
we examine the administrative data from those same days: on 82 percent of the days, at least some data
are recorded. The machine stores 40GB of data at a time, and so even if data is not uploaded to
23 Mobile coverage is fairly decent. In 93 percent of the random checks, the enumerator was able to detect a signal. In cases where there was no signal, it was due to fluctuations in signal, rather than persistence in non-coverage.
19
Bangalore on a particular day, this implies that at least some staff used the fingerprint reader on those
days and the data were eventually uploaded.
As we discuss above, it was challenging to actually deduct leaves and demand to do so was low
even by the supervisory staff at the state headquarters. Thus, even though the PHCs tended to upload the
data, the government did not end up using the data to enforce the existing attendance rules. Thus, while
the intervention increased staff monitoring, it did not change the probability of penalty if one was
shirking.
B. Did the Intervention Reduce Increase Health Worker Presence?
The natural question that follows is whether the additional monitoring had an effect on staff attendance.
In Table 3, we estimate the reduced form effect of the program on attendance as measured by the random
checks.24 Specifically, we regress an indicator variable for whether the staff member was present during
a given random check on a dummy variable indicating treatment status, one’s average attendance rate in
the random checks, and sub-district effects.25 All standard errors are clustered by PHC. We only include
staff who were employed at the time the intervention began, given the differential selection by new hires;
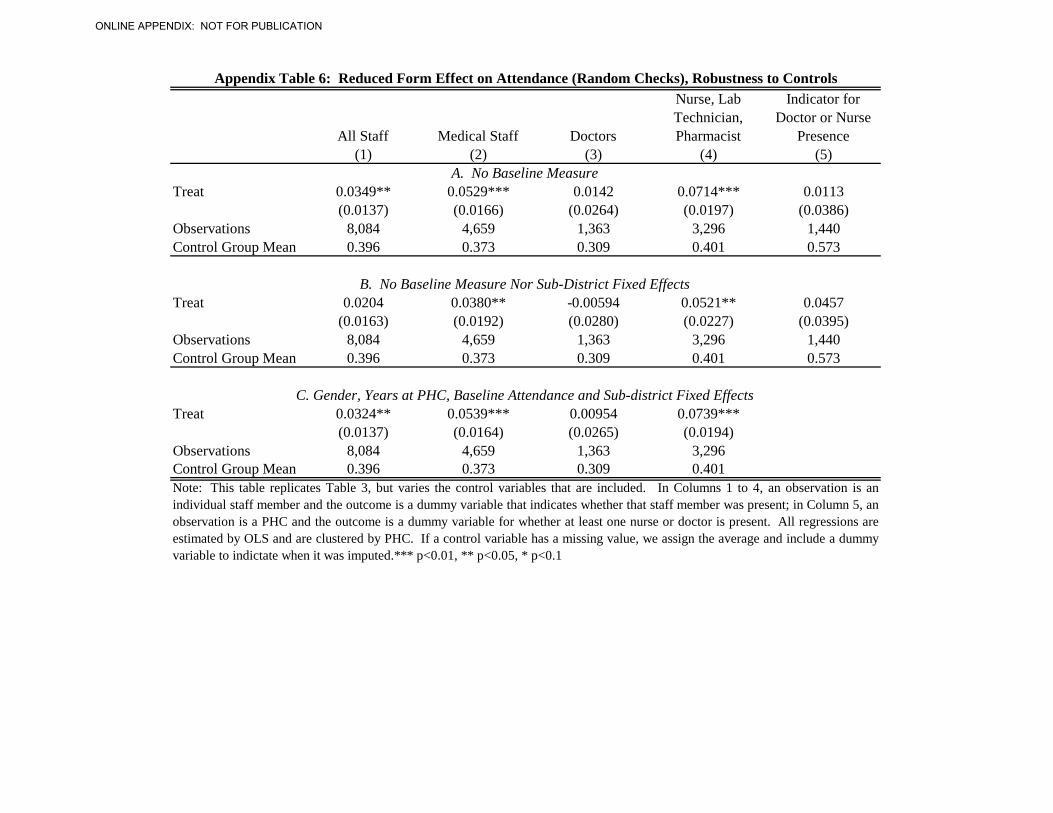
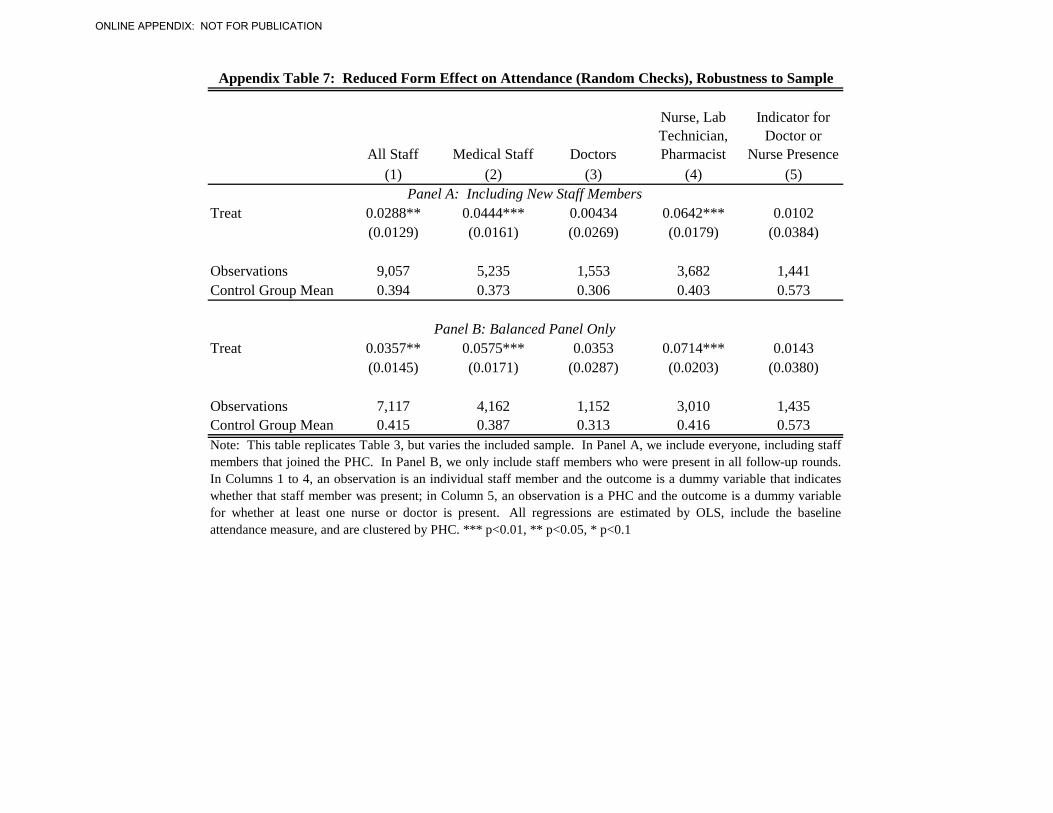
as Appendix Table 7, Panel A, shows, the results are also robust to their inclusion.26
The introduction of the machines to monitor attendance led to a 3.4 percentage point – or 8.7
percent – increase in all staff attendance (Column 1 of Table 3). The medical staff experienced a 5.5
percentage point –or 14.7 percent–increase in attendance (Column 2). However, there is heterogeneity in
the treatment effect: there was no observable treatment effect for doctors (Column 3), but about a 7
percentage point—or 18 percent increase—for lower level medical staff, the NLP (Column 4).
27
24 We focus on the reduced form effect of the program, rather than the IV on attendance, because one can imagine the machines having an effect on staff behavior beyond increased attendance. For example, suppose that one did not increase one’s attendance, but was now worried that citizen complaints can have a larger effect on their promotions and awards because the better absence data would be scrutinized if there was a complaint. In this case, the staff member could increase their performance while present, even if they did not increase their attendance.
25 If the baseline is missing, we input it with the average and also include a dummy variable indicating imputed baseline values. In Appendix Table 6, we explore the robustness of the estimates to varying the control variables. The results are near identical when we omit the baseline control (Panel A). As expected, we lose some power when omitting the strata fixed effects, but the statistical conclusions that the NLP are more likely to be present does not change (Panel B). In Panel C, we include individual-level control variables for gender and years at the PHC; again, the results are near identical to those in Table 3. 26 Note, that we also test the robustness of the results to dropping individuals who left the PHC from the sample in Panel B of Appendix Table 7; the results from the balanced panel are near identical to that those with their inclusion. 27 We group together nurses, laboratory technicians and pharmacists as they tend to provide triage services. In Appendix Table 8, we further disaggregate by staff position. There is a significant effect of treatment on both nurses
20
The difference between the doctors and the lower-level staff may stem from the relative
differences in the stigma cost of being seen as “delinquent” by others within the system, even if salaries
were not cut. For example, the 15 sub-district health officers that we surveyed also reinforced the notion
that they did not perceive a day of absence by a doctor as negatively as a day of absence by a nurse: on
average, the sub-district officials claimed that they only expected the doctors to be present 16 days a
month (or about 54 percent of the time). In contrast, they expected nurses and other medical staff to be
present much more often, between 23 and 24 days a month.
The difference may also arise from differences in outside options: the state-level staff often
discuss that it is hard to monitor doctors due to high levels of vacancies and the relative difficulty of
recruiting them against a growing private sector. To better understand the market for doctors and nurses,
we interviewed students at several local medical colleges and nurse schools. Almost all of the nursing
students claimed preferring government jobs to private sector ones on the grounds that the government
jobs paid better, included better benefits, had more stability since you were less likely to be fired, and had
more reasonable work hours.28 For medical students, the picture was more mixed: a majority that we
spoke to claimed to prefer the private sector—citing the higher salaries, better location, more potential for
promotion, and less politics or fear of transfers. Medical students who preferred the government jobs
cited that they preferred the benefits and the stability, little monitoring over their time, and stability (no
chance of being fired). In fact, the idea that the government jobs were only competitive in recruitment
due to flexible non-monetary benefits (and that it would be less attractive if they disappeared) was
repeated time and again by almost everyone that we spoke with.29
Finally, we tested whether the treatment increased overall hours of coverage by a doctor or a
nurse: we regress an indicator variable for a doctor or nurse being present at the PHC on the treatment
status and sub-district fixed effects (Column 5). We find no effect on overall coverage, which suggests
that the nurses generally increased their presence during the hours when the doctor was also present and
thus could also be aware of their attendance, providing further support to the idea that the stigma of being
seen as delinquent by their superiors may drive the nurses’ behavior.
and the laboratory technicians/pharmacists, and find no significant difference between them. Thus, we feel comfortable grouping them together for the main analysis. 28 In fact, the nursing students said that they viewed private sector jobs as a way to get experience while one is trying to get a government job. 29 For example, one pharmacist we spoke to explained that her salary was nearly double when she worked in the private sector, but that the government job offered “family-work balance.” Without this balance, the government job is less attractive than her previous employment.
21
C. Patterns in Absence by Location and Time
We next explore potential patterns in the treatment effect. This is important because it allows us to
provide insights if we want to generalize to other contexts (e.g. variations in institutional quality, etc.), as
well as test what happens when there is less institutional support for the program. Note that in all of the
following graphs and regressions, we continue to control for baseline attendance and the sub-district fixed
effects and to cluster the standard errors by the PHC.
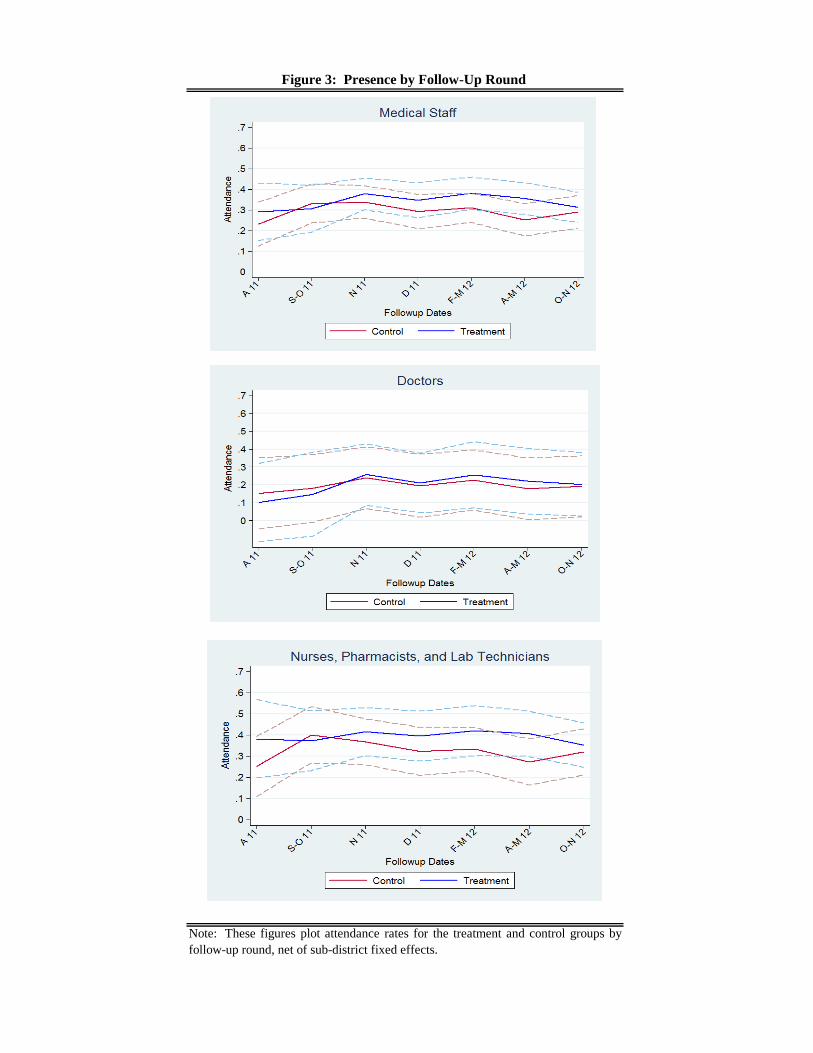
In Figure 3, we first explore the treatment effect by survey round. We cannot reject that the effect
differs over time, although we qualitatively observe a shrinking of the treatment effect in the last round
(October 2012), at a time where the leadership of the health department had been changing, the pilot
began to wind down, and we had reduced our support to the state government to implement the day-to-
day running of the system.
Second, we had randomly varied the time of day that the PHCs were checked. Interestingly, the
biggest observed effect occurs in the morning. However, once the treatment NLPs arrive in the morning,
they stay for the full day, whereas the treatment doctors compensate their earlier attendance by being less
likely to be present at later hours. This is consistent with the interviews we conducted with the PHC staff:
the nurses stated that the program forced them to take earlier buses and, in general, make a conscious
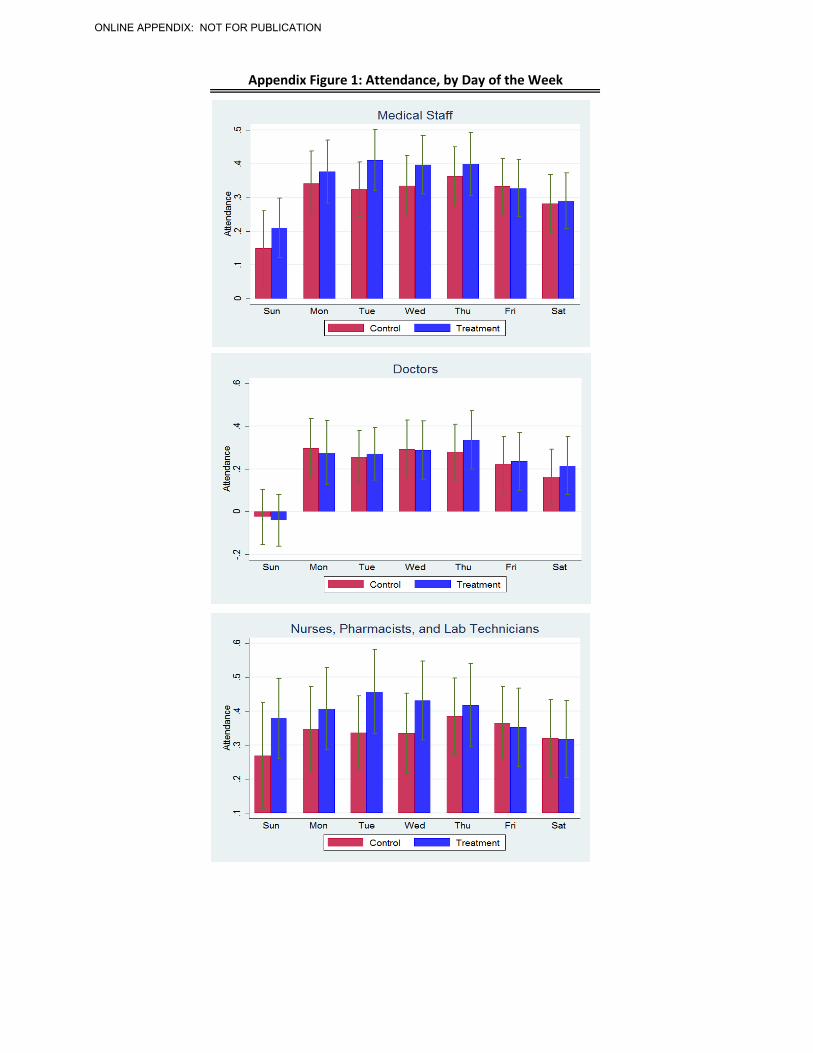
effort to be at work on time. We also explore attendance by day of the week in Appendix Figure 1. For
medical professionals as a whole, it appears that the treatment effect occurs on most days, except Friday
and Saturday (perceived weekend days).
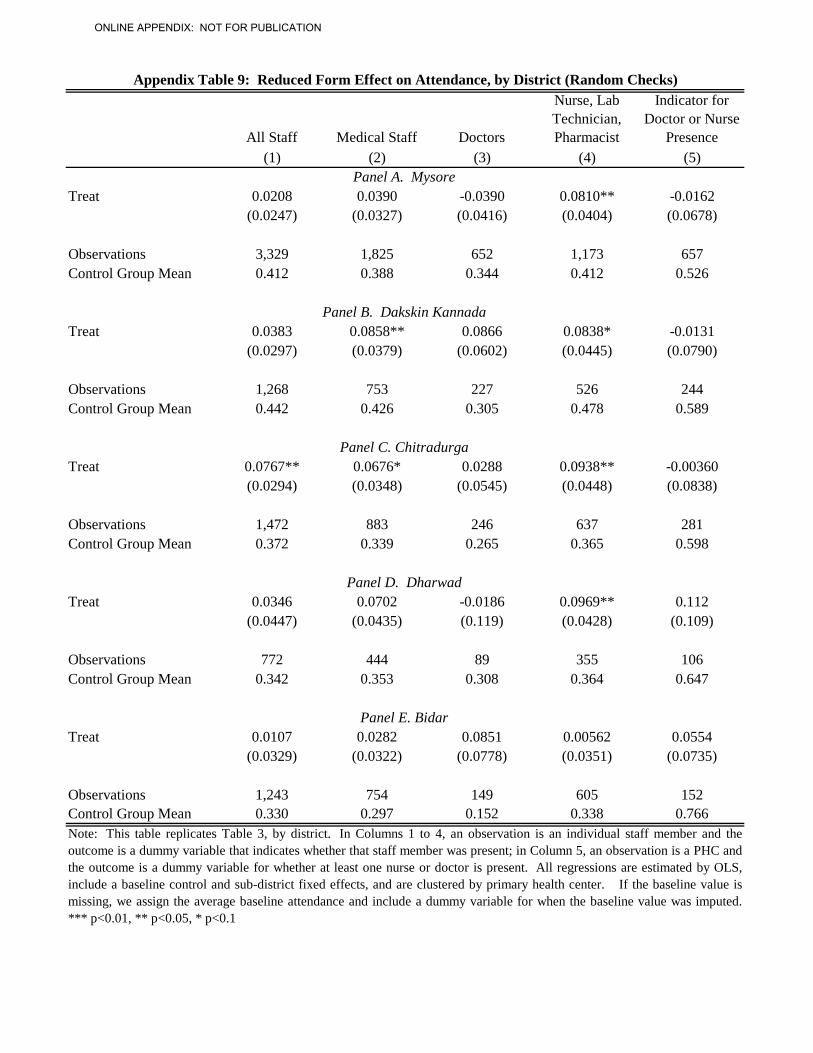
Finally, in Appendix Table 9, we estimate the treatment effect by district. The government
purposely chose districts that capture Karnataka’s socio-economic diversity, variation in institutional
capacity and their a-priori belief about inter-district variation in absenteeism rates. The ordering of the
table panels reflects this: Mysore is the most developed and closest to the capital and Bidar is the least
developed and farthest. We find qualitatively similar treatment effects for Mysore, Dakshin Kannada,
Chitradurga, and Dharward. In the least developed district, Bidar, we do observe qualitatively large
effects for doctors (almost 9 percentage points over a mean of 15 percent in the control), but the
22
coefficient is not significant at conventional levels (p-value of 0.28), perhaps due to smaller sample
sizes.30
D. Effects on Health Services Delivery
The intervention increased the presence of the nurses, laboratory technicians and pharmacists by 18
percent, but had no observable effects on doctors. The question that follows is whether this increase in
attendance had any meaningful effects on health care provision and outcomes. On one hand, increased
presence may allow for more time to treat patients and to triage high risk patients to the more advanced
district hospitals.
On the other hand, there are a number of reasons why there could be no effect: NLP could multi-
task, i.e. show up more, but simply slack off when present. Perhaps only doctor presence affects health,
or the increase in attendance was not large enough to have any noticeable effect on health? Or, even at
the extreme, that health care worker quality is so low (for example, see Das, Jishnu and Jeffrey Hammer,
2005; Das, Jishnu, Jeffrey Hammer and Kenneth Leonard, 2008; Das, Jishnu and Jeffrey Hammer, 2007)
that any increase in attendance would not have an effect on patient health.
To explore these issues, we surveyed 4 randomly selected women from a randomly selected
village in each PHC catchment area who had recently given birth.31 Tables 4, 5A and 5B provide these
findings; note that we always include sub-district fixed effects and cluster by PHC.32
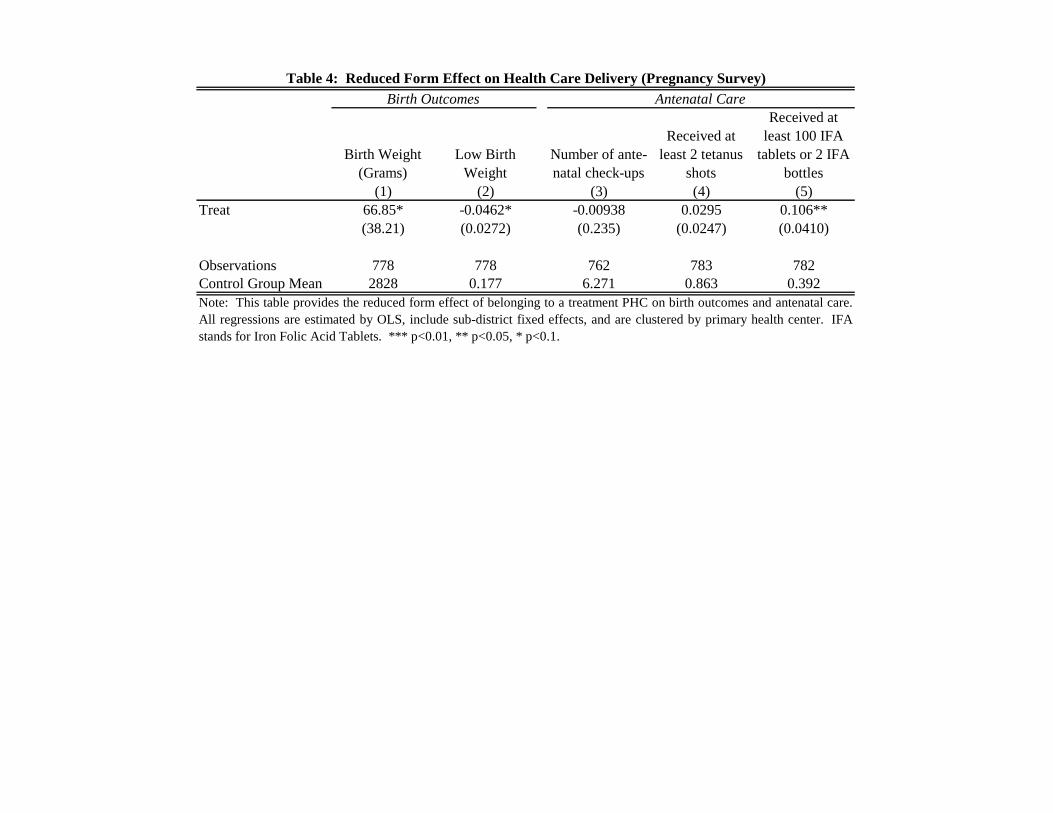
The intervention led to a substantial increase in baby birth weight (Table 4). On average, babies
weighed 67 more grams at the time of birth (Column 1 of Table 4) in treatment areas, and there was a 4.6
percentage point reduction—or a 26 percent decrease—in the probability of being born below at or below
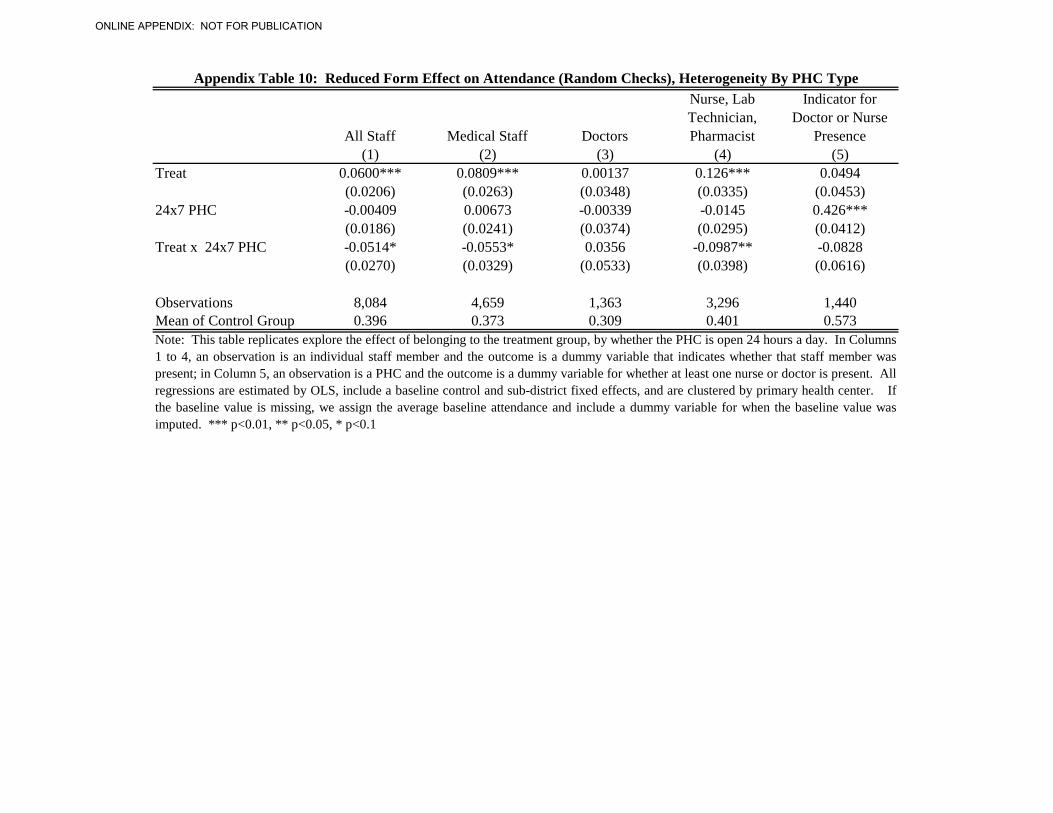
30 In Appendix Table 10, we test whether the treatment effect varies by whether the PHC is open 24 hours a day or not. Staying open 24 hours a day places more demand on the staff, even though there are more typically more staff employed. It is also much more difficult to monitor attendance for these PHCs for nurses as there may be multiple shifts. We find that much of the effect of the NLP occurs in PHCs that operate only during the day. However, 78 percent of the PHCs in Bidar are also 24 hour PHCs, which also has the lowest institutional capacity, and so it is hard to distinguish if this effect is driven by the hours of operation of the PHC or the locations. 31 For cost considerations, we did not conduct the survey in Mysore district. 32 We also collected data on the number of patients present at the PHC during the time of the random check. On one hand, we may expect this to increase if citizens learn about the program and utilize the PHC more. However, on the other hand, we might expect that more staff presence would lead to less waiting time and quicker discharges. Thus, the predictions are ambiguous. Nonetheless, we provide the findings in Appendix Table 11; we find no discernable effect on either the number of patients either waiting at the PHC to be seen or in beds.
23
2500 grams (Column 2).33
The number of antenatal visits did not change, but this was already quite high to start, with an
average of 6.3 visits per woman in the control group.
This provides clear evidence that despite the fact that health delivery may be
of low quality, an increase in quantity may have substantial effects.
34 Most women (86 percent of the control) received
the two recommended tetanus shots already, and so while the treatment increased this by 3 percentage
points, the change was not statistically significant at conventional levels. However, few women initially
receive the recommended Iron Folic Acid (IFA) Tablets (39 percent of the control) and so this is a margin
of ante-natal visit quality where there could potentially be room for gains. Indeed, this was the case, with
the treatment leading to a 10.6 percentage point—or 27 percent—increase in receipt.35
The composition of who conducts the delivery and where it is conducted also substantially
changed (Table 5A): There was a statistically significant 8 percentage point—or 16 percent—increase in
deliveries by doctors (Column 1), with deliveries by nurses and others falling (Columns 2 and 3). At first
glance, this seems surprising, given that the intervention had no discernable impact on the doctors’ overall
attendance. However, the intervention led to a shift in where deliveries occurred: we find that the
deliveries were 8 percentage points—or 28 percent—less likely to occur at the PHC (Column 6) and
home deliveries—albeit low to start—were almost completely eliminated in the treatment group (Column
4). Instead, it appears that the women in the treatment areas moved to delivering at the larger public
hospitals or the private hospitals (Column 7).
This suggests that
antenatal care may have increased along margins that were lower to start, perhaps through an increase in
the time spent with patients.
36
There are several possible explanations for these compositional shifts in delivery patterns. While
we cannot conclusively point out which is most responsible, we can provide some evidence on the
33 It is possible that if the baby was delivered at home, rather than an institution, the baby was less likely to be weighted. However, only 2 percent of deliveries were conducted at home and the results on birth weight are the same if we drop these women. 34 While we do not know where all the visits occurred, we do know that over 70 percent of women received a tetanus shot at the PHC, which suggests that a large majority of visits occur at the PHC. 35 Note that (1) The treatment effects we observe are larger than those reported in the literature for the effects of iron and folic acid supplementation on baby birth weight (for example, Siega-Riz, Hartzema, 2006; Yasmin, Osrin, et al 2001). Likely, the increase in baby birth weight suggests that the increase staff presence may have also affect a series of different aspects of antenatal care (e.g. increased discussions on nutrition, etc.). However, we were only able to measure a subset of different interactions between staff and patients due to cost considerations. (2) Unlike previous studies that link an increase in iron supplements to terms of birth (see, for example, Zeng , Dibley, et al, 2008), we do not observe any differences in term of birth. 36 However, note that these effects, while positive, are not individually significant (Columns 8 and 9).
24
likelihood that each contributed to the observed effects. First, if the staff were present more and spent
more time with patients during the antenatal visits, they could have also better triaged high-risk
pregnancies to larger hospitals. For example, we observe that women with a late-term birth are more
likely to deliver in a private or large government hospital in the treatment group (a 12 percentage-point
difference with p-value of 0.145).37 On the other hand, while older women (who may be higher risk
pregnancies) tend to deliver in these larger hospitals, we do not observe a difference in the treatment
effect on delivery location by age.38
Second, it is also possible that the machines changed the citizen’s perceptions of the treatment
health centers. In particular, the additional monitoring may have increased the salience of the doctor’s
absence, leading the present staff members to relate the idea of the absent doctor to patients. When we
asked the women to rate different aspects of the PHC, those in the treatment group were significant more
likely to be unhappy with the availability of the PHC staff (Column 1 of Table 5B), despite the fact that
there was no perceived difference in PHC quality by treatment status (Column 2). This suggests that the
treatment may have shined a light on public sector absence, leading women shift away from the PHCs.
A final potential explanation is more cynical: the monitoring system placed a real burden on the
PHC staff, even if they did not fully change their behavior. In response to the additional costs placed on
them by the monitoring, the staff may have chosen to compensate themselves in other ways. While they
do not formally or readily admit it, many of the doctors have private practices or moonlight at private
hospitals on the side. The fact that there may have been a shift to the private hospitals may signal that
doctors are diverting patients there to increase their salaries. Moreover, many PHC staff members
compensate themselves by charging patients who deliver in the government institutions extra.
It is challenging to measure this form of corruption since it is generally hidden. The increase in
delivery costs (Column 3 of Table 5B) suggests that this might be occurring. In fact, the increase in costs
in treatment areas is the same for those who deliver in the PHC and those who deliver elsewhere, thus
suggesting that even those delivering in the PHCs are paying “extra” for deliveries.
In addition, the state runs a number of entitlement programs: low-income women can receive
financial and in-kind transfers for delivery in any type of institution from the PHCs. Qualitatively, many
37 Note that there is no difference in the probability of late term birth across the treatment and control (p-value of 0.580). 38 We also observe an increase in c-sections in the treatment group, but not significantly so (p-value of 0.179). It is also hard for us to conclude as to whether these were required or not, although in our sample c-sections are highly linked to age (which is a predictor of a higher risk pregnancy).
25
women do not receive their full entitlements; instead, the PHC staff either keeps the entitlements or asks
for a share. In Columns 4 and 5 of Table 5B, we explore the effect of the program on the provision of the
entitlements: in treatment areas, the knowledge of entitlements significantly falls by almost 7 percent.
Receipt of entitlements also falls by about 7 percent, but the p-value is 0.105. The patient is supposed to
learn about these incentives to deliver in an institution during antenatal care and we do not observe a
difference in the probability of getting a tetanus shot at the PHC, so presumably opportunities to gain
knowledge of the incentives before birth should be the same. We also do not observe a difference in the
treatment effect on knowledge of entitlements for those who deliver at the PHC and those who deliver
elsewhere, suggesting that place of delivery does not determine knowledge. Thus, the results are
consistent with the idea that the treatment staff do not provide women with their state entitlements at the
PHC at the time of delivery, allowing the PHC staff to siphon off more of the entitlements and
compensate themselves for the costs imposed by the additional monitoring.
In sum, children born in the catchment areas of treatment PHCs exhibited much better birth
outcomes than those in the control areas, potentially due to an increased in quality of antenatal care.
However, the treatment shifted deliveries out of the network of smaller government hospitals and into
larger hospitals (both government and private sector), thus defeating the government’s intention of
reducing health care costs for the poor, as the women both paid a higher overall price for the deliveries
and faced a reduction in the state-sponsored entitlements.
IV. CHALLENGES TO REFORM
It is important to note that the idea for the original reform did not stem from the research team: the
government identified the absence problem, conceived the program, developed the software, and piloted
the equipment prior to the involvement of the researchers in the project. They also independently raised
the money for the project. When we joined, we provided numerous insights from previous research on
how to improve both the software and program design, but ultimately, it was the government’s idea to
devise a way to monitor the PHC staff more.
Despite this “ownership,” the project was plagued with both delays and inadequacies in
implementation. The state government did not procure the machines until seven months after the planned
program start date, and they rolled out the program to the first district eleven months after that date. Even
at the first training sessions, when there should perhaps be the most enthusiasm and dedication over a new
26
initiative, one program officer deputed from the state headquarters announced to the local PHC staff her
reluctance to deduct their leave balances and salaries if the staff did not comply with the system and
attendance rules. Despite the fact that the PHCs were inputting data on most days, the state government
did not systematically follow up: as Table 6 shows, in only about half the cases that we conducted a
random check had the doctor even received the monthly attendance report from the state government the
previous month.
The idea of using the more accurate attendance data to better enforce the existing government
payment rules, in the end, just never happened. As we described above, the process of deducting leave
days is actually quite complex and requires cooperation among different government stakeholders; thus in
practice these deductions rarely ever occurred. “Show cause notices,” the official document needed to
start the process of deducting leaves, were rarely issued. For example, only 9 percent of doctors in the
control group had issued at least one notice—for any reason—to one of his or her staff members in the
last three months, and there was no difference in the issuing of notices between the treatment and control
group (Table 6). Interestingly, despite the better data on delinquencies, there were actually fewer cases of
outright dismissal in the treatment group than in the control group, though not significantly so (Table 6).
The implementation challenges stemmed from both the top–i.e. the state government—and the
local bureaucrats and politicians who are responsible for further monitoring the PHC staff. At the top,
the state government officials, who conceived the project, did not always follow through. Part of this
came from a split focus among a variety of initiatives and responsibilities; for example, at one point, the
project was slowed down for a month as the state government team working on this project was drawn
into leading an investigation of a fire at an old age home. At another point, the state government forgot to
pay its phone bill, leading the system to temporarily shut down.
However, the reluctance was more systematic and reflected the government’s overall challenges
and tradeoffs in running a public health care system. As discussed earlier, vacancies are prevalent; it is
tough recruiting doctors to work in rural health centers, especially given the demand for health care
professionals in the private sector in urban areas.39
39 The private sector accounts for roughly 80 percent of health care spending in India, much of it in urban areas (PricewaterhouseCoopers Report on Health Care in India, 2007).
Doctors are not always satisfied with the monetary
benefits: 25 percent of current doctors claimed to be dissatisfied with this salary, and only 15 percent
claimed to be very satisfied with it. As a result, despite believing that the staff needed to be present, the
27
state government officials stated that they were reluctant to place too many expectations on the staff,
particularly the doctors, in order to provide more flexible work schedules for them. For example, they
raised the number of exemptions for doctors from 3 to 5 during the program design.
It is not unclear that this view, given these other pressures, is entirely unreasonable. As shown in
Table 7, in the endline survey, the doctors and nurses in treatment PHCs expressed more dissatisfaction
with their job.40
As part of the experiment, we worked with the government to freeze transfers across the PHCs.
However, individuals may nonetheless choose to leave and others may join. Moreover, new employees
have some choice over their placements: when they are hired, there is a counseling session in which they
can express their location preferences, with those who score higher on placement exams having a greater
probability of receiving their preferences. Thus, in Table 8, we more formally test whether the treatment
PHCs exhibited greater difficulty in retaining and hiring new staff. In Panel A, we present coefficients
from a regression of an indicator variable for whether the staff member left on treatment status and sub-
district fixed effects; in Panel B, the outcome is whether the staff member joined. In Panel C, we explore
the total number of individuals employed in that category.
As shown in Column 1, staff in the treatment group are unhappier with the overall work
environment, but this is not significant at conventional levels (p-value of 0.21 in Panel A). Those in the
treatment group are less satisfied with the location of the PHC (Column 2) and with the weekly holidays
given (Column 8). Interestingly, although doctors claim to be happier with the attendance of the staff
who report to them (Column 11), they are less happy with the power or authority given to them to manage
the PHC (Column 10). A joint test rejects the null that there is no effect across all the satisfaction
measures (p-value of 0.001 in Panel A and 0.0143 in Panel B).
On net, the treatment resulted in fewer lower-level medical staff (for whom we observed an effect
of the treatment), but had no effect on doctors (for whom the additional monitoring had no observable
effect). New doctors were less likely to join the PHC, but the effect was not significant and the rate was
similar to the percentage that left. In contrast, new staff for lower level positions—nurses, lab technicians
and pharmacists—were significantly less likely to join the treatment PHCs than the control and at a rate
40 In Columns 1-9, we pool together the nurse and doctor samples; Columns 10-12 explore outcomes that are specific to doctors. All regressions include sub-district fixed effects and are clustered by PHC.
28
that exceeded exit out of the treatment group. Thus, as a result of the project, there were about 3 percent
fewer lower-level medical staff in the treatment group (Column 4, Panel C).41
The low level of staff expectations and reluctance and/or inability to fully enforce the existing
rules also is present among the local-level bureaucrats and politicians in charge of monitoring the PHCs.
The 15 sub-district health officers that we interviewed reported low expectations for staff attendance,
despite the formal rules on the books, and this translated mostly approving all of the “exemptions” that
the treatment doctors asked for as part of the system, and thus helped the doctors bypass the attendance
rules that the machines aimed to enforce. In fact, it appears that attendance is not particularly salient
within the set of criteria that they use to evaluate the PHCs: when we asked them to rank the PHCs in
their sub-district from best performing to least performing, we find no relationship between their rankings
and the attendance of the staff (Appendix Table 14).
Even when the state government tried to motivate the sub-district officers to better implement the
system, it appeared to be ineffective. The Director of the National Rural Health Mission of Karnataka set
up simultaneous video conference calls with all sub-district officials on three separate occasions to
chastise them for the poor attendance of the PHC staff that they managed and to remind them to ensure
that the staff were using the machines and formally reporting leave days. As we know the dates of the
video conferences, and have detailed daily attendance from the machines, we can conduct an event
analysis to test the impact of these video conferences. Figure 5 shows no systematic increase in
attendance in the days following the video conferences, suggesting that the local bureaucrats did not
follow up successfully with the PHCs to increase attendance even when reminded to by the state
government.
These lower level bureaucrats may have had little incentive to enforce the rules: if they enforce
them, the health officers would have to handle complaints by PHC staff and get no personal return in
terms of their careers. On the other hand, local elected politicians—in India, the Gram Panchayat, or
GP—may have better incentives than bureaucrats to monitor PHC staff to be present: if service provision
is low, they could be voted out of office.
41 We attempted to quantify the characteristics of those who left and joined, although the results are inconclusive. Doctors who left the treatment PHCs had relatively lower attendance than those who joined the control PHCs in the baseline, but the NLP who left were those attended more in the baseline (Appendix Table 12). There is some qualitative evidence that the new staff nurses who joined the treatment PHCs were relatively more likely to live closer to the PHC than those who joined the control—i.e. they were willing to travel further not to be in the treatment group—but this is not significant at conventional levels (Appendix Table 13).
29
Thus, we interviewed the GPs to learn whether they had heard of the system to understand how
engaged they were with the health sector. About 34.5 percent of them across both the treatment and
control catchments had heard of the system. We then tested whether the effect of the program varied by
this characteristic. To do so, we regress the attendance of the PHC staff on a dummy for treatment status,
a dummy for whether the GP heard of the program and the interaction between these two variables; we
also include sub-district fixed effects and cluster by PHC. In control group areas, attendance of doctors
was 10 percentage points higher in areas where GPs had heard of the program than in areas where they
did not; thus, active GPs are correlated with higher doctor attendance (Column 2). However, all of the
treatment effect occurred—for all types of staff members—in areas where the GP had not heard of the
program (Columns 1-3). This implies that even though the active GPs expected higher attendance from
doctors than non-active ones, they did not expect it to increase further when provided with the tools to do
so. Furthermore, GPs in the treatment areas that had heard of the program were as equally satisfied with
doctor availability as those GPs that had not heard of the program (Column 4). In fact, despite the high
rates of absenteeism, GPs were generally satisfied with the doctor’s attendance: 77 percent were either
satisfied or very satisfied with their attendance.
V. CONCLUSION
Developing countries often have extensive, and quite stringent, rules governing the responsibilities of
government bureaucrats, as well as the supposed penalties in place if they violate those rules. And, yet, in
spite of—or perhaps, in some ways, because of—these extensive rules and systems, service provision and
quality remains low. One view is that bureaucratic reform, either to improve these rules or even just to
better enforce the ones on the books, will be fruitless: countries are beholden to their past institutional
design (Acemoglu, 2006; Acemoglu, Johnson, and Robinson, 2001) and these designs in developing
countries are often characterized by a myriad of confusing rules that few fully know or understand, with
complicated bureaucratic structures in place that leave no one fully responsible for enforcing them
(Devarajan, Easterly, and Pack, 2003). Thus, inefficiency and corruption remain the norm.
A second view is that reform is possible, especially with technological solutions that can bypass
the poor incentives, overlapping institutional structures and individual discretion failures that make it
easier for bureaucrats to ignore the existing rules and extract rents—i.e., technology can solve the
“principal-agent-citizen problem.”
30
In this paper, we provide support for the second view: there are potentially very large returns to
implementing a technology to better ensure that government workers adhere to formal rules. In particular,
we show that the introduction of a monitoring technology to reduce health worker absenteeism leads to
improved birth outcomes. However, we also show that while monitoring may work for some—e.g.
nurses—it does not work for others—e.g. doctors—whom may have better outside options. Moreover,
while there were gains in attendance, the gains were restricted due to implementation challenges, inherent
in most government systems, which are proposed by proponents of the first view.
While promising in that the study showed that greater access to health care can improve health
outcomes in developing countries, it also speaks to the fact that we may need to re-evaluate how we think
about introducing monitoring technologies in practice. For example, perhaps increasing nurses—whom
we can monitor better—relative to doctors would be most beneficial? Or combining increased monitoring
for doctors with more realistic expectations of work behaviors (e.g. more days off, fewer days in rural
areas) given the public sector salary would ensure that they actually complete their assigned work?
Clearly, when designing and implementing better monitoring mechanisms, the devil is in the detail, and
we leave these kinds of questions to future research.
31
Works Cited
Acemoglu, Daron, Simon Johnson, and James A. Robinson. 2001. “The Colonial Origins of Comparative Development: An Empirical Investigation.” The American Economic Review 91(5): 1369-1401. Acemoglu, Daron. 2006. “A Simple Model of Inefficient Institutions.” The Scandinavian Journal of Economics 108: 515–46. Andrabi, Tahir, Jishnu Das, and Asim Ijaz Khwaja. 2014. "Report cards: The impact of providing school and child test scores on educational markets." Working Paper. Ashraf, Nava, Oriana Bandiera, and Scott S. Lee. 2014. "Do-gooders and Go-getters: Career Incentives, Selection, and Performance in Public Service Delivery." Working Paper. Banerjee, Abhijit, Raghabendra Chattopadhyay, Esther Duflo, Daniel Keniston, and Nina Singh. 2012. “Can Institutions Be Reformed From Within? Evidence From A Randomized Experiment With The Rajasthan Police.” Working Paper no. 17912, National Bureau of Economic Research. Banerjee, Abhijit, Esther Duflo, and Rachel Glennerster. 2008. “Putting a Band-Aid on a Corpse: Incentives for Nurses in the Indian Public Health Care System.” Journal of the European Economic Association 6(2-3): 487-500. Banerjee, Abhijit, Rema Hanna and Sendhil Mullainathan. 2013. “Corruption.” In Handbook of Organizational Economics, edited by Robert Gibbons and John Roberts, 1109-47. Princeton: Princeton University Press. Banerjee, Abhijit, Rema Hanna, Jordan Kyle, Benjamin Olken, and Sudarno Sumarto. 2014. “Competition in the Delivery of Public Transfer Programs.” Working Paper. Björkman, Martina, and Jakob Svensson. 2009. “Power to the People: Evidence from a Randomized Field Experiment on Community-Based Monitoring in Uganda.” Quarterly Journal of Economics 124(2): 735-69. Benabou, Roland, and Jean Tirole. 2006. “Incentives and Prosocial Behavior.” American Economic Review 96 (5): 1652–78. Bold, Tessa, Mwangi Kimenyi, Germano Mwabu, Alice Ng'ang'a, and Justin Sandefur. 2013."Scaling-up What Works: Experimental Evidence on External Validity in Kenyan Education." CSAE Working Paper Series 2013-04, Centre for the Study of African Economies, University of Oxford. Callen, Michael, Saad Gulzarz, Ali Hasanain, and Yasir Khan. 2013. “The Political Economy of Public Employee Absence: Experimental Evidence from Pakistan.” MIMEO. Chaudhury, Nazmul, Jeffrey Hammer, Michael Kremer, Karthik Muralidharan, and F. Halsey Rogers. 2006. "Missing in Action: Teacher and Health Worker Absence in Developing Countries." Journal of Economic Perspectives 20(1): 91-116. Das, Jishnu, and Jeffrey Hammer. 2005. “Which Doctor: Combining Vignettes and Item Response to Measure Doctor Quality.” Journal of Development Economics 78: 348-83.
32
Das, Jishnu, and Jeffrey Hammer. 2007. “Money for Nothing: The Dire Straits of Medical Practice in India.” Journal of Development Economics 83(1): 1-36. Das, Jishnu, Jeffrey Hammer and Kenneth Leonard. 2008. “The Quality of Medical Advice in Low-Income Countries.” Journal of Economic Perspectives 22(2): 93-114. Devarajan Shanta, William Easterly, and Howard Pack. 2003. “The Cartel of Good Intentions: The Problem of Bureaucracy in Foreign Aid.” Journal of Policy Reform 5(4): 1-28. Deininger, Klaus, and Aparajita Goyal. 2012. “Going digital: Credit effects of land registry computerization in India.” Journal of Development Economics 99: 236-43. Duflo, Esther, Michael Greenstone, Rohini Pande, and Nicholas Ryan. 2013. “Truth-telling by Third-party Auditors and the Response of Polluting Firms: Experimental Evidence from India.” Quarterly Journal of Economics 128(4): 1499-1545. Duflo, Esther, Rema Hanna, and Stephen P. Ryan. 2012. "Incentives Work: Getting Teachers to Come to School." American Economic Review 102(4): 1241-78. Fujiwara, Thomas. 2013. “Voting Technology, Political Responsiveness, and Infant Health: Evidence from Brazil.” http://www.princeton.edu/~fujiwara/papers/elecvote_site.pdf. Hanna, Rema, and Shi-Yi Wang. 2013. “Dishonesty and Selection into Public Service. Working Paper no. 19649, National Bureau of Economic Research. Muralidharan, Karthik, Paul Niehaus, and Sandip Sukhtankar. 2013. “Building State Capacity: Biometric Identification and the Delivery of Public Programs in India.” MIMEO. Zeng, Lingxia, Yue Cheng, Shaonong Dang, Hong Yan, Michael J. Dibley, Suying Chang, and Lingzhi Kong. 2008. “Impact of micronutrient supplementation during pregnancy on birth weight, duration of gestation, and perinatal mortality in rural western China: double blind cluster randomised controlled trial.” BMJ 337. doi: 10.1136/bmj.a2001. Siega-Riz, Anna Maria, Abraham G. Hartzema, Craig Turnbull, John Thorp, Thad McDonald, and Mary E. Cogswell. 2006. “The effects of prophylactic iron given in prenatal supplements on iron status and birth outcomes: A randomized controlled trial.” American Journal of Obstetrics and Gynecology 194 (2): 512-19. doi: 10.1016/j.ajog.2005.08.011.
Yasmin, Sohely, David Osrin, Elizabeth Paul, and Anthony Costello. 2001. "Neonatal mortality of low-birth-weight infants in Bangladesh." Bulletin of the World Health Organization 79 (7): 608-614. doi: 10.1590/S0042-96862001000700005.
Figure 1: Medical Information and Disease Surveillance System
J A S O N D J F M A M J J A S O N D J F M A M J J A S O N DImplementationTraining MysoreImplementation MysoreTraining Other DistrictsAll Other DistrictsSubdistrict Officer Refresher TrainingVideo Conferences
Note: These figures plot attendance rates for the treatment and control groups byfollow-up round, net of sub-district fixed effects.
Figure 4: Presence by Time of Day
Note: These figures plot attendance rates for the treatment and control groups bytime of day, net of sub-district fixed effects.
Figure 5: Event Study for Video Conferences on Attendance
Note: The figure above represents a regression of daily attendance (as measured bythe IMIDSS system) on 20 dummy variables (in sets of three days) of time beforeand after the three video conferences (relative to days that were not within twomonths of the video conferences). We control for day of the week, month of theyear, whether a random check was conducted on that day at the PHC, and sub-district fixed effects. The dotted lines represent 95% confidence interval around thecoefficients; the standard errors are clustered by PHC.
Mean Std N(1) (2) (3)
PHC Open 24 x7 0.39 0.49 323Number of Villages Served 13.23 10.21 310Number of Patients Seen Daily 66.55 40.21 321Doctor Vacant 0.20 0.40 322Staff Nurse Vacant 0.15 0.36 320Pharmacist Vacant 0.37 0.48 321Lab Technician Vacant 0.13 0.34 321
Note: This table provides sample statistics from the baseline survey. The datapresented in Panel A come from a facility survey that we conducted in 2010,while the data presented in Panels B and C come from the surprise randomchecks on the primary health centers. A post is vacant if there is at least onesanctioned position that is vacant at the time of survey.
Data Source Mean N(1) (2) (3)
PHC received device and mobile phone Random Check 0.99 572Device and mobile phone both currently functioning Random Check 0.66 598Data successfully transferred the day before the random check Random Check 0.67 566Data was sent on the day prior to the random check Administrative Data 0.82 572
Table 2: Was the System Received and Used?
Note: This table provides information on the receipt and use of the IMIDSS system from both the random checks and theadministrative data.
Observations 8,084 4,659 1,363 3,296 1,440Control Group Mean 0.396 0.373 0.309 0.401 0.573
Table 3: Reduced Form Effect on Attendance (Random Checks)
Note: This table provides the reduced form effect of belonging to a treatment PHC on attendance, by type of staff member. InColumns 1 to 4, an observation is an individual staff member and the outcome is a dummy variable that indicates whether that staffmember was present; in Column 5, an observation is a PHC and the outcome is a dummy variable for whether at least one nurse ordoctor is present. All regressions are estimated by OLS, include a baseline control and sub-district fixed effects, and are clustered byprimary health center. If the baseline value is missing, we assign the average baseline attendance and include a dummy variable forwhen the baseline value was imputed. *** p<0.01, ** p<0.05, * p<0.1
Observations 778 778 762 783 782Control Group Mean 2828 0.177 6.271 0.863 0.392
Table 4: Reduced Form Effect on Health Care Delivery (Pregnancy Survey)Antenatal CareBirth Outcomes
Note: This table provides the reduced form effect of belonging to a treatment PHC on birth outcomes and antenatal care.All regressions are estimated by OLS, include sub-district fixed effects, and are clustered by primary health center. IFAstands for Iron Folic Acid Tablets. *** p<0.01, ** p<0.05, * p<0.1.
Who performed delivery?Table 5A: Reduced Form Effect on Type of Delivery (Pregnancy Survey)
Delivery Location
Note: This table provides the reduced form effect of belonging to a treatment PHC on type of delivery. All regressions are estimated by OLS, include sub-districtfixed effects, and are clustered by primary health center. *** p<0.01, ** p<0.05, * p<0.1.
Staff Availability Staff Quality Log (Cost) Knowledge Received
Observations 775 773 775 785 785Control Group Mean 0.0894 0.0349 6.810 2.834 1.861
Table 5B: Reduced Form Effect on Satisfaction and Costs (Pregnancy Survey)Standardized Satisfaction Index Entitlements
Note: This table provides the reduced form effect of belonging to a treatment PHC on patient satisfaction, delivery cost,and entitlements. All regressions are estimated by OLS, include sub-district fixed effects, and are clustered by primaryhealth center. The satisfaction variables range from 1 ("very dissatisfied") and 4 ("very satisfied"); we standardized thesevaraibles and averaged them by category. The entitlements are the state programs that women are entitled to upondelivery, regardless of delivery location. *** p<0.01, ** p<0.05, * p<0.1.
Treatment Control Difference(1) (2) (3)
PHC received monthly attendance report 0.53[0.50]515
Staff leave accounts updated based on report 0.47[0.50]502
Faced problem with PHC staff in last three months 0.19 0.13 0.032[0.39] [0.34] (0.048)108 151 259
Issued show cause notice in the last three months 0.07 0.09 -0.021[0.26] [0.28] (0.032)108 151 259
Observations 333 332 333 332 331 322 331 330 330 190 190 190Control Group Mean 0.921 0.941 0.762 0.593 0.877 0.634 0.601 0.704 0.984 0.909 0.900 0.927Note: This table provides the reduced form effect of belonging to a treatment PHC on employee satisfaction. All regressions are estimated by OLS, include sub-district fixed effects, and are clustered byprimary health center. Each outcome is a dummy variable where 1 indicates satisfied or very satisfied and 0 otherwise. All staff members that we interviewed are listed in Panel A, while we restrict theanalysis to only those who joined prior to the implementation of the program in Panel B. Note: For all staff jointly (Panel A), the joint chi-sq test across the variables has a value of 31.70 with prob > chi-sq =0.0015. For only existing staff (Panel B), the joint chi-sq test has a value of 25.11 with prob > chi-sq = 0.0143. *** p<0.01, ** p<0.05, * p<0.1.
Panel B. Only Staff who Joined Prior to Implementation
Panel A. All Staff
Table 7: Staff Satisfaction MeasuresDoctorsDoctors and Nurses
Observations 1,361 1,361 1,361 1,361Mean of Control Group 7.656 4.482 1.280 3.202
Table 8: Movement Into and Out of the PHCs
Panel B: Indicator Variable for Joined After Implementaion Began
Panel A: Indicator Variable for Left
Panel C: Number of staff at each followup
Note: In Panel A and B, an observation is an individual and the outcome is an indicator variable,respectively, for whether the indivdiual either left or joined the survey at any point in time. In Panel C, theobservation is a PHC at the given follow-up, and the outcome is the number of staff members employed at thatpoint in time. *** p<0.01, ** p<0.05, * p<0.1.
(0.0249) (0.0432) (0.0294) (0.177) (0.203)Heard of Program 0.0372 0.102* 0.0116 -0.290 -0.449
(0.0351) (0.0558) (0.0462) (0.262) (0.305)Treat * Heard of Program -0.116** -0.252*** -0.0709 -0.0618 0.594
(0.0463) (0.0755) (0.0607) (0.345) (0.369)
Observations 2,584 660 1,924 186 185Control Group Mean 0.363 0.263 0.398 3.204 3.109
Table 9: Reduced Form Effect of Treatment, by Local Government InvolvementSatisfactionAttendance
Note: This table provides the reduced form effect of belonging to a treatment PHC, by whether the local government has heardof the program. The outcomes in Columns 1-3 are staff attendance, while they are local government satisfaction with the healthcenter in Columns 4 and 5 (these range from 4 being very satisfied to 1 being very unsatisfied). All regressions are estimatedby OLS, include sub-district fixed effects, and are clustered by primary health center. *** p<0.01, ** p<0.05, * p<0.1.
Doctors Nurses(1) (2)
Treat 0.0512 0.0531(0.0450) (0.0515)
Observations 323 323Mean of Control Group 0.165 0.440
Appendix Table 1: Attrition Check on Endline Survey
Note: The outcome variable is an indicator variable for a PHC notbeing surveyed, either due to having a vacancy in the position or due tothe staff member being repeatedly unavailable during the survey. ***p<0.01, ** p<0.05, * p<0.1.
ONLINE APPENDIX: NOT FOR PUBLICATION
Indicator for Stillbirth or Miscarriage
(1)Treat 0.00166
(0.00314)
Observations 2,598Control Group Mean 0.00413
Appendix Table 2: Effect of Treatment on Infant Mortality
Note: This table looks at the effect of belonging to thecatchment area of a PHC group on still births andmiscarriages. *** p<0.01, ** p<0.05, * p<0.1.
ONLINE APPENDIX: NOT FOR PUBLICATION
Treatment Control Difference(1) (2) (3)
Number of Sub-Centers 4.81 4.46 0.06[2.52] [2.37] (0.23)
24/7 PHC 0.4 0.38 -0.05[0.49] [0.49] (0.05)
Number of daily patients 67.42 65.87 -0.3[41.64] [39.18] (4.62)
Number of examination beds 0.79 0.79 -0.02[0.9] [0.88] (-0.1)
Has working toilet 0.75 0.79 -0.04[0.43] [0.41] (0.04)
Has drinking water 0.77 0.75 0.03[0.42] [0.44] (0.05)
Has broken windows 0.3 0.25 0.01[0.46] [0.44] (0.05)
Has clean walls 0.53 0.51 0.01[0.50] [0.50] (0.06)
Has clean floors 0.58 0.49 0.08[0.49] [0.50] (0.05)
Has pharmacy 0.89 0.87 0.00[0.32] [0.34] (0.04)
Number of medicines in stock 8.43 8.30 0.02[2.76] [3.12] (0.25)
Number of vaccines in stock 4.77 4.81 -0.02[2.33] [2.26] (0.31)
Note: This table provides a check on the randomization. For the facility data (Panel A), thejoint chi-sq test across the variables with fixed effects has a value of 7.71 with prob > chi-sq =0.8070. For the attendance data (Panel B), the joint chi-sq test with fixed effects has a value of5.24 with prob > chi-sq = 0.2635.
Note: This table provides the reduced form effect of being monitored more heavily in the random checks, by type of staff member. InColumns 1 to 4, an observation is an individual staff member and the outcome is a dummy variable that indicates whether that staffmember was present; in Column 5, an observation is a PHC and the outcome is a dummy variable for whether at least one nurse or doctoris present. All regressions are estimated by OLS, include a baseline control and sub-district fixed effects, and are clustered by primaryhealth center. If the baseline value is missing, we assign the average baseline attendance and include a dummy variable for when thebaseline value was imputed. *** p<0.01, ** p<0.05, * p<0.1
Observations 143 143 185 186 186 186Control Group Mean 0.414 0.671 0.685 1.387 0.817 4.237
CommunityAppendix Table 5: Monitoring By Sub-district and Community
Sub-district Health Officer
Note: This table explores whether the sub-district health officers and local government bodies differentially monitored the PHCs by treatment status. *** p<0.01, **p<0.05, * p<0.1
Observations 8,084 4,659 1,363 3,296Control Group Mean 0.396 0.373 0.309 0.401Note: This table replicates Table 3, but varies the control variables that are included. In Columns 1 to 4, an observation is anindividual staff member and the outcome is a dummy variable that indicates whether that staff member was present; in Column 5, anobservation is a PHC and the outcome is a dummy variable for whether at least one nurse or doctor is present. All regressions areestimated by OLS and are clustered by PHC. If a control variable has a missing value, we assign the average and include a dummyvariable to indictate when it was imputed.*** p<0.01, ** p<0.05, * p<0.1
Appendix Table 6: Reduced Form Effect on Attendance (Random Checks), Robustness to Controls
A. No Baseline Measure
B. No Baseline Measure Nor Sub-District Fixed Effects
C. Gender, Years at PHC, Baseline Attendance and Sub-district Fixed Effects
Observations 7,117 4,162 1,152 3,010 1,435Control Group Mean 0.415 0.387 0.313 0.416 0.573
Appendix Table 7: Reduced Form Effect on Attendance (Random Checks), Robustness to Sample
Panel B: Balanced Panel Only
Panel A: Including New Staff Members
Note: This table replicates Table 3, but varies the included sample. In Panel A, we include everyone, including staffmembers that joined the PHC. In Panel B, we only include staff members who were present in all follow-up rounds.In Columns 1 to 4, an observation is an individual staff member and the outcome is a dummy variable that indicateswhether that staff member was present; in Column 5, an observation is a PHC and the outcome is a dummy variablefor whether at least one nurse or doctor is present. All regressions are estimated by OLS, include the baselineattendance measure, and are clustered by PHC. *** p<0.01, ** p<0.05, * p<0.1
ONLINE APPENDIX: NOT FOR PUBLICATION
(1)Treat X "Doctor Dummy" -0.0274
(0.0239)Treat X "Nurse Dummy" 0.0798***
(0.0226)Treat X "Lab Tech or Pharmacist Dummy" 0.0989***
(0.0275)
Test Doctors = NursesF(1,320) 13.66Prob > F 0.0003
Test Doctor = L/PF(1,320) 14.78Prob > F 0.0001
Test Nurse = L/PF(1,320) 0.31Prob > F 0.5795
Observations 4,659Control Group Mean 0.373
Appendix 8: Attendance Results, by Staff Type
Note: This table estimates the treatment effect (from Table 3)seperately by doctor, nurse, and lab technician/pharmacist. Theregression is estimated by OLS, includes the baseline attendancemeasure, and is clustered by PHC. *** p<0.01, ** p<0.05, * p<0.1
Observations 1,243 754 149 605 152Control Group Mean 0.330 0.297 0.152 0.338 0.766Note: This table replicates Table 3, by district. In Columns 1 to 4, an observation is an individual staff member and theoutcome is a dummy variable that indicates whether that staff member was present; in Column 5, an observation is a PHC andthe outcome is a dummy variable for whether at least one nurse or doctor is present. All regressions are estimated by OLS,include a baseline control and sub-district fixed effects, and are clustered by primary health center. If the baseline value ismissing, we assign the average baseline attendance and include a dummy variable for when the baseline value was imputed.*** p<0.01, ** p<0.05, * p<0.1
Panel E. Bidar
Appendix Table 9: Reduced Form Effect on Attendance, by District (Random Checks)
Observations 8,084 4,659 1,363 3,296 1,440Mean of Control Group 0.396 0.373 0.309 0.401 0.573
Appendix Table 10: Reduced Form Effect on Attendance (Random Checks), Heterogeneity By PHC Type
Note: This table replicates explore the effect of belonging to the treatment group, by whether the PHC is open 24 hours a day. In Columns1 to 4, an observation is an individual staff member and the outcome is a dummy variable that indicates whether that staff member waspresent; in Column 5, an observation is a PHC and the outcome is a dummy variable for whether at least one nurse or doctor is present. Allregressions are estimated by OLS, include a baseline control and sub-district fixed effects, and are clustered by primary health center. Ifthe baseline value is missing, we assign the average baseline attendance and include a dummy variable for when the baseline value wasimputed. *** p<0.01, ** p<0.05, * p<0.1
Observations 1,433 1,433 1,433Control Group Mean 3.553 0.393 0.101
Appendix Table 11: Number of Patients
Note: This table replicates explore the effect of belonging to thetreatment group on the number of patients present. All regressions areestimated by OLS, include a baseline control and sub-district fixedeffects, and are clustered by primary health center. *** p<0.01, **p<0.05, * p<0.1
ONLINE APPENDIX: NOT FOR PUBLICATION
All Staff Medical Staff Only Doctors Only N/L/P Only(1) (2) (3) (4)
Observations 82 82 82Control Group Mean 0.536 0.351 0.351
Appendix Table 14: Correlation Between Rank Quality, Attendance and Treatment
Panel A: No Fixed Effects
Panel B: Include Sub-District Fixed Effects
Note: This table explores relationship between the sub-district health officials rankings of PHCs in their sub-district, attendance, and rankings. *** p<0.01, ** p<0.05, * p<0.1