+ All Categories
Home > Documents > Dealing With Financial Turmoil: The Fed’s Response David C. Wheelock* Federal Reserve Bank of St....

Dealing With Financial Turmoil: The Fed’s Response David C. Wheelock* Federal Reserve Bank of St....

Date post: 14-Dec-2015
Category:
Upload: chaya-hayslip
View: 213 times
Download: 0 times
Share this document with a friend
Popular Tags:
36
Dealing With Financial Turmoil: The Fed’s Response David C. Wheelock* Federal Reserve Bank of St. Louis November 6, 2008 *Views expressed are not necessarily official positions of the Federal Reserve Bank of St. Louis or the Federal Reserve System.
Transcript

Dealing With Financial Turmoil: The Fed’s Response

David C. Wheelock*

Federal Reserve Bank

of St. Louis

November 6, 2008

*Views expressed are not necessarily official positions of the Federal Reserve Bank of St. Louis or the Federal Reserve System.

The Housing Slump: Root of the Crisis

• Declining sales and rising vacancy rates• Less construction• Falling house prices• Rising foreclosure rates

– Cause mortgage-backed securities to decline in value, resulting in large financial losses and uncertainty about viability of counterparties.

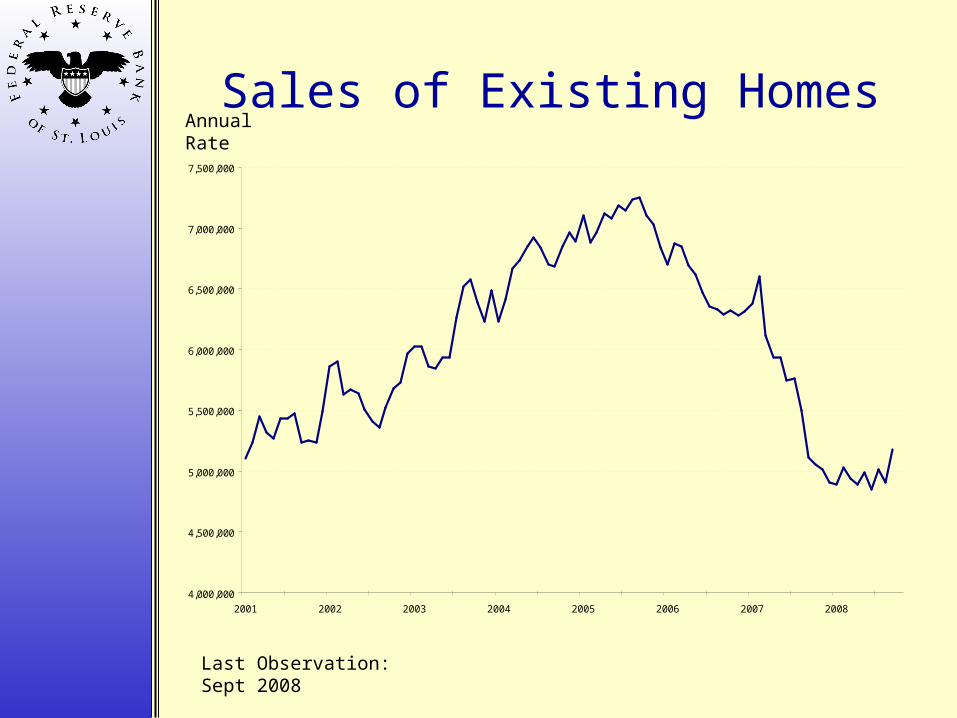
Sales of Existing HomesAnnual Rate

Last Observation: Sept 2008

4,000,000

4,500,000

5,000,000

5,500,000

6,000,000

6,500,000

7,000,000

7,500,000

2001 2002 2003 2004 2005 2006 2007 2008

Home Vacancy Rate

1.0

1.2

1.4

1.6

1.8

2.0

2.2

2.4

2.6

2.8

3.0

2000 2001 2002 2003 2004 2005 2006 2007 2008

Percent

Last Observation: Q3:2008

Months Supply of New and Existing Single Family Homes

Last Observation: Sept 2008

Months

0.0

2.0

4.0

6.0

8.0

10.0

12.0

2000 2001 2002 2003 2004 2005 2006 2007 2008

New Single Family Homes

Existing Single Family

Homes

U.S. Building Permits and Housing Starts

Last Observation: Sept 2008

Thousands

750

950

1150

1350

1550

1750

1950

2150

2350

2003 2004 2005 2006 2007 2008

Building Permits

Housing Starts

Median Sales Price of Existing Single Family Homes

-15.0%

-10.0%

-5.0%

0.0%

5.0%

10.0%

15.0%

20.0%

2000 2001 2002 2003 2004 2005 2006 2007 2008

Last Observation: Sept 2008

Year over Year % Change

The Growth In House Prices: United States Average

Last Observation: 2008:Q2

Year over Year % Change

-20%

-15%

-10%

-5%

0%

5%

10%

15%

20%

1998 1999 2000 2001 2002 2003 2004 2005 2006 2007 2008

OFHEO Purchase Only Case Shiller

2Q:2008 -15.38%

2Q:2008-4.77%

The Housing Boom (Bubble?)

• Many economists discounted the “bubble” notion:– Income growth was high

– Interest rates were low

• But, house prices rose much faster than GDP, rents, or median household income

House Price and GDP Growth

1

1.1

1.2

1.3

1.4

1.5

1.6

1.7

1.8

2001 2002 2003 2004 2005 2006 2007 2008

S&P/Case Shiller Home Price Index and U.S. GDP Growth, 2001 = 1

Last Observation: 2Q 2008

House Price Index GDP

House Prices Compared to Rent

0.6

0.8

1

1.2

1.4

1.6

1.8

1987 1989 1991 1993 1995 1997 1999 2001 2003 2005 2007

Case Shiller Price Index to Rent Ratio OFHEO Purchase Only Index to Rent Ratio

Avg. 1987 to 1997

Last Observation: 2008:Q2 Note: OFHEO Purchase only index begins in Q1:1991. Value set equal to C-S index for Q1:1991. Rent Price is from CPI index.

House Prices Compared to Median Income

0.00

0.20

0.40

0.60

0.80

1.00

1.20

1.40

1.60

1.80

2.00

2.20

2.40

2.60

1987 1988 1989 1990 1991 1992 1993 1994 1995 1996 1997 1998 1999 2000 2001 2002 2003 2004 2005 2006 2007

Year US Ratio CA Ratio FL Ratio MO Ratio KY Ratio

Note: Income is Nominal U.S. Median Income. US Ratio is C-S HPI. Regional Ratios are OFHEO HPI.

What Caused the Boom?

House prices had been rising since the mid-1990s, but accelerated in 2002-03, coinciding with:– Low interest rates

– Rising household incomes

– Mortgage market innovations (“originate to distribute” – subprime loans and securitization)

House Price and Personal Income Growth

Last Observation: 2008:Q2

Percent

-4%

-2%

0%

2%

4%

6%

8%

10%

12%

14%

1998 - Q1 1999 - Q1 2000 - Q1 2001 - Q1 2002 - Q1 2003 - Q1 2004 - Q1 2005 - Q1 2006 - Q1 2007 - Q1 2008 - Q1

personal income growth

HPI

House Price Growth and Mortgage Rate

Last Observation: 2008:Q2

HPI growth rate Mortgage rate

-4%

-2%

0%

2%

4%

6%

8%

10%

12%

14%

16%

1998 -Q1

1999 -Q1

2000 -Q1

2001 -Q1

2002 -Q1

2003 -Q1

2004 -Q1

2005 -Q1

2006 -Q1

2007 -Q1

2008 -Q1

5

5.5

6

6.5

7

7.5

8

8.5

Mortgage Rate (right scale)

HPI (left scale)

Large Increase in Non-Prime Mortgages, 1995 - 2006

0

100

200

300

400

500

600

700

1995 1996 1997 1998 1999 2000 2001 2002 2003 2004 2005 2006

Mortgages, $ Billions

0.4

0.5

0.6

0.7

0.8

0.9

1

1.1

(Debt/ Income)

Debt/Income (right scale)

Subprime Alt- A

What Ended the Boom?

House price appreciation began to fall in the second half of 2005, coinciding with:

– Slowing of U.S. personal income growth

– Rise in mortgage rates

– Hurricane’s Katrina and Rita

Consequence of the housing slump…

Financial Distress

Falling House Prices and Financial Distress

• Rise in mortgage defaults and foreclosures– Mainly on subprime, adjustable rate loans

• Significant losses on mortgage-backed securities and derivatives (especially private-label MBS’s, even highly-rated securities)

• Uncertainty about the viability of counterparties caused risk spreads to increase and trading in financial markets to fall sharply.

House Prices and Foreclosure Rate

Last Observation: 2008:Q2

Rate of New Foreclosures % Change in House Prices Case-Shiller Index

0.2

0.3

0.4

0.5

0.6

0.7

0.8

0.9

1.0

-20%

-15%

-10%

-5%

0%

5%

10%

15%

20%

Foreclosure Rate(left scale)

House Price Grow th(right scale)

U.S. Foreclosure Rates by Loan TypeRate of New Foreclosures

Last Observation: 2008:Q2

0.0

1.0

2.0

3.0

4.0

5.0

6.0

7.0

8.0

2005 2006 2007 2008

All Mortgages Subprime ARMs Subprime FRMs Prime ARMs Prime FRMs

How this Became a Crisis

• “Originate to Distribute” lending model– Principal/agent problems – originators often didn’t

have skin in the game– Investors relied on ratings agencies that used

backward-looking valuations and had their own principal/agent issues

• Fannie Mae and Freddie Mac had conflicting objectives, were highly leveraged but lightly regulated.

• Credit default swaps and other over-the-counter derivatives ($50+ trillion!)

Interest Rate Spreads and Illiquid MarketsPercent

Last Observation: October 31, 2008

0.00

1.00

2.00

3.00

4.00

5.00

6.00

7.00

8.00

1/1/2007 4/11/2007 7/20/2007 10/28/2007 2/5/2008 5/15/2008 8/23/2008

%

1 Month EuroDollar

1 Month CD Rate

3 Month LIBOR

Funds Target

Lehman Brothers files for Bankruptcy, Sept 14, 2008

Term Auction Facility (TAF) Introduced, December 12, 2007

Fed lowers Primary Credit Rate 50 basis points to 5.75%

Fed approves $30 billion for Bear Stearns takeover by J.P. Morgan Chase

Commercial Paper OutstandingSeasonally Adjusted, Billions of Dollars

0.0

200.0

400.0

600.0

800.0

1000.0

1200.0

1400.0

2005 2006 2007 2008

0.0

50.0

100.0

150.0

200.0

250.0

Financial Asset Non Financial

Non FinancialFinancialAsset backed

Last Observation: October 22, 2008

The Fed’s Response

The TAF, TSLF, and PDCF

• Term Auction Facility (TAF): Fed auctions fixed amount of reserves to DIs; provides liquidity while avoiding the stigma of borrowing at the discount window.

• Term Securities Lending Facility (TSLF): Fed lends Treasury securities to DIs in exchange for other marketable assets.

• Primary Dealer Credit Facility (PDCF): Lending facility for all primary dealers, including non-DIs.

Bailouts and Non-Bailouts

• Bear Stearns (March ’08): Fed lent $30 billion to facilitate JPMorgan’s acquisition of Bear. Concern about systemic risk.

• Fannie/Freddie (Sept. ’08): Treasury places in conservatorship, replaces CEOs.

• Lehman (Sept. ’08): Allowed to fail.• AIG (Sept. ’08): Fed lends up to $85 billion

(increased later to $120); CEO replaced. Systemic risk – huge amount of credit default swaps outstanding.

The $700 Billion TARP

Troubled Asset Relief Program• Capital Purchase Program – Treasury will

purchase preferred stock in a qualifying financial firm.$125 billion in nine largest banks

$125 billion in other banks that apply and qualify

• Other program(s) may include purchases of MBSs and loans, insurance of troubled assets, and assistance to borrowers.

Commercial Paper, Money Market Funds

• Commercial Paper Funding Facility (CPFF): Fed will purchase highly-rated unsecured and asset-backed commercial paper.

• Money Market Mutual Fund Liquidity Facility (AMLF): Fed loans to banks to purchase asset-backed paper from MMMFs.

• Money Market Investor Funding Facility (MMIFF): Sets up special vehicles to buy money market instruments. Fed committed up to $540 billion.

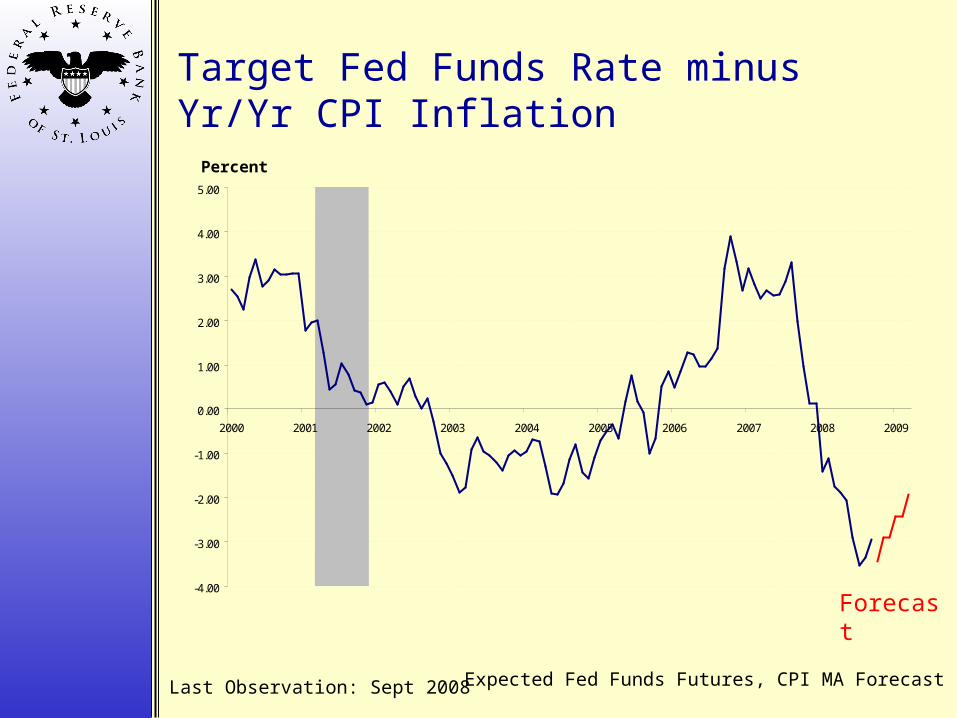
Old Fashioned Monetary Policy

• The FOMC has sharply cut the fed funds rate target – negative real rate throughout 2008.

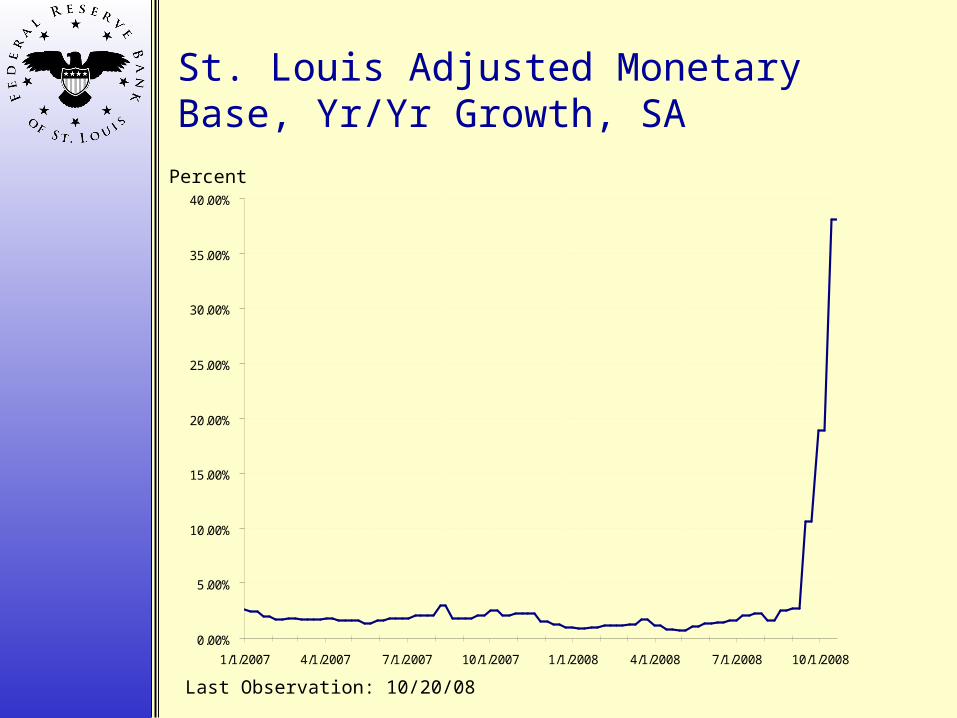
• Monetary base growth – up sharply since September (“quantitative easing”).

Target Fed Funds Rate minus Yr/Yr CPI Inflation

Last Observation: Sept 2008

-4.00

-3.00

-2.00

-1.00

0.00

1.00

2.00

3.00

4.00

5.00

2000 2001 2002 2003 2004 2005 2006 2007 2008 2009

Expected Fed Funds Futures, CPI MA Forecast

Forecast

Percent

St. Louis Adjusted Monetary Base, Yr/Yr Growth, SA

0.00%

5.00%

10.00%

15.00%

20.00%

25.00%

30.00%

35.00%

40.00%

1/1/2007 4/1/2007 7/1/2007 10/1/2007 1/1/2008 4/1/2008 7/1/2008 10/1/2008

Last Observation: 10/20/08

Percent

Summary (1)

• The financial crisis was triggered when house prices began to decline and subprime mortgage defaults increased.

• Subprime accounts for about 10 percent of mortgage market. Subprime ARMs represent about 7 percent of loans, but 43 percent of foreclosures.

• Some $85 billion of losses on non-prime mortgage loans has mushroomed into some $1.4 trillion of losses world wide (IMF estimate).

Summary (2)

• Systemic failure centered in MBSs and other derivatives that have lost substantial market value.

• The Fed (and other agencies) have attempted to contain the crisis and re-start financial markets by providing liquidity and acting as lender of last resort.

Questions?


Recommended