Munich Personal RePEc Archive Death Spiral Issues in Emerging Market: A Control Related Perspective Kim, Woochan and Kim, Woojin and Kim, Hyung-Seok 1 September 2012 Online at https://mpra.ub.uni-muenchen.de/44031/ MPRA Paper No. 44031, posted 28 Jan 2013 15:00 UTC
Transcript
Munich Personal RePEc Archive
Death Spiral Issues in Emerging Market:
A Control Related Perspective
Kim, Woochan and Kim, Woojin and Kim, Hyung-Seok
1 September 2012
Online at https://mpra.ub.uni-muenchen.de/44031/
MPRA Paper No. 44031, posted 28 Jan 2013 15:00 UTC
Death Spiral Issues in Emerging Market: A Control Related Perspective †
Woochan Kim, Woojin Kim+, Hyung-Seok Kim#
This version: September, 2012 First version: October, 2008
Abstract
This paper studies the motive of issuing floating-priced convertibles or warrants, known as death spirals, in a country where the private benefit of control is high. Using a total of 199 death spiral issuances by public firms listed in the Korea Stock Exchange during 1998-2006, we find a number of pieces of empirical evidence that are less consistent with the conventional last resort financing hypothesis, but rather consistent with the control enhancing or control transferring hypothesis. First, abnormal returns subsequent to death spiral issuance is negative, but more so in poorly governed firms. Second, operating performance of chaebol issuers are not necessarily low at the time of the issue nor does it deteriorate over time, but they still prefer to issue death spirals over traditional fixed-priced hybrid securities. Third, we do not observe subsequent changes in the controlling shareholder in more than 60% of the issuers and these firms exhibit superior operating performance at the time of the issue compared to other death spiral or non-death spiral issuers. Fourth, this same set of firms do not experience a decrease in proportional ownership by the controlling party, while family members other than the controlling shareholder experience the most pronounced increases in the number of shares held. Finally, in approximately half of these firms, at least one member of the controlling party holds hybrid securities that can later be converted into voting shares. JEL Classifications: G32, G34 Keywords: Death spirals, Convertibles, Warrants, Control enhancing mechanisms, Korea
† We thank Lucas Anyres Barros, Alexandre Di Miceli da Silveira, Jin-woo Kim, Jung Won Suh, and other seminar participants at 2008 Korean Finance Association Annual Meeting (Seoul, 2008), 2nd Conference on Corporate Governance in Emerging Markets (São Paulo, 2009), 11th Korean Academic Society of Business Administration Conference (Yongpyong, 2009), Journal of Corporate Finance Special Conference on Emerging Markets (Beijing, 2009), KDI School of Public Policy and Management, Korea University, Seoul National University, and SKKU Graduate School of Business, for helpful comments. We thank Korea Corporate Governance Service (KCGS) for financial support.Woojin Kim appreciates support from the Institute of Management Research at Seoul National University. We would also like to thank Jeonghoon So and other members of RISK for excellent research assistance. Associate Professor of Finance, Korea University Business School, Anam-dong, Seongbuk-Gu, Seoul, 136-701, Korea, tel: +822-3290-2816 | fax: +822-3290-2552 | E-mail: [email protected] + Assistant Professor of Finance, SNU Business School, Seoul National University, Gwanak Ro, Gwanak-gu, Seoul, 151-916, Korea; E-mail: [email protected] # Korea University Business School, Anam-Dong, Seongbuk-Gu, Seoul, 136-701, E-mail: [email protected]
- 2 -
Death Spiral Issues in Emerging Market: A Control Related Perspective
This version: October, 2012 First version: October, 2008
Abstract
This paper studies the motive of issuing floating-priced convertibles or warrants, known as death spirals, in a country where the private benefit of control is high. Using a total of 199 death spiral issuances by public firms listed in the Korea Stock Exchange during 1998-2006, we find a number of pieces of empirical evidence that are less consistent with the conventional last resort financing hypothesis, but rather consistent with the control enhancing or control transferring hypothesis. First, abnormal returns subsequent to death spiral issuance is negative, but more so in poorly governed firms. Second, operating performance of chaebol issuers are not necessarily low at the time of the issue nor does it deteriorate over time, but they still prefer to issue death spirals over traditional fixed-priced hybrid securities. Third, we do not observe subsequent changes in the controlling shareholder in more than 60% of the issuers and these firms exhibit superior operating performance at the time of the issue compared to other death spiral or non-death spiral issuers. Fourth, this same set of firms do not experience a decrease in proportional ownership by the controlling party, while family members other than the controlling shareholder experience the most pronounced increases in the number of shares held. Finally, in approximately half of these firms, at least one member of the controlling party holds hybrid securities that can later be converted into voting shares. JEL Classifications: G32, G34 Keywords: Death spirals, Convertibles, Warrants, Control enhancing mechanisms, Korea
- 1 -
1. Introduction
Floating-priced convertibles, commonly known as death spirals, are convertible bonds with
price contingent conversion ratios. Unlike the conventional convertibles where the conversion ratio
or the number of shares entitled to is fixed at the time of the issue, conversion ratio in floating-
priced convertibles changes as the market price fluctuates so that the holder is entitled to more
shares as the share price falls. This feature provides the holders with an insurance against any
future drop in stock prices and guarantees a fixed total value to the holder. Although initially
introduced during late 1990’s as a financial innovation to address adverse selection problems in the
sense of Myers and Majluf (1984), it quickly disappeared from the market after initial flurry of
issues (Brealey and Myers, 2006).
According to PlacementTracker, however, these securities came back in action. The amount
of money raised by structured PIPEs - another name for death spirals - peaked in 2000 at USD 2.6
billion, dropped down to USD 80 million in 2003, and then hit its new record at USD 15.6 billion
in 2007.1 Moreover, recent deals involving troubled US financial institutions closely resemble
death spirals. For example, Merrill Lynch’s deal with Temasek of Singapore in December 2007
includes a reset clause stating that should Merrill Lynch afterwards raise money at a lower price,
Temasek would be compensated retroactively by having its initial investment priced at this lower
price.
Cross-sectionally, death spirals are found outside US as well. In Japan, it is known as
moving strike convertible bonds (MSCBs) and came under scrutiny when Lehman Brothers
provided JPY 80 billion through MSCB in internet firm Livedoor’s takeover battle against top
1 PIPE stands for private investment in public equity. In US, floating-priced convertibles are issued though private placements (Hillion and Vermaelen, 2004), although there are public offerings of death spirals in other countries. Visit www.sagientresearch.com/pt for detailed statistics on structured PIPEs in US. After the 2008 global financial crisis, the structured PIPE issuance dropped significantly, down to USD 95 million in 2011.
- 2 -
broadcaster Fuji Television Network in 2005. In Korea, death spirals are known as convertible
bonds or bonds with warrants with an option to re-fix the conversion or exercise price, which
became an important external financing vehicle following the financial crisis of 1997.
According to the existing literature, firms issue death spirals when they have no other means
of raising capital. Based on US data between 1994 and 1998, Hillion and Vermaelen (2004)
confirm this conjecture, which they named as the last resort financing hypothesis. Specifically,
they show that (i) the issuance of floating-priced convertibles is followed by significant negative
abnormal returns, (ii) the value of the underlying assets, i.e., common stock plus convertibles, fall
significantly during the year after the issuance, (iii) operating performance declines significantly
relative to comparable non-issuing firms during the years following the issuance, and (iv) poorly
performing firms are more likely to issue a floating-priced convertible. In a recent work, Brophy,
Ouimet, and Sialm (2009) analyze the characteristics of firms that obtain financing from hedge
funds and find similar results.
In this paper, we study the motive of issuing death spirals from a new angle. We investigate
whether death spirals may be used to enhance the controlling shareholder’s influence over the
business group under his/her control or to transfer the control over the issuing firm to the
controlling shareholder’s heir (control enhancing or control transferring hypothesis). The
following anecdote illustrates how this could actually occur in practice.
In July 1999, Doosan Corporation, a member firm of one of the large family-controlled
business groups or chaebols in Korea, issued a bond with floating-priced warrants (USD 100
million).2 It was an overseas public issuance, but it was prearranged so that the warrants were
detached immediately after the issuance and mostly sold to the members of the controlling family.
2 This anecdote is introduced in two reports (2002, 2003) provided by the Center for Good Corporate Governance (CGCG), a local civil organization. At the time of the death spiral issuance, Doosan business group was the 12th largest chaebol in Korea.
- 3 -
The detached warrants were initially purchased by both the third and the fourth generation family
members, but in September the third generation sold all of their warrants to the fourth generation
family members. In October, the first downward adjustment of the exercise price took place. The
outstanding principal amount was paid back in full only one year after the issuance in July 2000.
In subsequent years, share price dropped dramatically which lead the exercise price to fall
from the original level of KRW 50,100 in July 1999 to KRW 9,460 in October 2002. If the fourth
generation family members had fully exercised their warrants in October 2002, they could have
increased the family ownership of Doosan Corporation from 15.7% to 39.1%.3 In October 2002,
this scheme was uncovered by CGCG, which led the Financial Supervisory Service (FSS) to
investigate on the matter. In February 2003, the controlling family announced that they would
voluntarily void their entire holdings of Doosan Corporation warrants. The case of Doosan was
not the only case uncovered during this period. People’s Solidarity for Participatory Democracy
(PSPD), a civil activist group in Korea, reported that at least 16 other companies have issued
similar death spirals. Among these, there were four cases where the controlling family later
voluntarily redeemed all of their warrant holdings.4
To empirically test the control enhancing or control transferring hypothesis as illustrated
above, we focus on Korea which is widely known for its high level of private benefits of control.5
Using a total of 199 death spiral issuances by public firms listed in the Korea Stock Exchange
during 1998-2006, we find a number of pieces of empirical evidence that are less consistent with
the conventional last resort financing hypothesis, but rather consistent with the control enhancing
or control transferring hypothesis.
First, abnormal returns subsequent to death spiral issuances are negative, but more so in
3 Family control, including the shares owned by Doosan affiliated firms, could have increased from 59.72% to 70.9%. 4 See PSPD (2003). 5 Nenova (2003) shows that the value of control-block votes in Korea is among the highest around the world.
- 4 -
poorly governed firms, in which the private benefits of control are high (for example, chaebols or
family-controlled large business groups). According to the control enhancing or control
transferring hypothesis, the controlling shareholder of such firm typically has a strong motive to
preserve and secure his control and thus may use death spirals for such purpose. Since lower
exercise price (due to stock price drop) allows the controlling shareholders to obtain or transfer a
larger ownership stake, issuance of death spirals by these poorly governed firms may be interpreted
as a signal of overvaluation in the sense of Myers and Majluf (1984).
Second, death spirals are not necessarily issued by firms with poor performance. A number
of operating performance measures are all significantly positive in the year before the death spiral
issue, which provides a striking contrast to the results reported in Hillion and Vermaelen (2004)
based on US issuers. More importantly, we find that chaebol firms’ operating performance exhibits
a pattern opposite from those of stock returns. Specifically, chaebol issuers show persistently better
operating performance relative to non-chaebol issuers, even though their post-issuance abnormal
returns are more negative than non-chaebol issuers.
Third, in more than 60% of the issuers, controlling shareholders remain in tact until the
expiration date or 3 years after the issue. This could either be due to marginal firms effectively
coming out of difficulties through successful death spiral issues - consistent with the last resort
financing hypothesis - or healthy firms issuing death spirals to enhance or transfer control. To
distinguish between the two possibilities, we compare the operating performance of death spiral
issuers with no subsequent changes in control against other death spiral and non-death spiral
issuers and find that the former group exhibits superior operating performance at the time of issue
compared to the latter two groups. This suggests that at least in 60% of the issuers, last resort
financing does not seem to be the primary reason for issuing death spirals.
Fourth, for the same subset of firms where control remains intact, we examine the
- 5 -
proportional ownership and number of shares held by the controlling party subsequent to the death
spiral issue.6 Under last resort financing hypothesis, we should observe a decrease in proportional
ownership due to heavy dilution incurred by conversion or exercise of outside death spiral holders,
but no changes in the number of shares since insiders are financially constrained. To the contrary,
we find that these firms do not experience a decrease in proportional ownership by the controlling
party as a whole. Rather, family members other than the controlling shareholder experience the
most pronounced increases in the number of shares held subsequent to the issue. This suggests that
the controlling party were not financially constrained at the time of the issue, again inconsistent
with the last resort financing hypothesis.
Finally, as a partially direct test of control related hypothesis, we examine whether
controlling party holds on to hybrid securities that can later be converted into voting shares.7 Our
findings indicate that in approximately half of the firms with no control changes, at least one
member of the controlling party holds on to some hybrid securities.8
To the extent that the operating performance of those firms that experienced a change in
control are quite poor, we do not preclude the possibility that a certain subset of death spiral issuers
may be issuing them for last resort financing purposes, as suggested in Hillion and Vermaelen
(2004). However, since vast majority of death spiral issuers do not experience a change in control,
and these firms’ characteristics and behaviors are not consistent with last resort financing, we
remain reluctant in not rejecting the last resort financing hypothesis for the Korean market. At a
minimum, this paper suggests and identifies a new perspective behind death spirals issues that may
be more pertinent in emerging markets.
6 This analysis is only feasible for this subset of firms, since once there is a change in the controlling shareholder, we are not able to track down the ownership of the original controlling party. 7 By hybrid securities, we are referring to convertible bonds (CBs) and bonds with warrant (BWs) throughout the paper, regardless of whether they are floating-priced or not. 8 Unfortunately, available holdings data do not allow us to distinguish between a death spiral and a non-death spiral.
- 6 -
The paper is organized as follows. Section 2 provides a brief overview of death spirals in
Korea. Section 3 outlines our hypotheses and section 4 explains the data and the sample. Section
5 provides the empirical results and Section 6 concludes.
2. Death Spirals in Korea
Since the first convertible bond issuance by Samsung Electronics in 1985, hybrid securities –
mostly convertible bonds (CB) and bonds with warrants (BW) – became one of the key external
financing vehicles for Korean firms. In the earlier years, firms issued hybrid securities with fixed
conversion or exercise prices. But since the financial crisis of 1997, firms started to issue hybrids
with floating conversion or exercise prices. Table 1 reports that death spirals account for 28%
(30%) of all hybrid securities issuances during 1998-2006, in terms of amount issued (number of
issuances). In more recent years, however, death spirals are becoming the norm. During 2004-
2006, death spirals dominate not only in numbers (83%) but also in terms of amount issued (60%).
Before we discuss our detailed hypotheses in the next section, we summarize here some of
the unique features of the Korean death spirals. First, the universe of death spirals consists not
only of floating-priced convertibles, but also of bonds with floating-priced warrants. Unlike in the
US, bonds with warrants have been one of the key hybrid securities next to convertible bonds in
Korea. This is partly due to the fact that Korean commercial code does not allow firms to issue
warrants separately from a bond issuance. Reflecting the prevalence of bonds with fixed-priced
warrants, those with floating-priced warrants are also widely issued. Table 1 shows that, during
1998-2006, bonds with floating-priced warrants account for approximately 43% (18%) of total
death spiral issuances in terms of numbers (amount raised). Floating-priced convertible preferred
stocks, another form of death spiral that exists in the US, however, do not seem to have been issued
- 7 -
by Korean firms.
Second, unlike the death spirals in the US which allow conversion prices (or exercise prices
in case of bonds with floating-priced warrants) to adjust upwards in case prices go up, Korean
death spirals typically do not allow such upward adjustments. This implies there can only be a
“downward” spiral of conversion (or exercise) prices in Korea. A typical adjustment rule would
state that the conversion (or exercise) price is adjusted on the 15th day of each calendar month to be
equal to either (i) the previous month’s conversion (or exercise) price or (ii) the arithmetic average
of the closing prices during the past 5 trading days, whichever is “smaller.” So, if share price
initially falls after the death spiral issuance, this would trigger the downward reset of the
conversion price. However, even if the price rebounds afterwards, the conversion (or exercise)
price remains at below the market price since conversion price cannot be adjusted upwards.
This feature of the Korean death spirals effectively rules out applicability of undervaluation
hypothesis, another alternative considered in Hillion and Vermaelen (2004), where floating-priced
convertibles may be preferred over fixed-priced ones when managers believe that the share price is
undervalued. Under fixed conversion (or exercise) price system, wealth may be transferred from
existing shareholders to convertible holders since the latter can take advantage of the conversion
price that is lower than the share’s fair value. Floating-priced convertibles could prevent such
dilution since conversion would occur at an upward adjusted price as information spreads in the
market. This cannot be expected in Korea since upward adjustment of conversion (or exercise)
price is prohibited.
On the other hand, this feature does not preclude an investment strategy popular among US
hedge funds where an investor purchases a death spiral, short sells the underlying shares triggering
a downward price pressure, and later covers the short position by converting death spirals into a
larger number of shares. Popular press reports that similar investment strategies did take place in
- 8 -
Korea. In this regard, we do not preclude faculty contract design hypothesis proposed by Hillion
and Vermaelen (2004), which states that share price would decline after the death spiral issuance
because the contract itself inherently elicits a repeated sequence of short selling, conversion, and
dilution. Especially with upward adjustment of conversion price effectively blocked as in Korea,
any random downward move of share price can lead to a conversion (or exercise) price drop,
which would trigger a downward spiral.
Third, Korean death spirals do not allow any conversion (or exercise) discount upon issuance.
That is, the conversion (or exercise) price must be equal to some reference price based on
prevailing market price.9 This is quite different from US death spirals that allow such a discount
from a reference price.10 According to Hillion and Vermaelen (2004), this conversion discount is
on average 15.5% in the US. To the contrary, Korean death spirals in our sample exhibit an
average conversion premium of 21% relative to the previous day closing price. In a sense,
discount from a reference price can be thought of as a contractual feature that complements upward
adjustment of the conversion price. Since death spiral holder receives smaller number of shares as
stock prices go up, appropriate discount from the prevailing market price would be necessary to
induce investors. US death spirals exhibit both of these features while Korean death spirals have
neither.11
3. Research Design and Hypotheses Development
9 There are three reference prices: (1) arithmetic average of most recent 1 month closing price average, 1 week closing price average and 1 day closing price, (2) most recent 1 day closing price (3) closing price 3 days before the subscription application. Before Dec. 2005, the conversion price must be set above the highest price among these three. Since then, issuers were allowed to choose the lowest among these three for public issues. 10 In an efficient market, the value of this discount would be reflected in a higher fair value of the death spiral. 11 A few local studies have examined hybrid securities in general issued by Korean firms (e.g. Jung (2003), Park and Baek (2003), and Kang, Park, and Baek (2007)), but without any specific attention to floating-priced feature of death spirals.
- 9 -
The most straight forward way to verify control enhancing or control transferring
hypothesis would be to show that controlling shareholders or the family members hold on to these
death spirals either through initial subscription or by purchasing them from other investors.
However, the key empirical challenge to this approach is that the disclosures of insiders’ holdings
do not allow us to distinguish between a death spiral and a non-death spiral. That is, we can only
identify up to general type of securities, i.e. commons stocks, preferred stocks, convertibles, or
BWs. Instead, we develop a number of predictions that are consistent with the control enhancing
or transferring hypothesis, but not with the last resort financing hypothesis.
Although we acknowledge the possibility of a faulty contract design, we do not explicitly
test whether contractual features of death spirals exacerbate the stock price decline upon issuance,
mostly because Korean death spiral contracts are highly standardized so that there is not enough
cross-sectional variation to exploit. Rather, we propose control enhancing or transferring
hypothesis as one possible explanation why managers would approve the issuance of death spirals
despite its inherently faulty contract design. As elaborated in the previous section, there is no need
to test the undervaluation hypothesis in the Korean context.
A. Stock Price Movement following the Death Spiral Issue Announcement
We begin with the test that investigates whether the issuance of death spirals are followed by
significant negative abnormal returns, which is a necessary condition for both hypotheses. Under
the last resort financing hypothesis, firms issue floating-priced convertibles over conventional
fixed-priced alternatives when share prices are believed to be overvalued by outside investors at
- 10 -
issuance. 12 Following the issue, conversion price may be adjusted downwards as initially
overvalued stock price declines over time. Outside investors would willingly acquire these
floating-priced convertibles since they provide a protection against the risk of overpayment.
Conventional fixed-priced convertibles, however, do not provide such protection against a
potential stock price drop. Thus, according to the last resort financing hypothesis, issuance of a
death spiral signals overvaluation, which results in share price drop following the issuance.
Under the control enhancing or control transferring hypothesis, share prices drop because
the death spirals themselves are ill-designed. The difference from the faulty contract design
hypothesis is that, it provides an explanation why a firm would issue a death spiral despite its faulty
design.13 Under this hypothesis, the controlling shareholder allows the issuance of death spirals
because they help the affiliated firms or their heirs to convert bonds (or exercise warrants) at a
cheaper price and thus obtain more voting rights.
Cross-sectionally, controlling shareholders in poorly governed firms who enjoy large private
benefit of control would exhibit stronger incentive to enhance or transfer his/her control. There is a
growing literature in international corporate governance which documents that the structure of
diversified business groups in emerging markets may aggravate agency problems (Johnson, La
Porta, Lopez-de-Silanes, Shleifer, 2000). To the extent that expropriation of minority shareholders
may be more severe in these family-controlled business groups, we expect the stock market
reaction to be more negative for these poorly governed firms.14
12 This hypothesis assumes two different types of investors. That is, current existing shareholders who believe the shares are fairly valued but are under liquidity constraints and outside potential investors who believe shares are overvalued. 13 Controlling shareholders may trigger a downward spiral themselves by disseminating negative information or directly selling their shares, although we do not explore this issue further in this paper. 14 Alternatively, since lower conversion (or exercise) price implies a larger increase in voting rights, issuance of death spirals by poorly governed firms may signal overvaluation in the sense of Myers and Majluf (1984), which also predicts more negative returns for poorly governed firms.
- 11 -
B. Operating Performance of the Death Spiral Issuers
As elaborated above, negative stock returns subsequent to a death spiral issue does not
provide a clear distinction between last resort financing and control enhancing hypotheses. To
effectively distinguish between the two hypotheses, we next investigate whether death spiral
issuers are firms with poor operating performance at the time of issuance. According to the last
resort financing hypothesis, firms tend to issue death spirals when their poor accounting
performance does not warrant them from issuing conventional securities. Even if shares are
believed to be overvalued by outside investors at issuance, firms would still be able to issue
straight debt as long as their operating performance stands at a reasonable level. But firms under
severe financial distress with extremely poor accounting performance would have no choice but to
issue death spirals. To the contrary, the control enhancing or control transferring hypothesis
predicts that death spiral issuers are not necessarily poorly performing firms. This is mainly
because controlling shareholder would have less incentive to enhance or transfer his/her control of
a firm that is poorly performing.
We also investigate if the operating performance of death spiral issuers deteriorates over
time. According to the last resort financing hypothesis, outside potential investors believe shares
are overpriced while current shareholders do not, because the former expects future operating
performance to deteriorate while the latter do not. The control enhancing or control transferring
hypothesis, on the other hand, has no prediction regarding ex-post operating performance.15 If we
find that death spiral issuers are not necessarily poorly performing firms at the time of issuance or
do not experience deterioration in their operating performance after the issuance, it would be an
indication that firms may issue death spirals for reasons other than last resort financing.
15 If the controlling party divests its shares before the death spiral issue date to protect itself from dilution (insider trading or stock price manipulation), one may expect operating performance to deteriorate in subsequent years even under the control enhancing or the control transferring hypothesis. In this paper, however, we do not explore this possibility.
- 12 -
Cross-sectionally, non-poor performance would be more pronounced in poorly governed
firms since their controlling shareholders have stronger incentives to issue death spirals to enhance
or transfer control, even though they are not in any desperate need to raise additional capital. We
also expect to observe similar non-poor performance in firms where control is preserved within the
family even after a death spiral issuance, since these are precisely the ones that are more likely to
have issued death spirals for control enhancing or control transferring motives. Furthermore, we
directly test whether poorly governed firms such as chaebols actually prefer to issue floating-priced
death spirals over conventional fixed-priced hybrid securities.
C. Evolution of Corporate Ownership in Death Spiral Issuers
Our final set of empirical analyses focuses on how controlling party’s ownership evolves
after issuing a death spiral. Under the last resort financing hypothesis, death spirals are issued to
outside investors who may convert them into a large number of new shares at low conversion
prices, which would heavily dilute the existing shareholders’ proportional ownership including the
controlling party’s. Thus, we expect to observe a decrease in proportional ownership of the
controlling party under last resort financing. In the extreme case, incumbent controlling party may
fail to retain control as a result of continued dilution.
On the other hand, control enhancing or preserving hypothesis predicts that incumbent
controlling parties not only retain their control, but may even increase their proportional ownership
through conversion (or exercise) of death spirals held by insiders. Members of the controlling party
may also actively purchase existing shares in the market, or subscribe to new shares offered by the
company, or hold hybrid securities that can later be converted into voting shares, all of which
would contribute to increases in proportional ownership subsequent to a death spiral issue.
- 13 -
4. Data
A. Sample Construction
We first extract a list of all publicly traded non-financial firms on Korea Stock Exchange
(KSE) that issued hybrid securities (CBs or BWs) since 1998. This list is available from TS2000, a
dataset compiled by the Korea Listed Companies Association (KLCA). The list contains the
identity of the issuer as well as the detailed characteristics of each issue such as the type of security,
total proceeds raised, conversion ratio, issue date, expiration date, etc. To accurately identify the
exact announcement date of the original disclosure of the issue, we manually searched Korea Stock
Market Daily, a daily publication issued by KSE, where all of the public disclosures are officially
announced.16 In the process, we also double checked whether the information contained in TS2000
is consistent with the original disclosure.17 We set our sample period to start in 1998 and end in
2006, mainly since death spirals became popular in Korea after the financial crisis in 1997. During
our sample period, we identified a total of 657 hybrid security issues by 288 distinct firms, of
which 199 issues by 126 distinct firms were death spirals.
B. Other Data Sources
For accounting variables and year-end market variables, we use data provided in TS2000.
For dividend and stock-split adjusted daily returns, we resort to a dataset from Korea Securities
Research Institute (KSRI). We obtain ownership and insiders’ holdings data manually from the
annual reports and holdings filings available through Data Analysis, Retrieval, and Transfer
16 The difference between the actual issue date and the original announcement date can be as short as one trading day up to two months. 17 In case where there was a discrepancy, we followed the original disclosure.
- 14 -
(DART) system which is an electronic disclosure platform similar to EDGAR in US.18 Identity of
controlling shareholders of each firm are provided in KISLINE. Information on foreign ownership
is obtained from both TS2000 and KIS-VALUE, a database administered by National Information &
Credit Evaluation (NICE).
For firm-level corporate governance index, we resort to Korea Corporate Governance Index
(KCGI) scores provided by the Korea Corporate Governance Service (KCGS), a nonprofit
organization that surveys every year the governance practices of all the listed companies on the
Korea Exchange (KRX). As of 2006, they had a total of 130 assessment items with a total score of
300 points. To identify chaebol or family-controlled large business group affiliation, we resort to
annual press releases from the Korea Fair Trade Commission (KFTC) which designates large
business groups based on group-level gross total assets whose member firms are subject to certain
regulatory obligations.
5. Results
A. Summary Statistics
Panel A of table 1 reports the number of hybrid security issues over the sample period for
both death spirals and non-death spirals. Death spirals are floating-priced convertible bonds (CBs)
or bond with warrants (BWs) where the conversion price or the exercise price falls in case the
stock price falls subsequent to the issue. We further classify death spirals and non-death spirals
into three sub-categories; CBs vs. BWs, domestic vs. overseas issue, and public vs. private issue.
The numbers for all issues indicate that there was a clustering of issues in 1999. We
18 There are a variety of data vendors that provide ownership data for Korean firms. But, there are certain limits regarding the accuracy of these datasets, especially the detailed relationship between each individual shareholder and the controlling shareholder. Hence, we reassembled the ownership dataset manually using the original disclosures by the reporting firms.
- 15 -
conjecture that this is related with the efforts of the Korean firms to reorganize their capital
structure in the aftermath of 1997 financial crisis. And most of the issues in 1999 were non-death
spirals. Since 1999, the number of non-death spiral issues kept decreasing. In contrast, we observe
more issues of death spirals in the recent years. In fact, death spirals issued in 2005 and 2006
account for more than half of all death spiral issues.
The composition of sub-categories indicates that the relative frequencies for BWs, overseas
issues and public offers are higher in the death spiral group than in the non-death spiral group.19
However, we note that death spirals issued overseas through public offerings can actually end up in
the hands of the controlling family members, as illustrated in the introduction.
In panel B of table 1, we report the total proceeds from hybrid securities. We observe a
similar pattern as in panel A, except that there is another clustering in 2001 from both death spiral
issues and non-death spiral issues.20
B. Stock Price Movement following the Death Spiral Issue Announcement
In table 2 and figure 1, we report the averages of the cumulative abnormal returns of the
death spiral issuers surrounding the original disclosure announcement from day -10 through day
+60. Event day is the original disclosure date of issue identified from Korea Stock Market Daily.
We use both market-adjusted model and market model to estimate abnormal returns where the
market returns are value weighted index returns compiled by the Korea Securities Research
Institute (KSRI). Market model parameters are estimated using past 200 trading days from day -
19 In US, death spirals are typically issued through private placements. 20 For death spirals, this clustering can be attributed to an extremely large issue of KRW 3.2 trillion by a single firm Hynix, a semiconductor manufacturer.
- 16 -
220 to -21 of the issue announcement.21
In table 2, we test the statistical significance based on two different procedures. First, we
report the t-stats based on cross-sectional standard errors during the event period. The second t-stat
is based on time-series standard deviations of portfolio returns during the estimation period (Brown
and Warner, 1985).
The results from figure 1 and panel A of table 2 indicate that death spiral issuers experience
a significant drop in stock prices following the issue announcement. For all death spiral issuers,
the average drop is -13.29% based on market model, and -8.47% based on market adjusted model
over a two month period.22 This is consistent with Hillion and Vermaelen (2004), where they
report abnormal returns between -30.1% to -54% over a 12 month period.23 These results are
consistent with both last resort financing hypothesis and control enhancing or transferring
hypothesis, but not with undervaluation hypothesis. As mentioned earlier, undervaluation
hypothesis is irrelevant in the Korean regulatory context since upward adjustment of conversion
(or exercise) price is prohibited. In unreported results, we examine whether there are any
differences in abnormal returns between CBs and BWs, domestic and overseas issues, and public
and private issues, but the differences are generally not statistically significant.
In the second column of panel A in table 2, we report the results using only the first death
spiral issue by each firm. And the results suggest that the magnitude of the price drop is smaller for
the first issues, implying that the returns are more negative for the follow-up issues. This could be
explained at least partially by investors becoming more aware of the consequences of the death
21 In case where there were more than two issues by the same issuer on the same date, we excluded them from this analysis if one of them was a death spiral but the other was not. If all of the issues made by the same issuer on the same date were death spirals, we treated them as one observation. 22 We also tried various horizons, up to +30, +90, and +180 trading days and obtained similar results. 23 Hillion and Vermaelen (2004) use monthly returns rather than daily returns since they cannot identify the exact announcement date. This is mainly because US disclosure rules allows firms to file after the actual issue so it is not clear when the issue decision was made public. Our dataset allows us to identify the exact date of the original disclosure from the Korea Stock Market Daily, so that we may use daily returns instead of resorting to monthly returns.
- 17 -
spirals (Hillion and Vermaelen, 2004).
We also examine long-term cumulative abnormal returns and buy-and-hold returns of death
spiral issuers where we extend our event period to 12 months before and 12 months after the issue
announcement date. In unreported results, we find that there is a run up in stock prices leading up
to the announcement, which might reflect controlling shareholders’ effort to issue death spirals
when the shares are most overvalued. This run up, however, is more than wiped away during the
12 months following the announcement. These findings suggest that our baseline result of value
destruction for death spiral issuers is robust to the length of the event period.
We next divide the sample into two groups based on firm-level corporate governance to test
whether poor governance leads to more negative stock market reactions. We consider the following
three proxies: (i) affiliation to family-controlled large business groups, also known as chaebols, (ii)
foreign ownership, and (iii) Korea Corporate Governance Index (KCGI) scores. In family-
controlled large business groups, controlling families often retain voting rights that significantly
exceed their cash flow rights, and such control-ownership disparity provides them the incentive
and the power to pursue various forms of private benefits of control and expropriate minority
shareholders (La Porta et al., 1999). Such expropriation, however, would be mitigated if
controlling families are subject to strong internal or external monitoring. High foreign ownership
or high corporate governance index would imply stronger monitoring. The sample is split into two
based on chaebol affiliation, the median value of foreign ownership, or the median score of KCGI,
the results of which is reported in panel B of table 2. As in panel A, we first report the results for
all death spiral issues (columns 1 though 3), and then report the results only for the first issues
(columns 4 through 6).
The results indicate that there is a clear contrast between relatively well governed firms and
poorly governed firms in terms of stock market reactions. Specifically, cumulative abnormal
- 18 -
returns for poorly governed firms are all negative and statistically significant, while those for well
governed firms are mostly insignificant or even positive in some cases. We formally test the
differences between the poorly governed issuers and the well governed ones in columns 3 and 6
and find that the differences in mean CARs between the two groups are not only statistically
significant but also economically substantial. Panels A and B in figure 1 graphically illustrates this
point and shows that the negative abnormal return upon the issuance of death spiral is mostly being
driven by chaebol firms depicted in bold line.
In table 3, we confirm our previous univariate findings in a multivariate setting by running
cross-sectional regressions of CAR[-10, +60] on our three measures of governance (chaebol, high
foreign ownership, and high KCGI dummies) and various other control variables, including
leverage (ratio of debt to assets), return volatility (standard deviation of daily stock returns during
the past 12 months before announcement date), age (number of years since IPO), Tobin’s q (ratio
of the sum of market value of common equity and the book value of debt to the book value of
assets), interest coverage ratio (EBIT over interest expenses), ROA (net income over assets),
industry dummies, and year dummies. Regressions (1) – (3) use all death spiral issues, while
regressions (4) – (6) drops any subsequent issues by the same firm.
The coefficients on our three governance measures are all consistent with our earlier
univariate analyses. Specifically, the coefficient on chaebol dummy is negative and statistically
significant, while the coefficients on high foreign ownership and high KCGI dummies are both
positive and statistically significant even after controlling for various firm-level factors that could
potentially affect stock market reactions. For example, results from column (4) indicates that
chaebol issuers’s CAR[-10, +60]s are 25.1% points lower than those of non-chaebol issuers.24
24 As a robustness check, we also run cross-section regressions using short window CARs, where the dependent variable is CAR[-1, +1] and CAR[-5, +5]. Overall, the results are largely similar to our baseline findings in that
- 19 -
These cross-sectional results suggest that potential misusage of death spirals for the benefit of the
controlling party could be more pronounced in firms more susceptible to agency problems.
C. Operating Performance of the Death Spiral Issuers
Since negative stock returns documented in the previous subsection are consistent with both
last resort financing hypothesis and control enhancing or transferring hypothesis, we now attempt
to distinguish between the two by analyzing the operating performance of death spiral issuers
before and after the issue. Hillion and Vermaelen (2004) report negative operating performance
for their sample of US death spiral issuers and conclude that the evidence is mostly supportive of
the last resort financing hypothesis.25 If last resort financing hypothesis also holds in our sample,
we expect to see substantially negative operating performance for the death spiral issuers.
Table 4 reports the results of this analysis.26 In panel A, we present the median values of
various measures of operating performance for the death spiral issuers.27 In marked contrast with
the Hillion and Vermaelen (2004) sample, the death spiral issuers in our sample do not exhibit poor
operating performance prior to the issue. In fact, none of the point estimates of the performance
measures are negative, and all variables, except for market to book and Tobin’s q, are significantly
chaebol membership is negatively correlated with event period abnormal returns while foreign ownership and corporate governance index level is positively correlated. However, the statistical significance for foreign ownership and governance index is a bit weaker in the short window analysis for some event windows. 25 For example, they report median profit margin of -84.0% and median ROA of -47.1% for death spiral issuers as of one fiscal year end before the issue. 26 In case where there were more than two issues by the same issuer within the same fiscal year, we excluded them from this analysis if one of them was a death spiral but the other was not. If all of the issues made by the same issuer during a given fiscal year were death spirals, we treated them as one observation. 27 EBITDA is the sum of operating income and depreciation. Profit margin is net income divided by sales. ROA is net income divided by assets. CF (cash flow) ratio is operating income adjusted for non-operating income and expenses. INV is capital expenditures plus R&D. ADV is expenditures for advertisement. Market/Book is the ratio of the market value of equity to the book value of equity, where firms with negative book equity are excluded. Tobin’s q is the ratio of market value of assets (sum of market value of common equity and the book value of debt) over book value of assets.
- 20 -
positive just prior to the issue of death spirals.28 And these firms are spending significantly positive
amount on capital expenditures, R&D, and advertisements during the 5 year window. These
findings strongly suggest that death spiral issuers in the Korean market on average may be issuing
them for reasons other than last source of financing.
Panels B and C of table 4 report the operating performance of chaebol and non-chaebol
issuers, respectively, and panel D reports the differences between the two subsamples. The results
from these panels indicate that chaebol issuers exhibit superior operating performance prior to the
issue. For example, EBITDA/sales is 8.5% for chaebol issuers a year before the issuance, while it
is only 2.1% for corresponding non-chaebol issuers. Moreover, operating performance of chaebol
issuers show no sign of deterioration over time. For example, three years after the issuance,
chaebol issuers exhibit a profit margin of 2.7%, which is 1.8% points higher than the level before
the issuance. Non-chaebol firms, on the other hand, show a profit margin of -9.6%, which is 10%
points lower than the level before the issuance.
Such non-negative operating performance for chaebol firms is hard to reconcile with last
resort financing hypothesis since they do not seem to be in any desperate need to finance additional
capital. It is also worth mentioning that market/book and Tobin’s q of chaebol issuers are lower
than those of non-chaebol issuers in table 4. This is consistent with our earlier argument that
minority shareholders of chaebol issuers are subject to greater expropriation risks.
We next implement a similar cross-sectional univariate analysis of operating performance
among three groups of firms; death spiral issuers with no changes in controlling shareholder (group
A), death spiral issuers that experienced a change in controlling shareholder (group B), and non-
28 The number of firm-years used to calculate Market/Book and Tobin’s q are slightly smaller than those reported in table 3 due to availability of market data.
- 21 -
death spiral issuers (group C).29 Then, we compare groups A and B as well as A and C. Since
firms where control remains intact within the family even after issuing a death spiral are the ones
that are likely to have issued death spirals for control enhancing or control transferring purposes,
we expect group A to exhibit better (similar) operating performance than group B (group C).
Table 5 reports the results of this analysis. First, we note that in more than 60% of death
spiral issuers, controlling shareholders retain their positions. A priori, these firms could either be
marginal firms that emerged from distress subsequent to a death spiral issue, or healthy firms that
were not in distress from the first place. However, we observe a clear difference in operating
performance between those that did not experience a change in control and those that did within
death spiral issuers. Firms with no changes in controlling shareholder (group A) generally exhibit
much better operating performance than those with changes in controlling shareholders (group B)
prior to the death spiral issue. Group B’s market to book or Tobin’s q is higher than group A, but
we conjecture that this may reflect either (cumulative) low book values following bad operating
performance or simply overvaluation of these stocks.
According to the last resort financing hypothesis, firms with poor operating performance
with overvalued share price are the ones that issue death spirals. Interestingly, group B in our
sample which accounts for roughly 40% of the death spiral issuers seems to fit these two
characteristics. To this extent, we do not preclude the possibility that certain subset of death spiral
issuers in Korea could be motivated by last resort financing.
In addition, we do not observe much differences in operating performance between group A
(death spiral issuers with no changes in control) and group C (non-death spiral issuers). The
29 We track changes in control up to the expiration date or 3 years after the issue if the expiration date is not specified. We chose 3 years since the average difference between the issue announcement and the expirations was around 3.6 years. Cases where issuers were merged or acquired by other entities that are not members of the controlling party are classified as group B. We first identify the names of the controlling shareholders in KISLINE. Whenever there is a change in the name of the controlling shareholder, we manually search the shareholder distribution section in annual reports to identify the specific transaction that led to the changes in the controlling party.
- 22 -
difference between group A and C is not significant for four variables: EBITDA/assets,
EBITDA/sales, ADV/sales, and Market/Book. In fact, profit margin, ROA and CF/assets are
significantly higher for group A. This implies that at least group A firms are strongly inconsistent
with last resort financing hypothesis.
In summary, results from table 5 suggest that firms with no subsequent changes in
controlling shareholder exhibit a superior operating performance at the time of death spiral
issuance compared to firms with subsequent changes in controlling shareholder, confirming our
conjecture that the former is more likely to have issued death spirals for control enhancing or
control transferring motives.
In table 6, we further test whether the decision to include death spiral feature conditional on
issuing a hybrid security is affected by operating performance in a multivariate context.
Specifically, we run a logit model where the dependent variable equals one if the issues is a death
spiral and zero if the issue is a conventional non-death spiral issue. Explanatory variables are
measures of operating performance discussed in the univariate analysis in table 4 and interest
coverage ratio defined as operating income divided by interest expense which is a typical measure
of cash flow liquidity
We also include a number of control variables that have been recognized in the previous
literature as potential factors that may affect the decision to issue death spirals. As discussed in
Hillion and Vermaelen (2004), the floating-priced convertibles offer lower costs of financial
distress relative to convertible debt with a fixed conversion price. Thus, firms with higher leverage
are likely to issue death spirals to reduce potential costs of financial distress. Hillion and
Vermaelen (2004) also find that floating-priced convertible issuers tend to be small, young and
risky firms. Hence, we include the following additional control variables; ‘Size’ measured by log
of total assets (in Korean Won thousands), ‘Age’ which is the number of years from the IPO until
- 23 -
one fiscal year before the announcement date, and ‘Return Volatility’ measured as the standard
deviation of daily stock returns during the previous 12 months before the announcement date. We
also include industry and year fixed effect dummies in all of our specifications.
The results from table 6 indicate that death spiral issuers are indeed smaller than non-death
spiral issues. But, contrary to what Hillion and Vermaelen (2004) finds, death spiral issuers in our
sample exhibit lower stock return volatility than non-death spiral issuers. This is consistent with
our earlier finding that death spiral issuers are not necessarily firms with financial distress. One of
the most striking results from table 6 is that none of the operating performance variables turn out to
be a significant predictor of death spiral issues. The only explanatory variable that turns out to be
significant is the interest coverage ratio, which proxies for liquidity of the firm indicating that firms
that might have temporary liquidity issues could resort to death spirals.
Table 6 also investigates if our governance measures influence the likelihood of issuing
death spirals. In panel A, we include the chaebol dummy, the high foreign ownership dummy (1 if
foreign ownership greater than the median), and the interaction between the two. In panel B, we
include the chaebol dummy, the high KCGI dummy (1 if KCGI score is greater than the median),
and the interaction between the two. Chaebol dummies are always positive and statistically
significant, indicating that chaebol firms, with low foreign ownership or low KCGI scores, are
more likely to death spirals as opposed to non-death spirals. The interaction terms, on the other
hand, are all negative and significant at the 10% significance level, indicating that foreign
ownership and KCGI mitigates the chaebol firms’ tendency to issue death spirals as opposed to
non-death spirals. That is, aggravated agency problem occurs mostly through chaebol affiliation,
but high foreign ownership or high corporate governance may offset such adverse incentives.
Overall, the results from tables 4, 5, and 6 strongly suggest that the death spiral issues in
Korea are not mostly driven by marginal firms that are in desperate need for additional financing.
- 24 -
Rather, death spiral issuers, especially chaebols and those where control remains intact, exhibit
sound operating performance. In fact, chaebols still prefer to issue a death spiral over a
conventional fixed-priced hybrid security, despite their strong operating performance. These
findings run counter to the last resort financing hypothesis supported by Hillion and Vermaelen
(2004) using US data.
D. Evolution of Corporate Ownership in Death Spiral Issuers
(1) Controlling Party’s Ownership Changes
In this subsection, we explore the control related motives in a more direct manner by
examining the changes in ownership of the controlling shareholder as well as the related parties
since the death spiral issue for various horizons. If the motivation behind the death spiral issue is
last resort financing from outside investors, then we should observe decreases in proportional
ownership of the controlling party, as the outside death spiral holders exercise their conversion
rights increasing the number of shares outstanding and hence diluting the proportional ownership
of the existing shareholders. In the extreme case, incumbent controlling party may lose control as a
result of heavy dilution, after which we are no longer able to track their changes in holdings. Thus,
the range of this analysis is restricted to those firms where the controlling shareholder remains
intact. We examine the changes in ownership of the controlling shareholder as well as the related
parties following the death spiral issue to test whether this prediction holds.
The results are reported in table 7. Beginning in year -1, panel A presents the comparison up
to year +1, panel B up to year +3, and panel C up to the year of expiration date. The results
indicate that there is a significant decrease in the ownership of the controlling shareholder
him/herself throughout all panels. Other family members and the controlling party as a whole seem
- 25 -
to experience a slight drop in proportional ownership immediately following the death spiral issue,
but over longer horizons, other family members recover their proportional ownership so that the
overall control rights are unaffected. These results suggest that the controlling party may be
utilizing the death spirals to change the control structure of their firms within the business group,
while maintaining the same level of overall control rights in the issuing firm.
We next examine the changes in the number of shares held by the controlling party, after
adjusting for the mechanical changes in outstanding number of shares.30 If the death spiral issue is
mainly due to last resort financing, then wealth constrained controlling party would not have
enough resources to actively participate in subsequent equity or hybrid security offerings by the
issuer in the primary market or purchase existing shares or hybrid securities from other investors in
the secondary market to recover and maintain their original proportional ownership.
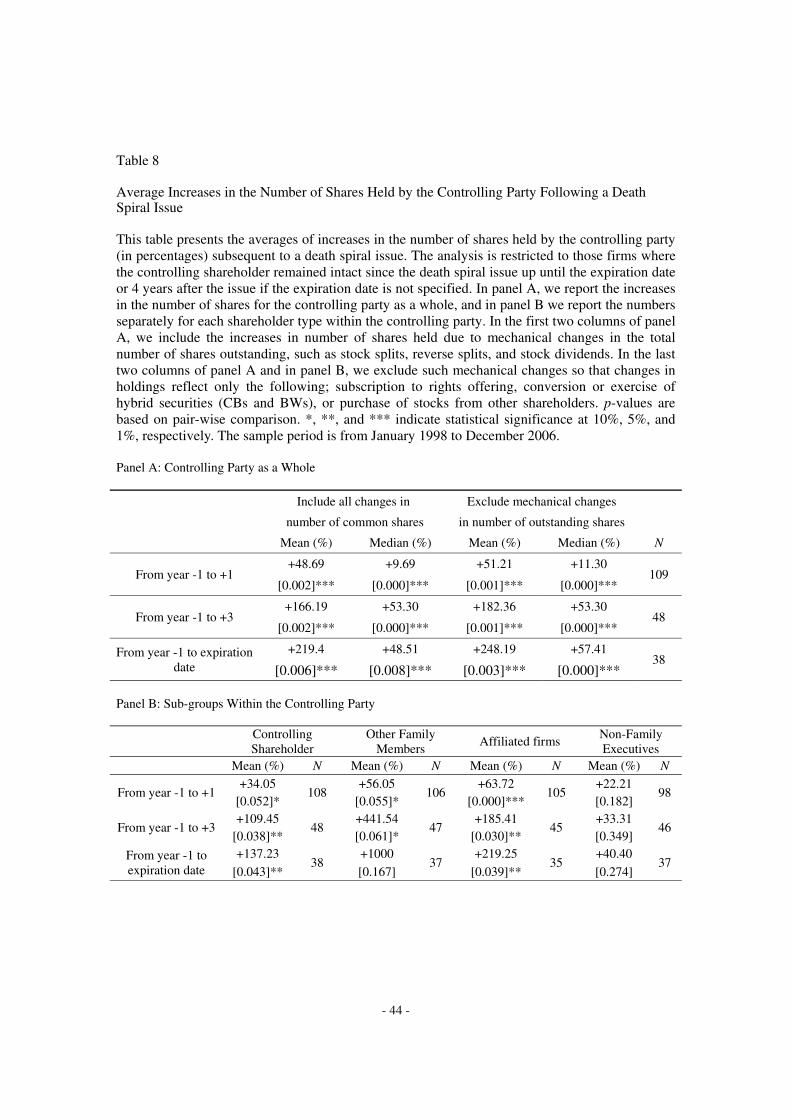
We report the results of this analysis in table 8. In panel A, we report the increases in the
number of shares for the controlling party as a whole, and in panel B we report the numbers
separately for different shareholder groups within the controlling party. In the first two columns of
panel A, we include the increases in number of shares held due to mechanical changes in the total
number of shares outstanding. In the last two columns of panel A and in all columns of panel B, we
exclude such mechanical changes so that changes in holdings reflect only the following;
subscription to rights offering, conversion or exercise of hybrid securities (CBs and BWs), or
purchase of stocks from other shareholders. We outline the detailed procedure of these calculations
in the appendix.
The results indicate that the number of shares held by the controlling party as a whole
increases substantially even after we exclude all mechanical changes in the total number of shares
30 Mechanical changes in the number of shares include the following: stock splits and reverse splits, stock dividends, and reduction in paid in capital.
- 26 -
outstanding. 31 This implies that the controlling party actively purchased shares from other
shareholders or participated in rights offerings or exercised their conversion rights to recover and
maintain their original proportional ownership. Moreover, the results from panel B indicate that the
increases in the number of shares are most pronounced for other family members. Overall, these
results suggest that decision to issue death spirals may be directly related with preserving and/or
transferring control of the business group to another family member.
As our final set of tests, we investigate whether any member of the controlling party holds
hybrid securities that can later be converted into voting shares. Ideally, we would like to focus only
on holdings of death spirals, but the disclosures on insider’s holdings are not detailed enough to
determine whether a given hybrid security has a death spiral feature or not. The only cases where
we can clearly verify a hybrid security held by an insider is indeed a death spiral are found in firms
that have issued only the death spirals (exclusive death spiral issuers). The hybrid securities we
investigate include convertible bonds, bonds with warrants, and warrants detached from the
original bonds with warrants.
Table 9 reports the number of firms where any member of the controlling party holds hybrid
securities after the death spiral issuance. As in tables 7 and 8, the analysis is restricted to firms with
no subsequent changes in control following a death spiral issue. Note that the number of firms with
no changes in control drops over time by construction. In panel A, we include all firms that issued
either a death spiral or a non-death spiral. In panel B, we include firms that issued only the death
spirals.
The results in panel A show that the fraction of firms with controlling party holding hybrid
securities after the death spiral issuance is approximately 30% during the first year of issuance, but
31 The numbers are actually slightly larger after excluding the mechanical changes mainly due to decreases in outstanding shares in reverse stock splits.
- 27 -
increases up to approximately 50% for a longer time horizon. Nevertheless, the results in panel A
are somewhat inconclusive since the holdings may be for either death spirals or non-death spirals.
The results in panel B, however, indicate that even when we focus on firms where the hybrid
securities held by the controlling party members are unilaterally death spirals, we obtain a similar
pattern. Specifically, in approximately half of the sample firms, death spirals are held by members
of the controlling party, although it would be difficult to implement a statistical test due to a small
sample size. This is a strong piece of evidence that is consistent with the control enhancing or
control transferring hypothesis, but not with the last resort financing hypothesis.
6. Conclusion
In this paper, we study the motive of issuing floating-priced convertibles or warrants, known
as death spirals, in an economy where private benefit of control is high. Using a total of 199 death
spiral issuances by public firms listed in the Korea Stock Exchange from 1998 to 2006, we provide
empirical results that are less consistent with the last resort financing hypothesis, but rather
consistent with the control enhancing or control transferring hypothesis.
First, we find that death spirals are not necessarily issued by marginal firms with poor
operating performance at the time of issuance. In fact, our results show that none of the point
estimates of the performance measures are negative for death spiral issuers prior to the issue. For
chaebol issuers, operating performance does not even show any sign of deterioration over time
following the issue. In a multivariate analysis, we find that death spiral issuers are not different
from conventional non-death spiral issuers in terms of their operating performance at the time of
issuance, while chaebol issuers are more likely to prefer a death spiral to a conventional fixed-
priced hybrid security. We also find that death spiral issuers where there was no subsequent change
- 28 -
in control exhibits superior operating performance at the time of death spiral issuance compared to
those where there was a change in control.
Second, proportional ownership by the controlling party as a whole is not much diluted after
the death spiral issuance. In fact, the number of shares held by the controlling party increases
significantly, especially for other family members, after adjusting for the mechanical changes in
the number of total shares outstanding. We also find that in approximately half of the firms where
control remains intact, at least one member of the controlling party holds hybrid securities that can
be later converted into firm’s voting shares. Even within exclusive death spiral issuers, we obtain a
similar result.
Although our sample consists of death spirals issued by firms in a single country, we believe
the findings we document may be generalized to other emerging markets where the economy is
dominated by family-controlled business groups. As long as the controlling shareholder has a
motive to enhance his/her control over the group or has a motive to transfer control over to his/her
heir due to the high level of private benefits of control, there is a potential that “financial
innovations” such as death spirals may be misused for such purposes.
- 29 -
References
Brealey, R.A., Myers, S.C., and F. Allen (2006), Corporate Finance, 8th edition, McGraw-Hill
Brophy, David, Paige Ouimet, and Clemens Sialm (2009), “Hedge Funds as Investors of Last
Resort?” Review of Financial Studies, Vol.22, pp.541-574
Appendix: Calculation of Increases in the Number of Shares Held by Controlling Party
This appendix outlines the detailed procedure used to calculate the changes in the number of shares
held by the controlling party reported in table 8. We first calculate the number of shares held by the
controlling party i at time t by multiplying proportional ownership by the number of common shares
outstanding at each fiscal year end as follows.
1 1 1
1 1 1
3 3 3
i i
i
i
N OWN Common
N OWN Common
N OWN Common
****i 상첨자를 두번째 및 세번째 OWN 에도 넣어 주기 바랍니다****
Then, we calculate the changes in number of common shares held by the controlling party as follows.
( 1, 1) 1 1
( 1, 3 ) 3 1
1 ( )
1 ( )
i i i
i i i
Difference N N
Difference N N
However, above difference also includes mechanical changes in the number of shares outstanding such
as stock splits and reverse stock splits. To exclude these mechanical changes and focus on the controlling
party’s active decision to maintain or increase their shares (by participating in rights offering or exercising
their conversion rights of hybrid securities – CBs or BWs – in primary market or purchasing existing shares
from other shareholders in the secondary market), we obtain the increases in total number of shares due to
mechanical changes as follows.
1 1 ( 1, 1)
( 1, 1) 1 2
1 : numerical changes by stock splits, etc.
Common Common Common
Common X X
X
****numerical 이 아니라 mechanical 로 수정***
****deltaX2 에 대한 정의 (changes in number of shares due to new capital raised or repurchases ?)
추가****
( 1, 1) 1 1 12 ( ) [ *]i i iDifference N N X OWN
- 32 -
****Difference i 2 (-1,+3) 추가*****
where OWN* corresponds to the proportional ownership as of the nearest fiscal year before the mechanical
changes in total outstanding shares take place.
- 33 -
Table 1 Sample Summary Statistics This table presents the summary statistics for the full sample. The sample includes all hybrid securities (convertible bonds or bonds with warrants) issued between January 1998 and December 2006 by non-financial firms listed on Korea Stock Exchange (KSE). Panel A reports the number of issues while panel B reports the total proceeds raised. The first column in each panel reports the numbers for all hybrid securities issued over the sample period. The next seven columns report the numbers for death spiral issues. Death spirals are floating-priced convertible bonds (CBs) or bond with warrants (BWs) where the conversion or exercise price may adjust downwards in case stock price falls subsequent to the issue. We further classify death spirals into three sub-categories; CBs vs. BWs, domestic vs. overseas issue, and public vs. private issue. The next seven columns present the corresponding numbers for conventional fixed-priced non-death spiral issues. Panel A: Number of Hybrid Security Issues by Type
Year All Death Spirals (Floating-Priced) Non - Death Spirals (Fixed-Priced)
Total CB BW Domestic Oversea Public Private Total CB BW Domestic Oversea Public Private
Table 2 Analyses of Cumulative Abnormal Returns (CARs) around Death Spiral Issue Announcement This table presents averages of cumulative abnormal returns surrounding the original disclosure announcement of death spiral issue from day -10 through day +60. We use both market-adjusted model and market model to estimate CARs where the market returns are value-weighted index returns compiled by the Korea Capital Market Institute (KCMI). Market model parameter estimates are obtained using past 200 trading days from day -220 to -21 of the issue announcement. Panel A reports the results for the full sample and panel B reports corresponding numbers for subsamples grouped by relative corporate governance levels. We consider three proxies for firm-level corporate governance; chaebol or large business group affiliation, foreign ownership, and an index provided by the Korea Corporate Governance Service (KCGS). Based on these three measures, we define low corporate governance firms as chaebol issuers, issuers with foreign ownership lower than the sample median, or issuers with Korea Corporate Governance Index (KCGI) lower than the sample median. In both panels, we present the results separately for all issues and first issues only. We report two types of t-statistics in panel A; one based on cross-sectional standard errors during the event period and the other based on time-series standard deviations of portfolio returns during the estimation period (Brown and Warner, 1985). The sample period is from January 1998 to December 2006. Panel A: All Death Spiral Issuers
Benchmark model All issues included Only first issues included
Market adjusted model
average CAR -8.47% -6.31%
t-stat (cross-section) -3.215 -1.912
t-stat (portfolio) -2.893 -1.751
N 187 124
Market model
average CAR -13.29% -11.55%
t-stat (cross-section) -4.037 -2.792
t-stat (portfolio) -4.514 -3.225
N 184 121
- 36 -
Table 2 – Continued
Panel B: High Corporate Governance vs. Low Corporate Governance Issuers
All issues included Only first issues included
High CG Low CG
Difference High CG Low CG
Difference
[p-value] [p-value]
I. Non-chaebol vs. Chaebol
average CAR -6.58% -21.32% 14.74% -2.79% -24.65% 21.87%
Table 3 Cross-sectional Regression of CARs on Corporate Governance Variables This table presents the results from OLS regressions where the dependent variable is market-adjusted CARs surrounding the announcement of death spiral issues from day -10 to day +60. The key explanatory variables are three corporate governance dummies. Chaebol dummy equals one if the issuer is a member of large business group designated by the Korea Fair Trade Commission (KTFC), or zero otherwise. Foreign ownership dummy equals one if equity ownership by foreigner investors is larger than the median of the regression sample, or zero otherwise. KCGI dummy equals one if KCGI (Korea Corporate Governance Index) is larger than the median of the regression sample. As control variables, we include leverage (ratio of debt to assets), return volatility (standard deviation of daily stock returns during the past 12 months before the announcement date), age (number of years since IPO), Tobin’s q (ratio of the sum of market value of common equity and the book value of debt to the book value of assets), interest coverage (EBIT over interest expenses), and ROA (net income over assets). All specifications include industry and year fixed effects. The first three columns report the results for all issues while the remaining columns present the results for each firm’s first issue only. p-values are reported in the brackets. *, **, and *** indicate statistical significance at 10%, 5%, and 1%, respectively. The sample period is from January 1998 to December 2006.
Table 4 Operating Performance of the Death Spiral Issuers This table presents the median values of various measures of operating performance for death spiral issuers from one fiscal year before the issue up to 3 fiscal years following the issue. Year 0 corresponds to the fiscal year-end immediately following the issue. EBITDA is the sum of operating income and depreciation. Profit margin is net income divided by sales. ROA is net income divided by assets. CF (cash flow) is operating income adjusted for non-operating income and expenses. INV is capital expenditures plus R&D. ADV is expenditures for advertisement. Market/Book is the ratio of the market value of equity to the book value of equity, where firms with negative book equity are excluded. Tobin’s q is the ratio of the sum of market value of common equity and the book value of debt to the book value of assets. In panel A, we report results for all death spiral issuers. In panels B and C, we report operating performance for chaebol and non-chaebol death spiral issuers, respectively. All test statistics used in this analysis are estimated from Wilcoxon signed-rank test. In panel D, we test the difference in median values between chaebol and non-chaebol death spiral issuers. *, **, and *** indicate statistical significance at 10%, 5%, and 1%, respectively. The null value for Market/Book and Tobin’s q,is one rather than zero. The sample period is from January 1998 to December 2006.
Table 5 Operating Performance Prior to Death Spiral Issue: No Subsequent Changes in Control vs. Changes in Control This table presents the median values of various measures of operating performance for death spiral issuers as well as non-death spiral issuers as of one fiscal year before the issue. The first row presents the results for those death spiral issuers with no changes in controlling shareholder until the expiration date or 3 years after the issue if the expiration date is not specified (group A). The second row presents the corresponding numbers for those death spiral issuers that experienced a changes in controlling shareholder before the expiration date or within 4 years after the issue if the expiration date is not specified (group B). The third row presents the corresponding numbers for non-death spiral issuers (group C). The fourth and fifth row reports the z-stats for testing the differences between groups A and B, and groups A and C, respectively based on Wilcoxon two sample median test. EBITDA is the sum of operating income and depreciation. Profit margin is net income divided by sales. ROA is net income divided by assets. CF (cash flow) ratio is operating income adjusted for non-operating income and expenses. INV is capital expenditures plus R&D. ADV is expenditures for advertisement. Market/Book is the ratio of the market value of equity to the book value of equity, where firms with negative book equity are excluded. Tobin’s q is the ratio of the sum of market value of common equity and the book value of debt to the book value of assets. The sample period is from January 1998 to December 2006.
Table 6 Determinants of Death Spiral Issue Conditional on Issuing a Hybrid Security: Multivariate Analysis This table presents the results from logit estimation where the dependent variable equals one if the issue is a death spiral (a total of 151 firm-years) and zero if it is a conventional non-death spiral hybrid security (a total of 309 firm-years). Explanatory variables are as defined in tables 3 and 4. Due to data availability, mostly of corporate governance variables, we use a total of 133 death spiral issues and a total of 220 conventional non-death spiral issues in the actual estimation. In panel A, we regress on operating performance, chaebol dummy, foreign ownership dummy and the interaction between the last two. In panel B, we replace foreign ownership dummy with governance index (KCGI) dummy. p-values are reported in brackets. All specifications include industry and year fixed effects. *, **, and *** indicate statistical significance at 10%, 5%, and 1%, respectively. The sample period is from January 1998 to December 2006. Panel A: Operating Performance, Chaebol-affiliation, and Foreign Ownership
Table 7 Average Changes in Proportional Ownership Following a Death Spiral Issue This table presents the averages of proportional ownership (in percentages) held by various types of shareholders within the controlling party before and after the death spiral issue. The analysis is restricted to those firms where the controlling shareholder remained intact since the death spiral issue up until the expiration date or 4 years (****앞에서는 3 년이라고 되어 있는데, 3 년인지 4 년인지 명확히 확인 바람****after the issue if the expiration date is not specified. Hence, firms that are merged or acquired subsequent to the issue are excluded from this analysis. Control rights refer to the sum of proportional ownership held by the controlling shareholder, other family members, affiliated firms and non-family executives. Panel A presents the comparison between year -1 and year +1 while Panel B compares year -1 and year +3. Panel C compares year -1 with the year of expiration date. p-values are based on pair-wise comparison. *, **, and *** indicate statistical significance at 10%, 5%, and 1%, respectively. The sample period is from January 1998 to December 2006.
Average Increases in the Number of Shares Held by the Controlling Party Following a Death Spiral Issue This table presents the averages of increases in the number of shares held by the controlling party (in percentages) subsequent to a death spiral issue. The analysis is restricted to those firms where the controlling shareholder remained intact since the death spiral issue up until the expiration date or 4 years after the issue if the expiration date is not specified. In panel A, we report the increases in the number of shares for the controlling party as a whole, and in panel B we report the numbers separately for each shareholder type within the controlling party. In the first two columns of panel A, we include the increases in number of shares held due to mechanical changes in the total number of shares outstanding, such as stock splits, reverse splits, and stock dividends. In the last two columns of panel A and in panel B, we exclude such mechanical changes so that changes in holdings reflect only the following; subscription to rights offering, conversion or exercise of hybrid securities (CBs and BWs), or purchase of stocks from other shareholders. p-values are based on pair-wise comparison. *, **, and *** indicate statistical significance at 10%, 5%, and 1%, respectively. The sample period is from January 1998 to December 2006. Panel A: Controlling Party as a Whole
Include all changes in Exclude mechanical changes
number of common shares in number of outstanding shares
Mean (%) Median (%) Mean (%) Median (%) N
From year -1 to +1 +48.69 +9.69 +51.21 +11.30
109 [0.002]*** [0.000]*** [0.001]*** [0.000]***
From year -1 to +3 +166.19 +53.30 +182.36 +53.30
48 [0.002]*** [0.000]*** [0.001]*** [0.000]***
From year -1 to expiration date
+219.4 +48.51 +248.19 +57.41 38
[0.006]*** [0.008]*** [0.003]*** [0.000]***
Panel B: Sub-groups Within the Controlling Party
Controlling Shareholder
Other Family Members
Affiliated firms Non-Family Executives
Mean (%) N Mean (%) N Mean (%) N Mean (%) N
From year -1 to +1 +34.05
108 +56.05
106 +63.72
105 +22.21
98[0.052]* [0.055]* [0.000]*** [0.182]
From year -1 to +3 +109.45
48 +441.54
47 +185.41
45 +33.31
46[0.038]** [0.061]* [0.030]** [0.349]
From year -1 to expiration date
+137.23 38
+1000 37
+219.25 35
+40.40 37
[0.043]** [0.167] [0.039]** [0.274]
- 45 -
Table 9
Holdings of Hybrid Securities by the Controlling Party Following a Death Spiral Issue This table presents the number of firms (and relative proportions in percentages) where any member of the controlling party holds hybrid securities issued by that specific firm following a death spiral issue. The analysis is restricted to those firms where the controlling shareholder remained intact since the death spiral issue up until the expiration date or 4 years after the issue if the expiration date is not specified. Hybrid securities include convertible bonds, bonds with warrants, and warrants separated from the original bonds with warrants. In panel A, we include all firms that issued any type of hybrid security regardless of whether it has floating-priced death spiral feature or not. In panel B, we only include exclusive death spiral issuers, i.e. firms that issued only death spirals and did not issue any non-death spirals. In each panel, we report the results for three different time horizons. The sample period is from January 1998 to December 2006. Panel A: All Hybrid Security Issuers
Held by Controlling Party
Not Held by Controlling Party
Total
N % N % N From year 0 to +1 34 29.8 80 70.2 114 From year 0 to +3 24 48.0 26 52.0 50 From year 0 to expiration date 23 57.5 17 42.5 40
Panel B: Exclusive Death Spiral Issuers
Held by Controlling Party
Not Held by Controlling Party
Total
N % N % N From year 0 to +1 15 26.3 42 73.7 57 From year 0 to +3 10 41.7 14 58.3 24 From year 0 to expiration date 9 47.7 10 52.6 19
- 46 -
Figure 1
Cumulative Abnormal Returns (CARs) following Death Spiral Issue Announcement
The figures present the averages of the cumulative abnormal returns (CARs) of the death spiral issuers surrounding the original disclosure announcement from day -10 through day +60. Panel A reports CARs based on market-adjusted model and panel B reports those based on market model where market return are value-weighted index returns compiled by the Korea Capital Market Institute (KCMI). Market model parameter estimates are obtained using past 200 trading days from day -220 to -21 of the issue announcement. In both panels, the thin line represents CARs of all death spiral issuers, while the dashed line and the bold line presents those of non-chaebols and chaebols, respectively. We consider all death spiral issues including the first as well as follow-on issues. The sample period is from January 1998 to December 2006. Panel A: Market-Adjusted Model