21
2014 Data Team Debbie Austin Amy Evans Jennifer Shockley Jeff Skinner Karla Skinner Diane Westcott
| Date post: | 29-Dec-2015 |
| Category: |
Documents |
| Upload: | adele-cross |
| View: | 216 times |
| Download: | 0 times |

2014 Data Team Debbie AustinAmy Evans Jennifer Shockley
Jeff Skinner Karla SkinnerDiane Westcott

School Demographics2014 2013 2012 2011
Enrollment
732 787 674 650
ESE 66 81 76 90
GSP 106 89 74 85
F/R N/A 170 148 146

Math 2 Advance Final Exam (Austin)Percentage Correct
Question No. Cumulative Lewis Cahall Rusin Bright3 41 47 35 42 274 57 71 53 51 368 58 67 51 54 82
10 46 50 52 43 011 53 57 59 47 2719 56 62 63 49 2727 37 66 40 13 028 36 53 44 18 943 49 58 36 56 3648 57 62 56 60 949 55 68 47 55 27
264 studentsOverall 75% Average
Lewis Cahall Rusin BrightAverage 79 75 75 49
• Items highlighted in yellow reflect under 60%• Items highlighted in light blue reflect under 70%

Pre-Algebra Final Exam (Austin)
Faust Bright MurphyAverage 82 62 62
133 studentsOverall 74% Average
• Items highlighted in yellow reflect under 60%• Items highlighted in light blue reflect under 70%
Percentage CorrectQuestion No. Standard Cumulative Faust Bright Murphy
6 MA.8.A.6.2 62 46 47 8720 MA.8.G.2.3 61 76 56 5535 MA.8.G.2.4 55 73 53 4336 MA.8.A.1.2* 38 54 30 3237 MA.8.A.1.2* 20 5 26 2538 MA.8.A.1.2* 57 78 60 4039 MA.8.A.1.2* 45 73 42 2840 MA.8.A.1.2* 47 73 42 3242 MA.8.A.1.3 58 54 30 8343 MA.8.A.1.3 58 43 26 9455 MA.912.G.7.5 21 35 19 1356 MA.912.G.7.5 54 49 42 68
*MA.8.1.3 Graph linear equations using the slope and y-intercept.

Algebra 1 EOC (Austin)
Level
Functions, Linear
Equations, and Inequalities
Points Earned (out of 31)
PolynomialsPoints Earned
(out of 10)
Rationals, Radicals, Quadratics, and
Discrete Mathematics
Points Earned (out of 13)
5 (73) 26 pts85%
9 pts86%
11 pts86%
4 (60) 21 pts 68%
6 pts62%
9 pts67%
3 (93) 15 pts48%
3 pts34%
7 pts51%
2 (15) 8 pts26%
2 pts15%
5 pts38%
Average4
20 pts63%
6 pts56%
8 pts65%
* 241 students tested (260 students in 2013)
Level 5 30%Level 4 25%Level 3 39%Level 2 6%
Overall

Algebra 1 EOC (Austin) 2013/2014 Comparison (Austin)
Level 2013 Functio
ns
2014Functio
ns
Variance
Functions
2013Polynomials
2014 Polynomials
Variance
Polynomials
2013Ration
als
2014 Ration
als
Variance
Rationals
5 84% 85% 1% 80% 86% 6 85% 86% 1%4 65% 68% 3% 60% 62% 2% 69% 67% -2%3 48% 48% - 40% 34% -6% 46% 51% 6%2 26% 26% - 30% 15% -15% 23% 38% 15%1 13% 0% -13% 30% 0% -30% 15% 0% -15%
Overall
55% 63% 8% 50% 56% 6% 54% 65% 9%
* 241 students tests (19 less from 2013) * 15 Students did not pass (20 students in 2013) * No Level 1’s
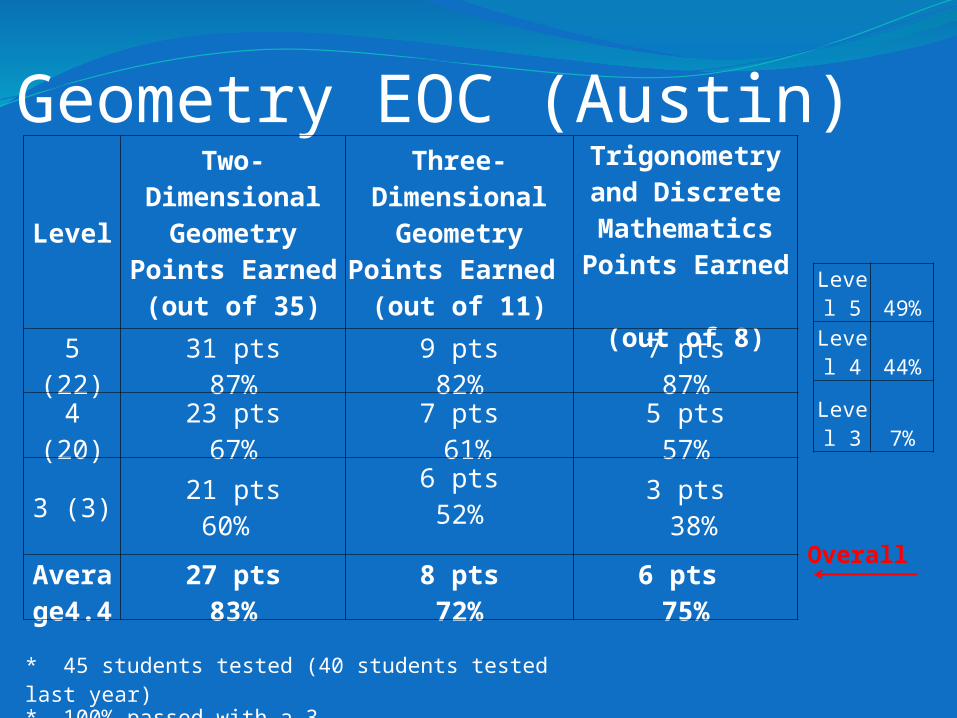
Geometry EOC (Austin)
Level 5 49%
Level 4 44%
Level 3 7%
Overall
LevelTwo-Dimensional
GeometryPoints Earned
(out of 35)
Three-Dimensional Geometry
Points Earned (out of 11)
Trigonometry and Discrete
MathematicsPoints Earned
(out of 8)
5 (22) 31 pts87%
9 pts82%
7 pts87%
4 (20) 23 pts67%
7 pts 61%
5 pts57%
3 (3) 21 pts60%
6 pts52% 3 pts
38%
Average4.4
27 pts83%
8 pts72%
6 pts 75%
* 45 students tested (40 students tested last year)
* 100% passed with a 3 or higher
* .2 average increase from 2013 Geometry FCAT

Geometry EOC 2013/2014 Comparison (Austin)
Level 2013 2-D
Geometry Max: 35
pts
20142-D
Geometry Max: 35
pts
Variance
2-D
20133-D
Geometry Max: 11 pts
2014 3-D
Geometry Max: 11 pts
Variance
3-D
2013Trig &
Discrete Math Max: 8 points
2014 Trig &
Discrete Math Max: 8 points
Variance
Trig &
5 31 pt 31 pts - 9 pts 9 pts - 7 pts 7 pts -
89% 87% -2% 82% 82% - 88% 87% -1%
4 20 pts 23pts 3 pts 7 pts 7 pts - 4 pts 5 pts 1 pt
57% 67% 10% 64% 61% -3% 50% 57% 7%
3 17 pts 21pts 4 pts 6 pts 6 pts - 3 pts 3 pts -
48% 60% 12% 54% 52% -2% 37% 38% 1%
Average 4.2
Average 4.4
25 pts 27 pts 2 pts 8 pts 8 pts - 5 pts 6 pts 1 pt
83% 77% -6% 72% 72% - 62% 75% 13%
* 45 students tested (40 students tested last year)

7th GradersFCAT Math (J. Skinner)

8th GradersFCAT Math (J. Skinner)
Civics EOC (J. Skinner)

US History Semester 1 Exam (J. Skinner)

US History Semester 2 Exam (J. Skinner)

Rising 7th GradersFCAT Reading (K. Skinner)

Rising 8th GradersFCAT Reading (K. Skinner)

Rising 9th GradersFCAT Reading (K. Skinner)

FCAT Writes (Shockley)

FCAT Writes (Shockley)

Science 8th Grade FCAT (Westcott)

Science 7th Grade Semester 2 Exam (Westcott)

Science 8th Grade Semester 2 Exam (Westcott)


![Sepher Yetzirah [Westcott]](https://static.documents.pub/doc/80x56/577cdec11a28ab9e78afc207/sepher-yetzirah-westcott.jpg)
