64
Debt Futures and Interest Rate Swaps
| Date post: | 15-Dec-2015 |
| Category: |
Documents |
| Upload: | ryan-bagnall |
| View: | 221 times |
| Download: | 0 times |

Debt Futures and Interest Rate Swaps
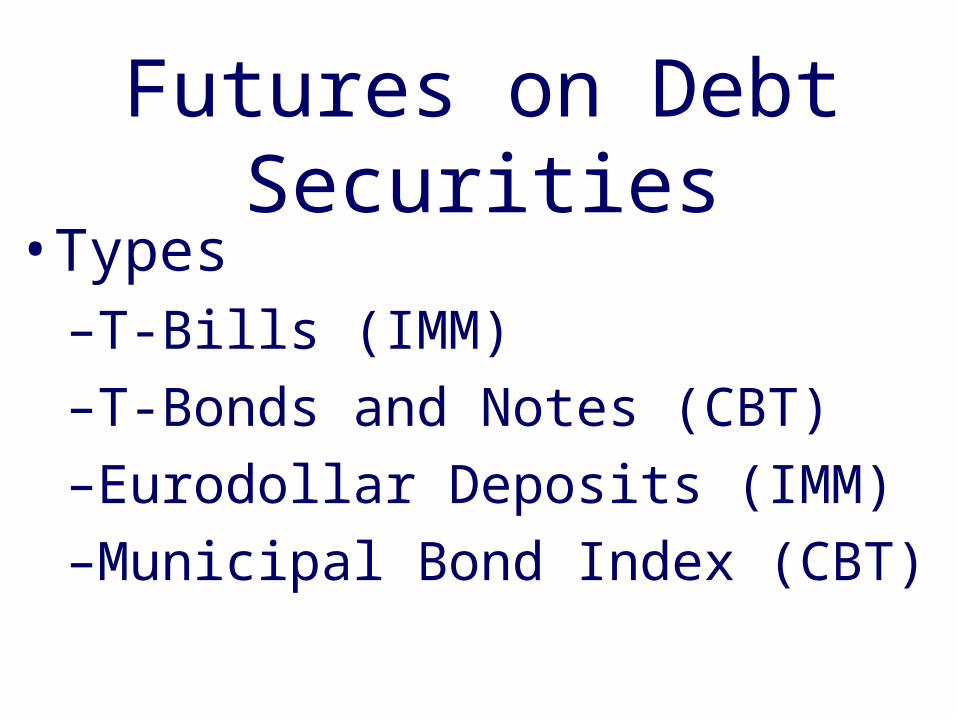
Futures on Debt Securities• Types
–T-Bills (IMM)
–T-Bonds and Notes (CBT)
–Eurodollar Deposits (IMM)
–Municipal Bond Index (CBT)

T-Bill Futures
• T-Bill futures call for the delivery or purchase of a T-bill with a maturity of 91 days and a face value of $1M. Used for speculating on S-T rates and hedging.
• Prices on T-Bill futures are quoted in terms of the IMM index or discount yield (RD):
• Formula to Convert:
Index RD 100
fR
MD0
100 25
100
(. )($1 )

Eurodollar Futures
Eurodollar Futures are similar to T-Bill futures. They call for delivery or purchase of Eurodollar deposits with a maturity of 90 days and F = $1M. They are quoted in terms of the IMM index. They differ from T-Bill futures in that there is a cash settlement feature. The cash settlement is based on the LIBOR. Used for speculating on ST rates and for hedging bank positions ( correlated with CD rates).
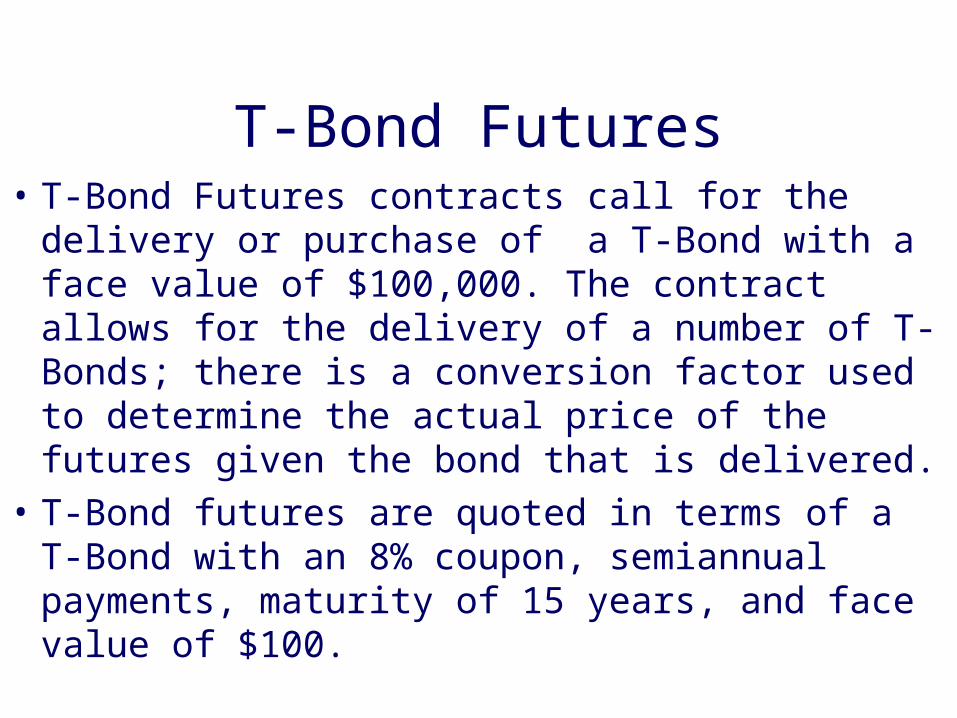
T-Bond Futures• T-Bond Futures contracts call for the delivery or
purchase of a T-Bond with a face value of $100,000. The contract allows for the delivery of a number of T-Bonds; there is a conversion factor used to determine the actual price of the futures given the bond that is delivered.
• T-Bond futures are quoted in terms of a T-Bond with an 8% coupon, semiannual payments, maturity of 15 years, and face value of $100.
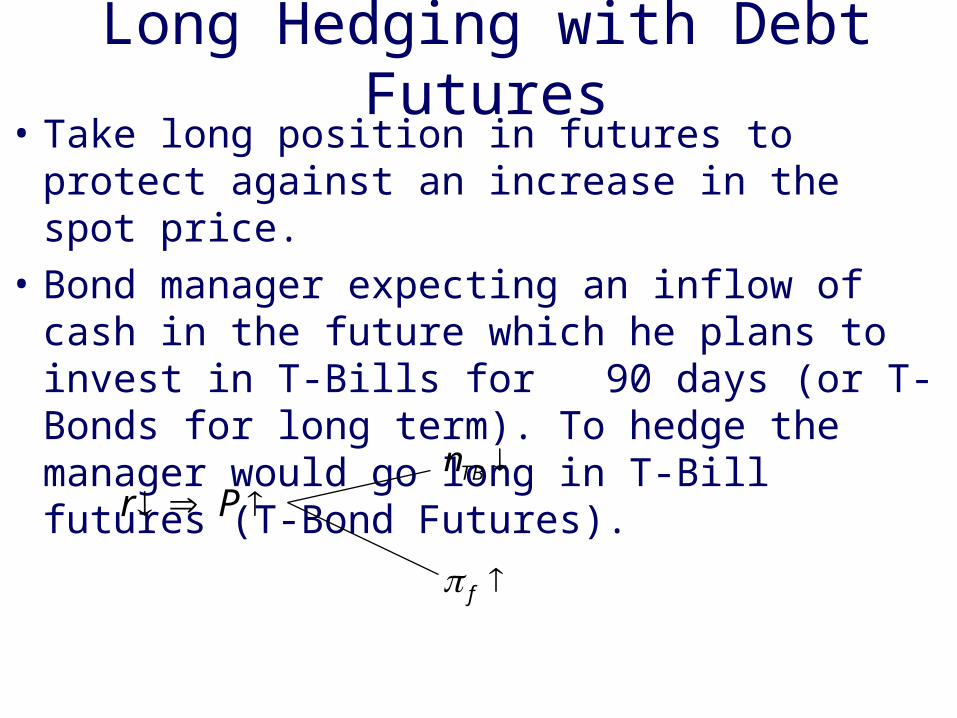
Long Hedging with Debt Futures• Take long position in futures to protect against an
increase in the spot price.
• Bond manager expecting an inflow of cash in the future which he plans to invest in T-Bills for 90 days (or T-Bonds for long term). To hedge the manager would go long in T-Bill futures (T-Bond Futures).
r P nTB
f

Long Futures Hedge
• EXAMPLE: A money market manager is expecting a cash flow of $9,750,000 in September which he plans to invest in ten 91-day T-bills each with a face value of $1M. Fearing that short-term rates could decrease (causing T-Bill prices to increase), suppose the manager goes long in ten September T-Bill futures trading at RD = 10% or f0 = $975,000.
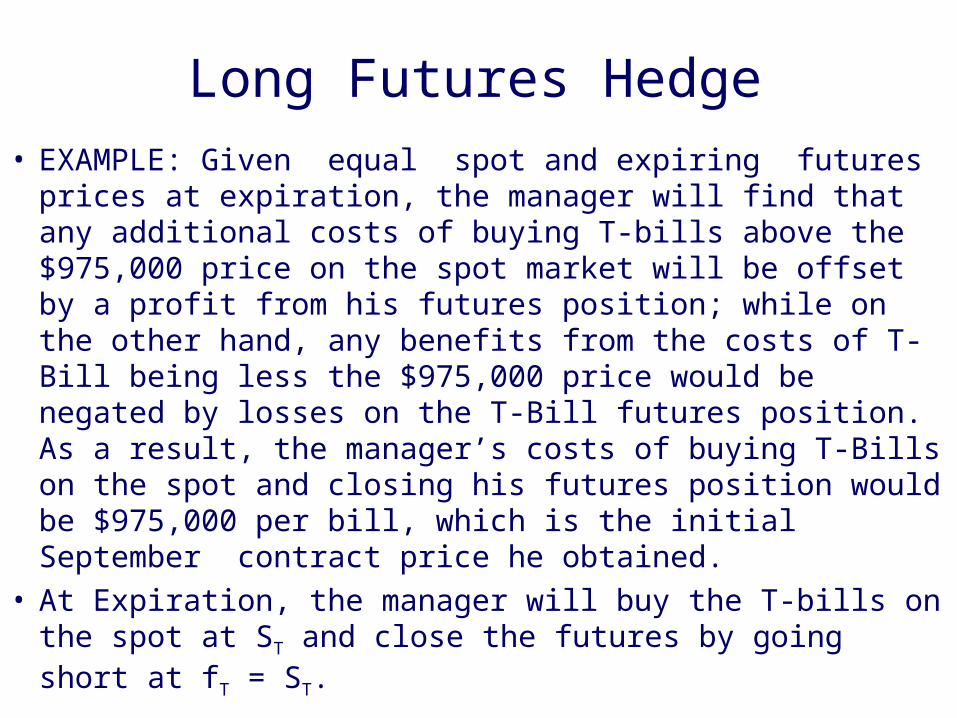
Long Futures Hedge
• EXAMPLE: Given equal spot and expiring futures prices at expiration, the manager will find that any additional costs of buying T-bills above the $975,000 price on the spot market will be offset by a profit from his futures position; while on the other hand, any benefits from the costs of T-Bill being less the $975,000 price would be negated by losses on the T-Bill futures position. As a result, the manager’s costs of buying T-Bills on the spot and closing his futures position would be $975,000 per bill, which is the initial September contract price he obtained.
• At Expiration, the manager will buy the T-bills on the spot at ST and close the futures by going short at fT = ST.

Long Futures HedgeLong Hedge Example
Initial Position: Long in 10 September T-Bill futurescontracts at RD = 10 (IMM = 90, f0 = $975,000) tohedge $9,750,000 investment in T-Bill purchases inSeptember.
At Delivery: Close T-Bill futures contract atfT = ST and purchase 10 T-Bills on the spot market atST.
Positions T-Bill Costs
June Spot RD
June T-Bill Spot Price
Cost of 10 T-Bills- Profit on Futures Net Costs
11%$972,500
$9,725,000($25,000)
$9,750,000
10%$975,000
$9,750,0000.00
$9,750,000
9%$977,500
$9,775,000$25,000
$9,750,000
Profit on Futures = 10 (Spot Price - $975,000)
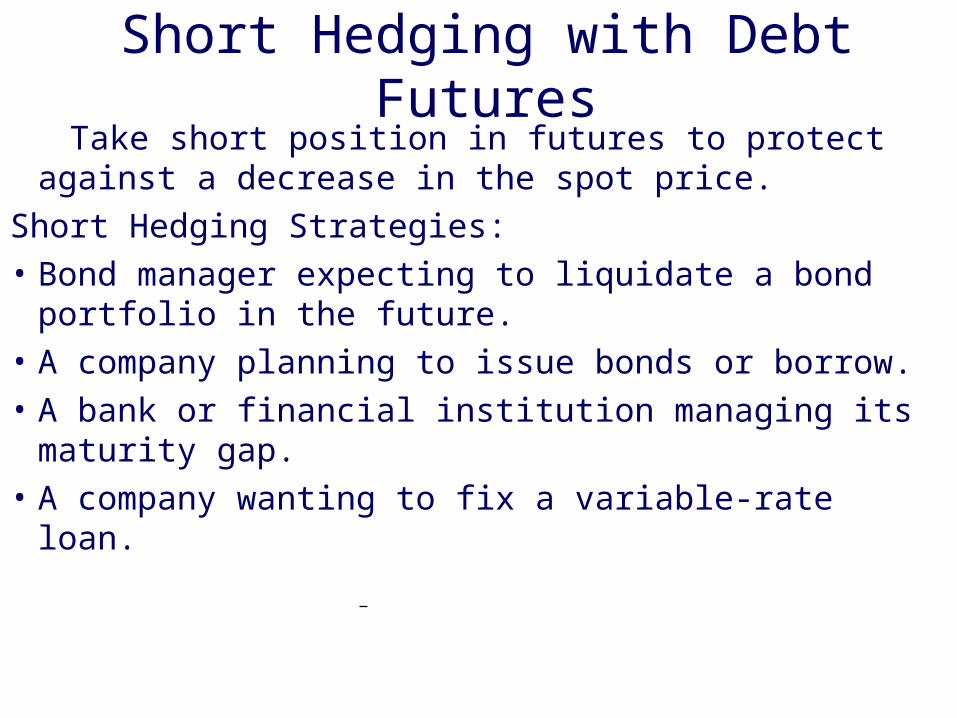
Short Hedging with Debt Futures Take short position in futures to protect against a
decrease in the spot price.
Short Hedging Strategies:
• Bond manager expecting to liquidate a bond portfolio in the future.
• A company planning to issue bonds or borrow.
• A bank or financial institution managing its maturity gap.
• A company wanting to fix a variable-rate loan.

Short Futures Hedge: Example• A market manager who in July anticipates needing cash in
September that she plans to obtain by selling 10 T-Bills (each with a face value of $1M) she currently holds. Suppose at the time of the anticipated September sale, the T-Bill will have a maturity of 91 days and that currently there is a September T-Bill futures trading at a discount yield of RD = 10% or f0 = $975,000. If the manager wants to lock in a September selling price on her T-Bills of $9,750,000 she could go short in 10 September T-Bill futures contract. At the September expiration, she would receive $9,750,000 in revenue at the delivery from selling her T-Bills on the spot market and closing the futures contract by going long in the expiring September contract trading at the spot price.
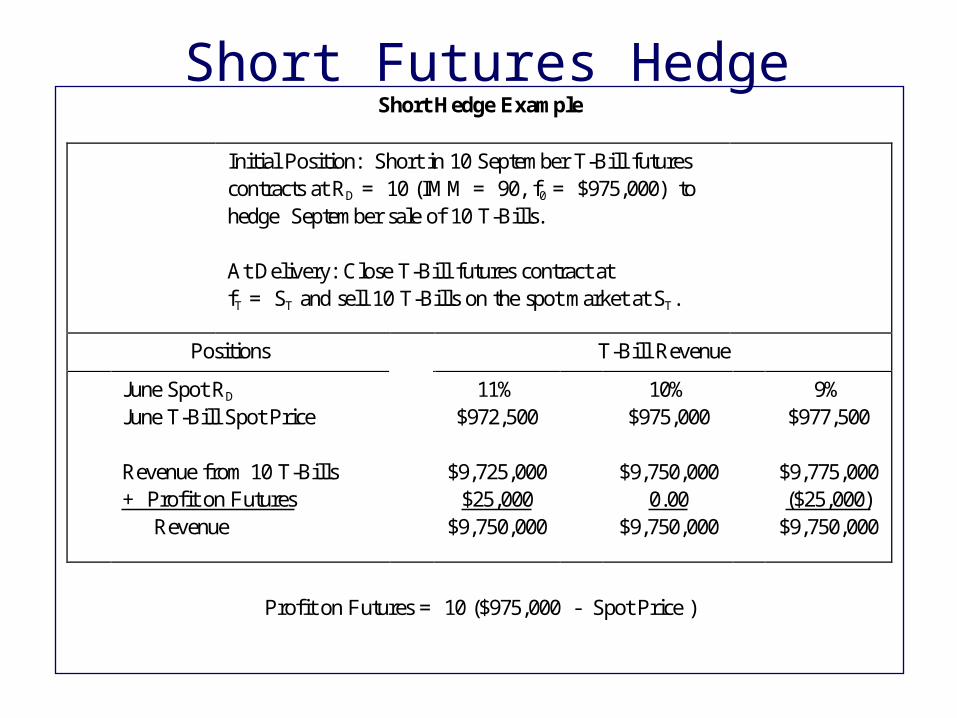
Short Futures HedgeShort Hedge Example
Initial Position: Short in 10 September T-Bill futurescontracts at RD = 10 (IMM = 90, f0 = $975,000) tohedge September sale of 10 T-Bills.
At Delivery: Close T-Bill futures contract atfT = ST and sell 10 T-Bills on the spot market at ST.
Positions T-Bill Revenue
June Spot RD
June T-Bill Spot Price
Revenue from 10 T-Bills+ Profit on Futures Revenue
11%$972,500
$9,725,000$25,000
$9,750,000
10%$975,000
$9,750,0000.00
$9,750,000
9%$977,500
$9,775,000($25,000)
$9,750,000
Profit on Futures = 10 ($975,000 - Spot Price )

Cross Hedging• Cross Hedging is hedging a position with a futures
contract in which the asset underlying the futures is different than the asset to be hedged.
• Example: Future CP sale hedged with T-Bill futures; AA Bond portfolio hedged with T-Bond futures.
• For bond positions, the following formula can be used:
nDur
Dur
S
f
YTM
YTMfS
f
f
S
0
0
1
1

Speculation
Outright Positions• Long: Expect rates to decrease. ST Rates: use T-Bills or Eurodollar
futures; LT: use T-Bonds or Notes.
• Short: Expect rates to increase. ST: use T-Bills or Eurodollars; LT: use T-Bonds or Notes.
Spread:• Intracommodity Spread: long and short in futures on the same
underlying asset but with different expirations.
• Intercommodity Spread: Long and short in futures with different underlying assets but the same expiration.
• Expect Recession: Short MBI, Long T-Bond or Short Eurodollar, long T-Bill.
• Expect Upward Twist of YC: Short T-Bond, Long T-Bill.

Intracommodity Spread• More distant futures contracts (T2) are more
price-sensitive to changes in the spot price than near-term futures (T1):
%
%
%
%
f
S
f
ST T2 1
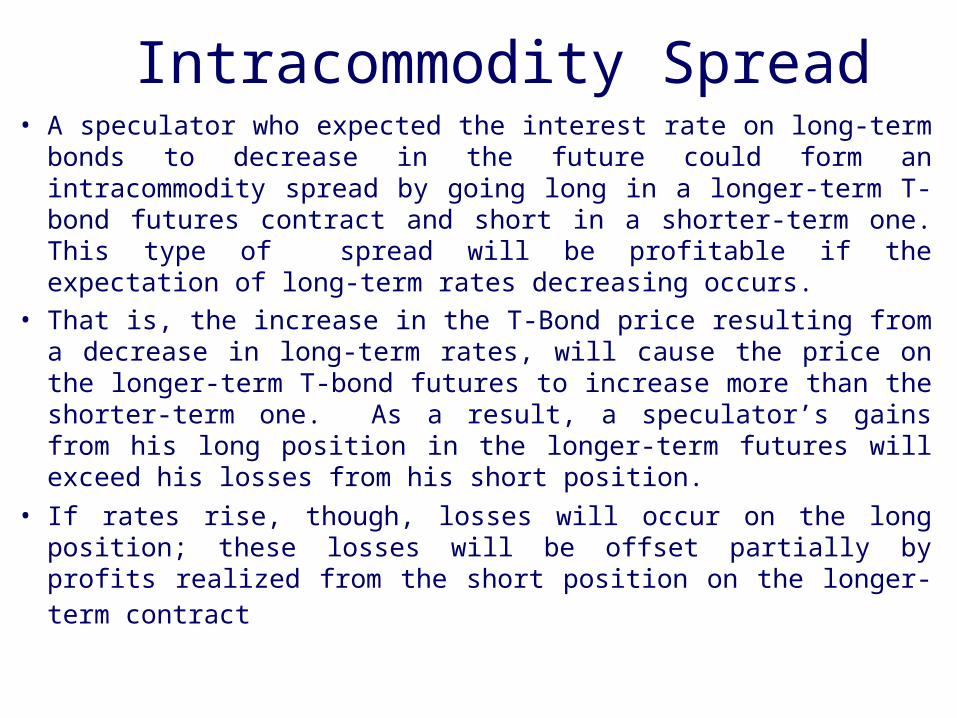
Intracommodity Spread• A speculator who expected the interest rate on long-term bonds to
decrease in the future could form an intracommodity spread by going long in a longer-term T-bond futures contract and short in a shorter-term one. This type of spread will be profitable if the expectation of long-term rates decreasing occurs.
• That is, the increase in the T-Bond price resulting from a decrease in long-term rates, will cause the price on the longer-term T-bond futures to increase more than the shorter-term one. As a result, a speculator’s gains from his long position in the longer-term futures will exceed his losses from his short position.
• If rates rise, though, losses will occur on the long position; these losses will be offset partially by profits realized from the short position on the longer-term contract
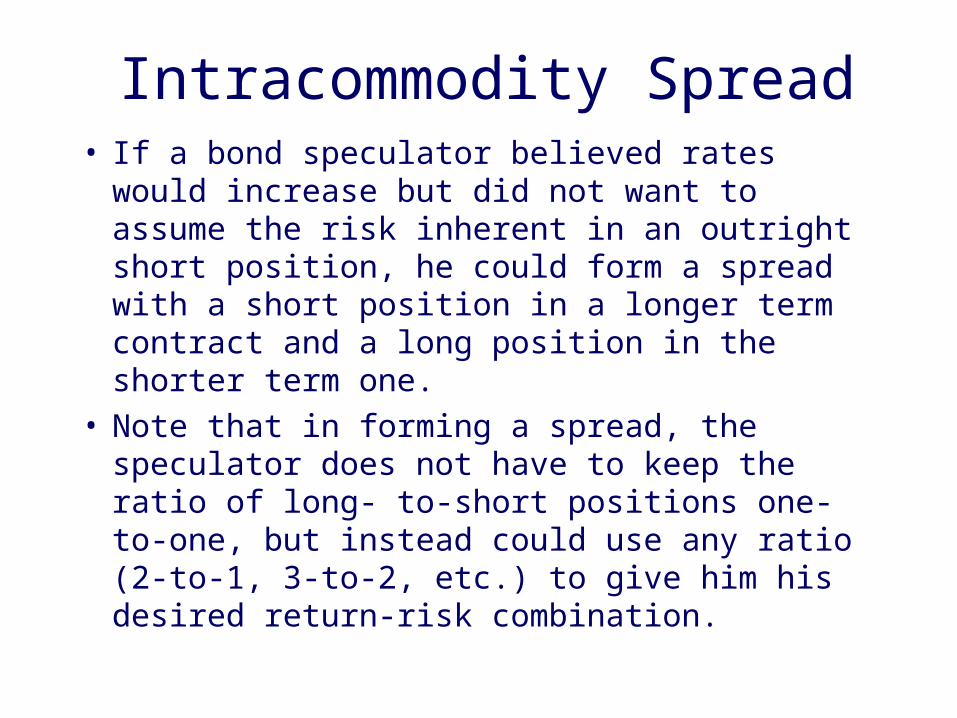
Intracommodity Spread• If a bond speculator believed rates would increase
but did not want to assume the risk inherent in an outright short position, he could form a spread with a short position in a longer term contract and a long position in the shorter term one.
• Note that in forming a spread, the speculator does not have to keep the ratio of long- to-short positions one-to-one, but instead could use any ratio (2-to-1, 3-to-2, etc.) to give him his desired return-risk combination.

Intercommodity Spread (1)• Consider the case of a spreader who is forecasting
a general decline in interest rates across all maturities (i.e., a downward parallel shift in the yield curve). Since bonds with greater maturities are more price sensitive to interest rate changes than those with shorter maturities, a speculator could set up a rate-anticipation swap by going long in the longer-term bond with the position partially hedged by going short in the shorter-term one.
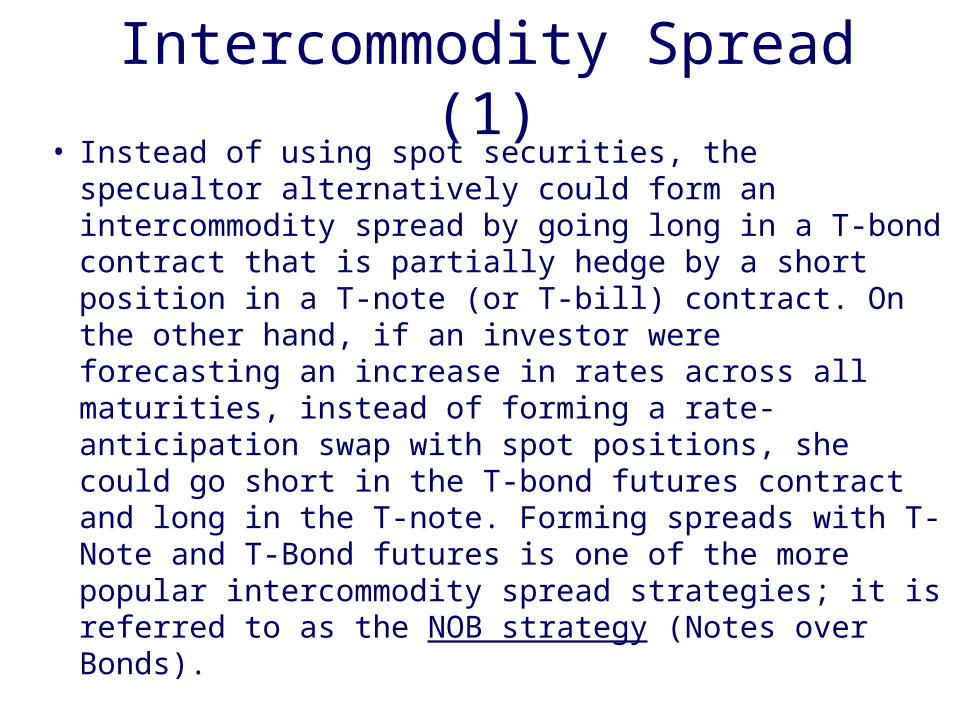
Intercommodity Spread (1)• Instead of using spot securities, the specualtor
alternatively could form an intercommodity spread by going long in a T-bond contract that is partially hedge by a short position in a T-note (or T-bill) contract. On the other hand, if an investor were forecasting an increase in rates across all maturities, instead of forming a rate-anticipation swap with spot positions, she could go short in the T-bond futures contract and long in the T-note. Forming spreads with T-Note and T-Bond futures is one of the more popular intercommodity spread strategies; it is referred to as the NOB strategy (Notes over Bonds).
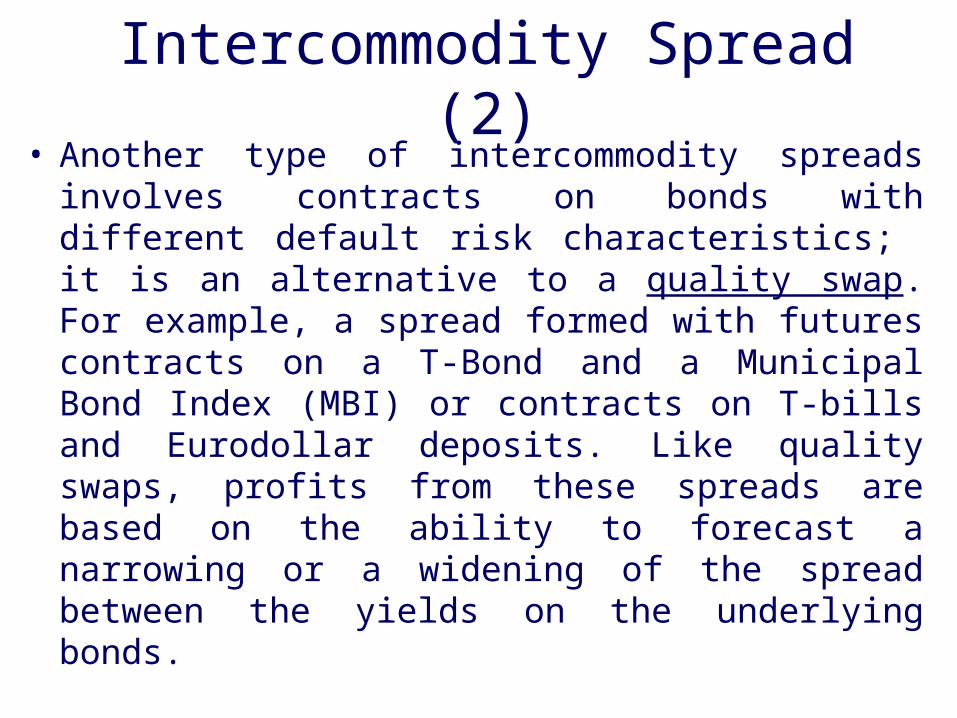
Intercommodity Spread (2)• Another type of intercommodity spreads involves
contracts on bonds with different default risk characteristics; it is an alternative to a quality swap. For example, a spread formed with futures contracts on a T-Bond and a Municipal Bond Index (MBI) or contracts on T-bills and Eurodollar deposits. Like quality swaps, profits from these spreads are based on the ability to forecast a narrowing or a widening of the spread between the yields on the underlying bonds.

Intercommodity Spread (2)• For example, in an economic recession the demand for
lower default-risk bonds often increases relative to the demand for higher default-risk bonds. If this occurs, then the spot yield spread for lower grade bonds over higher grade would tend to widen. A speculator forecasting an economic recession could, in turn, profit from an anticipated widening in the risk premium by forming an intercommodity spread consisting of a long position in a T-bond futures contract (no default risk) and short position in a MBI contract (some degree of default risk).
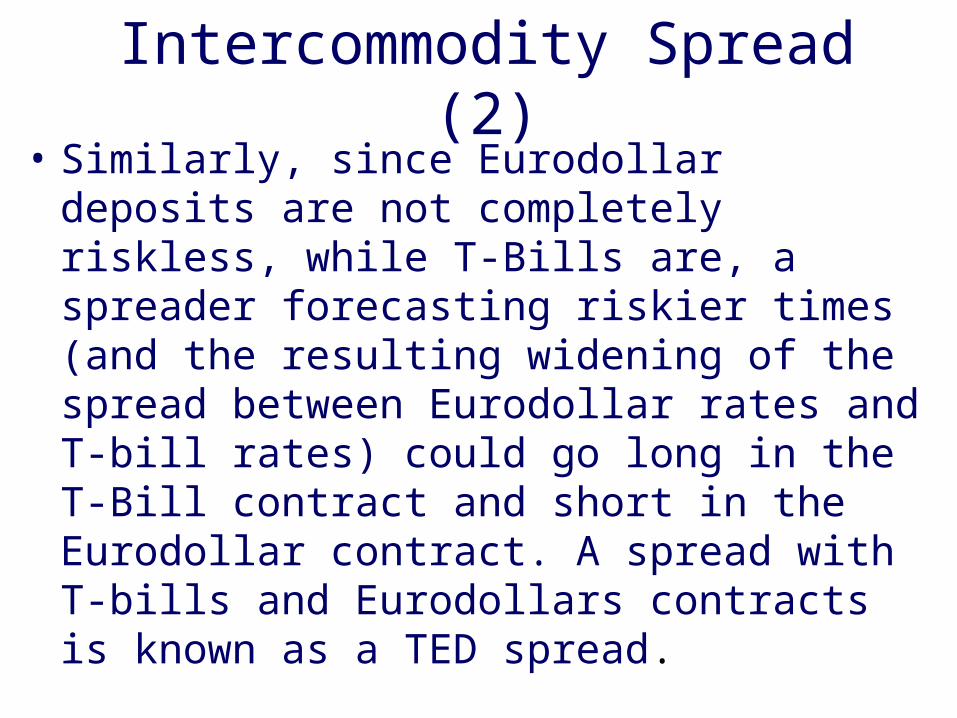
Intercommodity Spread (2)• Similarly, since Eurodollar deposits are not
completely riskless, while T-Bills are, a spreader forecasting riskier times (and the resulting widening of the spread between Eurodollar rates and T-bill rates) could go long in the T-Bill contract and short in the Eurodollar contract. A spread with T-bills and Eurodollars contracts is known as a TED spread.
Futures Pricing
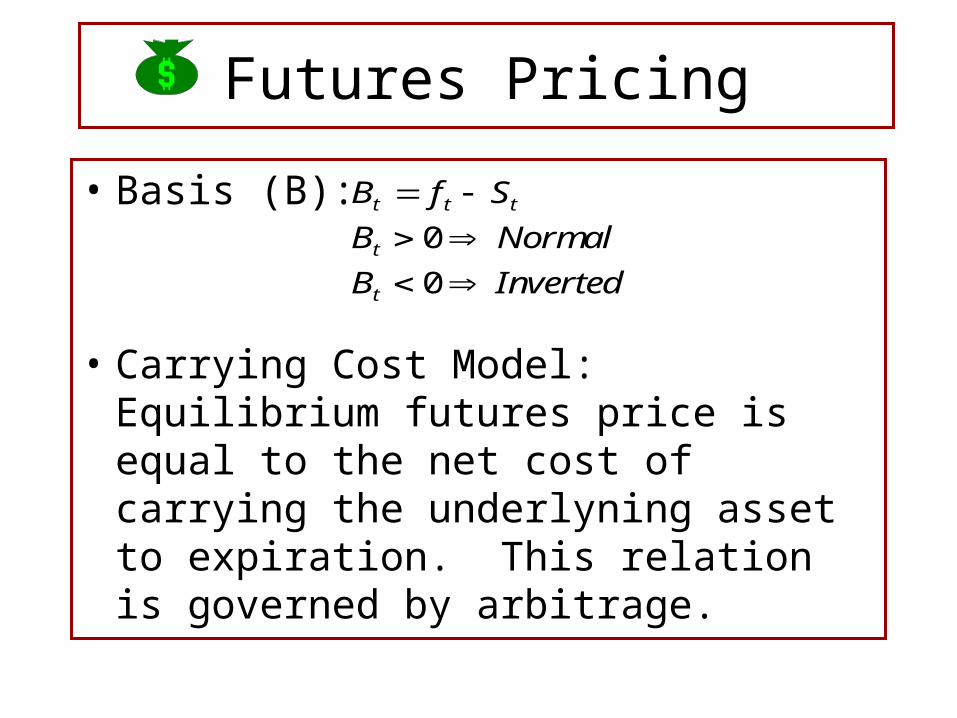
• Basis (B):
• Carrying Cost Model: Equilibrium futures price is equal to the net cost of carrying the underlyning asset to expiration. This relation is governed by arbitrage.
B f S
B Normal
B Inverted
t t t
t
t
0
0

Pricing T-Bill Futures
• Carrying Cost Model:f S R
where
f price on T Bill futures
T time to iration on futures
S price on spot T Bill with
maturity of M T
R RF rate or repo rate
Mf
T
oM
s
f
s
s
0 0
0
1
91
( )
:
.
exp .
.
.
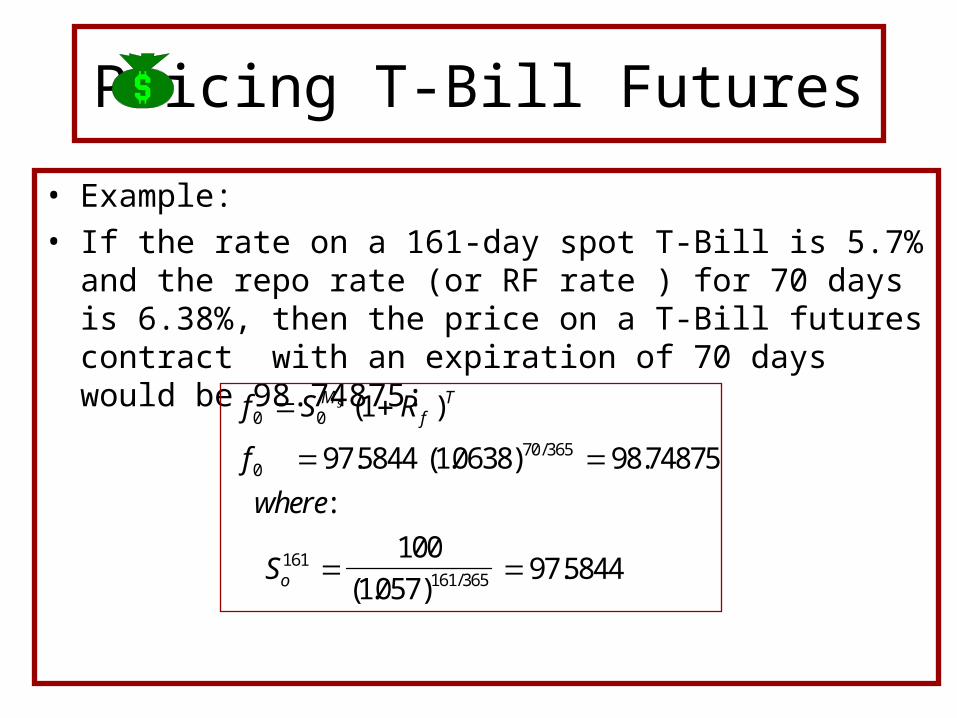
Pricing T-Bill Futures
• Example:
• If the rate on a 161-day spot T-Bill is 5.7% and the repo rate (or RF rate ) for 70 days is 6.38%, then the price on a T-Bill futures contract with an expiration of 70 days would be 98.74875:
f S R
f
where
S
Mf
T
o
s0 0
070 365
161161 365
1
97 5844 10638 98 74875
100
105797 5844
( )
. ( . ) .
:
( . ).
/
/
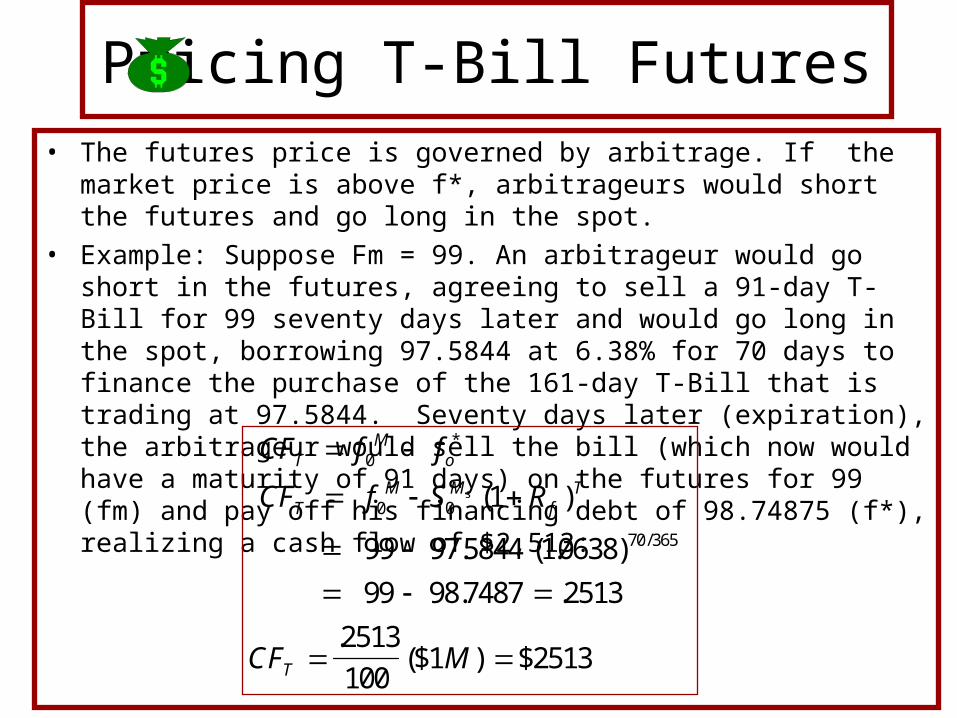
Pricing T-Bill Futures• The futures price is governed by arbitrage. If the market price is above f*,
arbitrageurs would short the futures and go long in the spot.
• Example: Suppose Fm = 99. An arbitrageur would go short in the futures, agreeing to sell a 91-day T-Bill for 99 seventy days later and would go long in the spot, borrowing 97.5844 at 6.38% for 70 days to finance the purchase of the 161-day T-Bill that is trading at 97.5844. Seventy days later (expiration), the arbitrageur would sell the bill (which now would have a maturity of 91 days) on the futures for 99 (fm) and pay off his financing debt of 98.74875 (f*), realizing a cash flow of $2,513:
CF f f
CF f S R
CF M
TM
o
TM M
fT
T
s
0
0 0
70 365
1
99 97 5844 10638
99 98 7487 2513
2513
100
*
/
( )
. ( . )
. .
.($1 ) $2513

Pricing T-Bill Futures
• Note at fm = 99, a money market manager planning to invest for 70 days in a T-Bill at 6.38% could earn a greater return by buying a 161-day bill and going short in the 70-day T-Bill futures to lock in the selling price. For example, using the above numbers, if a money market manager were planning to invest 97.5844 for 70 days, she could buy a 161-day bill for that amount and go short in the futures at 99. Her return would be 7.8%, compared to only 6.38% from the 70-day T-Bill.
R
99
97 58441 078
365 70
..
/
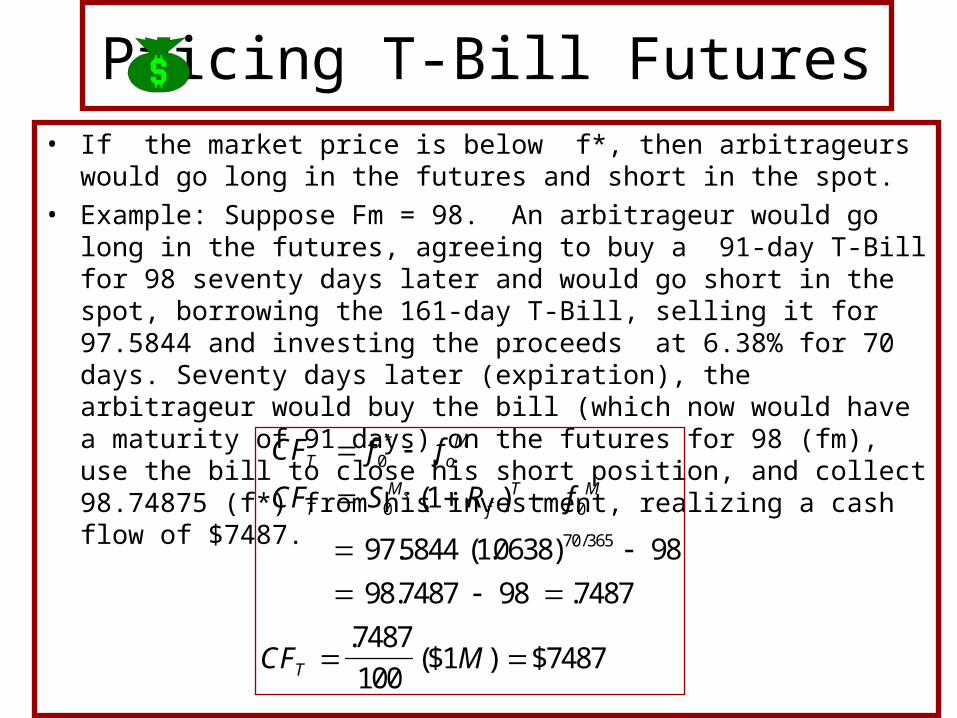
Pricing T-Bill Futures• If the market price is below f*, then arbitrageurs would go long in the futures
and short in the spot.
• Example: Suppose Fm = 98. An arbitrageur would go long in the futures, agreeing to buy a 91-day T-Bill for 98 seventy days later and would go short in the spot, borrowing the 161-day T-Bill, selling it for 97.5844 and investing the proceeds at 6.38% for 70 days. Seventy days later (expiration), the arbitrageur would buy the bill (which now would have a maturity of 91 days) on the futures for 98 (fm), use the bill to close his short position, and collect 98.74875 (f*) from his investment, realizing a cash flow of $7487.
CF f f
CF S R f
CF M
T oM
TM
fT M
T
s
0
0 0
70 365
1
97 5844 10638 98
98 7487 98 7487
7487
100
*
/
( )
. ( . )
. .
.($1 ) $7487

Pricing T-Bill Futures
• Note at fm = 98, a money market manager with a 161-day T-Bill could earn an arbitrage by selling the bill for 97.5844 and investing the proceed at 6.38% for 70 days, then going long in the 70-day T-Bill futures. Seventy days later, the money market manager would receive 98.74875 from the investment and would pay 98 on the futures to reacquire the bill for a CF of .74875.
CF f fTM
0 0
70 365955844 10638 98 74875
*
/. ( . ) .
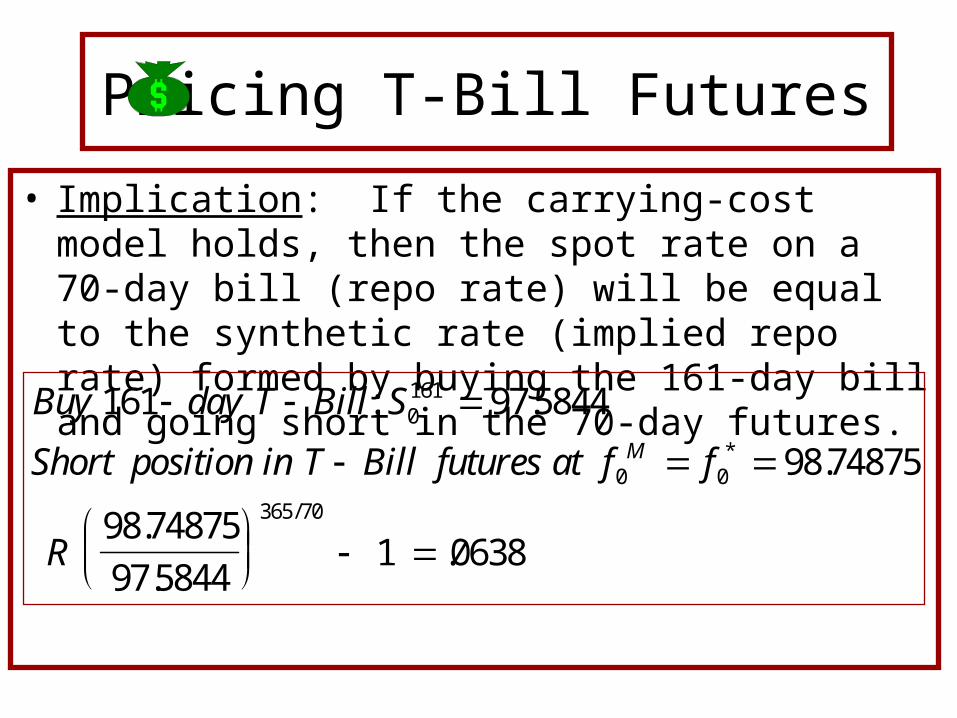
Pricing T-Bill Futures
• Implication: If the carrying-cost model holds, then the spot rate on a 70-day bill (repo rate) will be equal to the synthetic rate (implied repo rate) formed by buying the 161-day bill and going short in the 70-day futures.
Buy day T Bill S
Short position in T Bill futures at f f
R
M
161 97 5844
98 74875
98 74875
97 58441 0638
0161
0 0
365 70
: .
.
.
..
*
/
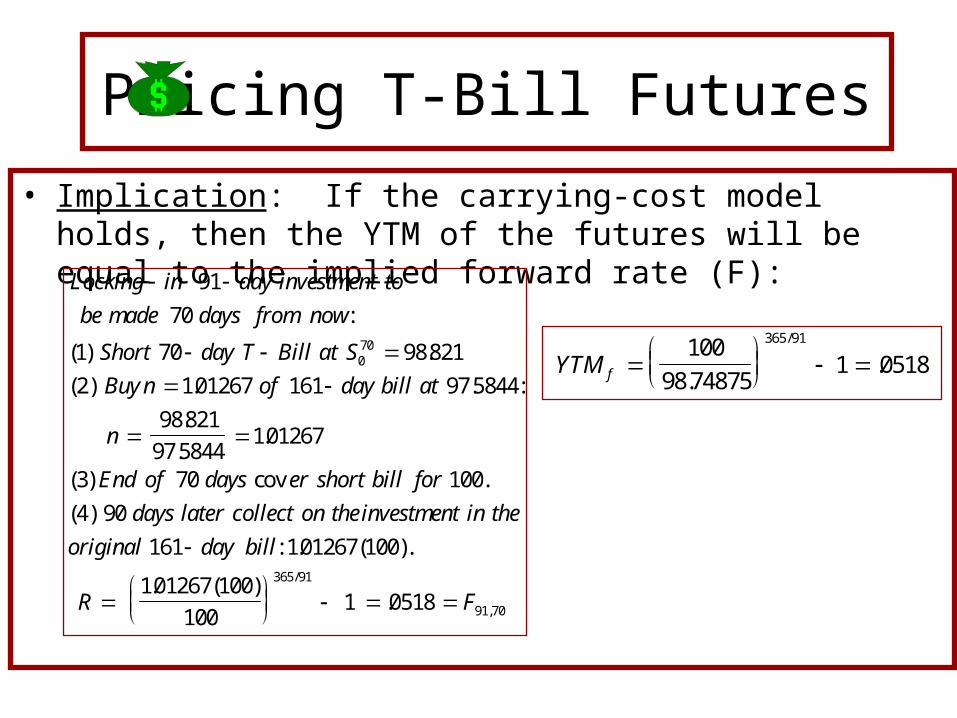
Pricing T-Bill Futures
• Implication: If the carrying-cost model holds, then the YTM of the futures will be equal to the implied forward rate (F):Locking in day investment to
be made days from now
Short day T Bill at S
Buy n of day bill at
n
End of days er short bill for
days later collect on theinvestment in the
original day bill
R F
91
70
1 70 98 821
2 101267 161 97 5844
98 821
97 5844101267
3 70 100
4 90
161 101267 100
101267 100
1001 0518
070
365 91
91 70
:
( ) .
( ) . . :
.
..
( ) cov .
( )
: . ( ).
. ( ).
/
,
YTM f
100
98 748751 0518
365 91
..
/

Futures
Hedging Cases with Debt
Futures Contracts

Hedging with T-Bill Futures
• Case 1: Money market manager is expecting a $5M CF in June which she plans to invest in a 91-day T-Bill. With June T-Bill futures trading at IMM of 91, the manager could lock in a 9.56% rate by going long in 5.115 June T-Bill futures.
June IMM or R
f M
YTMM
nCF
f
Mlong contracts
D
June
f
fT
91 9%
100 9 25
100500
5001 0956
5005115
0
365 91
0
( )(. )($1 ) $977,
$1
$977,.
$5
$977,.
/
Hedging with T-Bill Futures
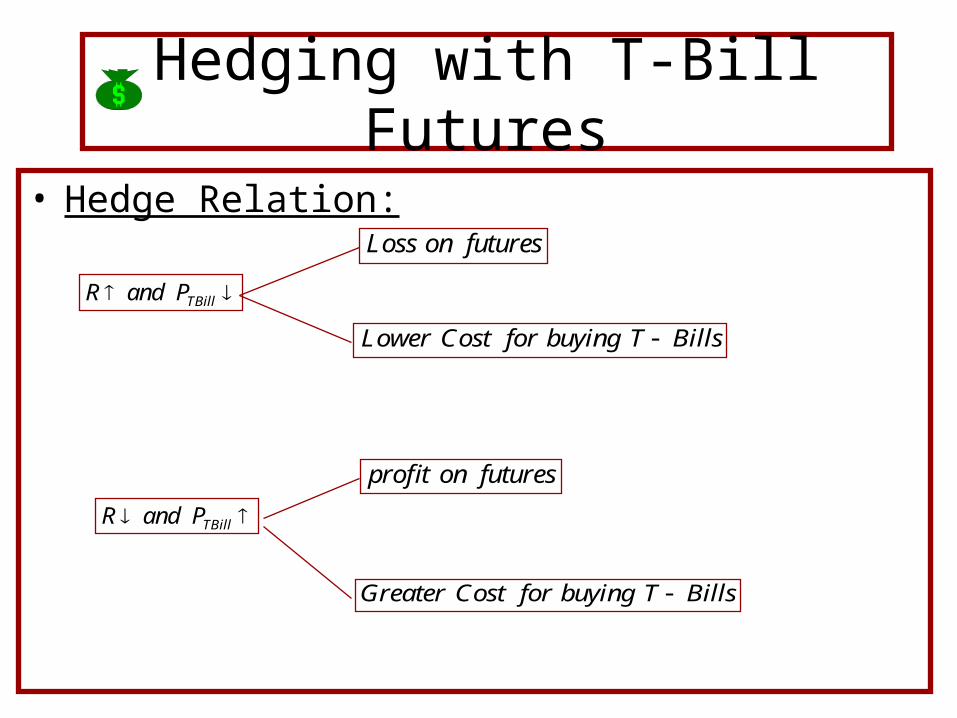
• Hedge Relation:
R and PTBill
Loss on futures
Lower Cost for buying T Bills
R and PTBill
profit on futures
Greater Cost for buying T Bills

Hedging with T-Bill Futures
• Case 1: Suppose in June, the spot 91-day T-bill rate is at 8%. The manager would find T-Bill prices higher at $980,995 but would realize a profit of $17,877 from closing the futures position. Combining the profit with the $5M CF, the manager would be able to buy 5.115 T-Bills and earn a rate off the $5M investment of 9.56%.
At June Date Rate on T Bill
SM
nM
f M
RateM
M
T
f
TB
June
,
$1
( . )$980,
[$980, $977, ] . $17,
$5 $17,
$980,.
( )(. )($1 ) $977,
. ($1 )
$5.
/
/
8%:
108995
995 500 5115 877
877
9955115
100 9 25
100500
51151 0956
9191 365
0
365 91
Hedging with T-Bill Futures
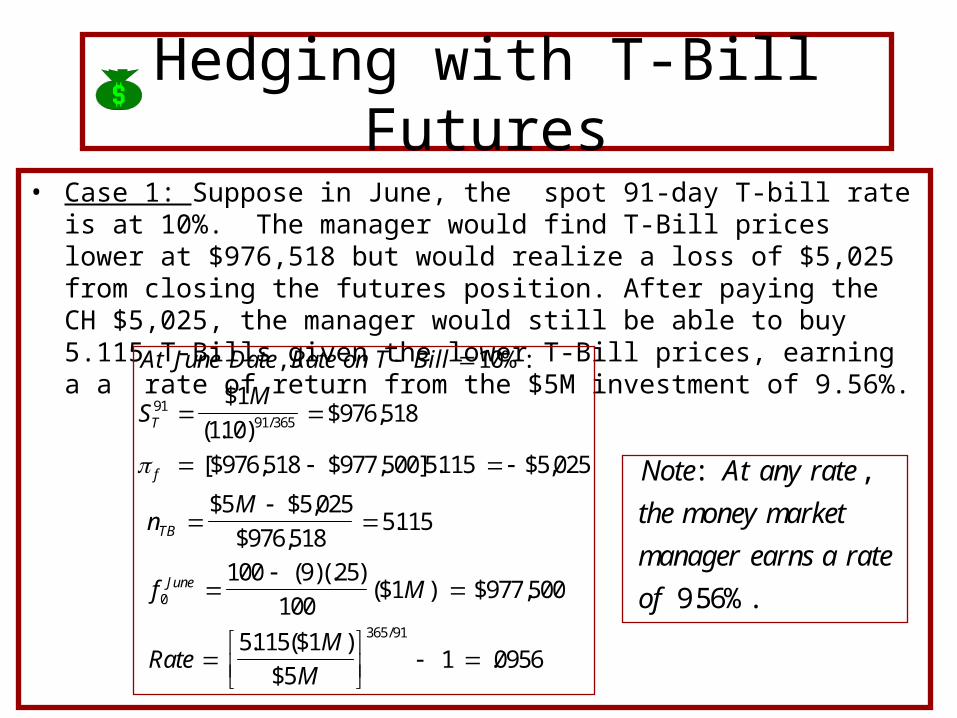
• Case 1: Suppose in June, the spot 91-day T-bill rate is at 10%. The manager would find T-Bill prices lower at $976,518 but would realize a loss of $5,025 from closing the futures position. After paying the CH $5,025, the manager would still be able to buy 5.115 T-Bills given the lower T-Bill prices, earning a a rate of return from the $5M investment of 9.56%.
At June Date Rate on T Bill
SM
nM
f M
RateM
M
T
f
TB
June
,
$1
( . )$976,
[$976, $977, ] . $5,
$5 $5,
$976,.
( )(. )($1 ) $977,
. ($1 )
$5.
/
/
10%:
110518
518 500 5115 025
025
5185115
100 9 25
100500
51151 0956
9191 365
0
365 91
Note At any rate
the money market
manager earns a rate
of
: ,
.9 56%.

Hedging with T-Bill Futures• Case 2: Money market manager is expecting a $5M CF in June which she plans to
invest in a 182-day T-Bill. Since the T-Bill underlying a futures contract has a maturity of 91 days, the manager would need to go long in both a June T-Bill futures and a September T-Bill
• futures (note there is approximately 91 days between the contract) in order to lock in a return on a 182-day T-Bill investment. If June T-Bill futures were trading at IMM of 91 and September futures were trading at IMM of 91.4, then the manager could lock in a 9.3% rate on an investment in 182-day T-Bills by going long in 5.115 June T-Bill futures and 5.11 September contracts:
June IMM or R
f M
YTMM
nCF
f
Mlong contracts
D
June
f
fT
91 9%
100 9 25
100500
5001 0956
5005115
0
365 91
0
( )(. )($1 ) $977,
$1
$977,.
$5
$977,.
/
September IMM or R
f M
YTMM
nCF
f
Mlong contracts
D
Sept
f
fT
914 8 6%
100 6 25
100500
5001 091
500511
0
365 91
0
. .
(8. )(. )($1 ) $978,
$1
$978,.
$5
$978,.
/
YTM f :/ / /
( . ) ( . ) .18291 365 91 365 365 182
10956 1091 1 093
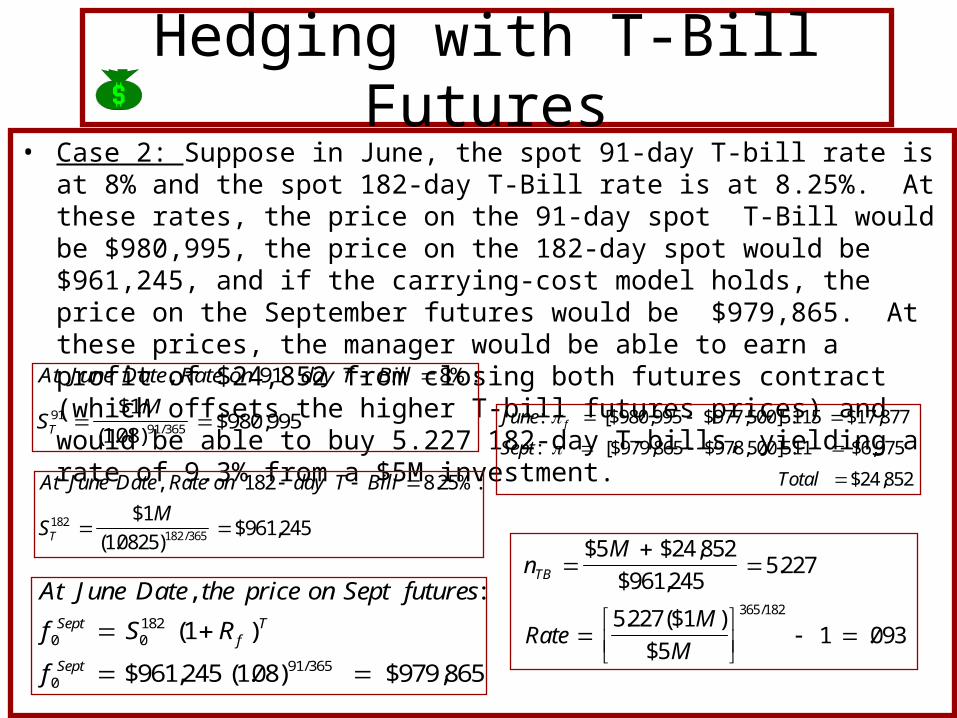
Hedging with T-Bill Futures• Case 2: Suppose in June, the spot 91-day T-bill rate is at 8% and the spot 182-day
T-Bill rate is at 8.25%. At these rates, the price on the 91-day spot T-Bill would be $980,995, the price on the 182-day spot would be $961,245, and if the carrying-cost model holds, the price on the September futures would be $979,865. At these prices, the manager would be able to earn a profit of $24,852 from closing both futures contract (which offsets the higher T-bill futures prices) and would be able to buy 5.227 182-day T-bills, yielding a rate of 9.3% from a $5M investment.
At June Date Rate on day T Bill
SM
T
,
$1
( . )$980,/
91 8%:
10899591
91 365
At June Date Rate on day T Bill
SM
T
, .
$1
( . )$961,/
182 8 25%:
10825245182
182 365
nM
RateM
M
TB
$5 $24,
$961,.
. ($1 )
$5.
/
852
2455 227
5 2271 093
365 182
June
Sept
Total
f: [$980, $977, ] . $17,
: [$979, $978, ] . $6,
$24,
995 500 5115 877
865 500 511 975
852
At June Date the price on Sept futures
f S R
f
Septf
T
Sept
, :
( )
$961, ( . ) $979,/
0 0182
091 365
1
245 108 865
Hedging with T-Bill Futures• Case 2: Suppose in June, the spot 91-day T-bill rate is at 10% and the spot 182-
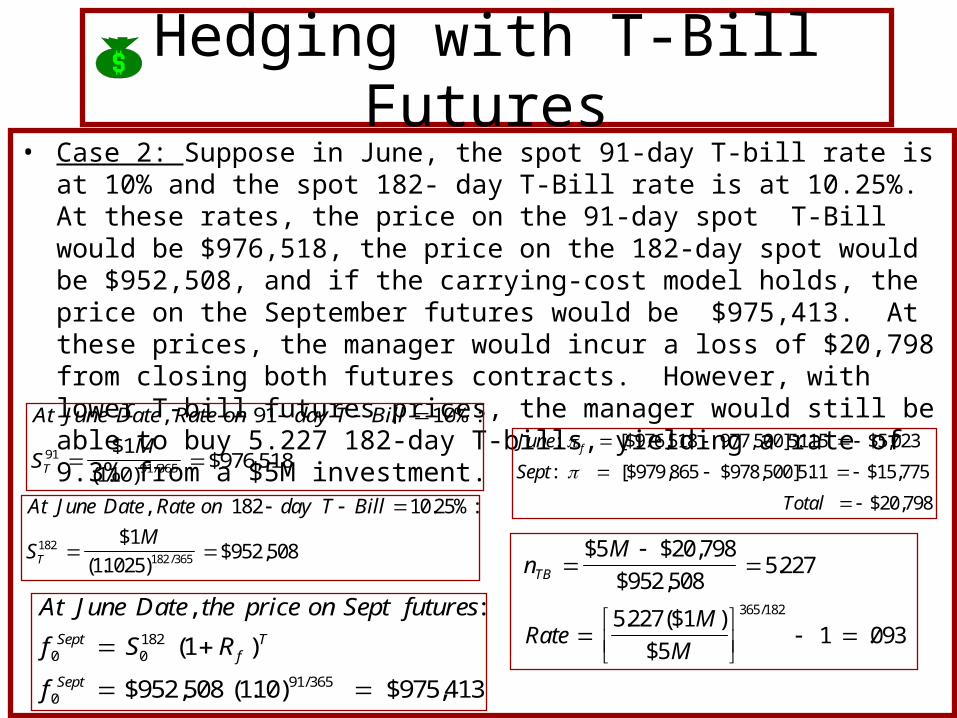
day T-Bill rate is at 10.25%. At these rates, the price on the 91-day spot T-Bill would be $976,518, the price on the 182-day spot would be $952,508, and if the carrying-cost model holds, the price on the September futures would be $975,413. At these prices, the manager would incur a loss of $20,798 from closing both futures contracts. However, with lower T-bill futures prices, the manager would still be able to buy 5.227 182-day T-bills, yielding a rate of 9.3% from a $5M investment.
At June Date Rate on day T Bill
SM
T
,
$1
( . )$976,/
91 10%:
11051891
91 365
At June Date Rate on day T Bill
SM
T
, .
$1
( . )$952,/
182 10 25%:
11025508182
182 365
n
M
RateM
M
TB
$5 $20,
$952,.
. ($1 )
$5.
/
798
5085 227
5 2271 093
365 182
June
Sept
Total
f: [$976, , ] . $5,
: [$979, $978, ] . $15,
$20,
518 977 500 5115 023
865 500 511 775
798
At June Date the price on Sept futures
f S R
f
Septf
T
Sept
, :
( )
$952, ( . ) $975,/
0 0182
091 365
1
508 110 413
Managing the Maturity Gap
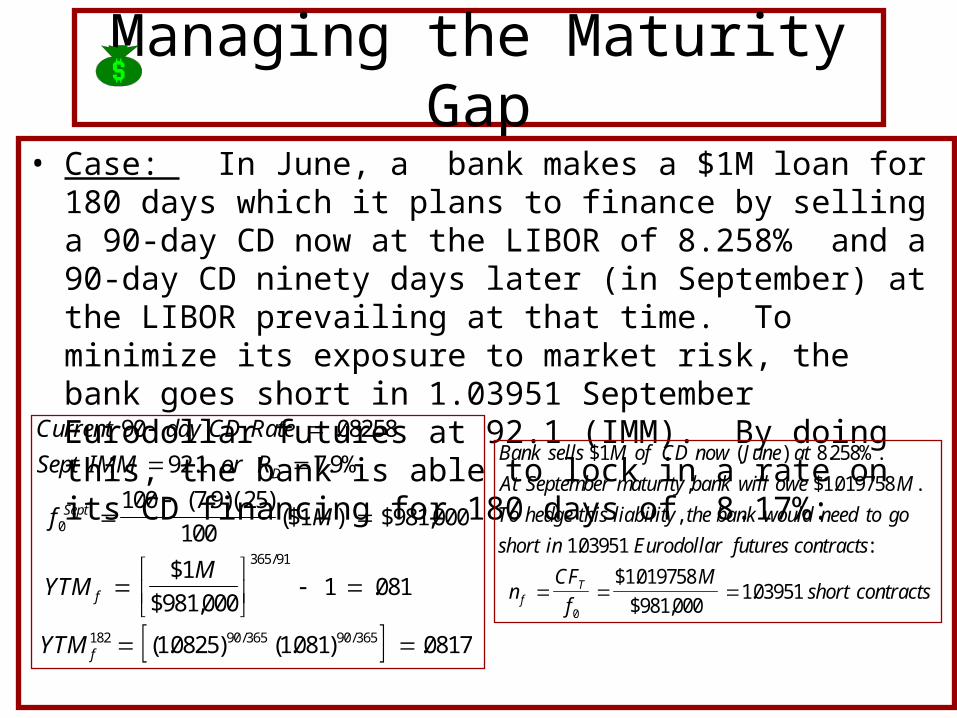
• Case: In June, a bank makes a $1M loan for 180 days which it plans to finance by selling a 90-day CD now at the LIBOR of 8.258% and a 90-day CD ninety days later (in September) at the LIBOR prevailing at that time. To minimize its exposure to market risk, the bank goes short in 1.03951 September Eurodollar futures at 92.1 (IMM). By doing this, the bank is able to lock in a rate on its CD financing for 180 days of 8.17%:
Current day CD Rate
Sept IMM or R
f M
YTMM
YTM
D
Sept
f
f
90 08258
921 7 9%
100 7 9 25
100000
0001 081
10825 1081 0817
0
365 91
182 90 365 90 365
.
. .
( . )(. )($1 ) $981,
$1
$981,.
( . ) ( . ) .
/
/ /
Bank sells M of CD now June at
At September maturity bank will owe M
To hedge this liability the bank would need to go
short in Eurodollar futures contracts
nCF
f
Mshort contractsf
T
$1 ( ) .
, $1. .
,
. :
$1.
$981,.
8 258%.
019758
103951
019758
000103951
0
Managing the Maturity Gap
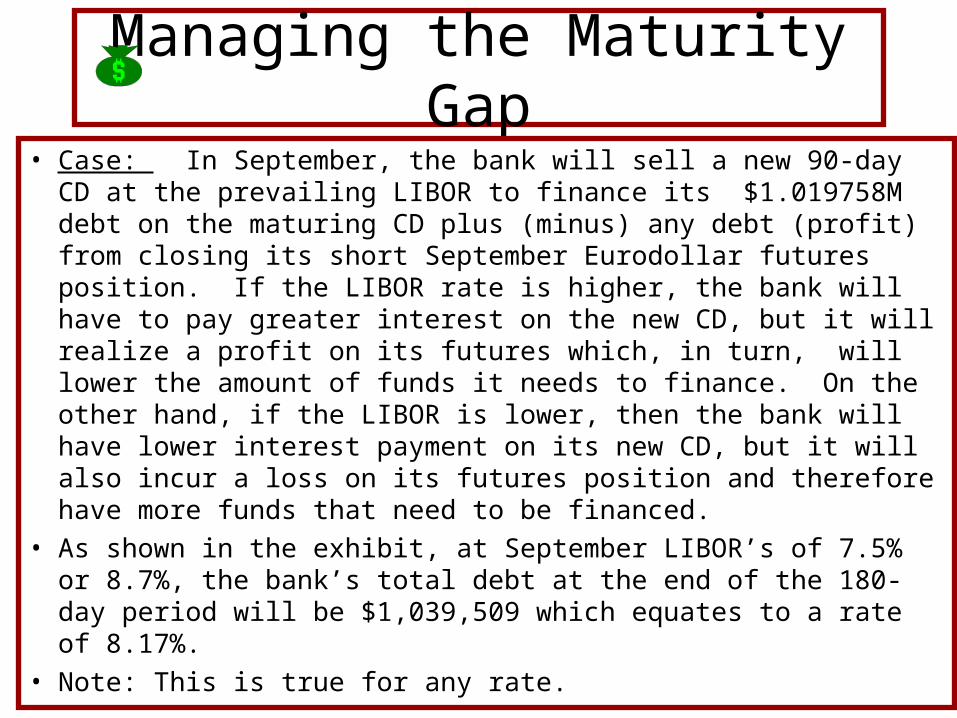
• Case: In September, the bank will sell a new 90-day CD at the prevailing LIBOR to finance its $1.019758M debt on the maturing CD plus (minus) any debt (profit) from closing its short September Eurodollar futures position. If the LIBOR rate is higher, the bank will have to pay greater interest on the new CD, but it will realize a profit on its futures which, in turn, will lower the amount of funds it needs to finance. On the other hand, if the LIBOR is lower, then the bank will have lower interest payment on its new CD, but it will also incur a loss on its futures position and therefore have more funds that need to be financed.
• As shown in the exhibit, at September LIBOR’s of 7.5% or 8.7%, the bank’s total debt at the end of the 180-day period will be $1,039,509 which equates to a rate of 8.17%.
• Note: This is true for any rate.
Managing the Maturity Gap
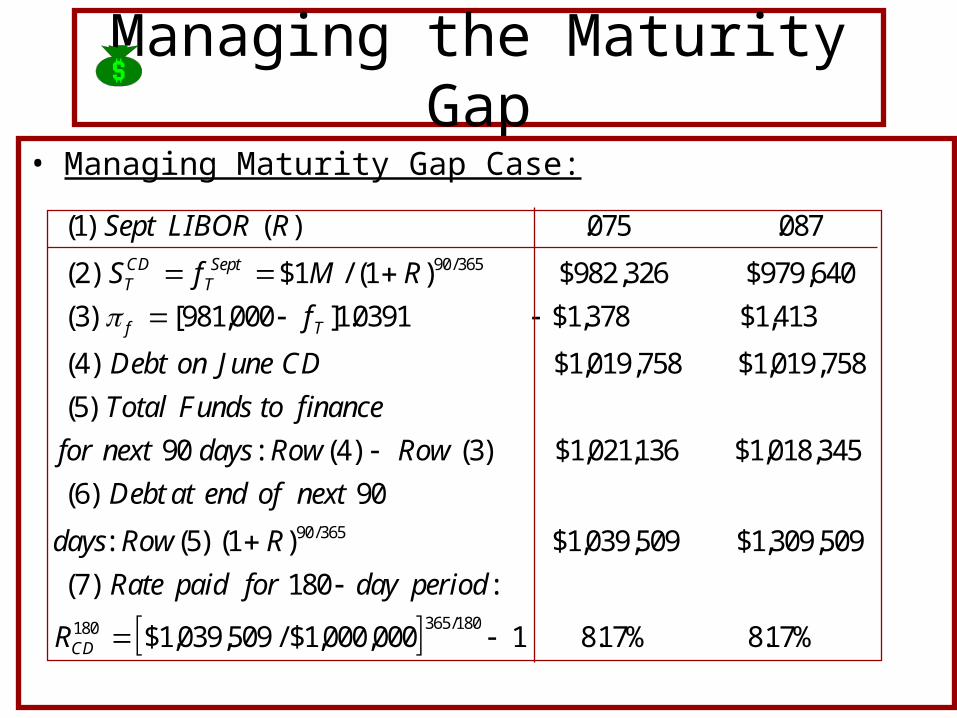
• Managing Maturity Gap Case:
( ) ( ) . .
( ) $1 / ( ) $982, $979,
( ) [ , ] . $1, $1,
( ) $1, , $1, ,
(5)
: ( ) ( ) $1, , $1, ,
( )
: (5) ( ) $1, , $1, ,
/
/
1 075 087
2 1 326 640
3 981 000 10391 378 413
4 019 758 019 758
90 4 3 021136 018 345
6 90
1 039 509 309 509
90 365
90 365
Sept LIBOR R
S f M R
f
Debt on June CD
Total Funds to finance
for next days Row Row
Debt at end of next
days Row R
TCD
TSept
f T
( ) :
$1, , / $1, , . ./
7 180
039 509 000 000 1 817% 817%180 365 180
Rate paid for day period
RCD
Fixing a Variable Rate Loan
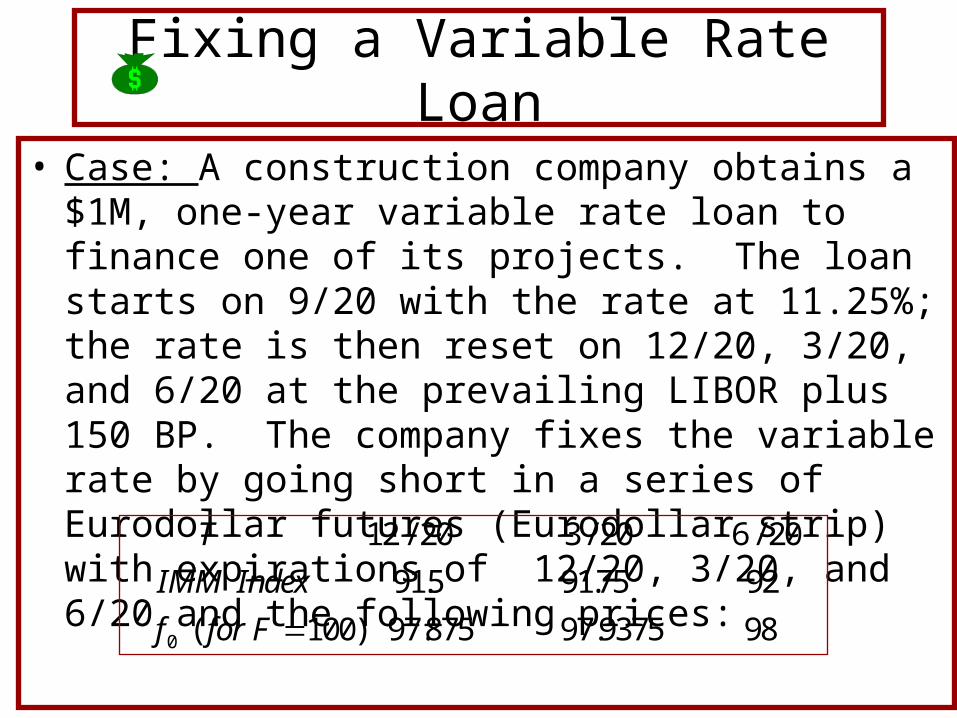
• Case: A construction company obtains a $1M, one-year variable rate loan to finance one of its projects. The loan starts on 9/20 with the rate at 11.25%; the rate is then reset on 12/20, 3/20, and 6/20 at the prevailing LIBOR plus 150 BP. The company fixes the variable rate by going short in a series of Eurodollar futures (Eurodollar strip) with expirations of 12/20, 3/20, and 6/20 and the following prices:
T
IMM Index
f for F
12 20 3 20 6 20
915 9175 92
100 97 875 97 9375 980
/ / /
. .
( ) . .

Fixing a Variable Rate Loan
• By doing this, the company is able to lock in a fixed rate of 10.12%
Lock in Rate IMM BP
R
R
R
Fixed Loan Rate
[ ] /
/ : [ . ] .
/ : [ . ] . .
/ [ ] . .
[( . ) ( . ) ( . ) ( . ) ] .
/
/
/
. . . .
100 100
12 20 100 915 15 10%
3 20 100 9175 15 9 75%
6 20 100 92 15 9 5%
11125 110 10975 1095 1012
12 20
3 20
6 20
25 25 25 25
Fixing a Variable Rate Loan
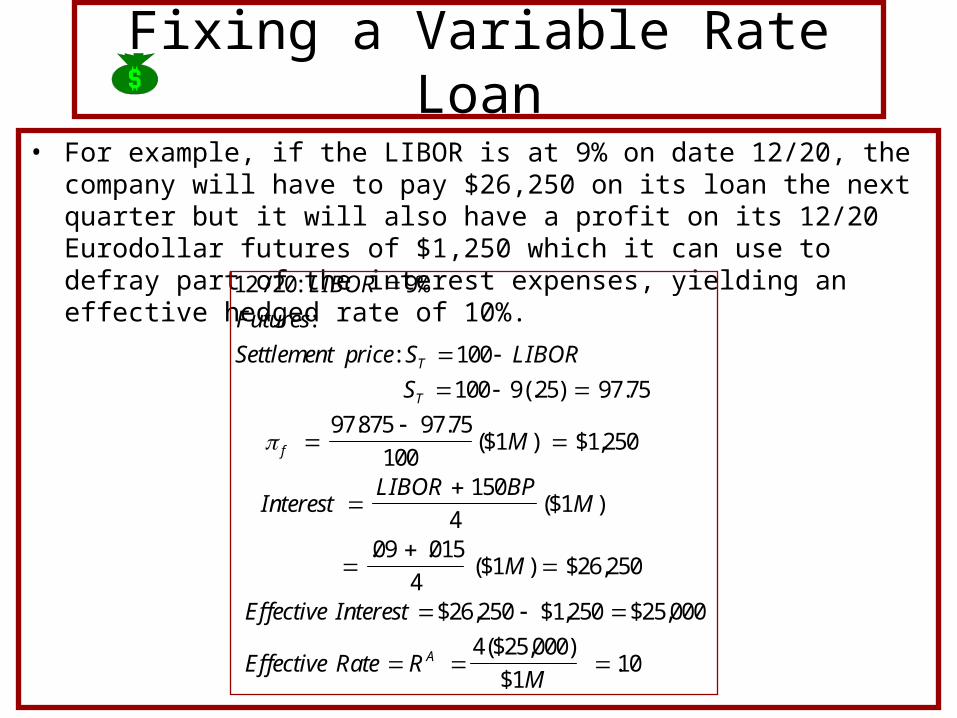
• For example, if the LIBOR is at 9% on date 12/20, the company will have to pay $26,250 on its loan the next quarter but it will also have a profit on its 12/20 Eurodollar futures of $1,250 which it can use to defray part of the interest expenses, yielding an effective hedged rate of 10%.
12 20 9%
100
100 9 25 97 75
97 875 97 75
100250
150
409 015
4250
250 250 000
4 00010
/ :
:
:
(. ) .
. .($1 ) $1,
($1 )
. .($1 ) $26,
$26, $1, $25,
($25, )
$1.
LIBOR
Futures
Settlement price S LIBOR
S
M
InterestLIBOR BP
M
M
Effective Interest
Effective Rate RM
T
T
f
A

Fixing a Variable Rate Loan
• If the LIBOR is at 6% on date 12/20, the company will have to pay only $18,750 on its loan the next quarter but it will also have to cover a loss on its 12/20 Eurodollar futures of $6,250. The payment of interest and the loss on the futures yields an effective hedged rate of 10%.
12 20 6%
100
100 6 25 985
97 875 985
100250
150
406 015
4750
750 250 000
4 00010
/ :
:
:
(. ) .
. .($1 ) $6,
($1 )
. .($1 ) $18,
$18, $6, $25,
($25, )
$1.
LIBOR
Futures
Settlement price S LIBOR
S
M
InterestLIBOR BP
M
M
Effective Interest
Effective Rate RM
T
T
f
A
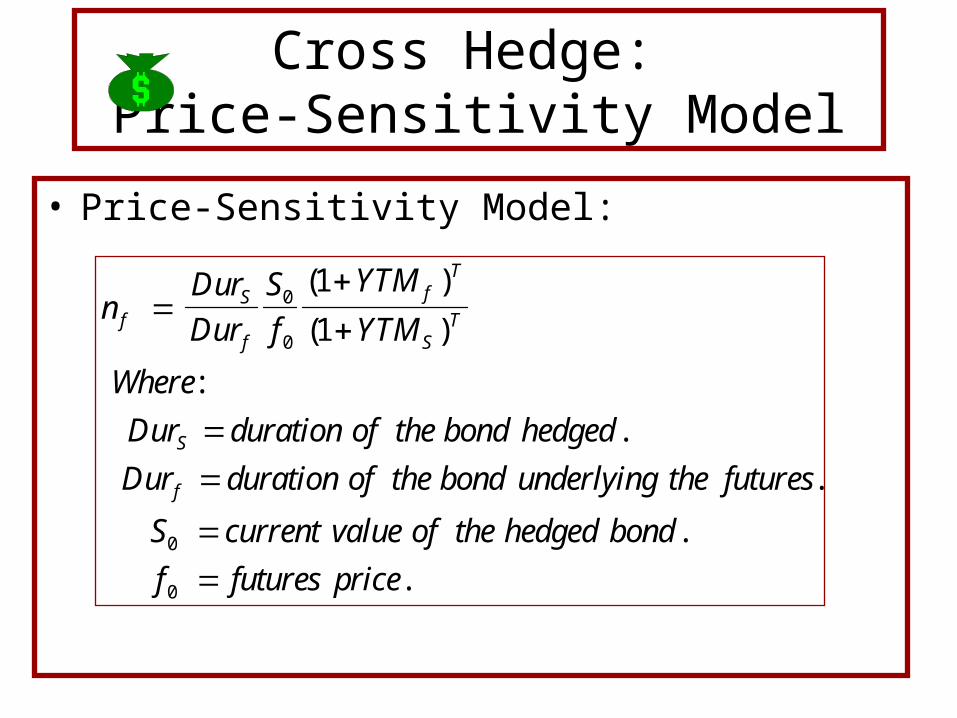
Cross Hedge: Price-Sensitivity Model
• Price-Sensitivity Model:
nDur
Dur
S
f
YTM
YTM
Where
Dur duration of the bond hedged
Dur duration of the bond underlying the futures
S current value of the hedged bond
f futures price
fS
f
fT
ST
S
f
0
0
0
0
1
1
( )
( )
:
.
.
.
.
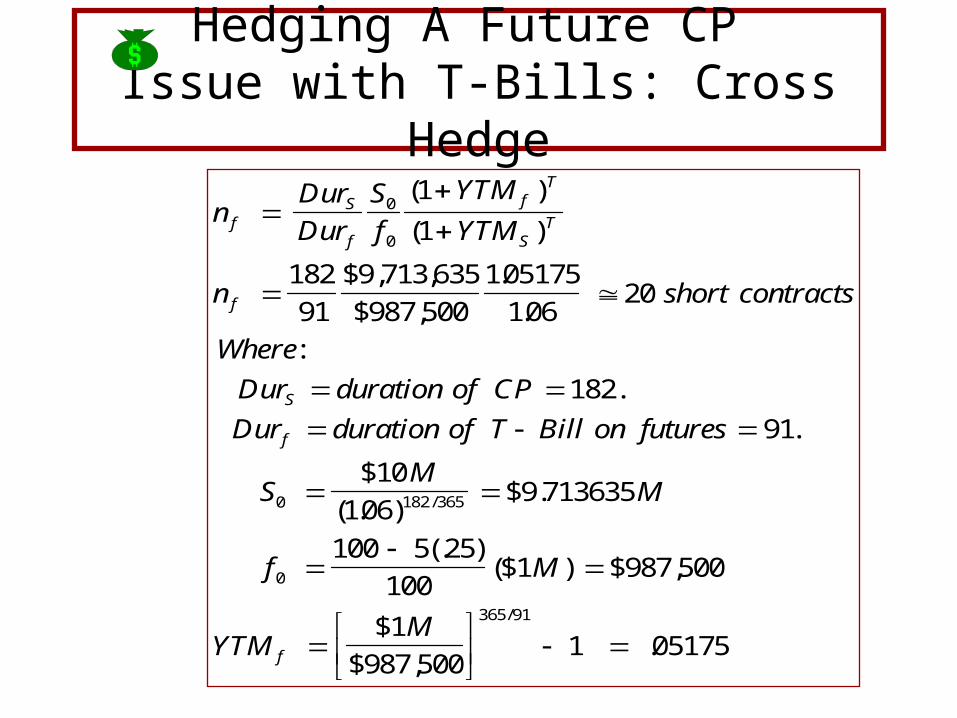
Hedging A Future CP Issue with T-Bills: Cross Hedge
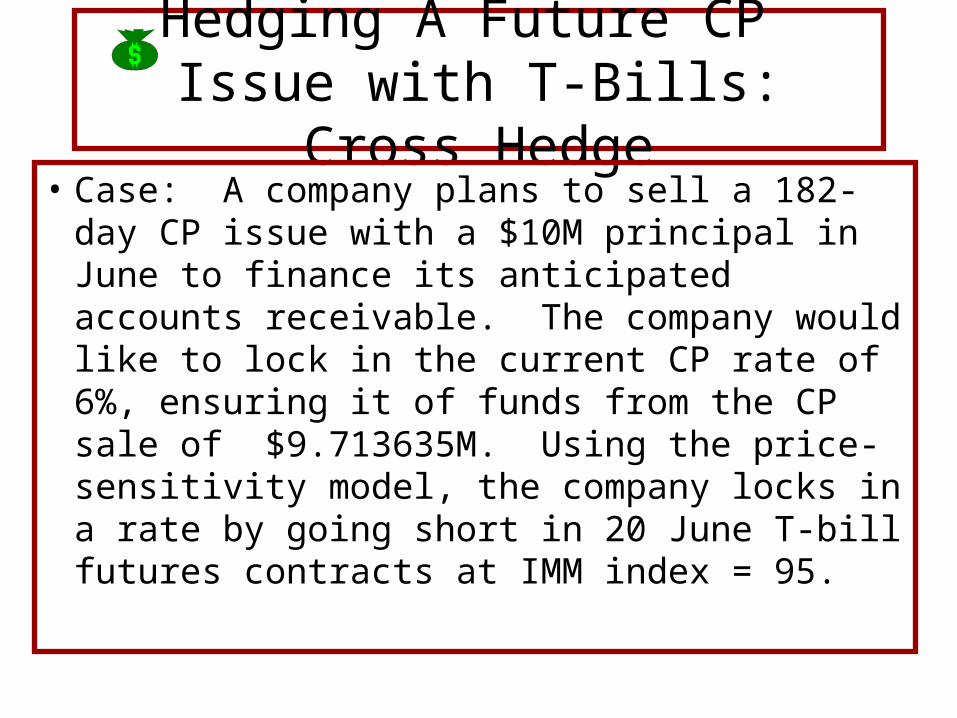
• Case: A company plans to sell a 182-day CP issue with a $10M principal in June to finance its anticipated accounts receivable. The company would like to lock in the current CP rate of 6%, ensuring it of funds from the CP sale of $9.713635M. Using the price-sensitivity model, the company locks in a rate by going short in 20 June T-bill futures contracts at IMM index = 95.
Hedging A Future CP Issue with T-Bills: Cross Hedge
nDur
Dur
S
f
YTM
YTM
n short contracts
Where
Dur duration of CP
Dur duration of T Bill on futures
SM
M
f M
YTMM
fS
f
fT
ST
f
S
f
f
0
0
0 182 365
0
365 91
1
1
182
91
713 635
500
105175
10620
182
91
106713635
100 5 25
100500
5001 05175
( )
( )
$9, ,
$987,
.
.
:
.
.
$10
( . )$9.
(. )($1 ) $987,
$1
$987,.
/
/
Hedging A Future CP Issue with T-Bills: Cross Hedge
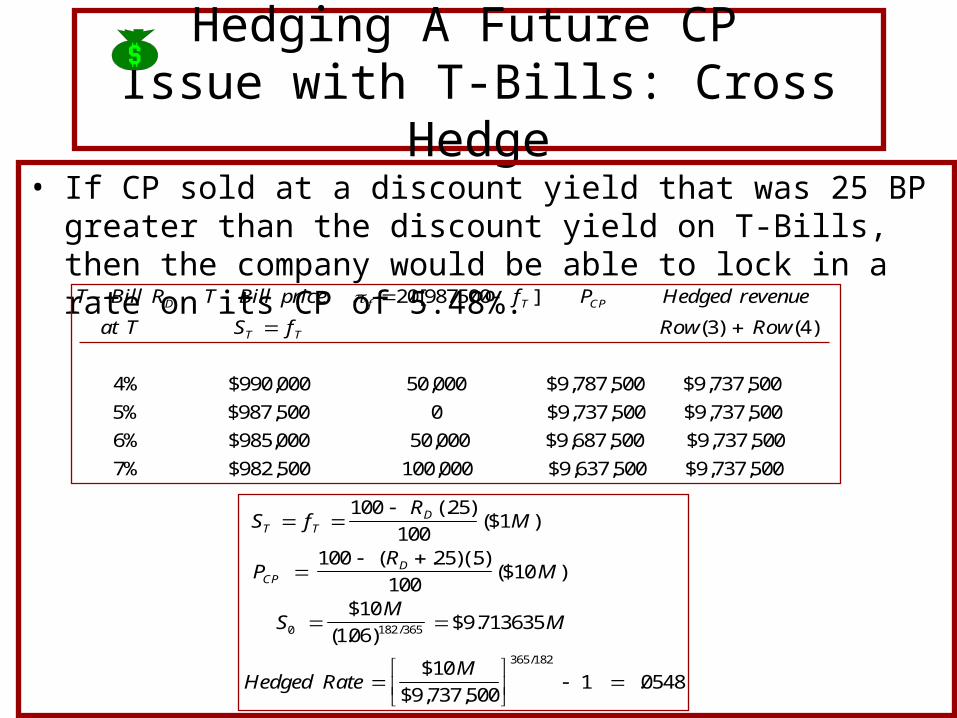
• If CP sold at a discount yield that was 25 BP greater than the discount yield on T-Bills, then the company would be able to lock in a rate on its CP of 5.48%.T Bill R T Bill price f P Hedged revenue
at T S f Row Row
D f T CP
T T
20 987500
3 4
4% 000 50 000 787 500 737 500
5% 500 0 737 500 737 500
6% 000 50 000 687 500 737 500
7% 500 100 000 637 500 737 500
[ ]
( ) ( )
$990, , $9, , $9, ,
$987, $9, , $9, ,
$985, , $9, , $9, ,
$982, , $9, , $9, ,
S fR
M
PR
M
SM
M
Hedged RateM
T TD
CPD
100 25
100100 25 5
100
106713635
737 5001 0548
0 182 365
365 182
(. )($1 )
( . )(. )($10 )
$10
( . )$9.
$10
$9, ,.
/
/
Hedging A Future BondSale with T-Bond Futures: Cross Hedge
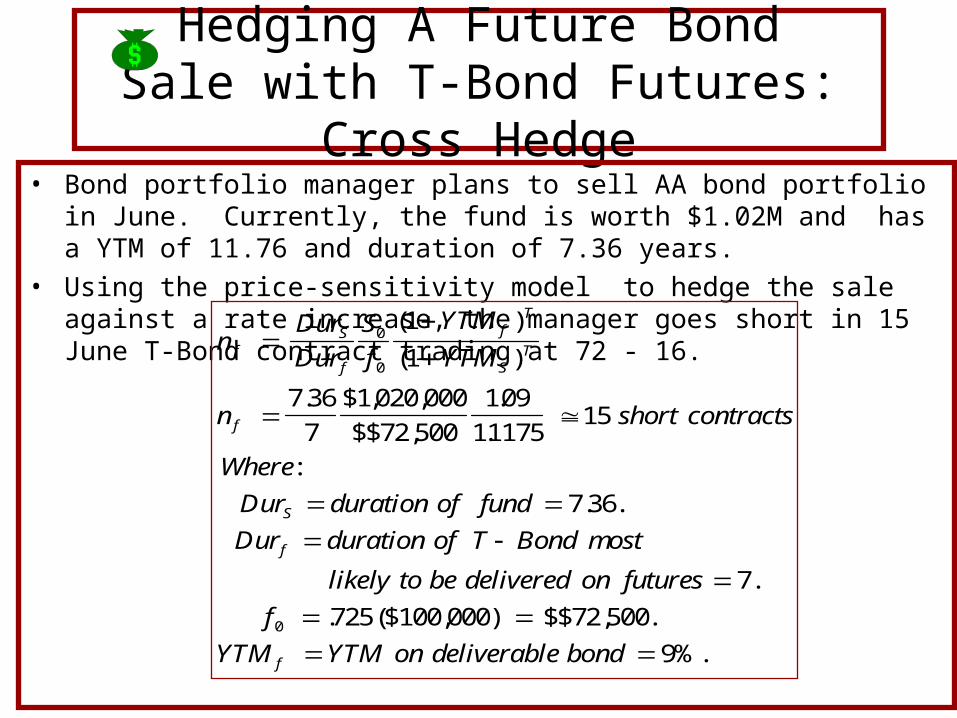
• Bond portfolio manager plans to sell AA bond portfolio in June. Currently, the fund is worth $1.02M and has a YTM of 11.76 and duration of 7.36 years.
• Using the price-sensitivity model to hedge the sale against a rate increase, the manager goes short in 15 June T-Bond contract trading at 72 - 16.
nDur
Dur
S
f
YTM
YTM
n short contracts
Where
Dur duration of fund
Dur duration of T Bond most
likely to be delivered on futures
f
YTM YTM on deliverable bond
fS
f
fT
ST
f
S
f
f
0
0
0
1
1
7 36
7
020 000
500
109
1117515
7 36
7
725 000 500
9%.
( )
( )
. $1, ,
$$72,
.
.
:
. .
.
. ($100, ) $$72, .

Interest Rate Swaps

Interest Rate Swaps
• An interest rate swap is an exchange of CFs.
• Generic Interest Rate Swap involves the exchange of fixed-rate payments for floating-rate payments.

Interest Rate Swaps
Terms:
• Parties to a swap are called counterparties. There are two parties:– Fixed-Rate Payer– Floating-Rate Payer
• Rates:– Fixed rate is usually a T-Note rate plus BP– Floating rate is usually the LIBOR.
Interest Rate Swaps
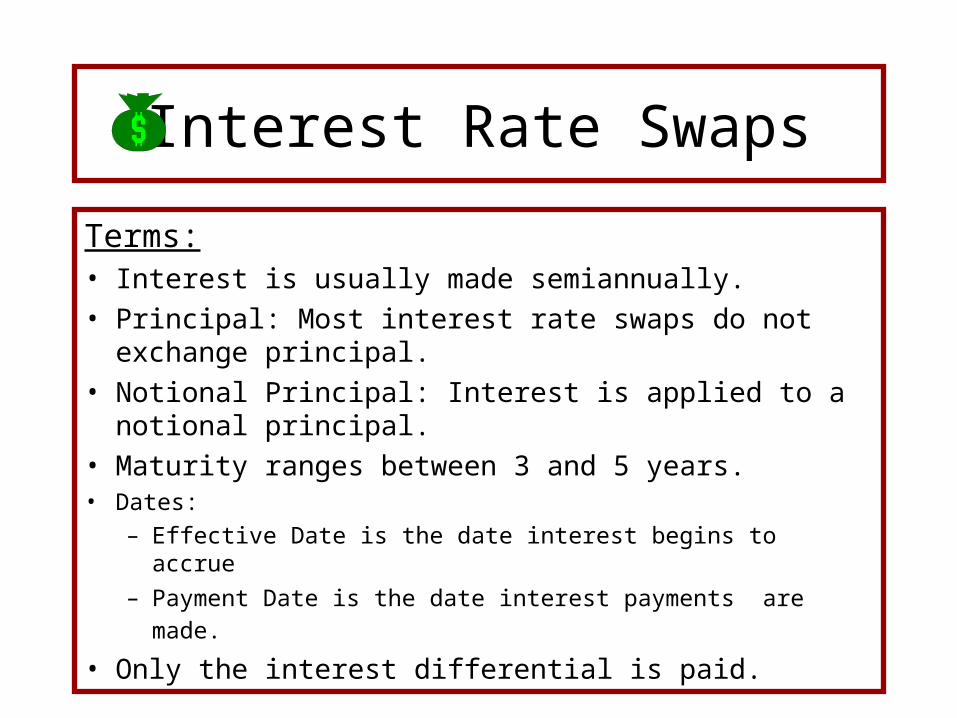
Terms:• Interest is usually made semiannually.
• Principal: Most interest rate swaps do not exchange principal.
• Notional Principal: Interest is applied to a notional principal.
• Maturity ranges between 3 and 5 years.• Dates:
– Effective Date is the date interest begins to accrue
– Payment Date is the date interest payments are made.
• Only the interest differential is paid.
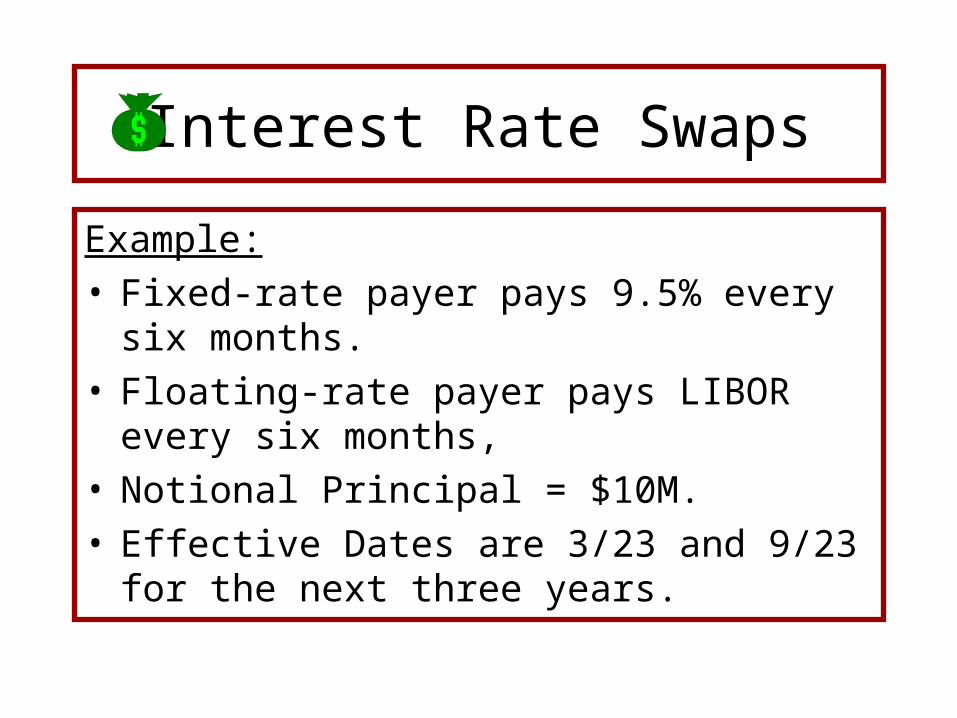
Interest Rate Swaps
Example:• Fixed-rate payer pays 9.5% every six months.• Floating-rate payer pays LIBOR every six
months,• Notional Principal = $10M.• Effective Dates are 3/23 and 9/23 for the next
three years.
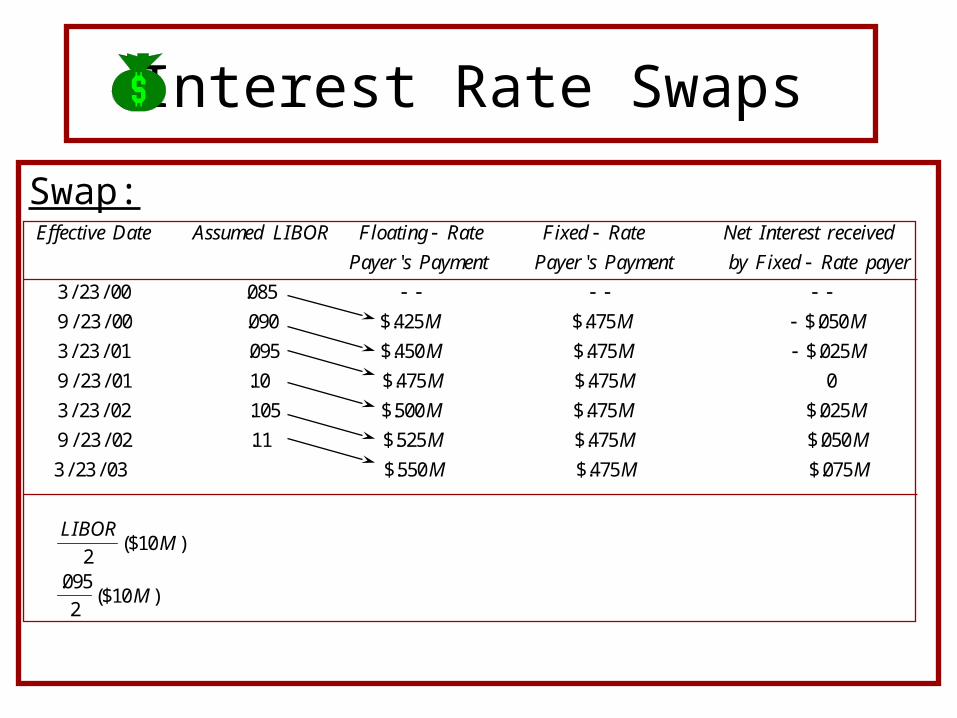
Interest Rate Swaps
Swap:Effective Date Assumed LIBOR Floating Rate Fixed Rate Net Interest received
Payer s Payment Payer s Payment by Fixed Rate payer
M M M
M M M
M M
M M M
M M M
M M M
LIBORM
' '
/ / .
/ / . $. $. $.
/ / . $. $. $.
/ / . $. $.
/ / . $. $. $.
/ / . $. $. $.
/ / $. $. $.
($10 )
.
3 23 00 085
9 23 00 090 425 475 050
3 23 01 095 450 475 025
9 23 01 10 475 475 0
3 23 02 105 500 475 025
9 23 02 11 525 475 050
3 23 03 550 475 075
2095
2($10 )M
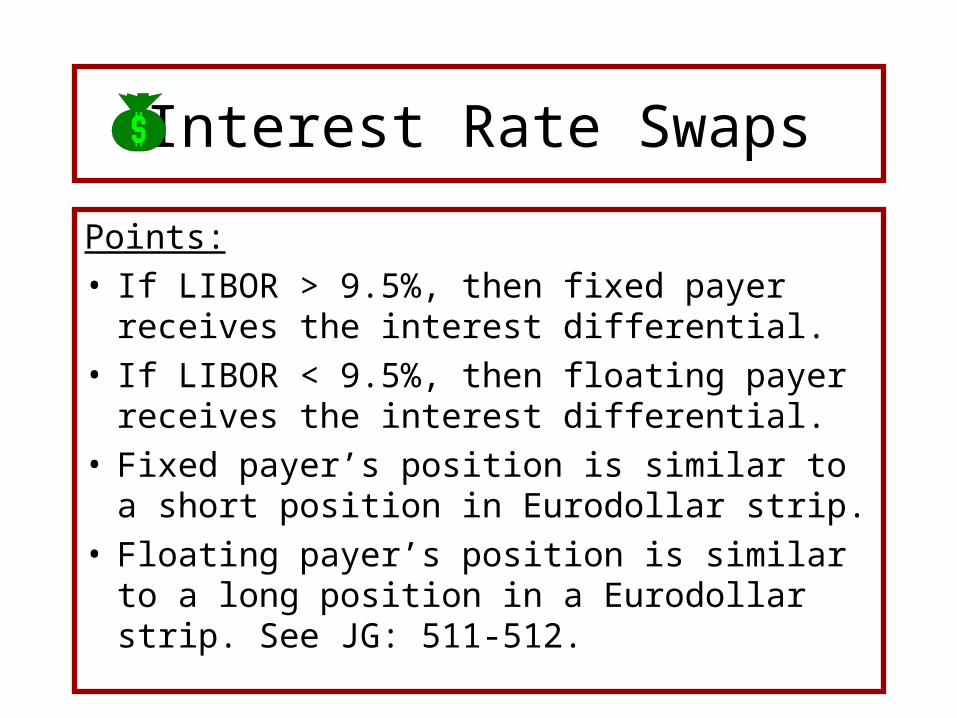
Interest Rate Swaps
Points:• If LIBOR > 9.5%, then fixed payer receives the
interest differential.• If LIBOR < 9.5%, then floating payer receives the
interest differential.• Fixed payer’s position is similar to a short
position in Eurodollar strip.• Floating payer’s position is similar to a long
position in a Eurodollar strip. See JG: 511-512.

Interest Rate Swaps
• A synthetic fixed-rate loan is formed by combining a variable rate loan with a fixed-rate payer’s position.
• Example: A three-year, $10M variable rate loan with rates set equal to the LIBOR on 3/23 and 9/23 combined with a fixed-rate payer’s position on the swap just analyzed.
Interest Rate Swaps
Synthetic Fixed-Rate Loan:Effective Date Assumed LIBOR Semiannual Interest Net Interest received Effective
on Variable Rate Loan by Fixed Rate payer Interest Cost
M M M
M M M
M M
M M M
M M M
M M M
InterestLIBOR
M
Rate
3 23 00 085
9 23 00 090 425 050 475
3 23 01 095 450 025 475
9 23 01 10 475 0 475
3 23 02 105 500 025 475
9 23 02 11 525 050 475
3 23 03 550 075 475
22
/ / .
/ / . $. $. $.
/ / . $. $. $.
/ / . $. $.
/ / . $. $. $.
/ / . $. $. $.
/ / $. $. $.
($10 )
($. )
$10.
475095
M
M
Interest Rate Swaps
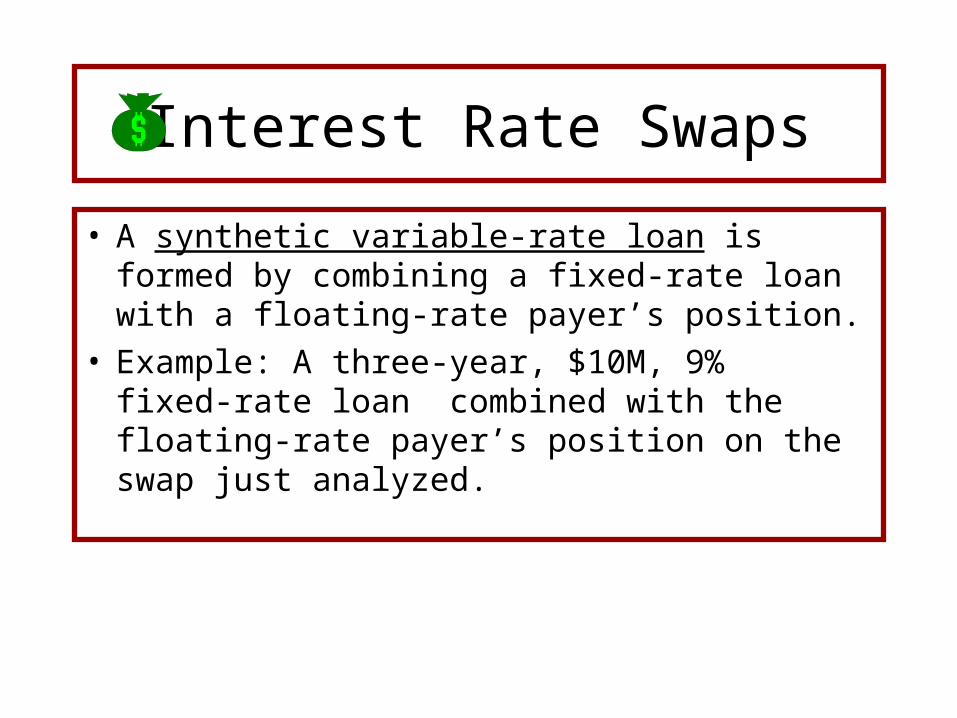
• A synthetic variable-rate loan is formed by combining a fixed-rate loan with a floating-rate payer’s position.
• Example: A three-year, $10M, 9% fixed-rate loan combined with the floating-rate payer’s position on the swap just analyzed.

Interest Rate Swaps
Synthetic Fixed-Rate Loan:
Effective Date Assumed LIBOR Semiannual Interest on Net Interest received Effective Effective
fixed Rate Loan by Floating Rate payer Interest Cost Interest Rate
M M M
M M M
M M
M M M
M M M
9%
3 23 00 085
9 23 00 090 450 050 400 080
3 23 01 095 450 025 425 085
9 23 01 10 450 0 450 090
3 23 02 105 450 025 475 095
9 23 02 11 450 050 500 100
3 23 03 450
/ / .
/ / . $. $. $. .
/ / . $. $. $. .
/ / . $. $. .
/ / . $. $. $. .
/ / . $. $. $. .
/ / $. M M M
Effective RateEffective Interest Cost
M
$. $. .
( )
$10
075 525 105
2
Interest Rate Swaps
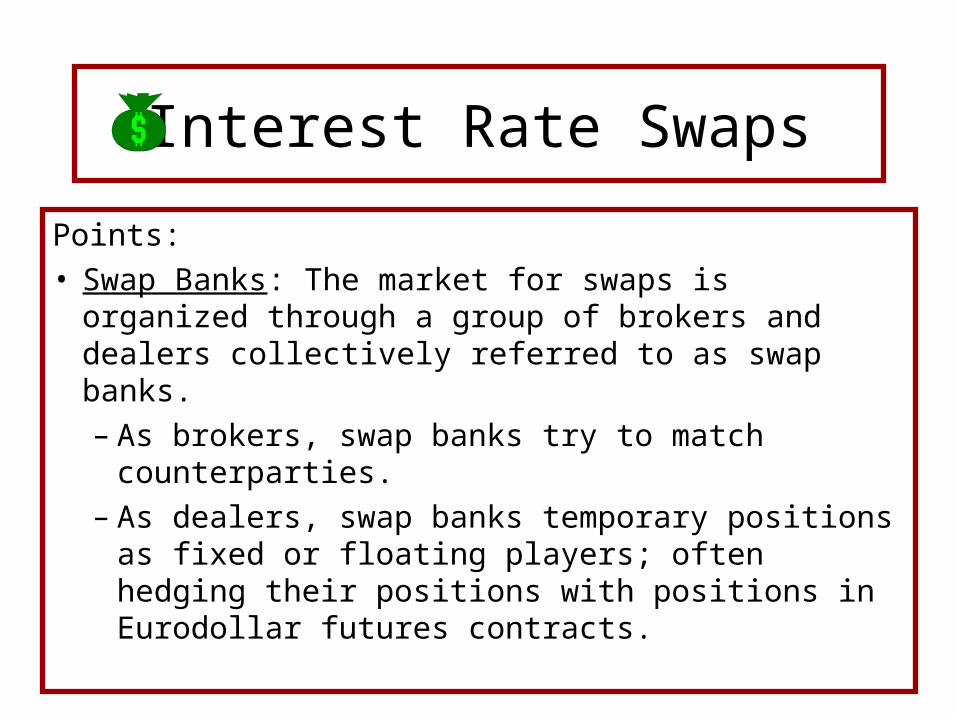
Points:• Swap Banks: The market for swaps is organized
through a group of brokers and dealers collectively referred to as swap banks.– As brokers, swap banks try to match counterparties.– As dealers, swap banks temporary positions as
fixed or floating players; often hedging their positions with positions in Eurodollar futures contracts.

Interest Rate Swaps
Points:
• Closing: Unlike futures positions, closing a swap position prior to maturity can be difficult.
• Alternatives:– Sell Swap.– Enter offsetting swap position.– Hedge with Eurodollar futures.


