26
Debugging for Fuco’s Explanation, tips & trics for debugging in SAP CRM Gert-Jan Stolmeijer, Business Consultant 01-01-2013
Debugging for Fuco’s Explanation, tips & trics for debugging in SAP CRM
Gert-Jan Stolmeijer, Business Consultant
01-01-2013
Table of Contents
Introduction
Debug screen
Debugging
Breakpoints and Watch points
Show and Change Content
Tips & Tricks for efficient debugging
Traces
Find tables and fields
• This training is ment for functional consultants with minimal
ABAP knowledge
• As a prerequisite basic understanding of ABAP coding
(Statements, Tables, Fields, ABAP-OO) is needed
• As a result the consultant should be able to:
– Functional debugging in SAP CRM/SAP ERP and WebUI
– Find and analyse simple problems due to ABAP coding
– Test solutions/specifications with the debugger
– Find tables and fields
Introduction Goal and Result of this training

• Possible scenario’s when debugging is needed:
– SAP CRM generates an error message
– SAP CRM Functionality not working as expected
– A specification is needed with the preferred solution
– A shortdump is generated
– A table entry should be changed
– Finding possible user exit’s (will be handled by Aik)
Introduction Reasons for debugging

Overview debug screen Explanation of the debug screen
ABAP Coding Show variables
Program System variables
Use the tabs to
change the
information visible
Toolbox for screen
changes
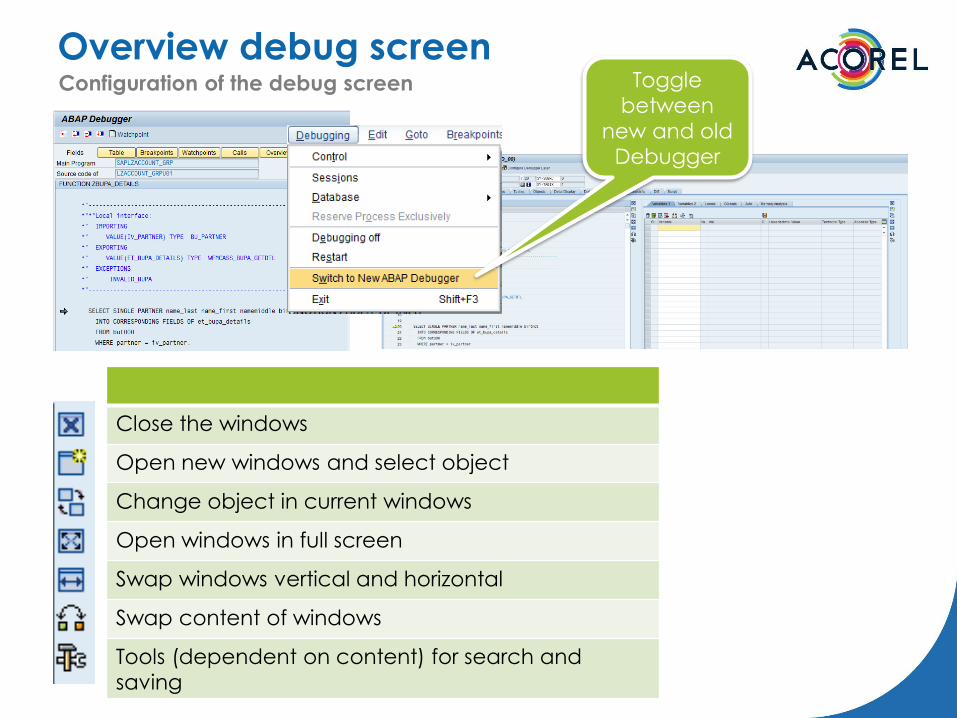
Overview debug screen Configuration of the debug screen
Close the windows
Open new windows and select object
Change object in current windows
Open windows in full screen
Swap windows vertical and horizontal
Swap content of windows
Tools (dependent on content) for search and
saving
Toggle
between
new and old
Debugger
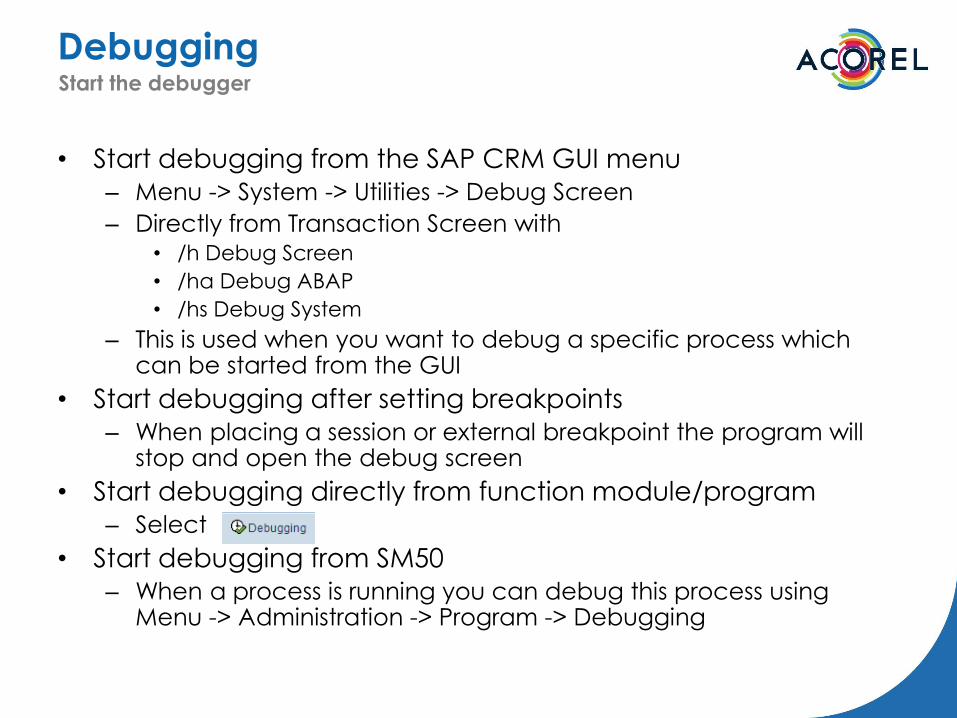
• Start debugging from the SAP CRM GUI menu
– Menu -> System -> Utilities -> Debug Screen
– Directly from Transaction Screen with • /h Debug Screen
• /ha Debug ABAP
• /hs Debug System
– This is used when you want to debug a specific process which can be started from the GUI
• Start debugging after setting breakpoints
– When placing a session or external breakpoint the program will stop and open the debug screen
• Start debugging directly from function module/program
– Select
• Start debugging from SM50
– When a process is running you can debug this process using Menu -> Administration -> Program -> Debugging
Debugging Start the debugger

• Single-Step (F5) – During single step each program line will be visible. When the
program calls another procedure/function module you will jump to the coding of these routines.
• Execute (F6) – During execute each program line will be visible, however the
debugger will stay in the main program and will not jump to a procedure/function module (the actual procedure of function module will be executed with this is not visible).
• Return (F7) – When using return the debugger will jump to a higher level
procedure/function module.
• Run (to Cursor) (F8) – The debugger will continue with the program and stops when the
program is finished or another breakpoint is reached.
Debugging Navigate during debugging
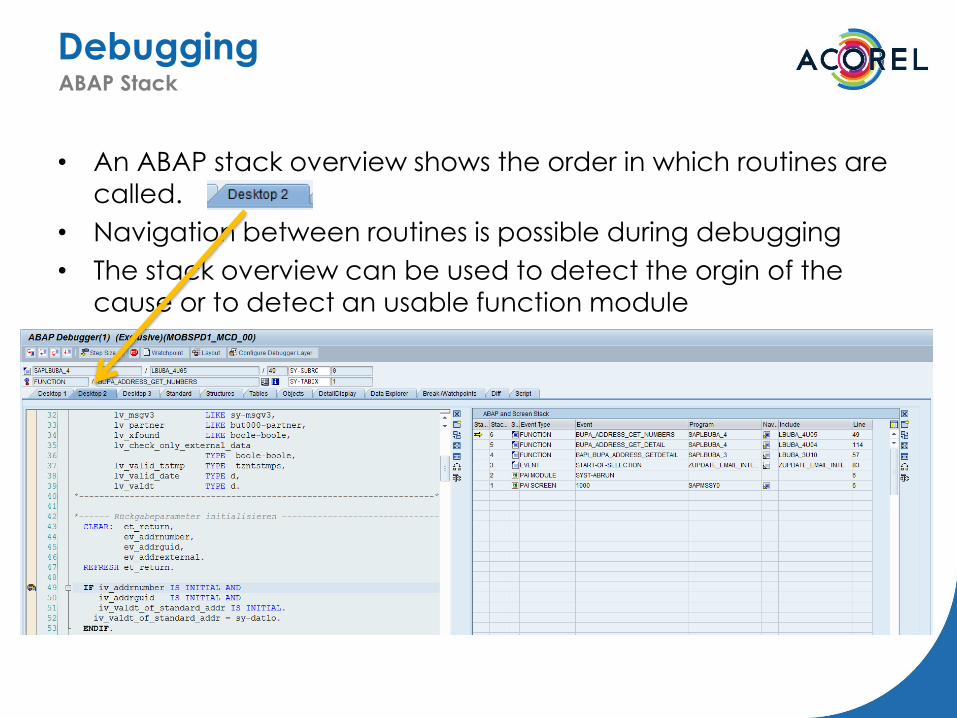
• An ABAP stack overview shows the order in which routines are
called.
• Navigation between routines is possible during debugging
• The stack overview can be used to detect the orgin of the
cause or to detect an usable function module
Debugging ABAP Stack

• On top of the debug screen two system variables are always
visible:
– SY-SUBRC
• 0 means minimal 1 records has been found
• <>0 means a problem occured
– SY-TABIX
• Identifies the record (index) read from the internal table
Debugging System Variables

• In some cases a modal window is available from which
debugging should be enabled
– Create a SAPGUI shortcut of type system command and system
command /h. Drop this shortcut on the modal window
– Create a textfile with following content:
Drop this file on the modal window
Debugging Start debugging from a modal window
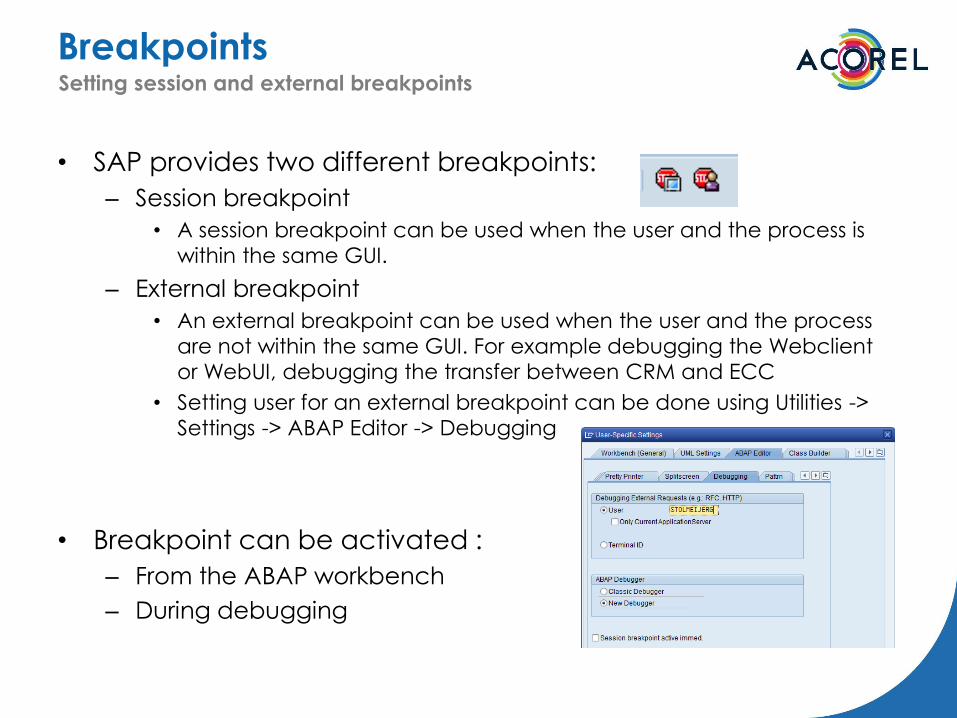
• SAP provides two different breakpoints:
– Session breakpoint
• A session breakpoint can be used when the user and the process is
within the same GUI.
– External breakpoint
• An external breakpoint can be used when the user and the process
are not within the same GUI. For example debugging the Webclient
or WebUI, debugging the transfer between CRM and ECC
• Setting user for an external breakpoint can be done using Utilities ->
Settings -> ABAP Editor -> Debugging
• Breakpoint can be activated :
– From the ABAP workbench
– During debugging
Breakpoints Setting session and external breakpoints
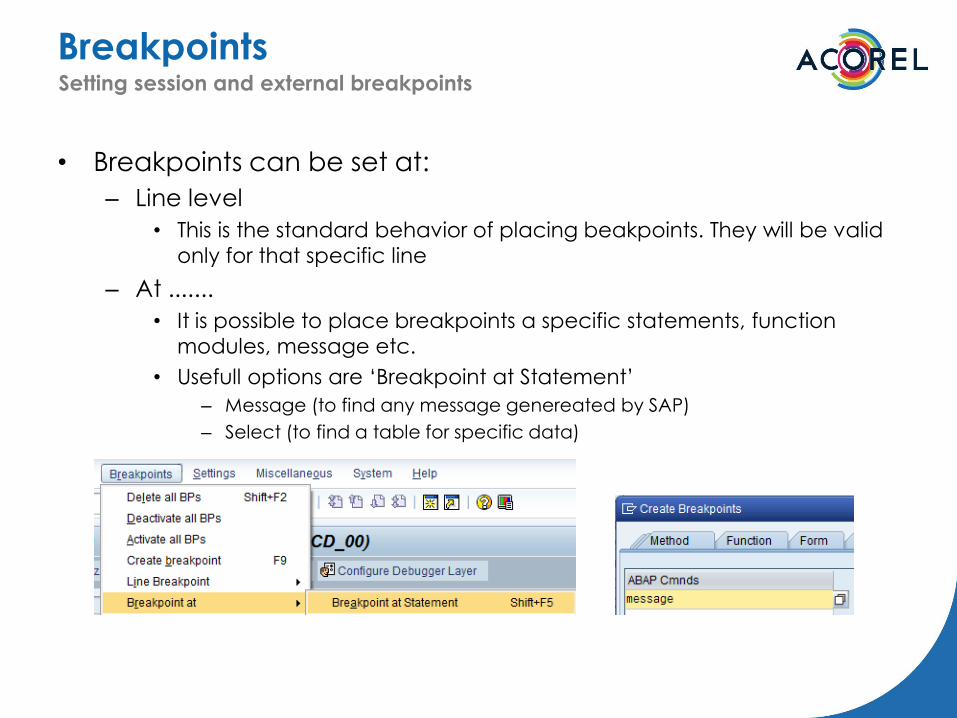
• Breakpoints can be set at:
– Line level
• This is the standard behavior of placing beakpoints. They will be valid
only for that specific line
– At .......
• It is possible to place breakpoints a specific statements, function
modules, message etc.
• Usefull options are ‘Breakpoint at Statement’
– Message (to find any message genereated by SAP)
– Select (to find a table for specific data)
Breakpoints Setting session and external breakpoints
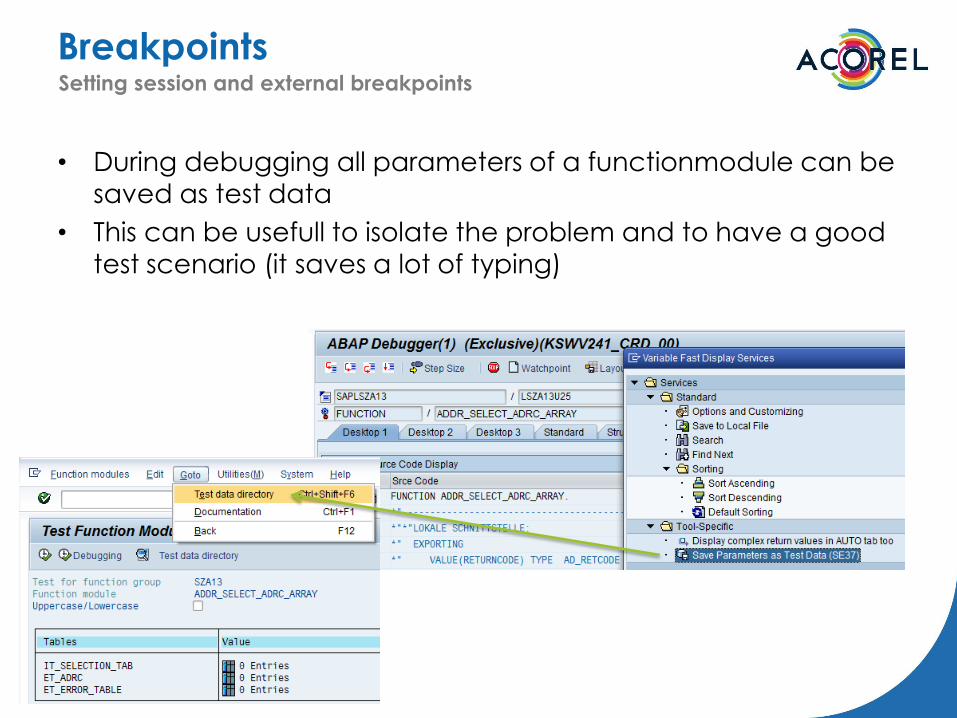
• During debugging all parameters of a functionmodule can be
saved as test data
• This can be usefull to isolate the problem and to have a good
test scenario (it saves a lot of typing)
Breakpoints Setting session and external breakpoints

• All enhancements and badi’s can be found easily using
following tric:
– Start transaction SE24
– Select class CL_EXITHANDLER
– Set a breakpoint at method GET_INTANCE
– Now start the process and check all possible enhancements
Breakpoints Finding enhancements spots

• Watchpoint can be used to stop the program when:
– A specific variable changes
– A specific variable changes to a certain value
• Watchpoints can be helpfull when an error occurs only for a
specific situation or at a certain value.
Watchpoints Setting watchpoints
The variable
changes
The variable
changes to a
certain value

• When SAP generates an (error) message, note down the
message identification
• Enter the program again in debug mode
• Create a watchpoint for variable SY-MSGID with condition SY-
MSGID = ‘<message>’ or
• SY-MSGTY = ‘E’ or ‘W’ or
• SY-MSGNO = ‘012’
Watchpoints Example using watchpoints to check messages

• During debugging variables can be displayed and the
content can be changed
• Double-click on any data element to see the content
Show and Change content Show variables
Data element
is a table
Data element
is a single
variable

• (single) variables can be change using the button
Show and Change content Edit variables

• Table (content) can be changed only on line item
Show and Change content Edit tables
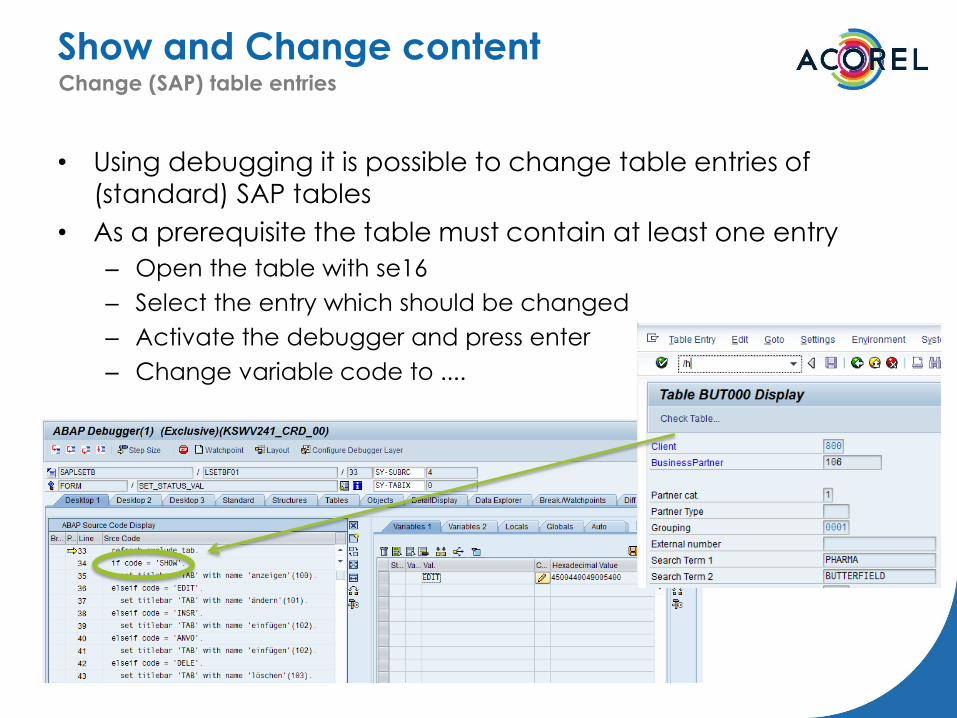
• Using debugging it is possible to change table entries of
(standard) SAP tables
• As a prerequisite the table must contain at least one entry
– Open the table with se16
– Select the entry which should be changed
– Activate the debugger and press enter
– Change variable code to ....
Show and Change content Change (SAP) table entries

• There are different traces available is SAP which can help you
finding the location of the issue.
• The performance tace (transaction ST05) is the most usefull
trace.
• Before the problem occurs:
– Activate the trace
– Simulate the problem
– Deactivate the trace
– Display the trace file
Traces Performance Trace
Always select
SQL and RFC
trace
Activate for
other user or a
specific table
Activate for
current user
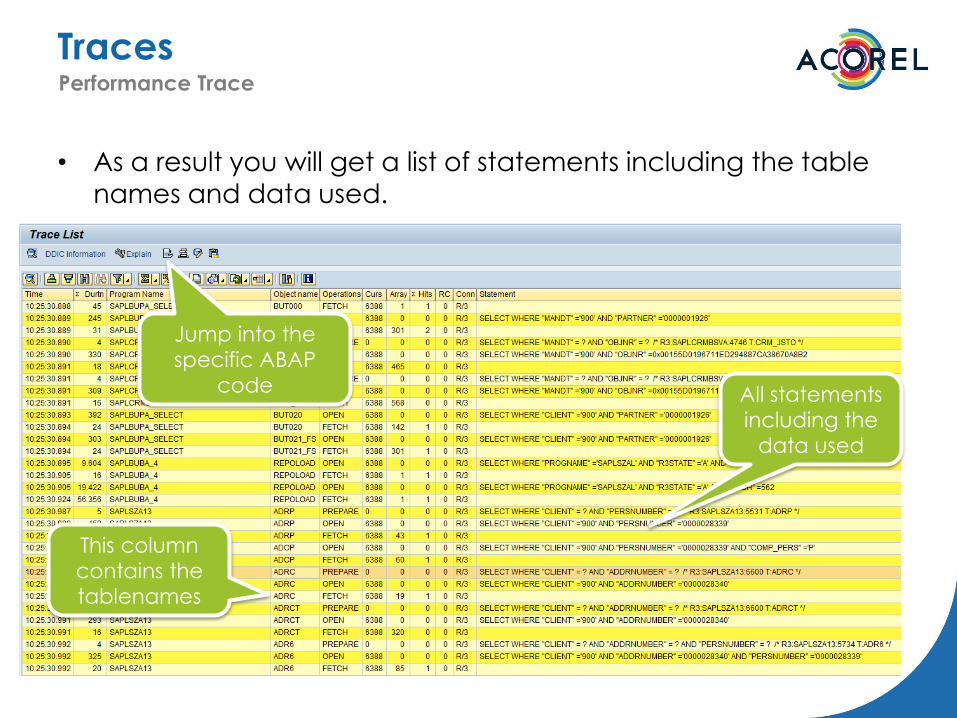
• As a result you will get a list of statements including the table
names and data used.
Traces Performance Trace
This column
contains the
tablenames
All statements
including the
data used
Jump into the
specific ABAP
code
• Always try to minimize the problem for debugging
– For a functional point of view, try to identify what is causing the problem
• Use test data which can be easily recognized during debugging
and tracing
– When simulating the problem use data which can be traced as unique data
• Try to locate the problem using a trace file
– ST05 (based on the tables or function modules used, find the location of the issue)
• Try to locate the problem on subroutine level
– Using debugging with F6 try to find which routine give the wrong result
• Try to isolate the problem
– If the problem can be located at a function module, you can test the function module seperatly
• Compare a working situation with the non working situation
Tips & Trics for efficient debugging Use this workprocedure for efficient debugging

• Debugging the middleware is more difficult, because this process
run mainly on the background
• Following oss notes explains step-be-step how to debug any
middleware issue:
– SAP Note 656823 - FAQ: Tips and tricks for transfer debugging
– SAP Note Number 490932 Data exchange of sales transactions between CRM & R/3
– SAP Note 847964 - CRM Service: Debugging BDOCs to R3
Tips & Trics for efficient debugging Debugging the middleware

ACOREL
Zwanebloemlaan 83
1087 GD Amsterdam
T +31 (0)20 468 7150
F +31 (0)20 468 7151
www.acorel.nl
Follow us on:
Thank you!
Gert-Jan Stolmeijer
Business Consultant
M +31 (0) 6 5799 28 26


