Page 1
H2 at Scale Big Idea Summit April 21, 2016 1
at Scale: Enhance the U.S. energy
portfolio through sustainable use of domestic
resources, improvements in infrastructure, and
increase in grid resiliency.
H2
H2 Utilization
November 16, 2016 Presented by Richard Boardman
Idaho National Laboratory [email protected]
Page 2
Outline
Potential industry demand for hydrogen
Status of high temperature electrolysis (HTE)
Opportunity for nuclear energy
Possible regional implementation strategies
2
H2 Utilization:
Richard Boardman (INL)
Jamie Holladay (PNNL)
Don Anton (SRNL)
Amgad Elgowainy (ANL)
Christopher San Marchi (SNL)
Charles Hanley (SNL)
Colin McMillan (NREL)
Theodore Kruze (ANL)
Mark Ruth (NREL)
Mark Bearden (PNNL)
Bob Hwang (SNL)
Ting He (INL)
Kriston Brooks (PNNL)
Mary Biddy (NREL)
Geo Richards (NETL)
Page 3
World GHG Emission Emissions
Global manufacturing accounts for 40% of total GHG
India and non-OEDC emissions are escalating
Page 4
4
Major U.S. Industrial Hydrogen Users in 2014
Page 5
5
Major U.S. Industrial Hydrogen Users in 2014
Page 6
6
0
50000
100000
150000
200000
250000
300000
350000
400000
450000
500000
550000
600000
U.S. refinery operating capacity in barrels per stream day, as of January 2016
U.S. Oil Refinery Capacity
135 operational refineries
109,000 bpd crude plant
100 tonnes-H2•day-1
554,000 bpd crude plant
500 tonnes-H2•day-1
Page 7
Changing needs of refineries
7
~ 5 million tonnes of hydrogen was supplied to the refinery industry in 2015.
Clean hydrogen sources would reduces GHG emissions 25%.
H2-enriched burners could further reduce GHG emissions 20%.
Solid
Oxide
Electrolysi
s Cell
e-
O2
H2 Recycle
Solid Oxide
Electrolysis
Page 8
Changing needs of refineries
8
~ 5 million tonnes of hydrogen was supplied to the refinery industry in 2015.
Clean hydrogen sources would reduces GHG emissions 25%.
H2-enriched burners could further reduce GHG emissions 20%.
Solid
Oxide
Electrolysi
s Cell
e-
O2
H2 Recycle
Solid Oxide
Electrolysis
Page 9
9
Oil Refinery
CO2 Emitted
3720 tonnes/day
Electricity
28.0 MWe
Crude Oil
109,000 bpd
Steam
531 tonnes/day
Natural Gas
237 tonnes/day
Coal
0.684 tonnes/day
Gasoline
52,300 bpd
Diesel
19,700 bpd
Kerosene
10,400 bpd
Hydrogen
100 tonnes/day
Changing combustion by industry….
As an example: Replace 20% of naturals gas with hydrogen to burn in
refinery steam boilers and fired-heaters would consume
Page 10
10
World Steel Association Steel Report
Primary metals manufacturing accounts for ~15% of
world GHG emissions (8% is from ferrous metals)
95% of these emissions can be voided with clean energy
Page 11
11
World Steel Association Steel Report
Primary metals manufacturing accounts for ~15% of
world GHG emissions (8% is from ferrous metals)
95% of these emissions can be voided with clean energy
Page 12
Iron & Steel Making
12
Iron and steel making employs two interrelated processes:
1) Molten pig iron is produced from iron ore with coke in a Blast Furnace (BF). The Pig
Iron is mixed with scrap metal and refined in a Basic Oxygen Furnace (BOF).
2) Solid metallic iron is produced in a Direct Reduction Iron (DRI). This iron is processed
with scrap metal in an Electric Arc Furnace (EAF) to produce molten steel.
Figure Source: ANSI, Technology Roadmap
Research Program for the Steel
Industry, Final Report,
December 31, 2010
Page 13
Iron & Steel Making
13
Iron and steel making employs two interrelated processes:
1) Molten pig iron is produced from iron ore with coke in a Blast Furnace (BF). The Pig
Iron is mixed with scrap metal and refined in a Basic Oxygen Furnace (BOF).
2) Solid metallic iron is produced in a Direct Reduction Iron (DRI). This iron is processed
with scrap metal in an Electric Arc Furnace (EAF) to produce molten steel.
Figure Source: ANSI, Technology Roadmap
Research Program for the Steel
Industry, Final Report,
December 31, 2010
Page 14
Iron & Steel Making
14
Iron and steel making employs two interrelated processes:
1) Molten pig iron is produced from iron ore with coke in a Blast Furnace (BF). The Pig
Iron is mixed with scrap metal and refined in a Basic Oxygen Furnace (BOF).
2) Solid metallic iron is produced in a Direct Reduction Iron (DRI). This iron is processed
with scrap metal in an Electric Arc Furnace (EAF) to produce molten steel.
Figure Source: ANSI, Technology Roadmap
Research Program for the Steel
Industry, Final Report,
December 31, 2010
H2
Page 15
Direct Recovery Iron
15
DRI Process Development Examples • MIDREX™
• U.S. CO2 Breakthrough Program
• Europe: ULCOS
• Japan: COURSE 50
• Korea: POSCO
• University of Utah (FIT)
BELOW: The ZR Process accepts any
reducing gas source – direct natural
gas, syngas from a coal gasifier, coke
oven gas or H2/CO mixtures.
LEFT: MIDREX™ DRI shaft
furnaces are being installed around
the world to use various reducing
gases and solids
• DRI process technology is no longer considered nascent
• Benefits include: Process intensification; Reduced capital;
Increased energy efficiency: Reduced GHG emissions;
Iron ore concentrates processing`
Page 16
Direct Recovery Iron
16
DRI Process Development Examples • MIDREX™
• U.S. CO2 Breakthrough Program
• Europe: ULCOS
• Japan: COURSE 50
• Korea: POSCO
• University of Utah (FIT)
BELOW: The ZR Process accepts any
reducing gas source – direct natural
gas, syngas from a coal gasifier, coke
oven gas or H2/CO mixtures.
LEFT: MIDREX™ DRI shaft
furnaces are being installed around
the world to use various reducing
gases and solids
• DRI process technology is no longer considered nascent
• Benefits include: Process intensification; Reduced capital;
Increased energy efficiency: Reduced GHG emissions;
Iron ore concentrates processing`
Page 17
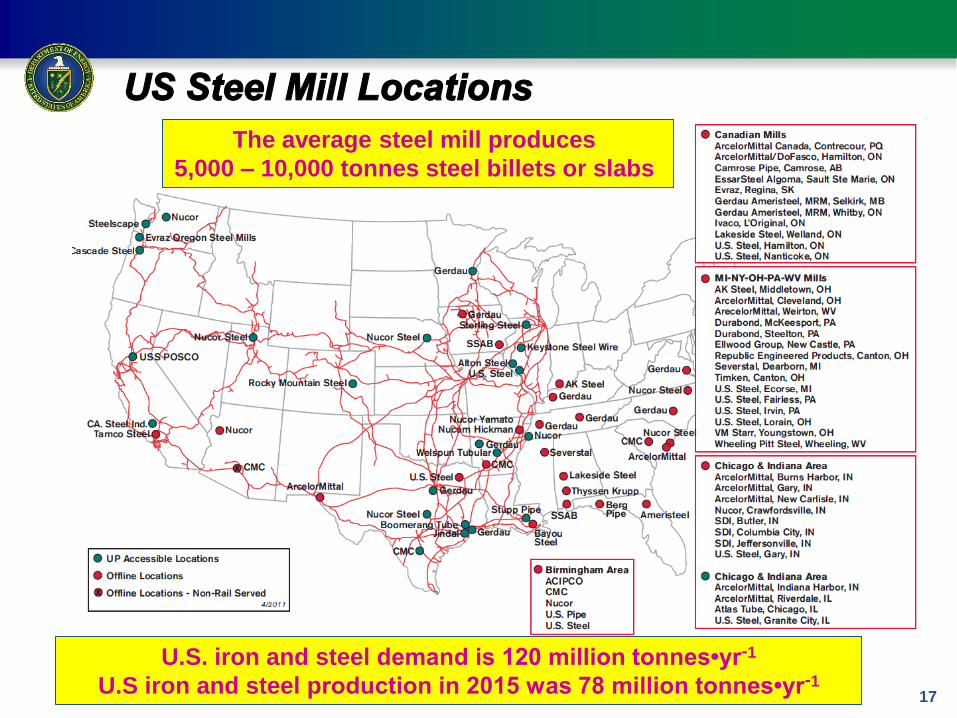
US Steel Mill Locations
17
The average steel mill produces
5,000 – 10,000 tonnes steel billets or slabs
U.S. iron and steel demand is 120 million tonnes•yr-1
U.S iron and steel production in 2015 was 78 million tonnes•yr-1
Page 18
Steelmaking is an
energy intensive
process.
An ideal steel making
process would:
Eliminate the need for
coal and coke
Use domestic iron ores
especially concentrates,
which the U.S. has in
abundance
Replace the high capital
coke oven and blast
furnace
Be capable of
producing 5,000-10,000
so that it can support
the rate of production in
existing steel mills
Steps in the right direction…
Page 19
Top Chemicals / Chemical Feedstock
19
Acetic Acid Acetone Acrylonitrile
Ammonia Base oils-lubes Benzene
Butadiene Ethyl Alcohol Ethylene
Ethylene Glycol Formic Acid Isocynates
Melamine Methanol Oxo-Alcohols
para/ortho-xylenes Phthalic Anhydride Phenol
Polyethylene Polyethlyene Polypropylene
Polystyrene Polyvinyl Chloride Propylene
Styrene Terephthalate Toluene
Fertilizers
Plastics & Resins
Fuels
Synthetic Lubes
Page 20
20
So how many fertilizer plants are there in the United
States? According to the Fertilizer Institute, there are 44 production plants around
the country. And 30 of those are nitrogen plants:
http://www.tfi.org/sites/default/files/images/usproductionmaps%28updated%29.pdf
Page 21
21
New Simplot Rock
Springs Plant in 2016
600 tpd•NH3
New Dyno Noble Louisiana Plant in 2016
2,000 tpd•NH3
Page 22
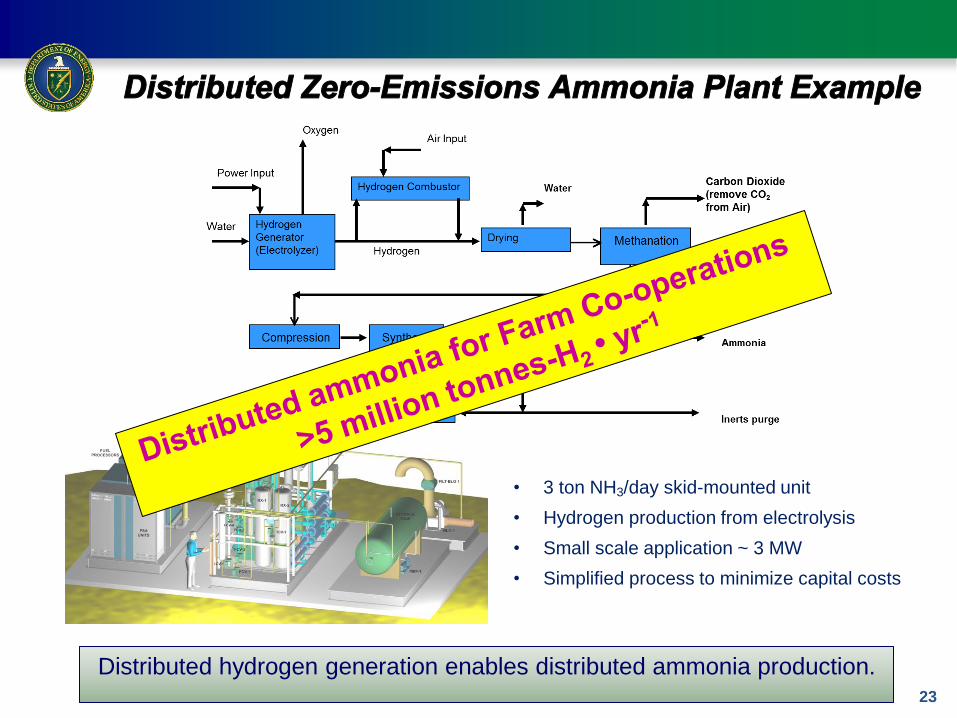
Distributed Zero-Emissions Ammonia Plant Example
22
• 3 ton NH3/day skid-mounted unit
• Hydrogen production from electrolysis
• Small scale application ~ 3 MW
• Simplified process to minimize capital costs
Distributed hydrogen generation enables distributed ammonia production.
Page 23
Distributed Zero-Emissions Ammonia Plant Example
23
• 3 ton NH3/day skid-mounted unit
• Hydrogen production from electrolysis
• Small scale application ~ 3 MW
• Simplified process to minimize capital costs
Distributed hydrogen generation enables distributed ammonia production.
Page 24
Biofuels Upgrading with Clean Hydrogen
Based on PNNL-18284
Rev. 1. (2009)
Production of Gasoline
and Diesel from Biomass
via Fast Pyrolysis,
Hydrotreating and
Hydrocracking: A Design
Case
Zero emissions hydrogen reduces biofuels GHG by 50%.
Page 25
Biofuels Upgrading with Clean Hydrogen
Based on PNNL-18284
Rev. 1. (2009)
Production of Gasoline
and Diesel from Biomass
via Fast Pyrolysis,
Hydrotreating and
Hydrocracking: A Design
Case
Zero emissions hydrogen reduces biofuels GHG by 50%.
Page 26
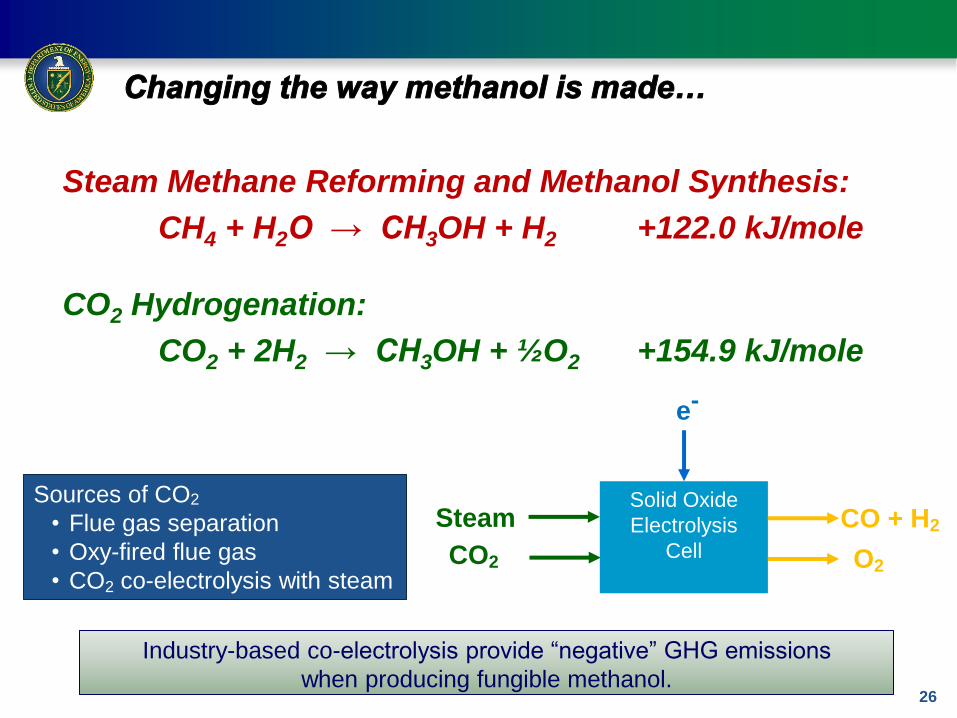
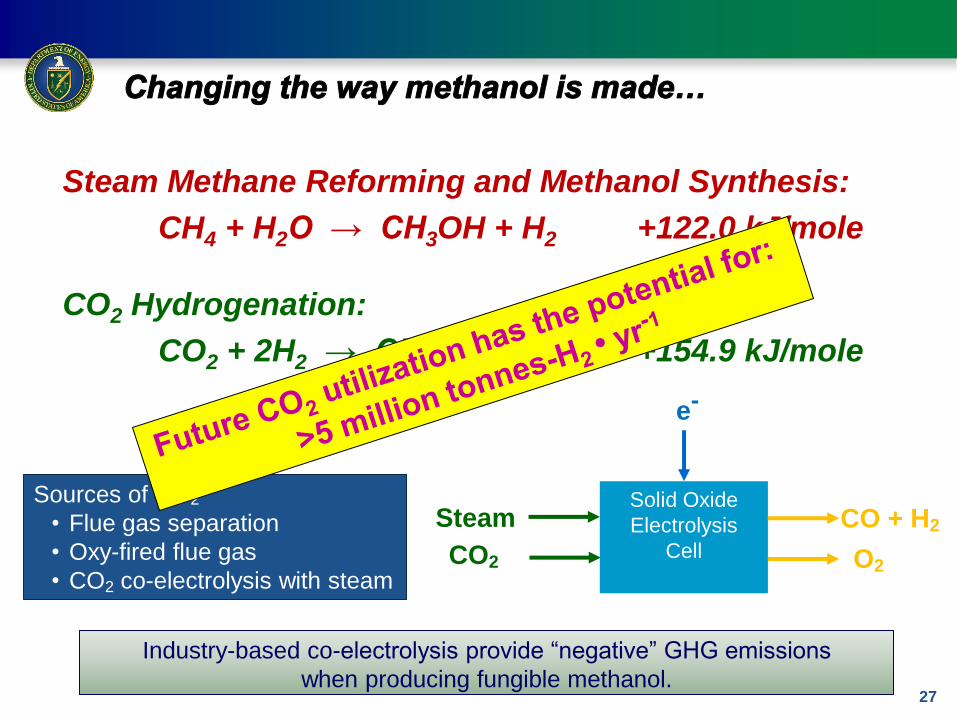
Changing the way methanol is made…
26
Sources of CO2
• Flue gas separation
• Oxy-fired flue gas
• CO2 co-electrolysis with steam
Solid Oxide
Electrolysis
Cell CO2
Steam
e-
CO + H2
O2
Industry-based co-electrolysis provide “negative” GHG emissions
when producing fungible methanol.
Steam Methane Reforming and Methanol Synthesis:
CH4 + H2O → CH3OH + H2 +122.0 kJ/mole
CO2 Hydrogenation:
CO2 + 2H2 → CH3OH + ½O2 +154.9 kJ/mole
Page 27
Changing the way methanol is made…
27
Sources of CO2
• Flue gas separation
• Oxy-fired flue gas
• CO2 co-electrolysis with steam
Solid Oxide
Electrolysis
Cell CO2
Steam
e-
CO + H2
O2
Industry-based co-electrolysis provide “negative” GHG emissions
when producing fungible methanol.
Steam Methane Reforming and Methanol Synthesis:
CH4 + H2O → CH3OH + H2 +122.0 kJ/mole
CO2 Hydrogenation:
CO2 + 2H2 → CH3OH + ½O2 +154.9 kJ/mole
Page 28
0
500
1000
1500
2000
2500
An
nu
al P
J
Fuel Steam Electricity
20.3 ExaJoules Total Energy
U.S. Manufacturing Energy Use in 2010
How much fuel for heating can be
replaced with hydrogen?
Page 31
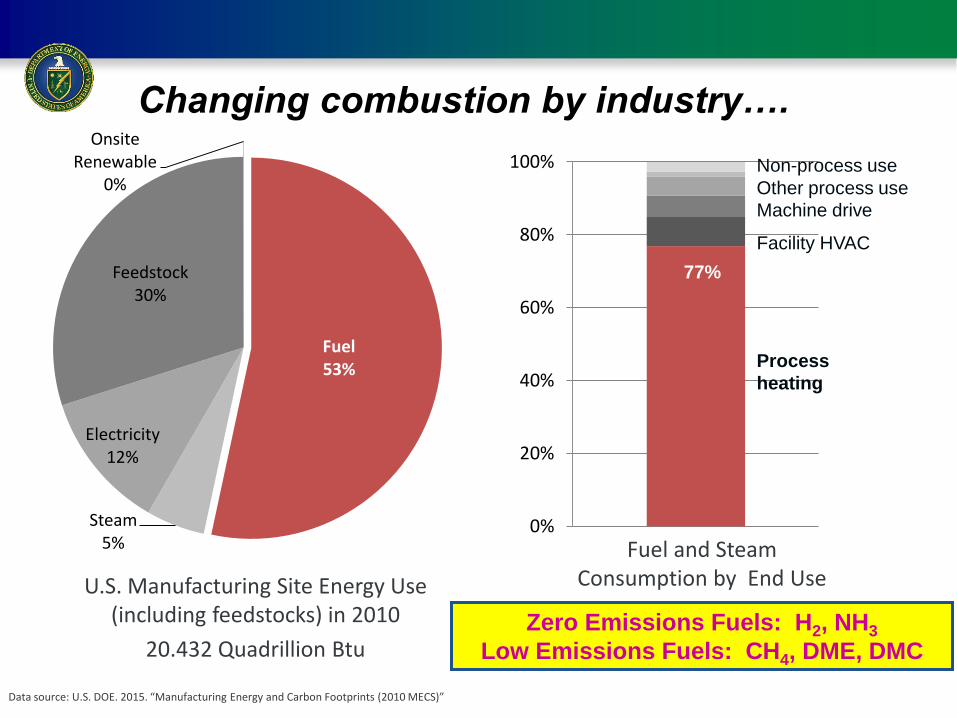
Changing combustion by industry….
Data source: U.S. DOE. 2015. “Manufacturing Energy and Carbon Footprints (2010 MECS)”
U.S. Manufacturing Site Energy Use (including feedstocks) in 2010
20.432 Quadrillion Btu
Fuel53%
Steam5%
Electricity12%
Feedstock30%
Onsite Renewable
0%
0%
20%
40%
60%
80%
100%
Other process use
Facility HVAC
Process
heating
Machine drive
Non-process use
Fuel and Steam Consumption by End Use
77%
Zero Emissions Fuels: H2, NH3
Low Emissions Fuels: CH4, DME, DMC
Page 32
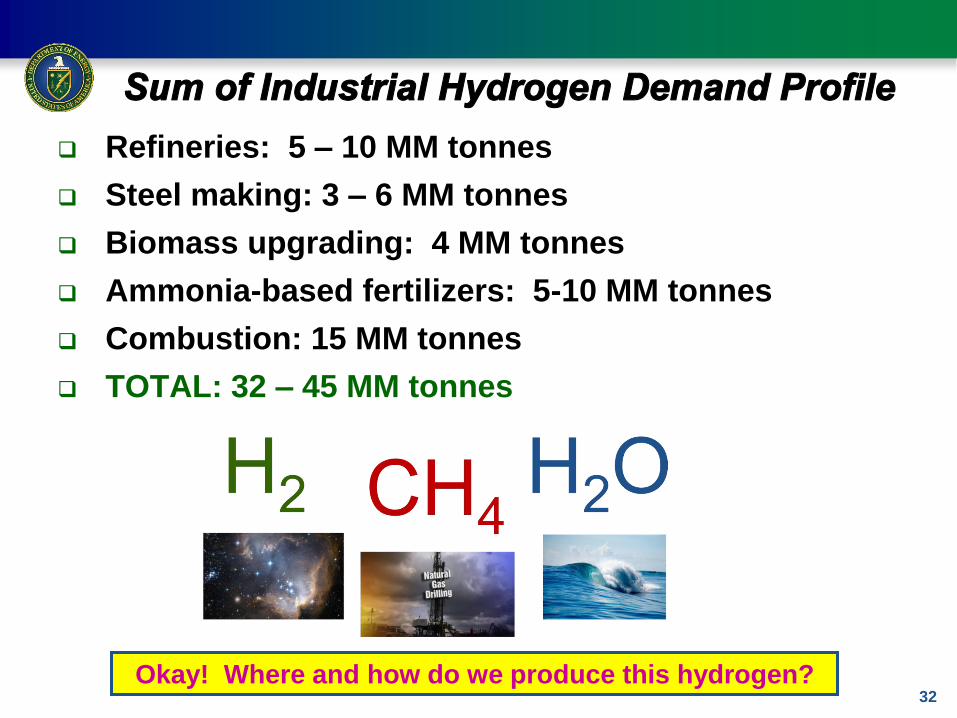
Sum of Industrial Hydrogen Demand Profile
Refineries: 5 – 10 MM tonnes
Steel making: 3 – 6 MM tonnes
Biomass upgrading: 4 MM tonnes
Ammonia-based fertilizers: 5-10 MM tonnes
Combustion: 15 MM tonnes
TOTAL: 32 – 45 MM tonnes
32 Okay! Where and how do we produce this hydrogen?
Page 33
High Temperature Electrolysis (HTE)
33
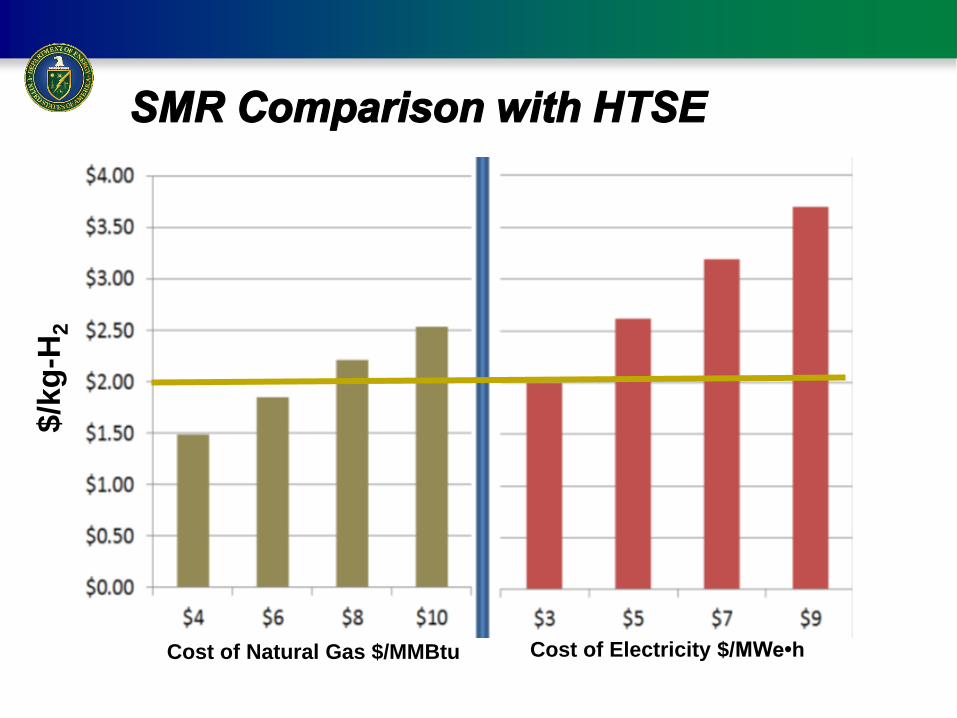
H2A Cost Analysis:
$100/kW Fuel Cell Cost and $30/MWe•h
$1.99/kg•H2
Process
Page 34
Where is the Wind Resource?
Levelized power purchase agreement for
wind by contract size, location and
vintage (DOE-EERE)
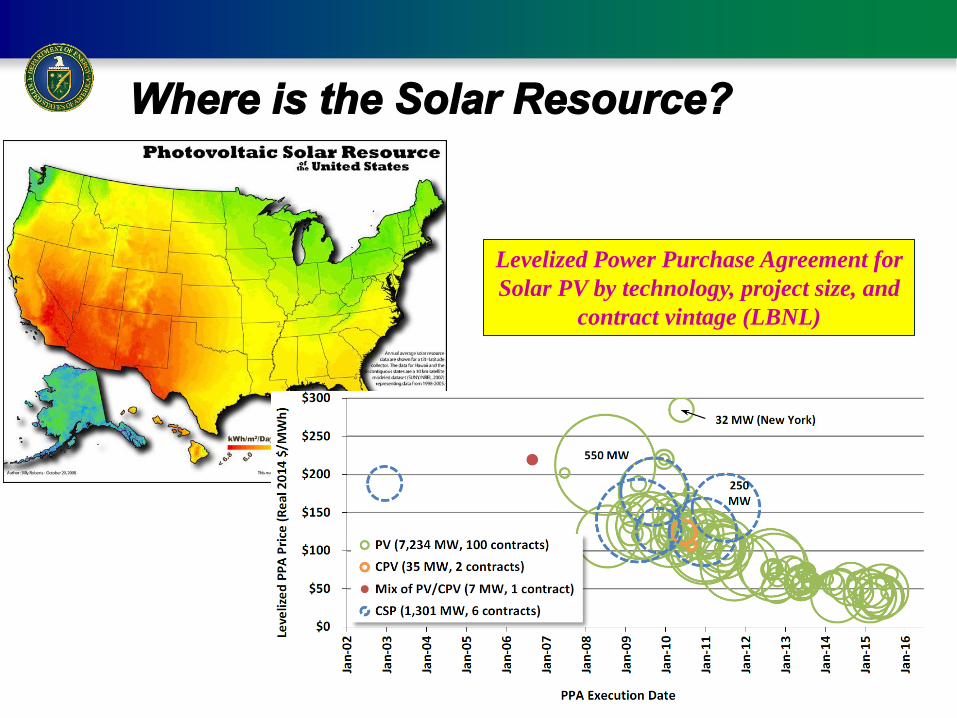
Page 35
Levelized Power Purchase Agreement for
Solar PV by technology, project size, and
contract vintage (LBNL)
Where is the Solar Resource?
Page 36
Actual cost of electricity
production by nuclear plants
in the United States
Nuclear reactors
• 100 plants licensed to
operate
• 20-40 year more operations
with NRC re-certification
Page 37
Actual cost of electricity production by nuclear plants in the United States
Source: L. Davis and C. Hausman, American Economic Journal, Applied Economics, 2016
Market Impacts of a Nuclear Power Plant Closure
Source: L. Davis and C. Hausman, American Economic Journal, Applied Economics, 2016
Market Impacts of a Nuclear Power Plant Closure • 100 plants licensed to operate; 100 reactors 100 GWe Capacity 18 MM tonnes-H2 • yr-1
• 20-40 year extended operation possible with NRC re-certification
Nuclear Energy in the United States
Page 38
Cost of Natural Gas $/MMBtu Cost of Electricity $/MWe•h
$/k
g-H
2
SMR Comparison with HTSE
Annual Energy
Outlook in 2015
Page 39
Cost of Natural Gas $/MMBtu Cost of Electricity $/MWe•h
$/k
g-H
2
SMR Comparison with HTSE
Page 40
40
Where is the population located?
Source: http://geographer-at-large.blogspot.com/
2011/12/map-of-week-12-12-2011us-population.html
Page 41
41
Possible Hydrogen Demand by Region
Iron ore concentrate processing
Source: “http://geographer-at-large.blogspot.com/
2011/12/map-of-week-12-12-2011us-population.html
Page 42
42
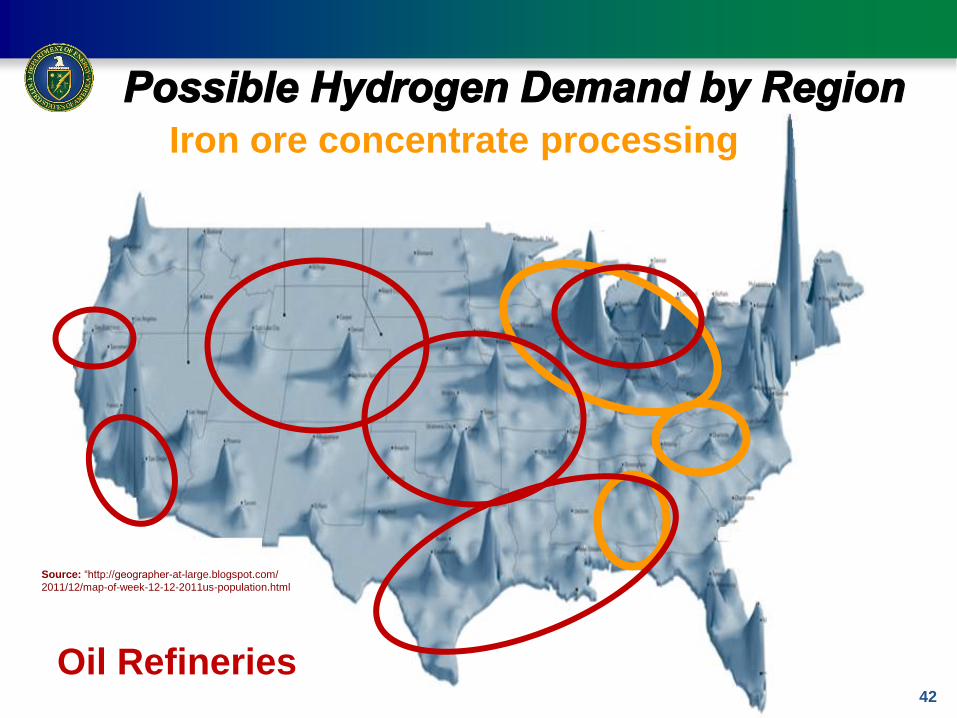
Possible Hydrogen Demand by Region
Iron ore concentrate processing
Oil Refineries
Source: “http://geographer-at-large.blogspot.com/
2011/12/map-of-week-12-12-2011us-population.html
Page 43
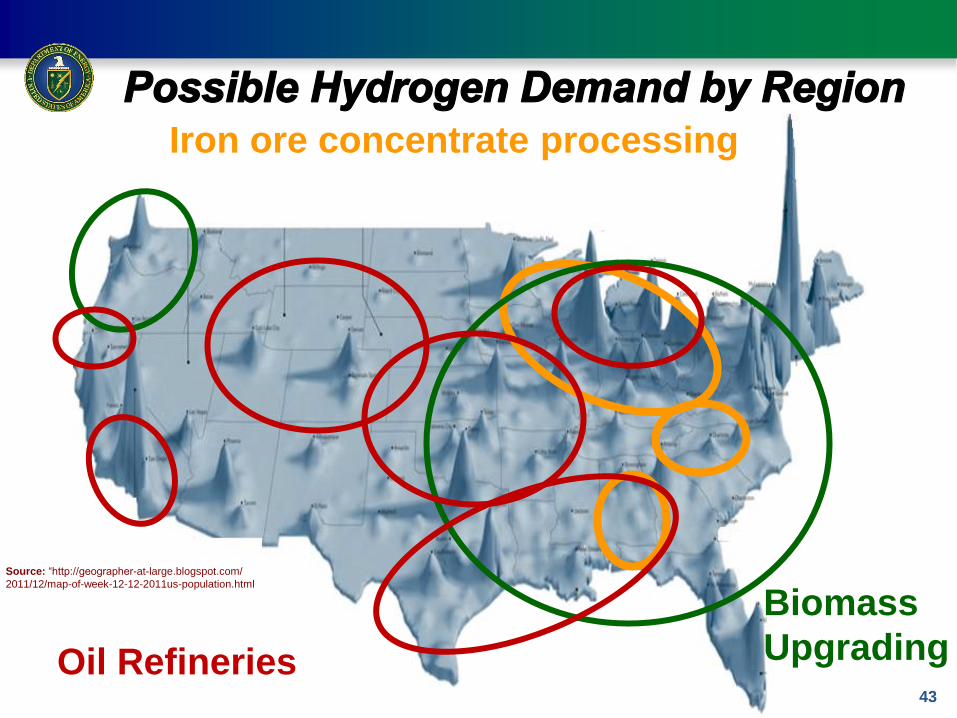
43
Possible Hydrogen Demand by Region
Iron ore concentrate processing
Biomass
Upgrading Oil Refineries
Source: “http://geographer-at-large.blogspot.com/
2011/12/map-of-week-12-12-2011us-population.html
Page 44
44
Possible Hydrogen Demand by Region
Iron ore concentrate processing
Biomass
Upgrading
Ammonia & Combustion processes
Oil Refineries
Source: “http://geographer-at-large.blogspot.com/
2011/12/map-of-week-12-12-2011us-population.html
Page 45
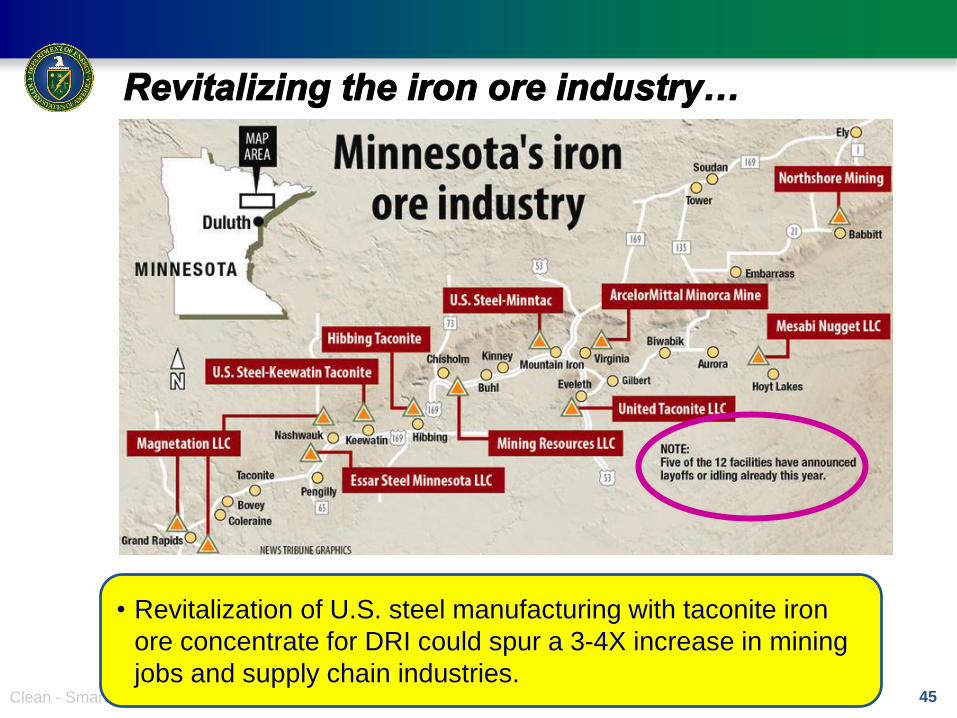
Revitalizing the iron ore industry…
Clean - Smart - Secure 45
• Revitalization of U.S. steel manufacturing with taconite iron
ore concentrate for DRI could spur a 3-4X increase in mining
jobs and supply chain industries.
Page 46
Case Study
Renewable wind penetration of 30% in Midwest
Nuclear plants now cycle up and down 30% on average
– 30% of 100,350 MWe capacity
Hydrogen production potential is 5.5 million tonne H2
Use hydrogen near nuclear plants for:
– Iron ore concentrate processing in Minnesota, Michigan, and Alabama
– Oil refineries along gulf shores
– Chemical plants along Eastern Coast States
– Biorefineies in Southeast
– Fuel cell vehicles on in U.S. Northeast, East, and Upper Midwest
– Combustion processes (Power-2-Gas)
46
Page 47
47
Hydrogen at scale enhances the U.S. energy portfolio through sustainable use of domestic resources, improvements in
infrastructure, and increase in grid resiliency.
Page 48
Clean - Smart - Secure 48
Extra Slides
Page 49
Power Dynamics Create Opportunities to Make Other Products with the Excess Energy
Excess diurnal capacity
Is available year round
Excess seasonal variation
Is available for other work
Renewable power is intermittent
Peaking power is
expensive
“low capital utilization”
Perk
Demand
Page 50
Energy Systems Integration
Thermal
Energy
Fuels
GW-hr Battery
Storage
Electrolysis
O2 H2
Storage
Thermal Energy
Generation
Thermal or
Mechanical Energy
Storage
Consumer
ProductsNatural
Resources
(Gas, Oil, Coal, Biomss Ore)
Conversion Plant
Power GenerationPower Generation
Grid
Wind Farm
Wind Farm
Wind Farm
Electricity
Low
Grade
Thermal
Energy
Replace peaking
reserve with
hybrid baseload
Energy storage
can be reduced
Intermediate H2
and chemicals
can be produced Source: Boardman, Idaho National Laboratory
Clean heat can
be dynamically
maneuvered
for industrial use
Intermittent
renewables
penetration can
be increased
Page 51
Attaining Energy Security
51
Economic
Stability
Environmental
Sustainability
Supply
Security
Resource security (availability and accessibility)
Reduce foreign dependence
Maximize benefit of both fossil fuels and biomass energy crops
Conservation of energy resources
Energy cost affordability and stability
Least external costs
Domestic job creation and maintenance
Balance foreign trade
Increase tax revenues
Maximize available work from renewable wind, solar, geothermal
Stabilize climate
Reduce air and water pollutant discharges
Water resource conservation