U.S. Department of Justice Ofce of Justice Programs Bureau of Justi ce Statistics Bulletin Bureau oJustice Statistics December 2010, NCJ 231675 O n December 31, 2009, state and ederal correctional authorities had jurisdiction over 1,613,740 prisoners, an increase o3,981 prisoners rom yearend 2008 (figure 1). 1 Tis 0.2% increase marked the third consecutive year oslower growth in the U.S. prison population and the smallest increase during the decade.Jurisdiction reers to the legal authority over a prisoner , regardless owhere the prisoner is held. Te slowing in the growth othe total U.S. prison population masked an increase in the ederal prison population (3.4%) during 2009, while the number oprisoners under jurisdiction ostate correctional authorities declined by 0.2%, the first decline in the state prison population since 1977 (figure 2). Te increase in the growth rate othe ederal prison population reflected a shif rom the general pattern odeclining annual growth rates in that population. Te decline in the growth rate othe state prison population during 2009 continued the 3-year trend odeclining annual growth rates or state prisoners. Prisone rs in 2009 Heather C. West, Ph.D. and William J. Sabol, Ph.D. BJS Statisticians, and Sarah J. Greenman, BJS Program AssistantHighlights Te U.S. prison population grew at its slowest rate (0.2%) since 2000, reaching 1,613,740 prisoners at yearend 2009. Prison admissions (down 2.5%) and prison releases (up 2.2%) converged rom 2006 through 2009, slowing the growth othe nation ’ s prison population. Te imprisonment rate—the number osentenced prison- ers per 100,000 U.S. residents—declined or the second straight year, alling to 502 per 100,000 rom 506 per 100,000 in 2007. From 2000 to 2008, the state prison population increased by 159,200 prisoners, and violent offenders accounted or 60% othis increase. Te number odrug offenders in state prisons declined by 12,400 over this period. FIGURE 1 Prisoners under state and federal jurisdiction at yearend, 2000-2009 1,000,000 1,250,000 1,500,000 1,750,000 0.0% 0.5% 1.0% 1.5% 2.0% 2.5% 3.0% Number of prisoners Annual percent change Annual percent change 2009 2008 2007 2006 2005 2004 2003 2002 2001 2000 On December 31 1 Tis number is 84 prisoners higher than reported in the BJS Data Brie, Pris- oners at Yearend 2009: Advance Counts , NCJ 230189, June 2010. BJS permits respondents to update their data to reflect their most accurate counts. -1.0% 0 1.0% 2.0% 3.0% 4.0% 5.0% 6.0% 7.0% 8.0% Federal State 2009 2008 2007 2006 2005 2004 2003 2002 2001 2000 Percent change On December 31 FIGURE 2 Change in the number of prisoners under state and federal jurisdiction, 2000-2009 For a list of publications in this series go to http://www.bjs.gov/index.cfm?ty=pbse&sid=40 Revised 10/27/2011
Transcript
8/13/2019 December 2010, NCJ 231675 Bureau of Justice Statistics Prisoners in 2009
O n December 31, 2009, state and ederal correctionalauthorities had jurisdiction over 1,613,740 prisoners, anincrease o 3,981 prisoners rom yearend 2008(gure 1).1
Tis 0.2% increase marked the third consecutive year o slowergrowth in the U.S. prison population and the smallest increase
during the decade. Jurisdiction re ers to the legal authority over aprisoner, regardless o where the prisoner is held.
Te slowing in the growth o the total U.S. prison populationmasked an increase in the ederal prison population (3.4%) during2009, while the number o prisoners under jurisdiction o statecorrectional authorities declined by 0.2%, the rst decline in thestate prison population since 1977 (gure 2). Te increase inthe growth rate o the ederal prison population reected a shif
rom the general pattern o declining annual growth rates in thatpopulation. Te decline in the growth rate o the state prisonpopulation during 2009 continued the 3-year trend o declining
annual growth rates or state prisoners.
Prisoners in 2009Heather C. West, Ph.D. and William J. Sabol, Ph.D. BJS Statisticians, and Sarah J. Greenman, BJS Program Assistant
Highlights
Te U.S. prison population grew at its slowest rate (0.2%)since 2000, reaching 1,613,740 prisoners at yearend 2009.
Prison admissions (down 2.5%) and prison releases (up2.2%) converged rom 2006 through 2009, slowing thegrowth o the nation’s prison population.
Te imprisonment rate—the number o sentenced prison-ers per 100,000 U.S. residents—declined or the secondstraight year, alling to 502 per 100,000 rom 506 per100,000 in 2007.
From 2000 to 2008, the state prison population increasedby 159,200 prisoners, and violent offenders accounted or60% o this increase. Te number o drug offenders in stateprisons declined by 12,400 over this period.
FIGURE 1
Prisoners under state and federal jurisdiction at yearend, 2000-2009
1,000,000
1,250,000
1,500,000
1,750,000
0.0%
0.5%
1.0%
1.5%
2.0%
2.5%
3.0%Number of prisoners Annual percent change
Annual percent change
2009200820072006200520042003200220012000On December 31
1Tis number is 84 prisoners higher than reported in the BJS Data Brie , Pris-oners at Yearend 2009: Advance Counts , NCJ 230189, June 2010. BJS permitsrespondents to update their data to reect their most accurate counts.
-1.0%
0
1.0%
2.0%
3.0%
4.0%
5.0%
6.0%
7.0%
8.0%
Federal
State
2009200820072006200520042003200220012000
Percent change
On December 31
FIGURE 2
Change in the number of prisoners under state and federal jurisdiction, 2000-2009
For a list of publications in this series go to http://www.bjs.gov/index.cfm?ty=pbse&sid=40
Revised 10/27/2011
8/13/2019 December 2010, NCJ 231675 Bureau of Justice Statistics Prisoners in 2009
Te ederal prison population reached 208,118prisoners at yearend 2009, while state authoritieshad jurisdiction over 1,405,622 prisoners onDecember 31, 2009 (table 1). Te numbero male prisoners, accounting or 93% o allprisoners, increased by 0.3% during 2009, whilethe number o emale prisoners declined by 0.1%.
wenty- our state departments o corrections
reported decreases in their prison populationsduring 2009 (appendix table 1) . Michigan (down3,260) and Cali ornia (down 2,395) reported thelargest declines in absolute numbers, ollowedby New York (down 1,660), Mississippi (down1,272), and exas (down 1,257). Rhode Island(down 9.2%) reported the largest percentagedecrease the state prison population betweenyearend 2008 and yearend 2009, ollowed byMichigan (down 6.7%), Mississippi (down5.6%), and Maryland and Connecticut (down4.6% each).
Among states that experienced declines intheir prison population during 2009, only inNew York, New Jersey, and Maryland did thedecrease continue a longer-term pattern odecline over the 8-year period rom 2000 to2008. Illinois, Michigan, Delaware, and exasalso experienced a decline in their prisonpopulation during 2009, and their growth rates
rom 2000 through 2008 averaged less than one-hal o 1 percent.
Te remaining 26 state departments ocorrections reported increases in their prisonpopulations. Pennsylvania (up 2,214) reportedthe largest increase in absolute numbers,
ollowed by Florida (up 1,527), Louisiana (up1,399), and Alabama (up 1,366). Alaska (up5.4%) reported the largest percentage increasein the state prison population, ollowed by WestVirginia (up 5.1%), Vermont (up 4.9%), andPennsylvania and Alabama (up 4.5% each).
TABLE 1
Prisoners under the jurisdiction of state or federal correctional authorities, December 31, 2000–2009
Year Total Federal State Male FemaleSentenced to more
2008 1,609,759 201,280 1,408,479 1,495,110 114,649 1,547,742 2009 1,613,740 208,118 1,405,622 1,500,278 113,462 1,548,721 Average annual change, 2000–2008 1.8% 4.1% 1.5% 1.8% 2.6% 1.9% Percent change, 2008–2009 0.2 3.4 -0.2 0.3 -1.0 0.1 Note: Jurisdiction refers to the legal authority over a prisoner, regardless of where the prisoner is held.aIncludes prisoners under the legal authority of state or federal correctional officials with sentences of more than 1 year, regardless of whbImprisonment rate is the number of prisoners sentenced to more than 1 year under state or federal jurisdiction per 100,000 U.S. residentestimates are from the U.S. Census Bureau for January 1 of the following year for the yearend estimates.
8/13/2019 December 2010, NCJ 231675 Bureau of Justice Statistics Prisoners in 2009
The imprisonment rate declinedbetween yearend 2008 and 2009
Te U.S. imprisonment rate—the number osentenced prisoners per 100,000 U.S. residents—declined slightly rom 504 to 502 prisoners per100,000 U.S. residents between yearend 2008and 2009 (appendix table 9) . Imprisonmentrates decreased in 28 states during this period,
and increased in 18 states and the ederalsystem. Four states reported little change totheir imprisonment rates during 2009. Alaska(down 73 prisoners per 100,000 U.S. residents)reported the largest decrease in the stateimprisonment rate at yearend 2009; Louisiana(up 28 prisoners per 100,000 U.S. residents)reported the largest increase.
Te decline in the U.S. imprisonment ratestems rom a decline in the imprisonment rate
or state prisoners. Te imprisonment rate or
the ederal prison population increased during2009, reaching 61 per 100,000 U.S. residents(gure 3) .
While the imprisonment rate o sentencedederal prisoners trended upward since 1990,
the rate o increase slowed rom 2000 to 2009.Compared to the increase in the number o
ederal prisoners, the imprisonment rate orthis population has increased more slowlysince 2000. Te number o sentenced prisonersincreased by an average o 4.6% per year rom125,044 in 2000 to 187,886 in 2009. Te ederalimprisonment rate increased by an average o3.4% per year over this period.
By comparison, the imprisonment rate orsentenced state prisoners has declined over thepast 3 years (gure 4). More generally, since2000 the trend in the imprisonment rate orstate prisoners has diverged rom the trend inthe number o state prisoners. Te number ostate prisoners increased by about an averageo 1.3% per year rom 2000 to 2009, but theimprisonment rate or state prisoners increasedonly rom 432 to 442 per 100,000 U.S. residents.Te relative stability in the state imprisonmentrate means that the U.S. resident populationincreased aster than the prison population.
FIGURE 3
Number and imprisonment rate of sentenced prisoners under federal jurisdiction, 1990-2009
0
20,000
40,000
60,000
80,000
100,000120,000
140,000
160,000
180,000
200,000
Sentenced prisoners
20092005200019951990On December 31
Number of sentenced prisoners Imprisonment rate
0
10
20
30
40
50
60
70
Imprisonment rate
700,000
800,000
900,000
1,000,000
1,100,000
1,200,000
1,300,000
1,400,000
Imprisonment rate
Sentenced prisoners
20092005200019951990250
300
350
400
450
500
Imprisonment rateNumber of sentenced prisoners
On December 31
FIGURE 4
Number and imprisonment rate of sentenced prisoners under state
jurisdiction, 1990-2009
8/13/2019 December 2010, NCJ 231675 Bureau of Justice Statistics Prisoners in 2009
Prison admissions and releasesconverged in recent years
During 2009, a total o 730,860 sentencedprisoners were admitted into, and 729,295sentenced prisoners were released rom, thenation’s prisons (table 2). Tough there were
ewer prison admissions (down 13,756) andreleases (down 6,159) reported in 2009 than in2008, prison admissions declined more rapidly(down 1.8%) than releases (down 0.8%).
Te number o state prison admissions during2009 was 16,247 ewer than admitted during2008. As there were 2,491 more admissionsinto ederal prison during 2009 (56,153) thanin 2008 (53,662), the decline in state prisonadmissions accounted or the overall decline inadmissions into U.S. prisons between 2008 and2009.
State prison admissions decreased during2009 (down 2.4%) afer remaining relativelystable rom 2006 through 2008. From 2006through 2008, the annual rate o growthin state prison admissions decreased 0.8%.While the number o state prison admissionsincreased during 2008, the increase in that yearwas comparatively small (1,697 or 0.2%). Incontrast, admissions to ederal prison increasedin both 2008 (up 0.1%) and 2009 (up 4.6%).
From yearend 2006 through 2009, the numbero sentenced prisoners admitted into andreleased rom prison converged (gure 5),slowing the growth o the nation’s prisonpopulation. Tis convergence occurred as thenumber o prison admissions declined 2.5%(down 18,809 admissions) and the numbero prison releases increased 2.2% (up 15,822releases) during the 3-year period.
600,000
650,000
700,000
750,000
800,000
Releases
Admissions
2009200820072006200520042003200220012000On December 31
Number of sentenced prisoners
FIGURE 5 Number of sentenced prisoners admitted into and released from state or federal prison, 2000-2009
TABLE 2
Number of sentenced prisoners admitted into and released from state and federal jurisdiction, 2000–2009Admissions Releases
2009 730,860 56,153 674,707 729,295 50,720 678Average annual change, 2000-2008 2.2% 2.6% 2.2% 2.5% 5.1% Percent change, 2008-2009 -1.8 4.6 -2.4 -0.8 -3.1 Note: Totals based on prisoners with sentences of more than 1 year. Totals exclude transfers, escapes, and those absent without leave (AW
8/13/2019 December 2010, NCJ 231675 Bureau of Justice Statistics Prisoners in 2009
From 2006 through 2008, prison populationgrowth slowed because o declines in admissionsand increases in releases. During 2009, bothadmissions and releases declined and prisonpopulation growth slowed due to a largerdecrease in admissions than releases.
Although small, the 0.8% decrease in thenumber o prisoners released rom state (down
0.7%) and ederal (down 3.1%) prisons during2009 was the rst decline in the number oprison releases since 2000. Te decline in thenumber o prisoners released in 2009 was therst decrease in state prison releases since 2002when releases dropped by 0.4%, and the seconddecrease in ederal prison releases since 2000.
Decline in state prison admissions wasled by a decrease in parole violatorsadmitted in California
Te overall decrease in state prison admissionsduring 2009 (down 16,118) was led by the declinein the number o parole violators admitted tostate prison. Te number o parole violatorsadmitted during 2009 (237,449) was 4.5%
ewer than admitted during 2008. Fewer parole violators (down 11,066 rom the 2008) enteringstate prison in 2009 accounted or more thantwo-thirds (69%) o the total decline in thenumber o state prison admissions during theyear (table 3).2
Te decline in the number o parole violatorsadmitted to state prison during 2009 was therst such decline since 2003, when 9,150 ewerparole violators were admitted than the 207,855admitted during 2002 (gure 6).
Fewer new court commitments to state prisonduring 2009 (down 5,681) continued a longerterm trend o decline in the number o new courtcommitments. 3 Since peaking at 441,606 in 2006,the number o new court commitments into stateprisons has declined or the past 3 years. Te422,910 new court commitments admitted intostate prison during 2009 was 18,696 ewer thanadmitted during 2006, and represented a declineo 1.3% rom the 428,591 admitted during 2008.
Te decrease in new court commitments couldreect court decisions to divert offenders
rom prison, a decline in elony convictions,or a combination o both actors. As o thetime o this report, data were not available todetermine which actors—convictions or prisonsentences—accounted or the decline in newcourt commitments during 2009.
2See Denitions or admission types.3New court commitments include elony offenders sen-tenced to state prison and probation violators enteringprison or the rst time on a violation o a condition o pro-bation. Parole violators include any conditionally releasedprisoners admitted to prison either or a technical violationo the conditions o supervision or or a new crime.
0
100,000
200,000
300,000
400,000
500,000
600,000
700,000
Parole violators
New court commitments
Total
2009200820072006200520042003200220012000On December 31
Number of sentenced prisoners admitted
FIGURE 6
Sentenced prisoners admitted into state prison, by type of admission, 2000-2009
TABLE 3
Number of sentenced prisoners admitted into state prisons, by type of admission,2000-2009 Year Totala New court commitments Parole violatorsb
2000 581,487 350,431 203,5692001 593,838 365,714 215,4502002 613,568 392,661 207,8552003 634,149 399,843 198,7052004 646,830 411,300 219,0332005 676,952 421,426 232,2292006 692,303 441,606 239,4952007 689,257 431,019 247,8512008 690,954 428,591 248,5152009 674,836 422,910 237,449Percent change, 2008-2009 -2.3% -1.3% -4.5%aTotals based on inmates with a sentence of more than 1 year. Totals exclude transfers, escapes, and thoseleave (AWOL).bParole violators include prisoners with revoked parole, other conditional release violators, and intermediimposed in lieu of revocation.
8/13/2019 December 2010, NCJ 231675 Bureau of Justice Statistics Prisoners in 2009
More than hal (29) o the state departmentso corrections reported decreases in prisonadmissions between yearend 2008 and yearend2009 (appendix table 10) . Cali ornia reported adecline o 11,122 admissions in 2009, a decreasethat was almost 4 times greater than any otherstate. Cali ornia’s change in admissions had alarge inuence on the number o state prisonadmissions nationwide, particularly the decreasein the number o admissions to Cali orniastate prisons or parole violations (down 9,668)during 2009. Fewer admissions or parole violations accounted or almost 87% o thedecline in the number o Cali ornia state prisonadmissions, and about 87% o the decline in thenumber o parole violators entering state prisonnationwide during the year.
Excluding Cali ornia, parole violators admittedto state prison would have decreased by 1,398instead o 11,066. Comparatively, ewer new
court commitments to Cali ornia state prisonmade up about a quarter (26%) o the declinein new court commitments to state prisonnationwide. Excluding Cali ornia, the number onew court commitments would have decreasedby 4,227 instead o 5,681 in 2009.
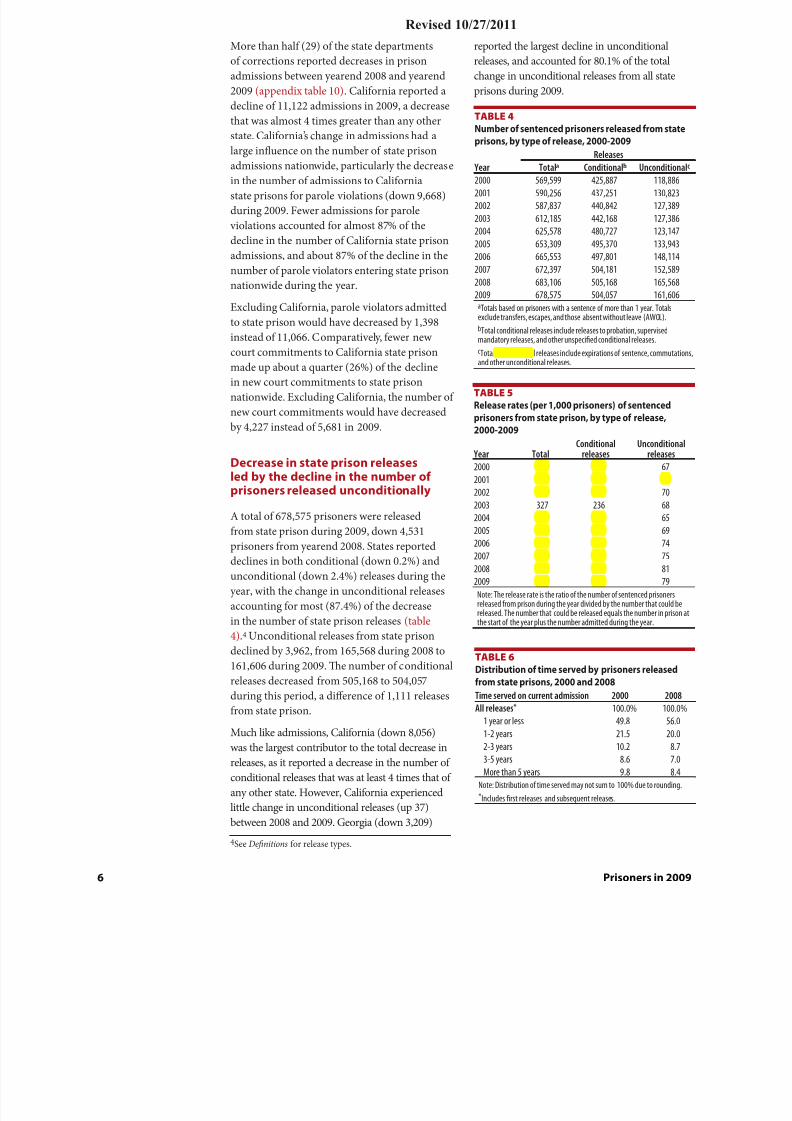
Decrease in state prison releasesled by the decline in the number ofprisoners released unconditionally
A total o 678,575 prisoners were releasedrom state prison during 2009, down 4,531
prisoners rom yearend 2008. States reporteddeclines in both conditional (down 0.2%) andunconditional (down 2.4%) releases during theyear, with the change in unconditional releasesaccounting or most (87.4%) o the decreasein the number o state prison releases (table4).4 Unconditional releases rom state prisondeclined by 3,962, rom 165,568 during 2008 to161,606 during 2009. Te number o conditionalreleases decreased rom 505,168 to 504,057during this period, a difference o 1,111 releases
rom state prison.
Much like admissions, Cali ornia (down 8,056)was the largest contributor to the total decrease inreleases, as it reported a decrease in the number oconditional releases that was at least 4 times that oany other state. However, Cali ornia experiencedlittle change in unconditional releases (up 37)between 2008 and 2009. Georgia (down 3,209)
reported the largest decline in unconditionalreleases, and accounted or 80.1% o the totalchange in unconditional releases rom all stateprisons during 2009.
4See Denitions or release types.
TABLE 4
Number of sentenced prisoners released from stateprisons, by type of release, 2000-2009
Releases Year Totala Conditionalb Unconditionalc
2000 569,599 425,887 118,8862001 590,256 437,251 130,8232002 587,837 440,842 127,3892003 612,185 442,168 127,3862004 625,578 480,727 123,1472005 653,309 495,370 133,9432006 665,553 497,801 148,1142007 672,397 504,181 152,5892008 683,106 505,168 165,5682009 678,575 504,057 161,606aTotals based on prisoners with a sentence of more than 1 year. Toexclude transfers, escapes, and those absent without leave (AWOLbTotal conditional releases include releases to probation, supervisemandatory releases, and other unspecied conditional releases.
cTotal unconditional releases include expirations of sentence, comand other unconditional releases.
TABLE 5
Release rates (per 1,000 prisoners) of sentencedprisoners from state prison, by type of release,2000-2009
Year TotalConditional
releasesUnconditional
releases2000 321 241 672001 328 243 732002 323 242 702003 327 236 682004 329 253 652005 335 254 692006 335 250 742007 331 248 752008 335 248 812009 333 247 79Note: The release rate is the ratio of the number of sentenced prisoreleased from prison during the year divided by the number that coreleased. The number that could be released equals the number in the start of the year plus the number admitted during the year.
TABLE 6
Distribution of time served by prisoners released
from state prisons, 2000 and 2008Time served on current admission 2000 2008All releases* 100.0% 100.0%
1 year or less 49.8 56.01-2 years 21.5 20.02-3 years 10.2 8.73-5 years 8.6 7.0More than 5 years 9.8 8.4
Note: Distribution of time served may not sum to 100% due to ro*Includes rst releases and subsequent releases.
Revised 10/2 7 /2011
8/13/2019 December 2010, NCJ 231675 Bureau of Justice Statistics Prisoners in 2009
Te release rate is the ratio o the number osentenced prisoners released rom prison duringa year, divided by the sum o the start o theyear population o sentenced prisoners plus thenumber o sentenced prisoners admitted duringthe year, and is expressed per 1,000 prisonerswho could be released. Te measure used in this
report includes all types o releases, includingreleases rom new court commitments (so-called rst releases), releases o parole violators,and releases by other means, including deathand other exceptional types o release. Terelease rate gives an indication o turnoverin the prison population and consequentlyo length o stay in prison. As the release rateincreases, the length o stay in prison decreases.
From 2002 through 2005, the total release rateincreased (321 to 337 per 1,000 prisoners),
and afer dipping slightly in 2006 (332 per1,000), it has remained relatively stable through2009 (table 5). Te overall relative stability inthe release rate masks differences by type orelease. From 2006 through 2009, the releaserate or conditional releases (prisoners releasedto some orm o post-prison supervision)was comparatively stable (around 246 per1,000 prisoners), while the release rate orunconditional releases and those whosesentences expired increased slightly. Forunconditional releases, the release rate increased
rom 74 per 1,000 prisoners (in 2006) to 79per 1,000 (in 2009), and or prisoners whosesentences expired, the release rate also increasedslightly rom 67 (in 2006) to 73 per 1,000prisoners (in 2009).
Accompanying the increase in the release rateo state prisoners was a slight change in thedistribution o time served until release romprison. During 2000, about hal o all sentencedoffenders released rom state prison served 1year or less in prison, and 71% served 2 years
or less (table 6).5 By 2008 (the year o the mostrecent detailed BJS data available at the time o
this report), 56% o sentenced offenders releasedrom state prison had served 1 year or less, and
76% had served 2 years or less. As the share oreleased prisoners with shorter lengths o stayincreased, the share o those serving longertime declined. In 2000, about 10% o sentencedprisoners released rom state prison had servedmore than 5 years. Tis percentage declined toabout 8% in 2008.
Violent offenders accounted for 60% ofthe growth in the size of the state prisonpopulation from 2000 through 2008
From 2000 through 2008, the number osentenced offenders in state prison increased by159,200 (table 7).6 At yearend 2008, the numbero offenders sentenced to state prison or a violentoffense reached 715,400, up 95,400 violentoffenders rom 2000. Tis increase accounted
or most (59.9%) o the growth in the numbero sentenced state prisoners during this period,
ollowed by public order offenders (33.6%),primarily those sentenced or a weapons offense.Prisoners sentenced or other offenses—habitualoffender laws not classied in a substantiveoffense category—accounted or 8.6% o thegrowth o the size o the state prison population.Among the major offense categories, the numbero sentenced drug offenders declined duringthis period. Tere were about 12,400 ewer drugoffenders in state prison in 2008 than in 2000.
TABLE 7
Estimated number of sentenced prisoners under state jurisdiction, by offensecategory, 2000 and 2008Offense category 2000 2008 Change, 2000-2008 Percent of total cha
Total 1,206,200 1,365,400 159,200 100.0%Violenta 620,000 715,400 95,400 59.9Propertyb 246,000 251,800 5,800 3.6Drug 263,800 251,400 -12,400 -7.8Public-orderc 72,400 125,900 53,500 33.6Other/unspeciedd 4,100 17,800 13,700 8.6Note: Numbers were estimated and rounded to the nearest 100.aIncludes murder, non-negligent manslaughter, manslaughter, rape, other sexual assault, robbery, assault, offenses.bIncludes burglary, larceny, motor vehicle theft, fraud, and other property crimes.cIncludes weapons, drunk driving, court offenses, commercialized vice, morals and decency offenses, liqand other public-order offenses.dIncludes juvenile offenses and other unspecied offense categories.
5Tis calculation o time served in prison does not includetime served in jail on a sentence.6Offense data or 2008 were the most recent data available atthe time o this report.
8/13/2019 December 2010, NCJ 231675 Bureau of Justice Statistics Prisoners in 2009
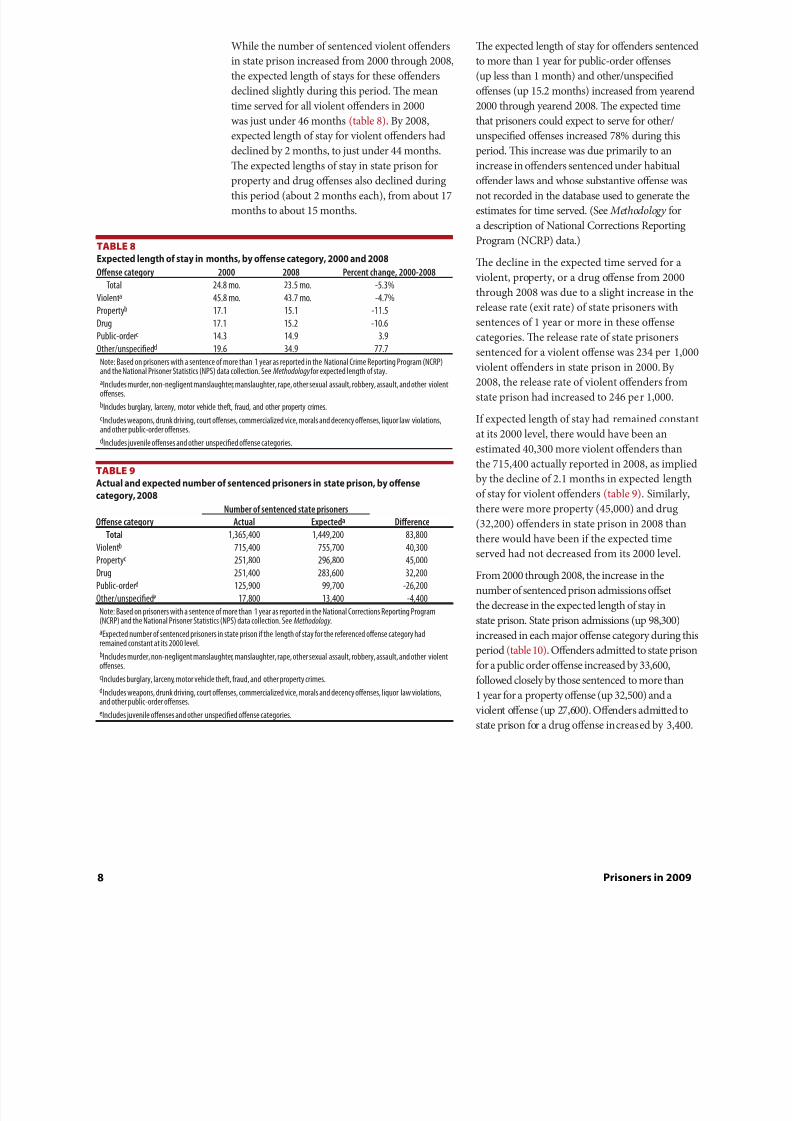
While the number o sentenced violent offendersin state prison increased rom 2000 through 2008,the expected length o stays or these offendersdeclined slightly during this period. Te meantime served or all violent offenders in 2000was just under 46 months (table 8). By 2008,expected length o stay or violent offenders haddeclined by 2 months, to just under 44 months.Te expected lengths o stay in state prison orproperty and drug offenses also declined duringthis period (about 2 months each), rom about 17months to about 15 months.
Te expected length o stay or offenders sentencedto more than 1 year or public-order offenses(up less than 1 month) and other/unspeciedoffenses (up 15.2 months) increased rom yearend2000 through yearend 2008. Te expected timethat prisoners could expect to serve or other/unspecied offenses increased 78% during thisperiod. Tis increase was due primarily to anincrease in offenders sentenced under habitualoffender laws and whose substantive offense wasnot recorded in the database used to generate theestimates or time served. (See Methodology ora description o National Corrections ReportingProgram (NCRP) data.)
Te decline in the expected time served or a violent, property, or a drug offense rom 2000through 2008 was due to a slight increase in therelease rate (exit rate) o state prisoners withsentences o 1 year or more in these offensecategories. Te release rate o state prisoners
sentenced or a violent offense was 234 per 1,000 violent offenders in state prison in 2000. By2008, the release rate o violent offenders romstate prison had increased to 246 per 1,000.
I expected length o stay had remained constantat its 2000 level, there would have been anestimated 40,300 more violent offenders thanthe 715,400 actually reported in 2008, as impliedby the decline o 2.1 months in expected lengtho stay or violent offenders(table 9). Similarly,there were more property (45,000) and drug
(32,200) offenders in state prison in 2008 thanthere would have been i the expected timeserved had not decreased rom its 2000 level.
From 2000 through 2008, the increase in thenumber o sentenced prison admissions offsetthe decrease in the expected length o stay instate prison. State prison admissions (up 98,300)increased in each major offense category during thisperiod (table 10). Offenders admitted to state prison
or a public order offense increased by 33,600,ollowed closely by those sentenced to more than
1 year or a property offense (up 32,500) and a violent offense (up 27,600). Offenders admitted tostate prison or a drug offense increased by 3,400.
TABLE 9
Actual and expected number of sentenced prisoners in state prison, by offensecategory, 2008
Number of sentenced state prisonersOffense category Actual Expecteda Difference
Total 1,365,400 1,449,200 83,800Violentb 715,400 755,700 40,300Propertyc 251,800 296,800 45,000Drug 251,400 283,600 32,200Public-orderd 125,900 99,700 -26,200Other/unspeciede 17,800 13,400 -4,400Note: Based on prisoners with a sentence of more than 1 year as reported in the National Corrections Reporting Program(NCRP) and the National Prisoner Statistics (NPS) data collection. See Methodology .aExpected number of sentenced prisoners in state prison if the length of stay for the referenced offense category hadremained constant at its 2000 level.bIncludes murder, non-negligent manslaughter, manslaughter, rape, other sexual assault, robbery, assault, and other violentoffenses.cIncludes burglary, larceny, motor vehicle theft, fraud, and other property crimes.dIncludes weapons, drunk driving, court offenses, commercialized vice, morals and decency offenses, liquor law violations,
and other public-order offenses.eIncludes juvenile offenses and other unspecied offense categories.
TABLE 8
Expected length of stay in months, by offense category, 2000 and 2008Offense category 2000 2008 Percent change, 2000-2008
19.6 34.9 77.7Note: Based on prisoners with a sentence of more than 1 year as reported in the National Crime Reporting Program (NCRP)and the National Prisoner Statistics (NPS) data collection. See Methodology for expected length of stay.aIncludes murder, non-negligent manslaughter, manslaughter, rape, other sexual assault, robbery, assault, and other violentoffenses.bIncludes burglary, larceny, motor vehicle theft, fraud, and other property crimes.cIncludes weapons, drunk driving, court offenses, commercialized vice, morals and decency offenses, liquor law violations,and other public-order offenses.dIncludes juvenile offenses and other unspecied offense categories.
8/13/2019 December 2010, NCJ 231675 Bureau of Justice Statistics Prisoners in 2009
Decline in admissions during 2009 led tothe decline in state prison population size
During 2009, as admissions decreased, the sizeo the state prison population declined. Teextent to which specic offenses contributed tothis decline cannot yet be determined, becauselength o stay did not contribute to the declinein state prisoners. As indicated by the constant
release rate in 2008 and 2009 (332 per 1,000)expected length o stay did not increase duringthese two years. Consequently, the declinein admissions was due to the decline in stateprisoners.
Selected characteristics of prisonersunder state or federal jurisdiction
From December 31, 2008 through December 31,2009—
Te size o the male prison population in-creased slightly (0.3% or 5,168 prisoners)(appendix table 2) .
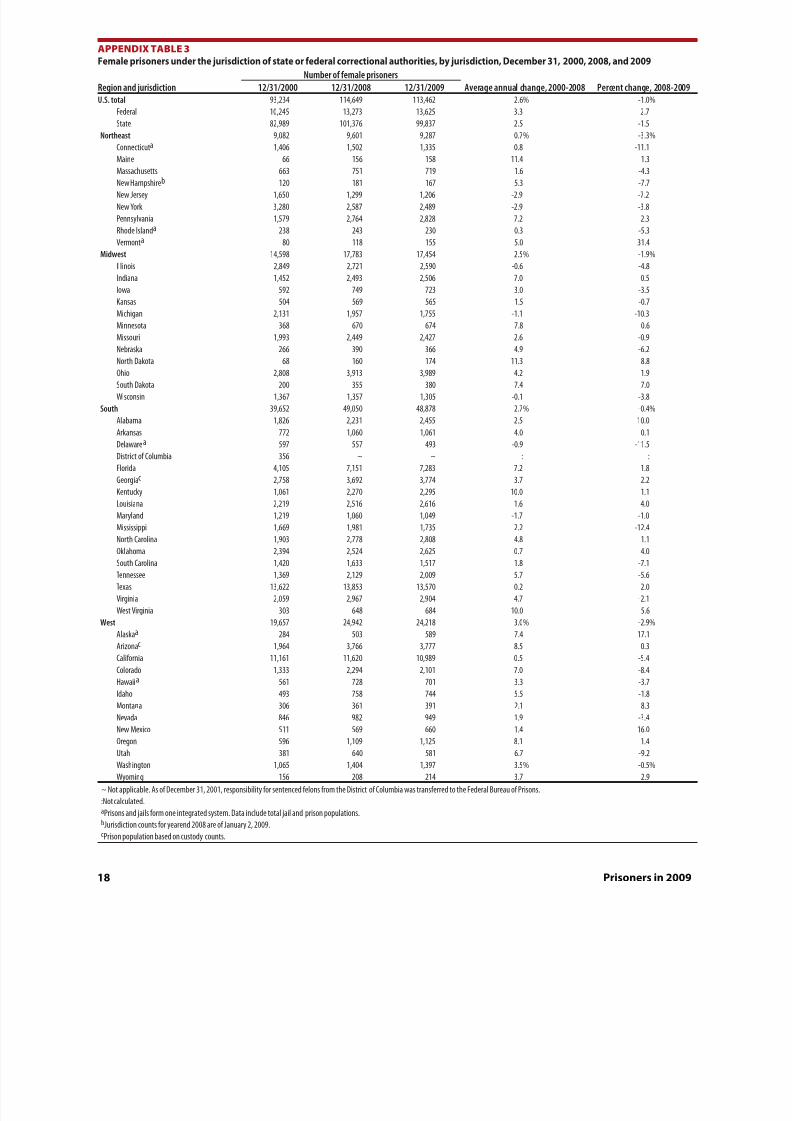
Fewer emales were imprisoned (down 1.0%or 1,187 prisoners) at yearend 2009 than atyearend 2008 (appendix table 3) .
Males had an imprisonment rate (949 per100,000 U.S. residents) that was 14 times higherthan the rate or emales (67 per 100,000)(appendix table 9) .
Black non-Hispanic males had an imprisonmentrate (3,119 per 100,000 U.S. residents) that wasmore than 6 times higher than white non-Hispanic males (487 per 100,000), and almost3 times higher than Hispanic males (1,193 per100,000) (appendix tables 15 and 16) .
One in 703 black emales was imprisoned,compared to about 1 in 1,987 white emalesand 1 in 1,356 Hispanic emales.
Private acilities housed an estimated 8.0%(129,336 prisoners) o the prison population atyearend 2009 (appendix tables 20) .
TABLE 10
Estimated number of admissions into state prison, by offense category, 2000, 2007,and 2008Offense category 2000 2007 2008 Difference, 2000-2
Total 580,900 646,500 679,300 98,300Violenta 157,000 170,200 184,600 27,600Propertyb 169,200 197,800 201,700 32,500Drug 190,700 193,700 194,200 3,400Public-orderc 61,100 80,600 94,700 33,600Other/unspeciedd 2,900 4,100 4,100 1,200Note: Based on prisoners with a sentence of more than 1 year as reported in the National Corrections Rep(NCRP) and the National Prisoner Statistics (NPS) data collection. Number of admissions may not sum trounding. See Methodology .aIncludes murder, non-negligent manslaughter, manslaughter, rape, other sexual assault, robbery, assault, offenses.bIncludes burglary, larceny, motor vehicle theft, fraud, and other property crimes.cIncludes weapons, drunk driving, court offenses, commercialized vice, morals and decency offenses, liquand other public-order offenses.dIncludes juvenile offenses and other unspecied offense categories.
8/13/2019 December 2010, NCJ 231675 Bureau of Justice Statistics Prisoners in 2009
Begun in 1926 under a mandate rom Congress,the National Prisoner Statistics (NPS) programcollects statistics on prisoners at midyear andyearend. Te U.S. Census Bureau serves as thedata collection agent or the Bureau o JusticeStatistics (BJS). BJS depends entirely upon the voluntary participation by state departments ocorrections and the Federal Bureau o Prisons
or NPS data.
Te NPS distinguishes between prisoners incustody and prisoners under jurisdiction. ohave custody o a prisoner, a state or ederalprison must hold that prisoner in one o its
acilities. o have jurisdiction over a prisoner, astate or ederal prison must have legal authorityover that prisoner. Some states are unable to
provide counts that distinguish between custodyand jurisdiction.
Te NPS jurisdiction counts include prisonersserving a sentence within a jurisdiction’s
acilities. Tese acilities include prisons,penitentiaries, correctional acilities, hal wayhouses, boot camps, arms, training or treatmentcenters, and hospitals. Te NPS includesprisoners who are—
temporarily absent (less than 30 days), out tocourt, or on work release
housed in privately operated acilities, local jails, other state or ederal acilities
serving concurrent sentences or more thanone correctional authority.
Te NPS custody counts include all inmatesheld within a respondent’s acilities, includinginmates housed or other correctional acilities.Te custody counts exclude inmates held inlocal jails and in other jurisdictions. Te NPScustody counts include inmates held in privatelyoperated acilities.
Additionally, NPS data include counts o inmatesin combined jail-prison systems in Alaska,Connecticut, Delaware, Hawaii, Rhode Island, andVermont. Te District o Columbia has operatedonly a jail system since yearend 2001. Prisonerssentenced under the District o Columbia criminalcode are housed in ederal acilities. Selectedpreviously published prisoner counts and the
percent population change statistics include DC jail inmates or 2001, the last year o collection.Additional in ormation is provided in the notes tothe tables, where applicable.
BJS allows respondents—state departments ocorrections and the Federal Bureau o Prisons—to update the data previously submitted. Tisreport includes the most recent data reported.
Additional in ormation about the NPS datacollection instrument is available on the BJSwebsite at http://bjs.gov.
Other inmate counts
Federal prisoner data used to calculate race andoffense distributions are obtained rom BJS’Federal Justice Statistics Program (FJSP). TeFJSP obtains its data rom the Federal Bureauo Prisons. Tese data include individual-levelrecords o prisoners in ederal acilities as oSeptember 30. Specically, the FJSP providescounts o sentenced ederal inmates by sex, race,Hispanic origin, and offense.
Estimating age-specic imprisonment rates
Estimates are provided or the number osentenced prisoners under state or ederal jurisdiction by sex. Furthermore, prisoners arecharacterized within sexes by age group, race(non-Hispanic white and non-Hispanic black),and Hispanic origin. Te detailed race andHispanic origin categories exclude estimates opersons identi ying two or more races.
Estimates produced separately or prisonersunder state or ederal jurisdiction werecombined to obtain a total estimated population
or 2000 and 2009. State estimates were preparedby combining in ormation about the sex oprisoners rom the NPS with in ormationreported during inmate interviews on race andHispanic origin in the 2004 Survey o Inmates oState Correctional Facilities.
For the estimates o ederal prisoners, thedistributions o FJSP counts o sentenced ederalprisoners by sex, age, race, and Hispanic originon September 30, 2009, were applied to the NPScounts o sentenced ederal prisoners by sex atyearend 2009.
Estimates o the U.S. resident population orJanuary 1, 2010, by age, sex, race, and Hispanicorigin were generated by applying the December31, 2009, age distributions within sex, race, and
8/13/2019 December 2010, NCJ 231675 Bureau of Justice Statistics Prisoners in 2009
Hispanic origin groups to the January 1, 2010population estimates by sex. Te U.S. CensusBureau provided the population estimates.
Age-specic rates o imprisonment or eachdemographic group were calculated by dividingthe estimated number o sentenced prisonerswithin each age group by the estimated numbero U.S. residents in each age group. Te result
was multiplied by 100,000 and rounded to thenearest whole number. otals by sex include allprisoners and U.S. residents regardless o racialor Hispanic origin. Detailed race and Hispanicorigin imprisonment rates exclude personsidenti ying two or more races.
Calculating admission and release rates
All admission and release rates were calculatedby dividing the number o admitted or releasedprisoners or a particular year by the sentencedpopulation at yearend o the previous year. Teresult was was multiplied by 1,000, and thenrounded to the nearest whole number.
Estimating expected length of stay
Admissions and release data rom the NPSand individual-level time served data romthe National Corrections Reporting Program(NCRP) were used to estimate length o stay.Te NCRP data are administrative data onprisoners entering and exiting custody orsupervision. Tese data are gathered annually
rom all state departments o corrections andparole agencies in about 41 states.
Four separate datasets rom NCRP wereconstructed or the analysis: 2000 and 2008prison release and 2000 and 2008 sentencedprison population (prison stock or stockpopulation). Te prison release datasetsconsisted o data rom 36 states. Due to lowerparticipation rates, the prison stock datasetsconsisted o data rom 24 states. Most o theselected states submitted data during both
2000 and 2008. Data rom adjacent years (1 to2 years afer 2000, or 1 to 3 years be ore 2008)were used to supplement the missing values
or those states that did not submit data duringboth years. wo states, Illinois and Mississippi,did not participate in NCRP between 2004and 2008. Data rom 2003 were drawn tosupplement the missing values in the 2008prison release and prison stock datasets orthese two states.
BJS used a post-stratication weight computedrom NPS and NCRP to adjust the individual-
level NCRP counts to the national totals.Te weight is a ratio o the proportion osentenced prisoners in the sample (NCRP) tothe proportion o sentenced prisoners in thepopulation (NPS). For each state in the NCRP,a post-stratication weight was calculated usingthe ollowing ormula:
W h=(nh.∑h=1
HN h)(N h.∑h=1
Hnh)
-1
In this ormula, h represents the state stratum,w h is the post-stratication weight, n h is thenumber o cases in the stratum in the NCRP,and N h is the number o cases in the stratumin the NPS. Te total number o states or thestratum (h) equals 50 in NPS, 36 in the prisonrelease datasets, and 24 in the prison stockdatasets.
Te method used to estimate the mean lengtho stay in prison was based on the exit rateand adjusts or the growth rate o the prisonpopulation (Patterson and Preston 2008). 7 Tis measure is represented by the ollowingequation, where is the estimator, d is theexit rate o the stable population, r is the growthrate o the prison population, A D is the meanduration at exit, and A P is the mean duration othe stock population:
Estimating the mean length o stay includedseveral steps. First, a post-stratication weightwas calculated and applied to the NCRPdata reported by each state. Te analysis waslimited to inmates with a sentence o morethan 12 months to exclude jail inmates whotypically have shorter sentences. Exit rates (d)
or both years (2000 and 2008) were calculatedby dividing the number o prisoners releasedduring the year by the size o the sentencedprison population reported in the NPS at
yearend. NPS data were also used to estimategrowth in the prison population (r) romyearend 1999 through yearend 2000 and romyearend 2007 to yearend 2008. Weighted data
rom the 36 states in the prison release datasetswere selected to estimate the mean durations atexit (AD) in 2000 and 2008. Similarly, weighted7Evelyn J. Patterson and Samuel H. Preston, 2008. “Estimat-ing Mean Length o Stay in Prison: Methods and Applica-tions,” Journal of Quantitative Criminology , Volume 24,pages 33-49.
8/13/2019 December 2010, NCJ 231675 Bureau of Justice Statistics Prisoners in 2009
data rom the 24 states in the prison stockdatasets were aggregated to estimate the meandurations o the stock population (A P) in 2000and 2008. Lastly, the estimates obtained rom theprevious steps were entered into the estimator tocompute the mean length o stay or the overallprison population in 2000 and 2008.
With the exceptions o the steps taken to calculate
the exit and growth rates, BJS used the aboveprocedures to estimate the mean lengths o stay
or subgroups dened by the 5 main offenseand admission types. For the calculation o theexit rates and growth rates or these subgroups,the percentage o cases in the main offense andadmission categories was obtained rom theweighted NCRP data. Te percentage was appliedto the state population counts in NPS to generategroup totals or prison releases and prisonstock in those categories. Te adjusted grouptotals or prison releases were divided by thecorresponding adjusted totals or the sentencedprison population to calculate the exit rates. Tegrowth rates or 2000 and 2008 were derived romthe changes in the adjusted sentenced prisonpopulations in those categories rom 1999 to 2000and rom 2007 to 2008, respectively.
Te analysis also provided estimates o meanlength o stay and percentage change in length ostay or individual states providing valid prisonrelease and prison stock data to the NCRP either
or 2000 and 2008 or or adjacent years. Te
weighted NCRP data was used to calculate theaverage lengths o time served in 2000 and 2008.State-level prison population data rom the NPSwere used to calculate exit rates and growth rates.
o assess states’ contributions to change in lengtho stay, the overall length o stay in all stateprisons was reestimated by setting the states’ 2008 values in mean time served on current admission,number o prison releases, yearend sentencedprison population, and prison growth at their2000 levels. Te difference between the newestimate and the previous estimate was divided bythe total amount o changes in estimated lengtho stay rom 2000 to 2008 in the overall stateprison population. Te result, when presented inthe orm o percent change, indicates the extentto which the overall estimated length o stay inprison would have risen or allen had the changesin the state rom 2000 to 2008 not occurred.
Prison capacities
State and ederal correctional authorities providethree measures o their acilities’ capacity:design capacity, operational capacity, and ratedcapacity. Estimates o the prison populations asa percentage o capacity are based on a state orFederal Bureau o Prison’s custody population.In general, a state’s capacity and custody counts
exclude inmates held in private acilities. Somestates include prisoners held in private acilitiesas part o the capacity o their prison systems.Where this occurs, prison population as apercent o capacity includes private acilities.
Denitions
Average annual change —arithmetic average(mean) annual change across a specic period.
Conditional releases —Includes releases to
probation, parole, supervised mandatoryreleases, and other unspecied conditionalreleases.
Conditional release violators —admissionsthat include prisoners released by discretionaryparole release, mandatory parole release, releaseto probation, or expiration o sentence withpost-custody supervision.
Custody —the number o inmates held in stateor ederal prisons or local jails, regardless osentence length or authority having jurisdiction.
Design capacity —the number o inmates thatplanners or architects intended or a acility.
Expected length of stay or mean expected timeto be served —an estimate o the amount o timethat offenders admitted into prison can expectto serve prior to release. It differs rom othermeasures o time served that are based solelyon data o offenders released rom prison. Teestimate o mean time to be served takes intoaccount the dynamics o growth in the prisonpopulation. See Methodology.
Highest capacity —the sum o the maximumnumber o beds reported across the threecapacity measures: design capacity, operationalcapacity, and rated capacity.
Revised 10 /27 /2011
8/13/2019 December 2010, NCJ 231675 Bureau of Justice Statistics Prisoners in 2009
Imprisonment rate —the number o prisonersunder state or ederal jurisdiction sentenced tomore than 1 year per 100,000 U.S. residents.
Incarceration rate —see total incarceration rate .
Inmates —individuals held in custody in stateor ederal prisons or in local jails.
Jail—connement acilities usually administered
by a local law en orcement agency, intended oradults, but sometimes holding juveniles, be oreand afer adjudication. Facilities include jailsand city/county correctional centers, special jail
acilities such as medical treatment or releasecenters, hal way houses, work arms, andtemporary holding or lockup acilities that arepart o the jail’s combined unction. Inmatessentenced to jail acilities usually have a sentenceo 1 year or less.
Jurisdiction —the number o prisonersunder the legal authority o state or ederalcorrectional officials, regardless o where theprisoner is held.
Lowest capacity —the sum o the minimumnumber o beds across three capacity measures:design capacity, operational capacity, and ratedcapacity.
Operational capacity —the number o inmatesthat can be accommodated based on a acility’sstaff, existing programs, and services.
Parole violators —admissions that include allconditional release violators returned to prison
or either violation o conditions o release ornew crimes. Some states include prisoners onpost-custody supervision. See Jurisdiction notes.
Prisons —compared to jail acilities, prisonsare longer-term acilities run by a state or the
ederal government, and typically hold elonsand prisoners with sentences o more than 1year. However, sentence length may vary by state.Connecticut, Rhode Island, Vermont, Delaware,Alaska, and Hawaii operate integrated systems,
which combine prisons and jails.Prisoners —individuals conned in correctional
acilities under the legal authority (jurisdiction)o state and ederal correctional officials.
Rated capacity —the number o beds or inmatesassigned by a rating official to institutionswithin the jurisdiction.
Release rate —the number o sentencedprisoners released rom prison during theyear divided by the sum o the start o the yearsentence prisoner population plus the numbero sentenced prisoners admitted during the
year.Sentenced prisoner —a prisoner sentenced tomore than 1 year.
Total incarceration rate —the number oinmates held in custody o state or ederalprisons or in local jails, per 100,000 U.S.residents.
Unconditional release —Includes expirationso sentence, commutations, and otherunconditional releases.
Revised 10 /27 /2011
8/13/2019 December 2010, NCJ 231675 Bureau of Justice Statistics Prisoners in 2009
Alabama —Operational capacity represents physical capacityor inmates but is not based on staffing, programs, and
services.
Alaska —Prisons and jails orm one integrated system. AllNPS data include jail and prison populations housed bothin and out o state. Jurisdiction totals include individuals inelectronic and special monitoring programs.
Arizona —Population counts are based on custody data andinmates in contracted beds.
California —Jurisdiction counts include elons andunsentenced inmates who are temporarily absent ( i.e. housedin local jails, hospitals). Population counts or “unsentencedinmates” include civil addicts who are temporarily absentbecause they are under the Cali ornia Department oCorrections’ jurisdiction and are typically returned to prisonwithin 30 days.
Colorado —Counts include 222 male and 10 emale inmatesin the Youth ul Offender System, which was establishedprimarily or violent juvenile offenders.
Connecticut —Prisons and jails orm one integratedsystem. All NPS data include jail and prison populations.Legislation in July 1995 abolished the capacity law. Tecapacity o a acility is a uid number based upon theneeds o the department. Te needs are dictated by securityissues, populations, court decrees, legal mandates, staffing,and physical plant areas or acilities that are serving otherpurposes or have been decommissioned. Te actual capacity
o a acility is subject to change.Delaware —Prisons and jails orm one integrated system. AllNPS data include jail and prison populations.
Federal Bureau of Prisons —Expirations o sentence includegood conduct releases that usually have a separate anddistinct term o supervision.
Georgia —Counts are based on custody data. Populationcounts exclude an undetermined number o inmates housedin local jails awaiting trans er to prison. Number may notcompare to previous years due to a system conversion.
Hawaii —Prisons and jails orm one integrated systems. AllNPS data include jail and prison populations.
Illinois —Population counts or prisoners with a sentenceo more than 1 year include an undetermined number oprisoners with sentences o 1 year.
Iowa —Te jurisdiction count or December 31, 2009is not comparable to previous years due to a changein measurement. As o 2009, the Iowa Department oCorrections began including the Operating While Intoxicatedpopulation, prisoners on work release, and prisoners housedin out o state prisons. Numbers reported in prior years were
custody numbers.Kansas —Admission and release data or the years 2006through 2009 are not comparable to previous years due tochange in reporting.
Maine —Parole is not valid in the state o Maine. Parolenumbers reect post sentence probation.
Massachusetts —Jurisdiction count excludes approximately4,012, male inmates in local jails and houses o correctionsserving a sentence o more than 1 year. .
Montana —Counts may not be comparable to previous years
due to a change in reporting.
New Jersey —Jurisdiction counts or prisoners with sentenceso more than 1 year include prisoners with sentences o 1 year.
North Carolina —Standard operational capacity is equal toone inmate per cell or 50 square eet per inmate in a dormitorysetting.
Ohio —Population counts or prisoners with a sentenceo more than 1 year include an undetermined number oprisoners with sentences o 1 year or less.
Oklahoma —Population counts or inmates with sentenceso less than a year consist mainly o offenders ordered by thecourt to the Delayed Sentencing Program or Young Adultspursuant to 22 O.S. 996 through 996.3.
Oregon —Counts include an undetermined number oinmates with sentences o a year or less. County authoritiesretain jurisdiction over the majority o these types o inmates.
Rhode Island —Prisons and jails orm one integrated system.All NPS data include jail and prison populations.
Vermont —Prisons and jails orm one integrated system. AllNPS data include jail and prison populations.
Wisconsin —Te population decline rom yearend 2008through yearend 2009 may reect the initiation o earnedrelease policies. Te decline in admissions reects the impacto the truth-in-sentencing.
Revised 10 /27 /2011
8/13/2019 December 2010, NCJ 231675 Bureau of Justice Statistics Prisoners in 2009
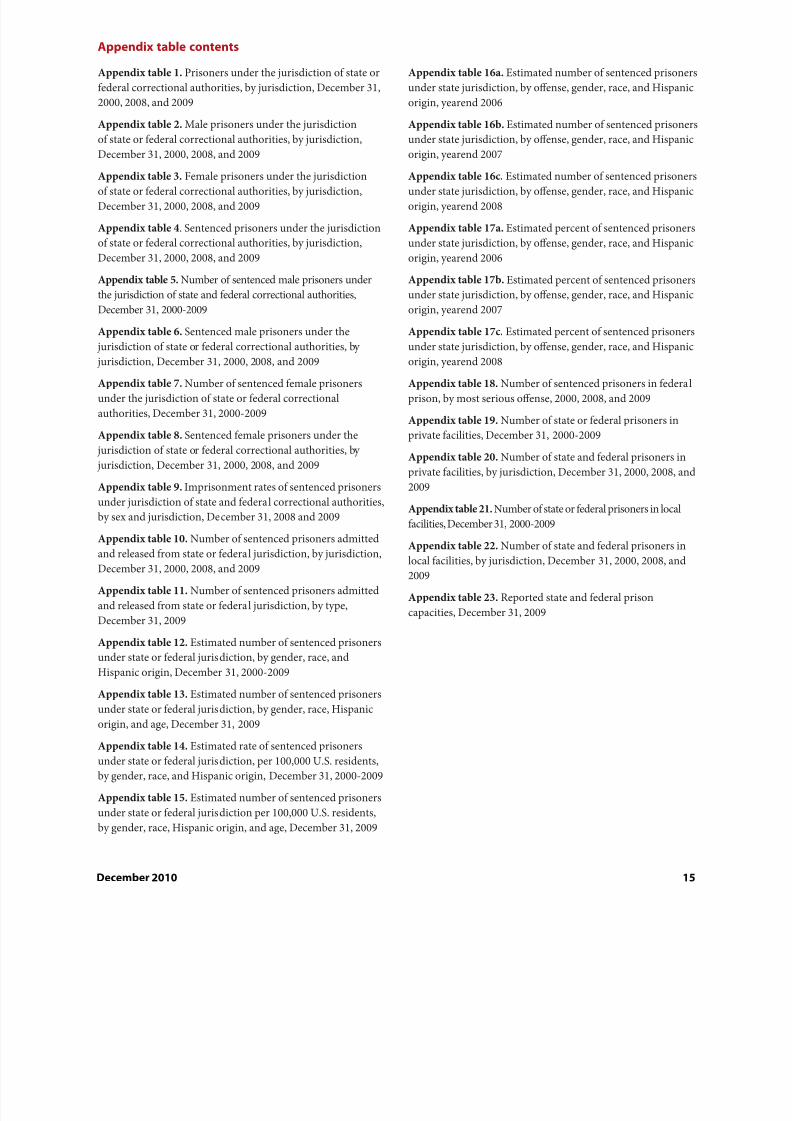
Appendix table 1. Prisoners under the jurisdiction o state orederal correctional authorities, by jurisdiction, December 31,
2000, 2008, and 2009
Appendix table 2. Male prisoners under the jurisdictiono state or ederal correctional authorities, by jurisdiction,December 31, 2000, 2008, and 2009
Appendix table 3. Female prisoners under the jurisdictiono state or ederal correctional authorities, by jurisdiction,December 31, 2000, 2008, and 2009
Appendix table 4 . Sentenced prisoners under the jurisdictiono state or ederal correctional authorities, by jurisdiction,December 31, 2000, 2008, and 2009
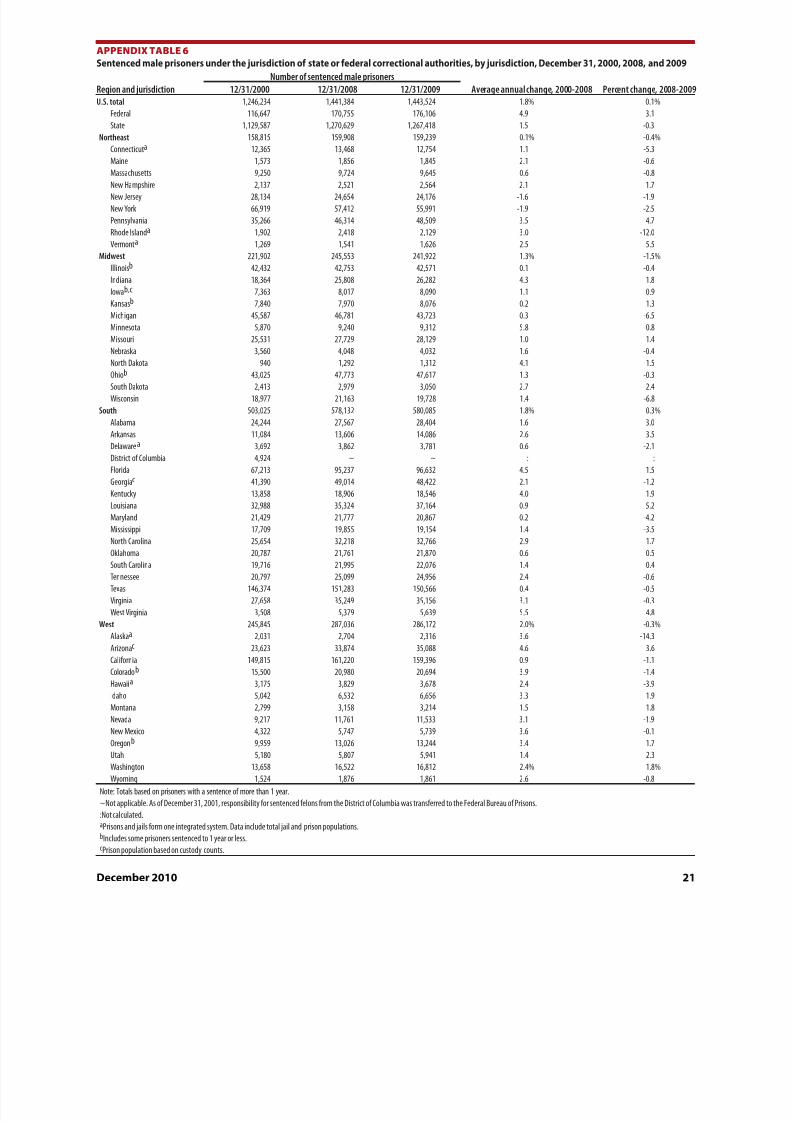
Appendix table 5. Number o sentenced male prisoners underthe jurisdiction o state and ederal correctional authorities,December 31, 2000-2009
Appendix table 6. Sentenced male prisoners under the
jurisdiction o state or ederal correctional authorities, by jurisdiction, December 31, 2000, 2008, and 2009
Appendix table 7. Number o sentenced emale prisonersunder the jurisdiction o state or ederal correctionalauthorities, December 31, 2000-2009
Appendix table 8. Sentenced emale prisoners under the jurisdiction o state or ederal correctional authorities, by jurisdiction, December 31, 2000, 2008, and 2009
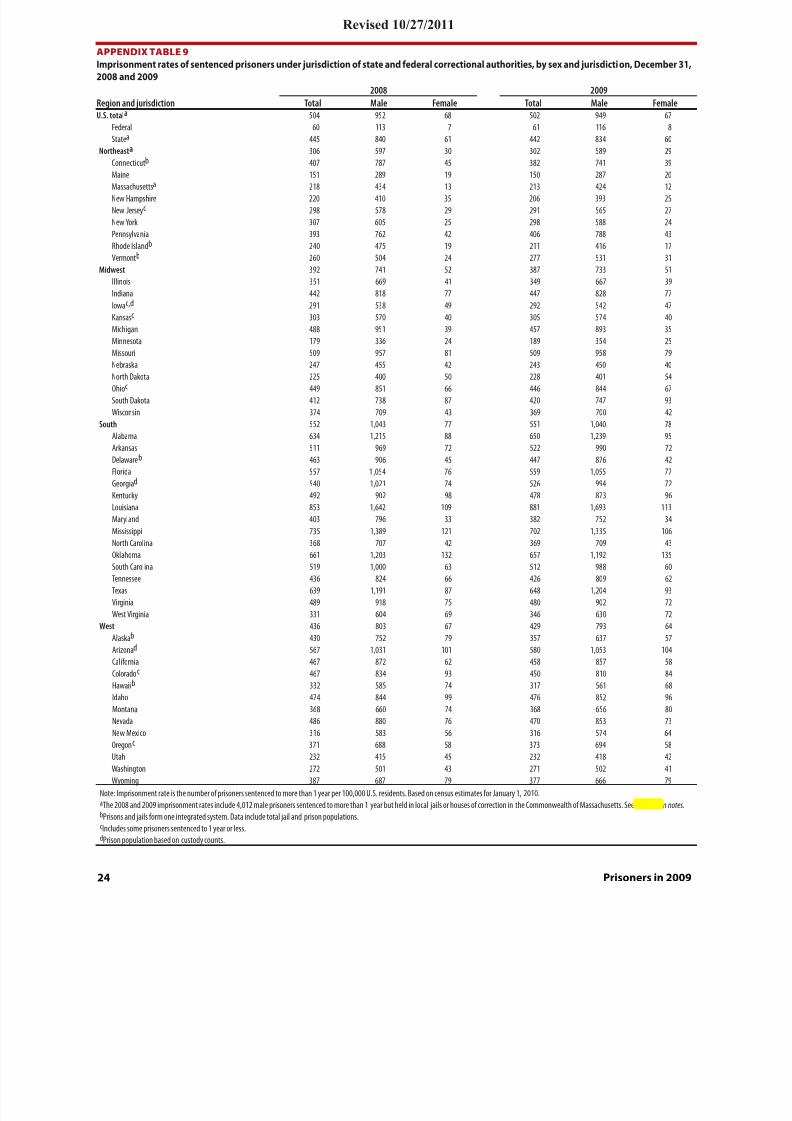
Appendix table 9. Imprisonment rates o sentenced prisonersunder jurisdiction o state and ederal correctional authorities,by sex and jurisdiction, December 31, 2008 and 2009
Appendix table 10. Number o sentenced prisoners admittedand released rom state or ederal jurisdiction, by jurisdiction,December 31, 2000, 2008, and 2009
Appendix table 11. Number o sentenced prisoners admittedand released rom state or ederal jurisdiction, by type,December 31, 2009
Appendix table 12. Estimated number o sentenced prisonersunder state or ederal jurisdiction, by gender, race, andHispanic origin, December 31, 2000-2009
Appendix table 13. Estimated number o sentenced prisonersunder state or ederal jurisdiction, by gender, race, Hispanicorigin, and age, December 31, 2009
Appendix table 14. Estimated rate o sentenced prisonersunder state or ederal jurisdiction, per 100,000 U.S. residents,by gender, race, and Hispanic origin, December 31, 2000-2009
Appendix table 15. Estimated number o sentenced prisonersunder state or ederal jurisdiction per 100,000 U.S. residents,by gender, race, Hispanic origin, and age, December 31, 2009
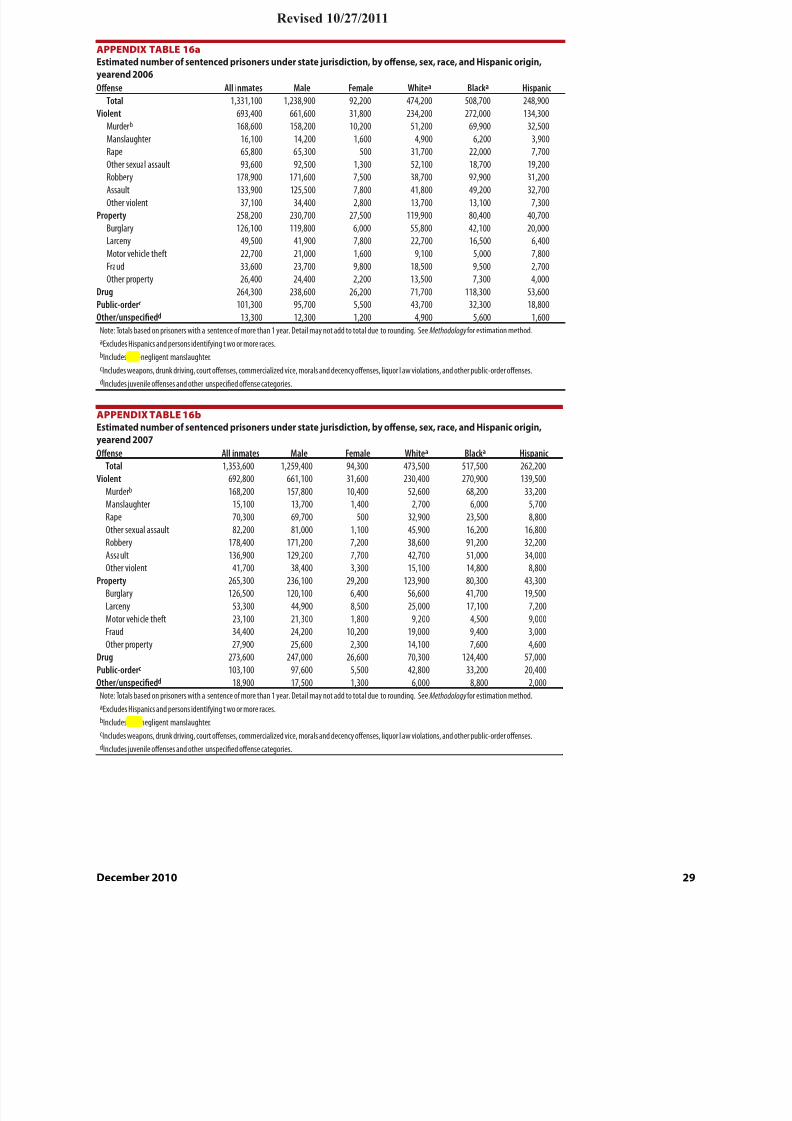
Appendix table 16a. Estimated number o sentenced prisonersunder state jurisdiction, by offense, gender, race, and Hispanicorigin, yearend 2006
Appendix table 16b. Estimated number o sentenced prisonersunder state jurisdiction, by offense, gender, race, and Hispanicorigin, yearend 2007
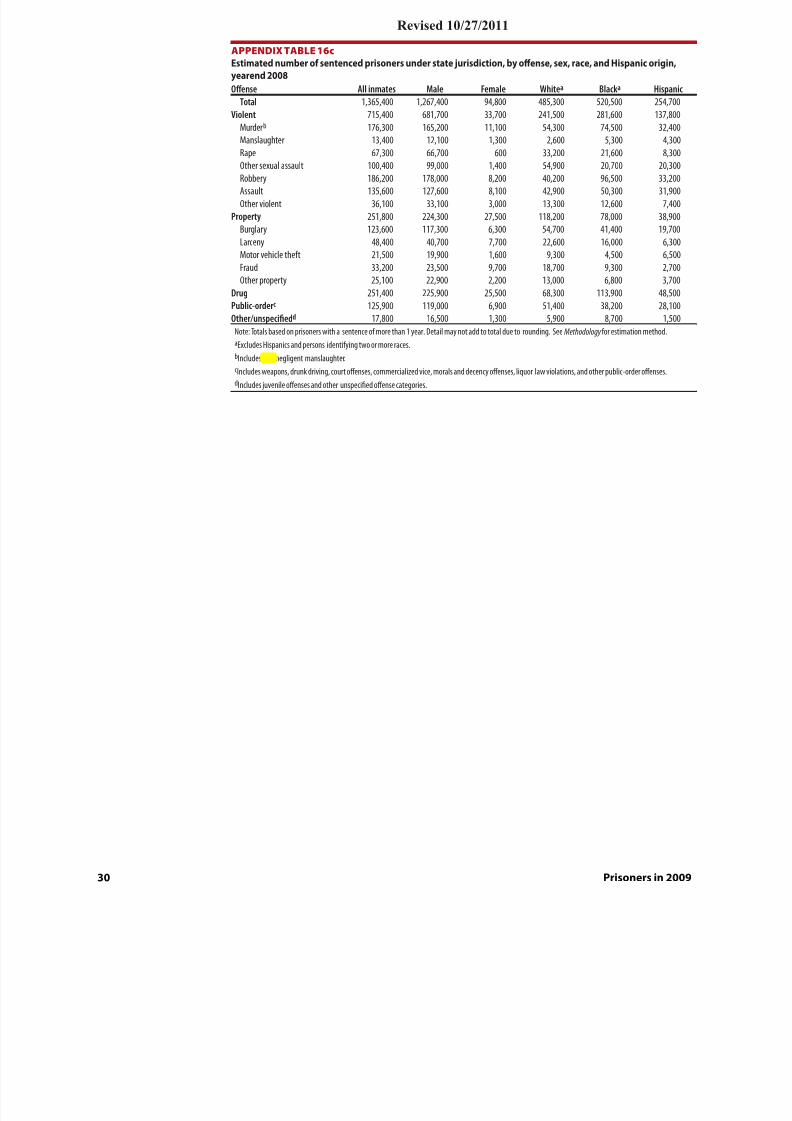
Appendix table 16c. Estimated number o sentenced prisonersunder state jurisdiction, by offense, gender, race, and Hispanicorigin, yearend 2008
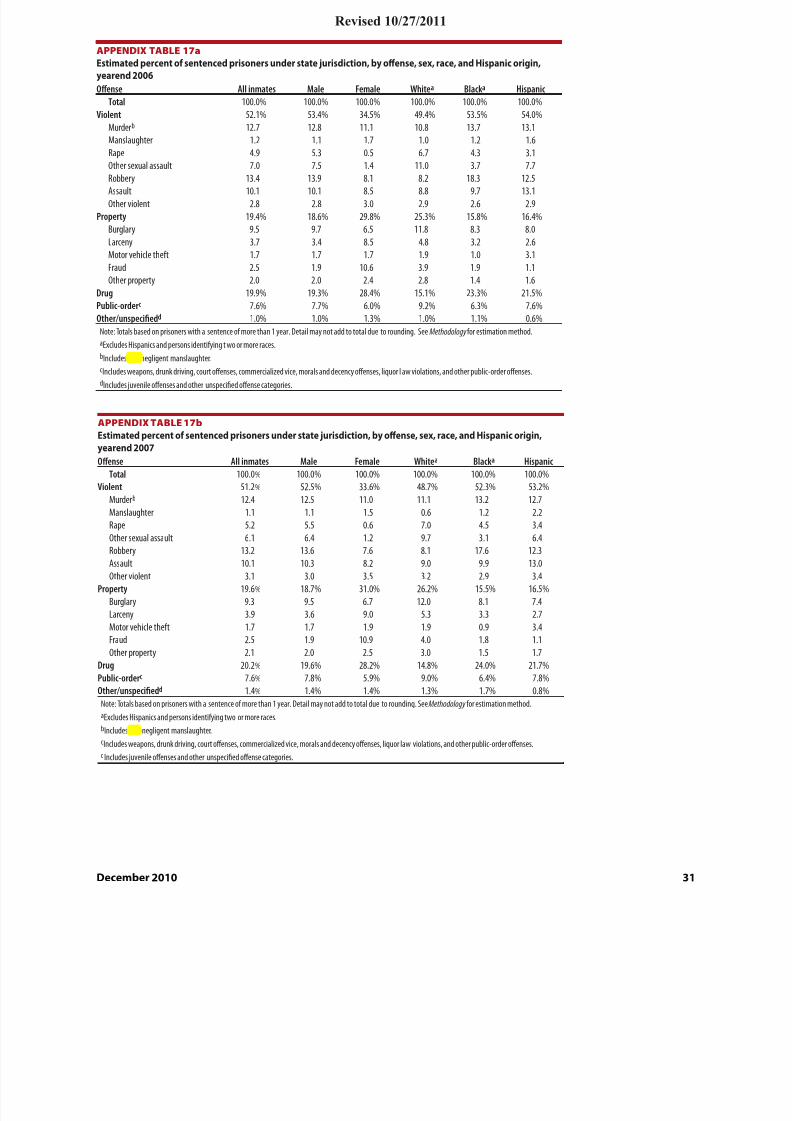
Appendix table 17a. Estimated percent o sentenced prisonersunder state jurisdiction, by offense, gender, race, and Hispanicorigin, yearend 2006
Appendix table 17b. Estimated percent o sentenced prisonersunder state jurisdiction, by offense, gender, race, and Hispanicorigin, yearend 2007
Appendix table 17c. Estimated percent o sentenced prisoners
under state jurisdiction, by offense, gender, race, and Hispanicorigin, yearend 2008
Appendix table 18. Number o sentenced prisoners in ederalprison, by most serious offense, 2000, 2008, and 2009
Appendix table 19. Number o state or ederal prisoners inprivate acilities, December 31, 2000-2009
Appendix table 20. Number o state and ederal prisoners inprivate acilities, by jurisdiction, December 31, 2000, 2008, and2009
Appendix table 21. Number o state or ederal prisoners in local
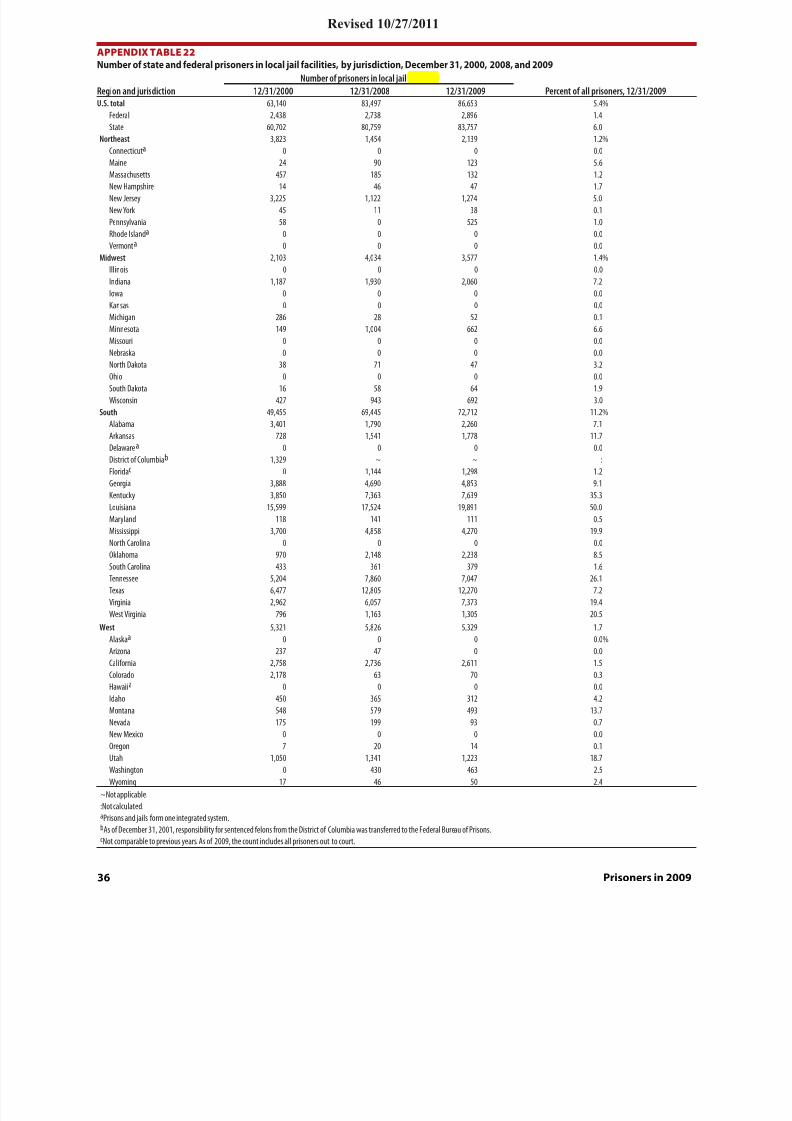
acilities, December 31, 2000-2009Appendix table 22. Number o state and ederal prisoners inlocal acilities, by jurisdiction, December 31, 2000, 2008, and2009
Appendix table 23. Reported state and ederal prisoncapacities, December 31, 2009
8/13/2019 December 2010, NCJ 231675 Bureau of Justice Statistics Prisoners in 2009
~Not applicable. As of December 31, 2001, responsibility for sentenced felons from the District of Columbia was transferred to the Federal Bureau of Prisons.:Not calculated.aPrisons and jails form one integrated system. Data include total jail and prison populations.bPrison population for yearend 2008 is as of January 2, 2009.cPrison population based on custody counts.
8/13/2019 December 2010, NCJ 231675 Bureau of Justice Statistics Prisoners in 2009
~Not applicable. As of December 31, 2001, responsibility for sentenced felons from the District of Columbia was transferred to the Federal Bureau of Prisons.:Not calculated.aPrisons and jails form one integrated system. Data include total jail and prison populations.bJurisdiction count for yearend 2008 is as of January 2, 2009.cPrison population based on custody counts.
8/13/2019 December 2010, NCJ 231675 Bureau of Justice Statistics Prisoners in 2009
~ Not applicable. As of December 31, 2001, responsibility for sentenced felons from the District of Columbia was transferred to the Federal Bureau of Prisons.:Not calculated.aPrisons and jails form one integrated system. Data include total jail and prison populations.bJurisdiction counts for yearend 2008 are of January 2, 2009.cPrison population based on custody counts.
8/13/2019 December 2010, NCJ 231675 Bureau of Justice Statistics Prisoners in 2009
Note: Totals based on prisoners with a sentence of more than 1 year.~Not applicable. As of December 31, 2001, responsibility for sentenced felons from the District of Columbia was transferred to the Federal Bureau of Prisons.:Not calculated.aPrisons and jails form one integrated system. Data include total jail and prison populations.bIncludes some prisoners sentenced to 1 year or less.cPrison population based on custody counts.
8/13/2019 December 2010, NCJ 231675 Bureau of Justice Statistics Prisoners in 2009
Imprisonment rates of sentenced prisoners under jurisdiction of state and federal correctional authorities, by sex and jurisdiction, December 31,2008 and 2009
Region and jurisdiction2008 2009
Total Male Female Total Male FemaleU.S. totala 504 952 68 502 949 67
Note: Imprisonment rate is the number of prisoners sentenced to more than 1 year per 100,000 U.S. residents. Based on census estimates for January 1, 2010.aThe 2008 and 2009 imprisonment rates include 4,012 male prisoners sentenced to more than 1 year but held in local jails or houses of correction in the Commonwealth of Ma Jurisdiction notes.bPrisons and jails form one integrated system. Data include total jail and prison populations.cIncludes some prisoners sentenced to 1 year or less.dPrison population based on custody counts.
Revised 10 /27 /2011
8/13/2019 December 2010, NCJ 231675 Bureau of Justice Statistics Prisoners in 2009
Number of sentenced prisoners admitted into and released from state or federal jurisdiction, by jurisdiction, December 31, 2000, 2008, and 2009Admissions Releases
Note: Totals based on prisoners with a sentence of more than 1 year. Totals exclude escapees, AWOLS, and transfers to and from other jurisdictions. See Methodology.:Not calculated.
8/13/2019 December 2010, NCJ 231675 Bureau of Justice Statistics Prisoners in 2009
Number of sentenced prisoners admitted into and released from state or federal jurisdiction, by type, December 31, 2009Admissions Releases
Region and jurisdiction Total New court commitments Parole violators Total Conditional releases Unconditional U.S. Total 730,860 474,434 242,077 729,295 505,536 210,814
Note: Totals based on prisoners with a sentence of more than 1 year. Totals exclude escapees, those absent without leave (AWOL), and transfers to and from other jurisdictions./Not reported.*New reporting systems prevent the disaggregation of admission and/or release type.
8/13/2019 December 2010, NCJ 231675 Bureau of Justice Statistics Prisoners in 2009
Note: Totals based on prisoners with a sentence of more than 1 year. See Methodology for estimation method.aIncludes American Indians, Alaska Natives, Asians, Native Hawaiians, other Pacic Islanders, and persons identifying two or more races.bExcludes persons of Hispanic or Latino origin.cIncludes persons under age 18.
8/13/2019 December 2010, NCJ 231675 Bureau of Justice Statistics Prisoners in 2009
Estimated rate of sentenced prisoners under state or federal jurisdiction, per 100,000 U.S. residents, by sex, race,and Hispanic origin, December 31, 2000-2009
Male Female Year Totala Whiteb Blackb Hispanic Totala Whiteb Blackb Hispanic2000 904 449 3,457 1,220 59 34 205 602001 896 462 3,535 1,177 58 36 199 612002 912 450 3,437 1,176 61 35 191 802003 915 465 3,405 1,231 62 38 185 842004 926 463 3,218 1,220 64 42 170 752005 929 471 3,145 1,244 65 45 156 762006 943 487 3,042 1,261 68 48 148 812007 955 481 3,138 1,259 69 50 150 792008 952 487 3,161 1,200 68 50 149 752009 949 487 3,119 1,193 67 50 142 74Note: Based on prisoners with a sentence of more than 1 year. Rates are per 100,000 U.S. residents as of January 1 in each reference popinclude persons under age 18. See Methodology for estimation method.aIncludes American Indians, Alaska Natives, Asians, Native Hawaiians, other Pacic Islanders, and persons identifying two or more racebExcludes persons of Hispanic or Latino origin.
APPENDIX TABLE 15
Estimated number of sentenced prisoners under state or federal jurisdiction per 100,000 U.S. residents,by sex, race, Hispanic origin, and age, December 31, 2009
Male FemaleAge Totala Whiteb Blackb Hispanic Totala Whiteb Blackb Hispanic
Note: Totals based on prisoners with a sentence of more than 1 year. Rates are per 100,000 U.S. residents in each referenced population gJanuary 1, 2009. See Methodology for estimation method.aIncludes American Indians, Alaska Natives, Asians, Native Hawaiians, other Pacic Islanders, and persons identifying two or more racebExcludes persons of Hispanic or Latino origin.cIncludes persons under age 18.
8/13/2019 December 2010, NCJ 231675 Bureau of Justice Statistics Prisoners in 2009
Estimated number of sentenced prisoners under state jurisdiction, by offense, sex, race, and Hispanic origin,yearend 2006Offense All inmates Male Female Whitea Blacka Hispanic
Drug 264,300 238,600 26,200 71,700 118,300 53,600Public-orderc 101,300 95,700 5,500 43,700 32,300 18,800Other/unspeciedd 13,300 12,300 1,200 4,900 5,600 1,600Note: Totals based on prisoners with a sentence of more than 1 year. Detail may not add to total due to rounding. See Methodology for estimation method.aExcludes Hispanics and persons identifying two or more races.bIncludes non-negligent manslaughter.cIncludes weapons, drunk driving, court offenses, commercialized vice, morals and decency offenses, liquor law violations, and other public-order offenses.dIncludes juvenile offenses and other unspecied offense categories.
APPENDIX TABLE 16b
Estimated number of sentenced prisoners under state jurisdiction, by offense, sex, race, and Hispanic origin,yearend 2007Offense All inmates Male Female Whitea Blacka Hispanic
Drug 273,600 247,000 26,600 70,300 124,400 57,000Public-orderc 103,100 97,600 5,500 42,800 33,200 20,400Other/unspeciedd 18,900 17,500 1,300 6,000 8,800 2,000Note: Totals based on prisoners with a sentence of more than 1 year. Detail may not add to total due to rounding. See Methodology for estimation method.aExcludes Hispanics and persons identifying two or more races.bIncludes non-negligent manslaughter.cIncludes weapons, drunk driving, court offenses, commercialized vice, morals and decency offenses, liquor law violations, and other public-order offenses.dIncludes juvenile offenses and other unspecied offense categories.
Revised 10/2 7 /2011
8/13/2019 December 2010, NCJ 231675 Bureau of Justice Statistics Prisoners in 2009
Estimated number of sentenced prisoners under state jurisdiction, by offense, sex, race, and Hispanic origin,yearend 2008Offense All inmates Male Female Whitea Blacka Hispanic
Drug 251,400 225,900 25,500 68,300 113,900 48,5Public-orderc 125,900 119,000 6,900 51,400 38,200 28,1Other/unspeciedd 17,800 16,500 1,300 5,900 8,700 1,50Note: Totals based on prisoners with a sentence of more than 1 year. Detail may not add to total due to rounding. See Methodology for estimation method.aExcludes Hispanics and persons identifying two or more races.bIncludes non-negligent manslaughter.cIncludes weapons, drunk driving, court offenses, commercialized vice, morals and decency offenses, liquor law violations, and other pudIncludes juvenile offenses and other unspecied offense categories.
Revised 10/2 7 /2011
8/13/2019 December 2010, NCJ 231675 Bureau of Justice Statistics Prisoners in 2009
Estimated percent of sentenced prisoners under state jurisdiction, by offense, sex, race, and Hispanic origin,yearend 2006Offense All inmates Male Female Whitea Blacka Hispanic
Drug 19.9% 19.3% 28.4% 15.1% 23.3% 21.5%Public-orderc 7.6% 7.7% 6.0% 9.2% 6.3% 7.6%Other/unspeciedd 1.0% 1.0% 1.3% 1.0% 1.1% 0.6%Note: Totals based on prisoners with a sentence of more than 1 year. Detail may not add to total due to rounding. See Methodology for estimation method.aExcludes Hispanics and persons identifying two or more races.bIncludes non-negligent manslaughter.cIncludes weapons, drunk driving, court offenses, commercialized vice, morals and decency offenses, liquor law violations, and other public-order offenses.dIncludes juvenile offenses and other unspecied offense categories.
APPENDIX TABLE 17b
Estimated percent of sentenced prisoners under state jurisdiction, by offense, sex, race, and Hispanic origin,yearend 2007Offense All inmates Male Female Whitea Blacka Hispanic
Note: Totals based on prisoners with a sentence of more than 1 year. Detail may not add to total due to rounding. See Methodology for estimation method.aExcludes Hispanics and persons identifying two or more races.bIncludes non-negligent manslaughter.cIncludes weapons, drunk driving, court offenses, commercialized vice, morals and decency offenses, liquor law violations, and other public-order offenses.dIncludes juvenile offenses and other unspecied offense categories.
Revised 10/2 7 /2011
8/13/2019 December 2010, NCJ 231675 Bureau of Justice Statistics Prisoners in 2009
Estimated percent of sentenced prisoners under state jurisdiction, by offense, sex, race, and Hispanic origin,yearend 2008Offense All inmates Male Female Whitea Blacka Hispanic
Drug 18.4% 17.8% 26.9% 14.1% 21.9% 19.0%Public-orderc 9.2% 9.4% 7.2% 10.6% 7.3% 11.0%Other/unspeciedd 1.3% 1.3% 1.4% 1.2% 1.7% 0.6%Note: Totals based on prisoners with a sentence of more than 1 year. Detail may not add to total due to rounding. See Methodology for estimation method.aExcludes Hispanics and persons identifying two or more races.bIncludes non-negligent manslaughter.cIncludes weapons, drunk driving, court offenses, commercialized vice, morals and decency offenses, liquor law violations, and other pudIncludes juvenile offenses and other unspecied offense categories.
Revised 10/2 7 /2011
8/13/2019 December 2010, NCJ 231675 Bureau of Justice Statistics Prisoners in 2009
Other/unspeciedb 1,263 1,394 1,317 1.2% -5.5%Note: Based on prisoners with a sentence of more than 1 year. All data are for September 30 from the BJS Federal Justice Statistics Program.aIncludes murder, negligent, and non-negligent manslaughter.bIncludes offenses not classied.
APPENDIX TABLE 19Number of state or federal prisoners in private facilities, December 31, 2000-2009
Number of prisoners in private facilities Year Total Federal State Percent of all prisoners2000 87,369 15,524 71,845 6.3%2001 91,828 19,251 72,577 6.52002 93,912 20,274 73,638 6.52003 95,707 21,865 73,842 6.52004 98,628 24,768 73,860 6.62005 107,940 27,046 80,894 7.12006 113,697 27,726 85,971 7.22007 123,942 31,310 92,632 7.82008 129,482 33,162 96,320 8.02009 129,336 34,087 95,249 8.0Average annual change, 2000-2008 5.0% 10.0% 3.7% :Percent change, 2008-2009 -0.1 2.8 -1.1 ::Not calculated.
8/13/2019 December 2010, NCJ 231675 Bureau of Justice Statistics Prisoners in 2009
~Not applicable. As of December 31, 2001, responsibility for sentenced felons from the District of Columbia was transferred to the Federal Bureau of Prisons.:Not calculated./Not reported.aIncludes federal prisoners held in non-secure, privately operated facilities (8,769 at midyear 2009; numbers from other years can be found in earlier publications).bIncludes prisoners held in out-of-state private facilities.
8/13/2019 December 2010, NCJ 231675 Bureau of Justice Statistics Prisoners in 2009
Number of state and federal prisoners in local jail facilities, by jurisdiction, December 31, 2000, 2008, and 2009Number of prisoners in local jail facilities
Region and jurisdiction 12/31/2000 12/31/2008 12/31/2009 Percent of all prisoners, 12/31/2009U.S. total 63,140 83,497 86,653 5.4%
Federal 2,438 2,738 2,896 1.4State 60,702 80,759 83,757 6.0
~Not applicable.:Not calculated.aPrisons and jails form one integrated system.bAs of December 31, 2001, responsibility for sentenced felons from the District of Columbia was transferred to the Federal Bureau of Prisons.cNot comparable to previous years. As of 2009, the count includes all prisoners out to court.
Revised 10/2 7 /2011
8/13/2019 December 2010, NCJ 231675 Bureau of Justice Statistics Prisoners in 2009
...Data not available.aPopulation counts are based on the number of inmates held in facilities operated by the jurisdiction. Excludes inmates held in local jails, in other states, or in private facilities.bConnecticut no longer reports capacity because of a law passed in 1995.cExcludes capacity of county facilities and inmates housed in them.dCapacity denition differs from BJS denition, see NPS jurisdiction notes.eIncludes capacity of private and contract facilities and inmates housed in them.
Revised 10 /27 /2011
8/13/2019 December 2010, NCJ 231675 Bureau of Justice Statistics Prisoners in 2009
O ce of Justice Programs • Innovation • Partnerships • Safer Neighborhoods • http://www.ojp.usdoj.gov
U.S. Department of JusticeOffice of Justice ProgramsBureau of Justice Statistics
Washington, DC 20531
Official BusinessPenalty for Private Use $300
PRESORTED STANDARDPOSTAGE & FEES PAID
DOJ/BJSPermit No. G-91
ncj231675
Te Bureau o Justice Statistics is the statistical agency o the U.S. Department oJustice. James P. Lynch is Director.
Tis Bulletin was written by Heather C. West, Ph.D, William J. Sabol, Ph.D., andSarah J. Greenman, BJS Program Assistant. Spencer Li, BJS Statistician, contributedanalyses to this report. odd Minton and Lauren Glaze provided statistical reviewand verication on the report.
Joshua Giunta carried out the data collection and processing under the supervisiono Steve Simoncini, Governments Division, Census Bureau, U.S. Department oCommerce.
Georgette Walsh and Jill Duncan edited the report, Barbara Quinn producedthe report, and Jayne Robinson prepared the report or nal printing under thesupervision o Doris J. James.
December 2010, NCJ 231675
Tis report in portable document ormat and in ASCII and its related statisticaldata and tables are available at the BJS website: http://www.bjs.gov/index.c m?ty=pbdetail&iid=2232.