34
13 th December 2010 New Delhi New Delhi 1
| Date post: | 31-Mar-2018 |
| Category: |
Documents |
| Upload: | nguyendien |
| View: | 215 times |
| Download: | 1 times |

13th December 2010New DelhiNew Delhi
1
To prune the sensitive list fof India under SAFTA and
bilateral arrangements tobilateral arrangements to increase trade within the
iregion.
2

Two pronged:
S d D t A l i T id tif itSecondary Data Analysis – To identify items for elimination from the sensitive list.
Primary Survey – To analyse the impact on competitiveness if selected items are removed from the sensitive list.
3

A. Secondary Data AnalysisA. Secondary Data Analysisy yy y
I.I. Constructing the Sensitive Constructing the Sensitive ListsLists
II.II. Elimination CriterionElimination Criterion•
4
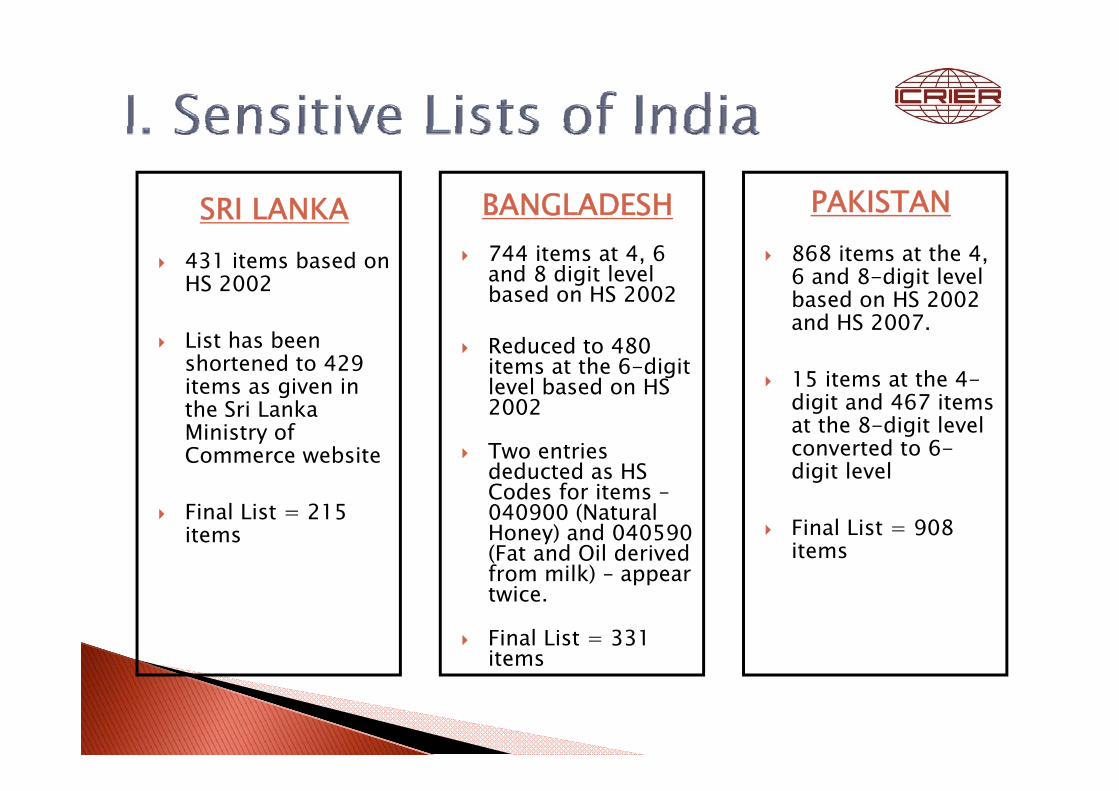
BANGLADESH PAKISTANSRI LANKA744 items at 4, 6 and 8 digit level based on HS 2002
868 items at the 4, 6 and 8-digit level based on HS 2002
SRI LANKA431 items based on HS 2002
Reduced to 480 items at the 6-digit level based on HS
based on HS 2002 and HS 2007.
15 items at the 4-di i d 467 i
List has been shortened to 429 items as given in
2002
Two entries deducted as HS C d f i
digit and 467 items at the 8-digit level converted to 6-digit level
gthe Sri Lanka Ministry of Commerce website
Codes for items –040900 (Natural Honey) and 040590 (Fat and Oil derived from milk) – appear
Final List = 908 items
Final List = 215 items
from milk) – appear twice.
Final List = 331 itemsitems

Step 1: Items not Exported by the partner countryp p y p yand India in any of the three years (2005, 2006and 2007).and 2007).
Step 2: Classifying items into four categories andp y g geliminating on the basis of India’s andexporting country’s RCAexporting country s RCA.
Step 3: Removing items that were earlier reservedStep 3: Removing items that were earlier reservedfor exclusive manufacturing by the Small ScaleSector but have now been de-reservedSector but have now been de reserved.
6
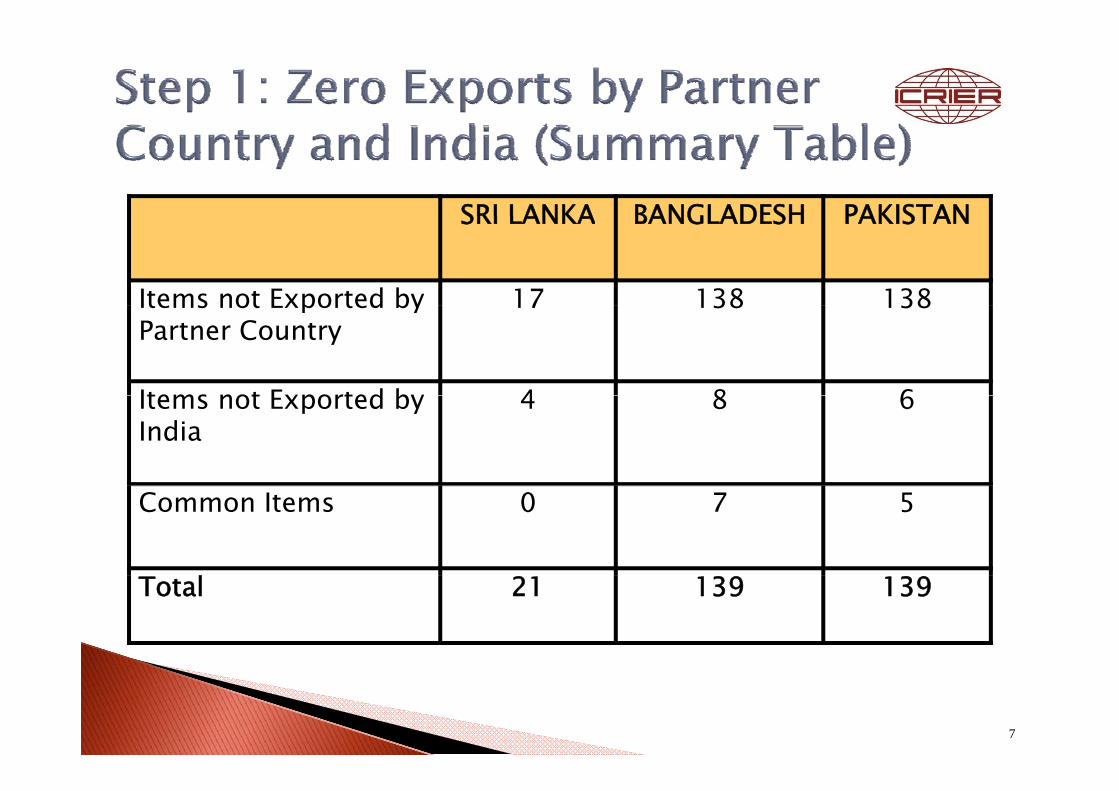
SRI LANKA BANGLADESH PAKISTANSRI LANKA BANGLADESH PAKISTAN
Items not Exported by 17 138 138Items not Exported by Partner Country
17 138 138
Items not Exported by 4 8 6Items not Exported by India
4 8 6
Common Items 0 7 5
Total 21 139 139
7
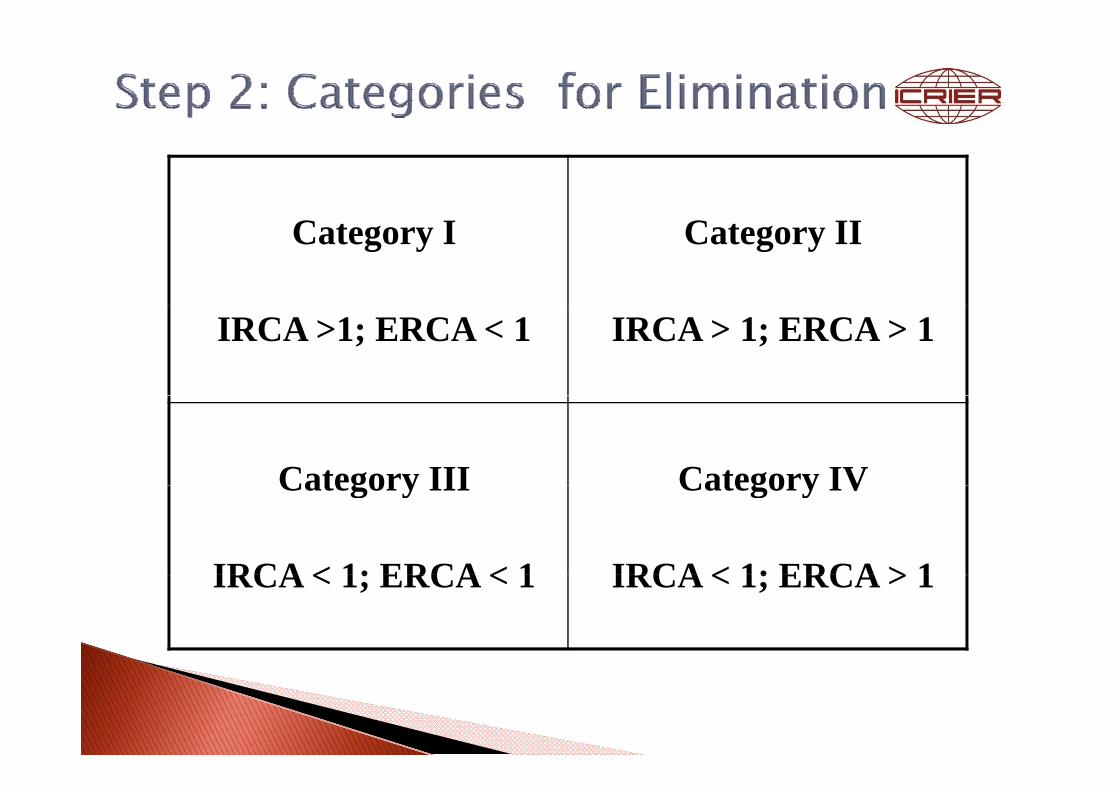
Category I Category II
IRCA >1; ERCA < 1 IRCA > 1; ERCA > 1
Category III Category IVCategory III
IRCA < 1; ERCA < 1
Category IV
IRCA < 1; ERCA > 1IRCA < 1; ERCA < 1 IRCA < 1; ERCA > 1
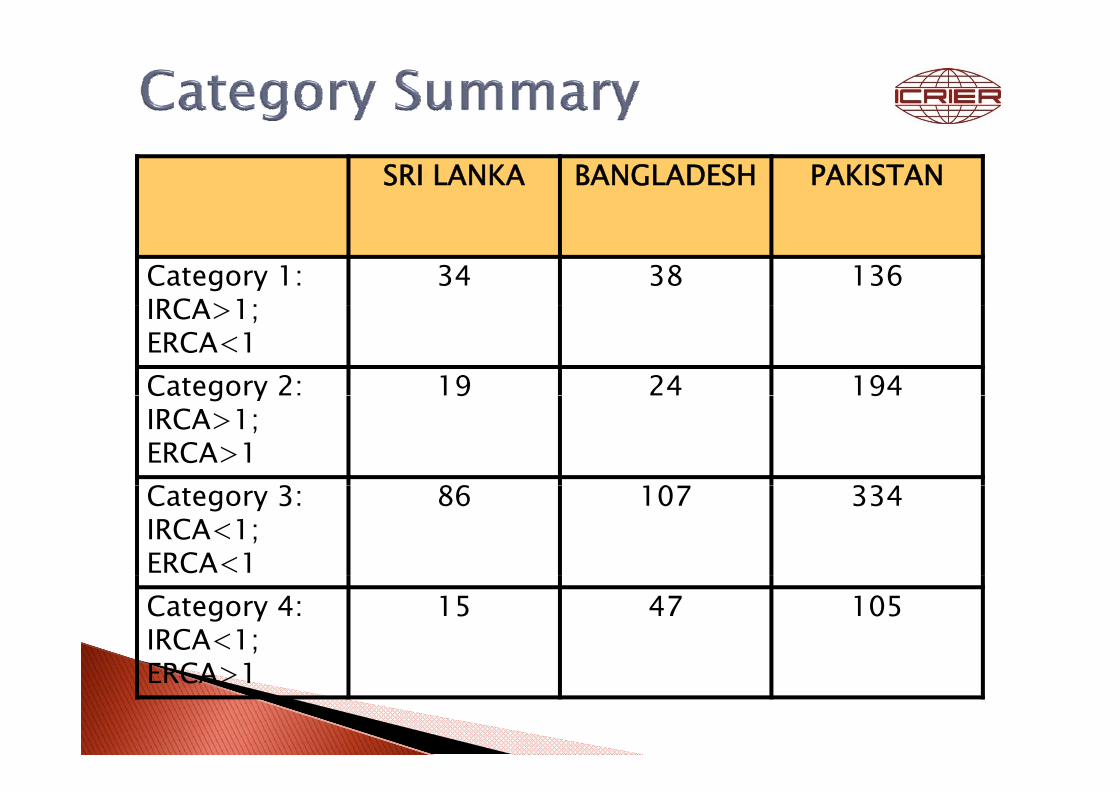
SRI LANKA BANGLADESH PAKISTAN
Category 1:IRCA>1;
34 38 136IRCA>1; ERCA<1Category 2: 19 24 194Catego yIRCA>1; ERCA>1
9 9
C 3 86 10 33Category 3:IRCA<1; ERCA<1
86 107 334
Category 4:IRCA<1;ERCA 1
15 47 105
ERCA>1
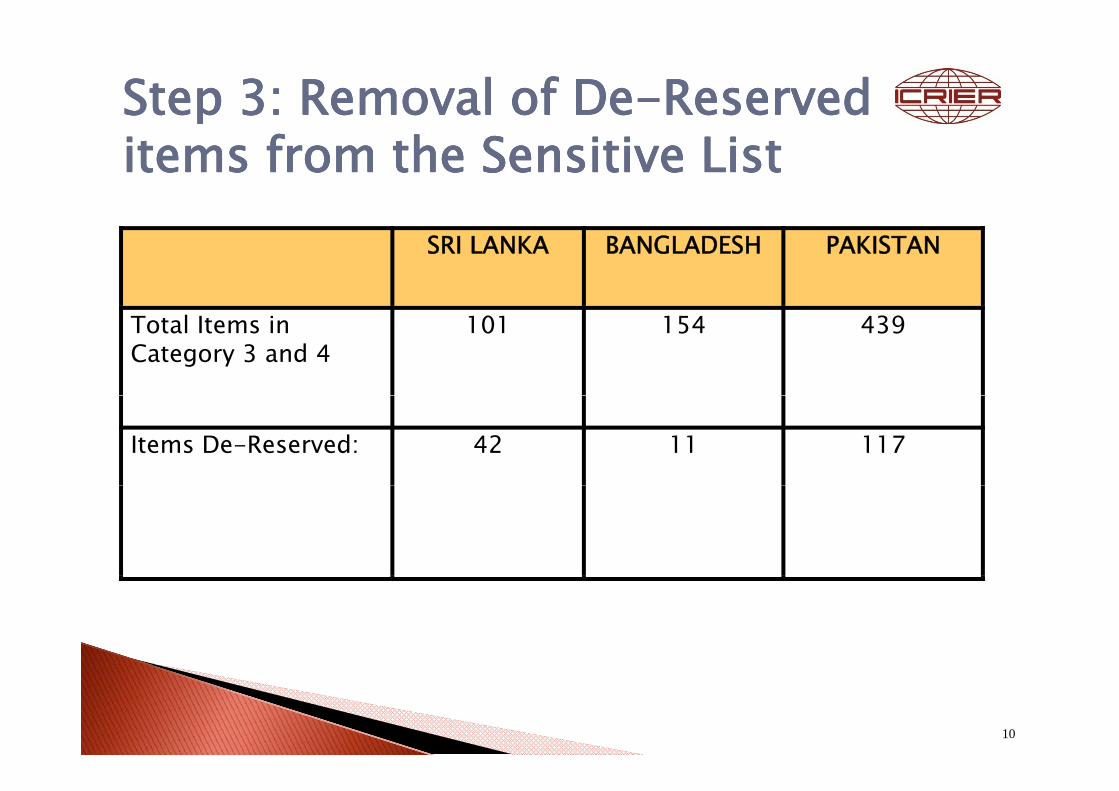
Step 3: Removal of DeStep 3: Removal of De--Reserved Reserved items from the Sensitive Listitems from the Sensitive List
SRI LANKA BANGLADESH PAKISTAN
Total Items in Category 3 and 4
101 154 439
Items De-Reserved: 42 11 117
10

Sri Lanka Bangladesh Pakistan
Original Sensitive List 431 763 884Original Sensitive List 431 763 884
Operational Sensitive List 215 331 868 p(908)
Recommended Sensitive List 59 89 322Recommended Sensitive List 59 89 322

Sri Lanka Bangladesh PakistanSri Lanka Bangladesh Pakistan
A. Import Coverage of Operational Sensitive List Items
6329 61997 102402
B. Import Coverage of Reduced Sensitive List
1531 5972 25733
Items
Share of B in A (%) 24.19 9.63 25.13Share of B in A (%) 24.19 9.63 25.13
The recommended sensitive list is only aThe recommended sensitive list is only a short list and should be pruned further.
Items like tobacco and alcohol can stay on the list.
Not all agricultural items are sensitive. Only those related to food security should staythose related to food security should stay.
The list can be pruned further in a phased manner using Trade Potential as a guide.
13

Chap 61 & 62 (Apparels) of interest to ll f i i l di I diall four countries including India
Chap 4001 (Natural Rubber) for Sri LankaLanka
14
Apparelpp
Natural RubberNatural Rubber
15

16
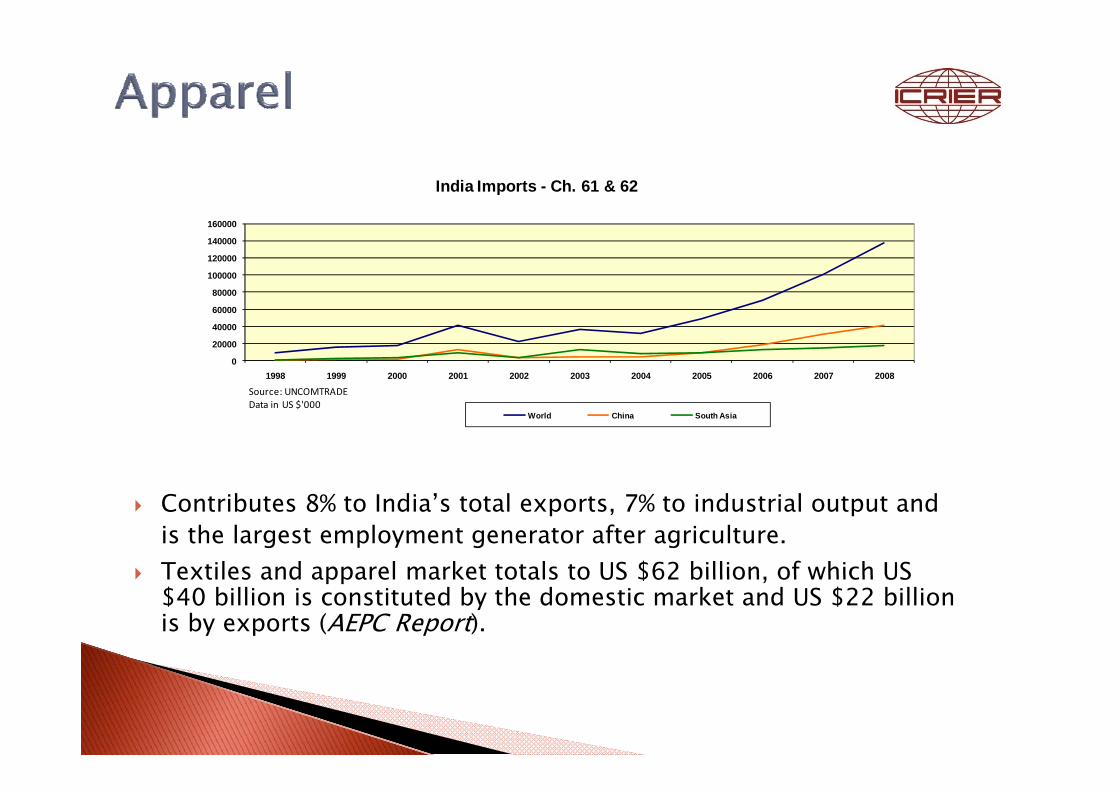
India Im po rts -Ch. 61 & 62
8 0000
100000
120000
140000
160000
0
20000
40000
60000
1998 1999 2000 2001 2002 2003 2004 2005 2006 2007 2008
Source: UNCOMTRADE
W o rld China So uth Asia
Data in US $'000
Contributes 8% to India’s total exports, 7% to industrial output and is the largest employment generator after agriculture.Textiles and apparel market totals to US $62 billion of which USTextiles and apparel market totals to US $62 billion, of which US $40 billion is constituted by the domestic market and US $22 billion is by exports (AEPC Report).
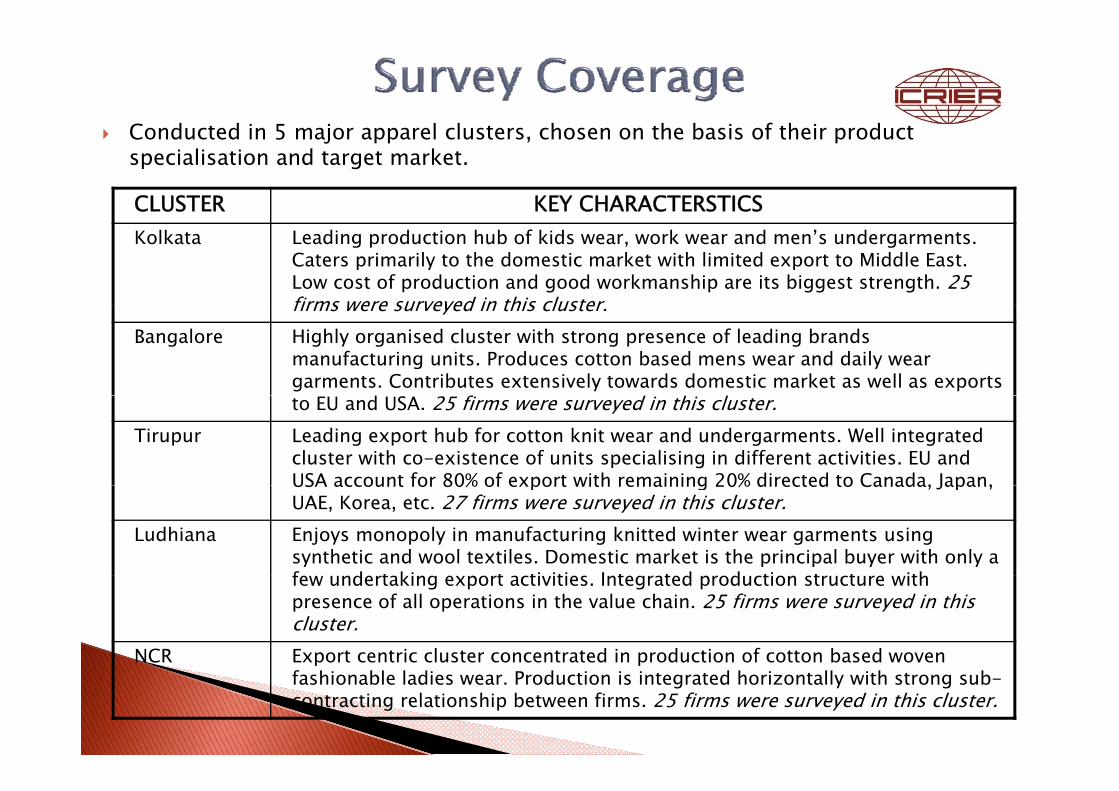
C d t d i 5 j l l t h th b i f th i d tConducted in 5 major apparel clusters, chosen on the basis of their product specialisation and target market.
CLUSTER KEY CHARACTERSTICSKolkata Leading production hub of kids wear, work wear and men’s undergarments.
Caters primarily to the domestic market with limited export to Middle East. Low cost of production and good workmanship are its biggest strength. 25 firms were surveyed in this clusterfirms were surveyed in this cluster.
Bangalore Highly organised cluster with strong presence of leading brands manufacturing units. Produces cotton based mens wear and daily wear garments. Contributes extensively towards domestic market as well as exports
fto EU and USA. 25 firms were surveyed in this cluster. Tirupur Leading export hub for cotton knit wear and undergarments. Well integrated
cluster with co-existence of units specialising in different activities. EU and USA account for 80% of export with remaining 20% directed to Canada, Japan,USA account for 80% of export with remaining 20% directed to Canada, Japan, UAE, Korea, etc. 27 firms were surveyed in this cluster.
Ludhiana Enjoys monopoly in manufacturing knitted winter wear garments using synthetic and wool textiles. Domestic market is the principal buyer with only a f d t ki t ti iti I t t d d ti t t ithfew undertaking export activities. Integrated production structure with presence of all operations in the value chain. 25 firms were surveyed in this cluster.
NCR Export centric cluster concentrated in production of cotton based woven p pfashionable ladies wear. Production is integrated horizontally with strong sub-contracting relationship between firms. 25 firms were surveyed in this cluster.
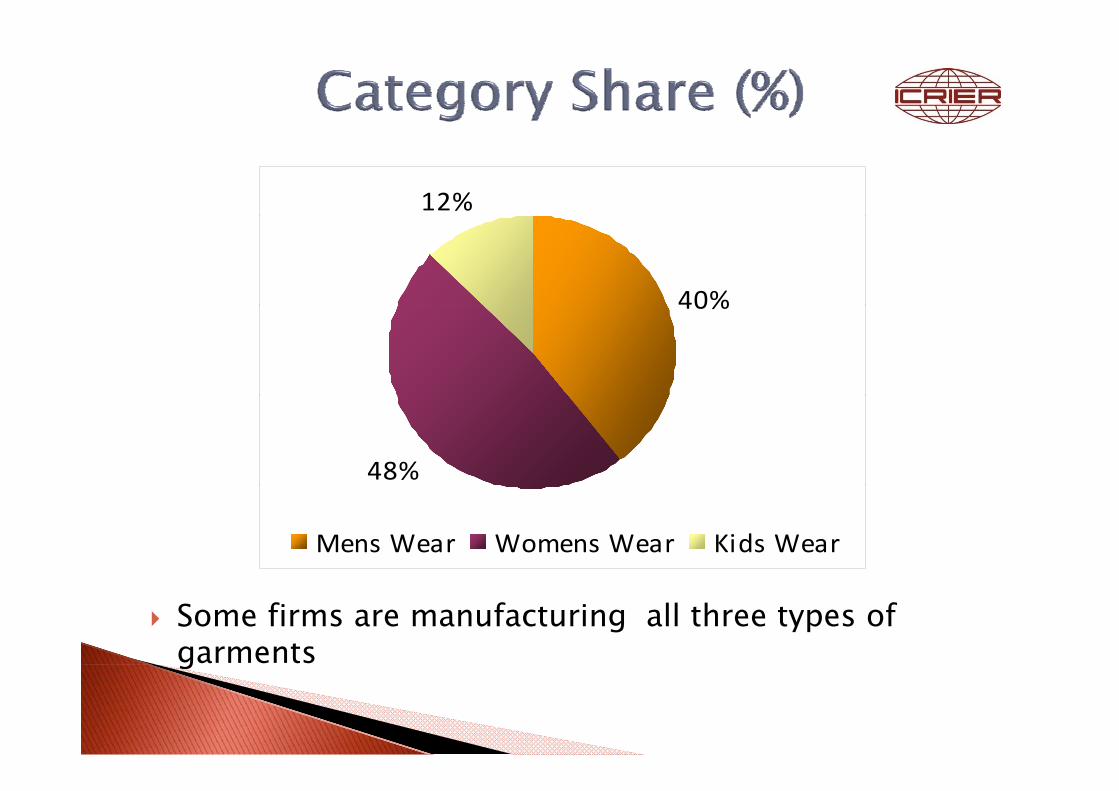
12%
40%40%
48%
Mens Wear Womens Wear Kids Wear
Some firms are manufacturing all three types of garments g

Firm Size (i t f
Market SegmentNo. of Fi
Age (years)
D ti (in terms of Turnover for 2009) Frequency
Firms Importing MachineryDomestic Export
Domestic and Export 0-5 6-10 11-15 16-20 21-25 >25
Small (Up to Rs. 30 crore) 105 (83.3) 38 (36.2)
40(38.1) 27 (25.7) 68 (64.8)
13 (12.4)
22 (21.0)
23 (21.9)
15 (14.3)
10 (9.5)
22 (20.9)
Large (> Rs. 30 crore) 21 (16.7) 0 (0.0)
10 (47.6) 11 (52.4) 20 (95.2) 1 (4.8)
4 (19.0)
3 (14.3) 1 (4.8)
4 (19.0)
8 (38.1)
Total 126 38 50 38 88 14 26 26 16 14 30
Figures in Parenthesis are % share
Sales turnover as measure of the size of the firm (problem with employment and investment in plant and machinery) Age of the firm – largest number in the more than 25 yearsAge of the firm largest number in the more than 25 years category Import of machinery

No. of Firms Facing
Sl.NoMarket Segment
No. of Firms
Competition from No. of Firms Facing Competition from
Large Firms
Small Firms Bangladesh
Sri Lanka Pakistan
Other CountriesSl.No Segment Firms Firms Firms Bangladesh Lanka Pakistan Countries
1 Domestic 38 23 32 3 2 0 10
2 Export 50 0 0 1 1 0 7
3Domestic and Export 39 28 28 6 6 4 23
Total 127 51 60 10 9 4 40
Exporting firms face no competition from South Asia Q li f d
Total 127 51 60 10 9 4 40
Quality of product Firms serving the domestic market facing competition from Bangladesh and Sri Lanka in some products

Technology Technology gygy
Imported Machinery Proportion Range (%) Frequency
Domestic Market Firms
Export Market Firms
Both Domestic and Export Market Firms
1-20 2 1 (50.0) 0 (0.0) 1 (50.0)0 (50 0) 0 (0 0) (50 0)
21-40 6 1 (16.7) 1 (16.7) 4 (66.7)
41-60 31 5 (16.1) 11 (35.5) 15 (48.4)
61-80 30 0 (0.0) 18 (60.0) 12 (40.0)61 80 30 0 (0.0) 18 (60.0) 12 (40.0)
81-100 19 1 (5.3) 12 (63.1) 6 (31.6)
Total 88 8 42 38
Figures in Parenthesis are % Share
Way out to cope with competition from SA –
Figures in Parenthesis are % Share
Way out to cope with competition from SA Technology

23
India is the fourth largest producer of Natural Rubber (NR) next to Thailand, Indonesia and Malaysia. In terms of productivity we occupy the top positionoccupy the top position. There are mainly 3 grades of NR that constitute 94 percent of the total NR production in the country. Th f ll (H S C d )They are as follows (H.S. Codes)1. Natural Rubber latex (400010) 2. Natural Rubber Smoked Sheets (400121) 3. Technically Specified Natural Rubber (400122) India is the third largest consumer of Natural Rubber (NR) next to China and the USA.The tyre industry accounts for 62% of the consumption of NR.Among the above the Tyre Industry mainly uses Smoked Sheets which is an important component for Tyre productionwhich is an important component for Tyre production. Exports of Rubber products for 2008-09 is estimated to be ` 5886 crores
24
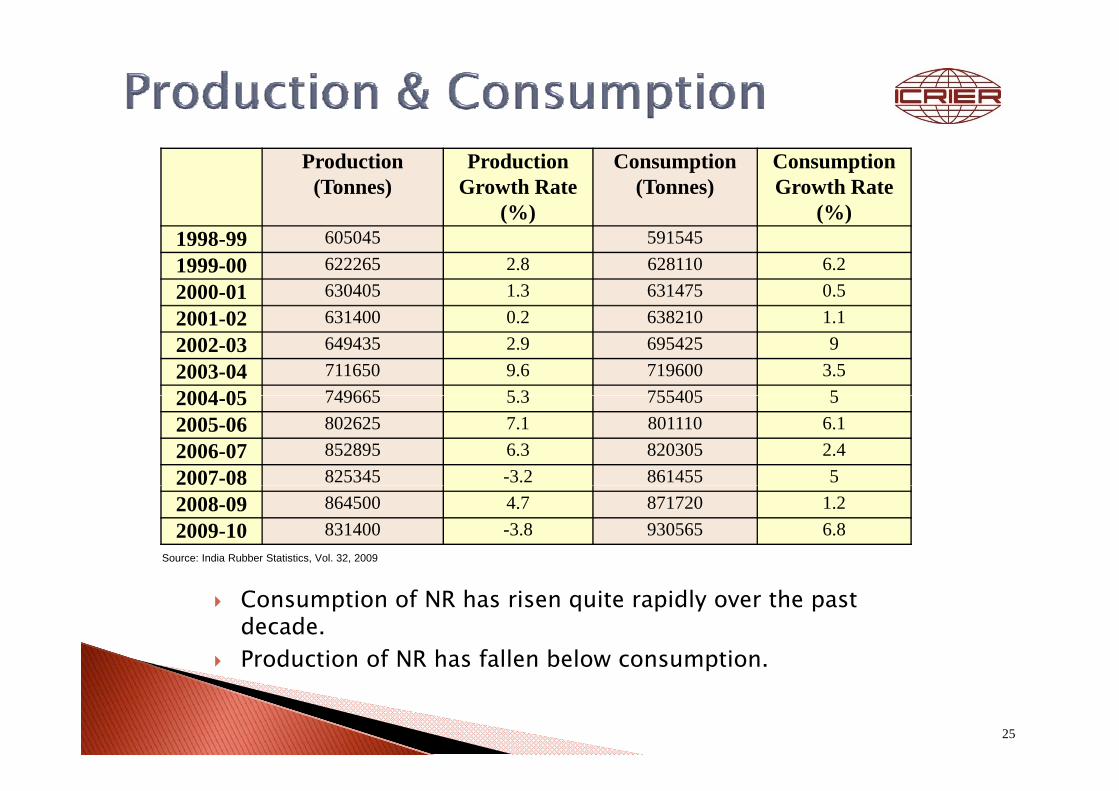
Production (Tonnes)
Production Growth Rate
(%)
Consumption (Tonnes)
Consumption Growth Rate
(%)(%) (%)1998-99 605045 591545
1999-00 622265 2.8 628 110 6.2
2000-01 630405 1.3 63147 5 0.5
2001-02 631400 0.2 638 210 1.1
2002-03 649435 2.9 695425 9
2003-04 7 11650 9.6 7 19600 3.5
2004 05 7 49665 5.3 7 55405 52004-05 7 49665 5.3 7 55405 5
2005-06 8 02625 7 .1 8 01110 6.1
2006-07 8 528 95 6.3 8 20305 2.4
2007-08 8 25345 -3.2 8 61455 5
2008-09 8 64500 4.7 8 7 17 20 1.2
2009-10 8 31400 -3.8 930565 6.8So urc e: India Rubber Statistic s, Vo l. 32, 2009
Consumption of NR has risen quite rapidly over the past decade.Production of NR has fallen below consumption.Production of NR has fallen below consumption.
25

Ratio of Consumption/Production in major NR producing countriesCountry 2000 2001 2002 2003 2004 2005 2006 2007p 2008pChina 2.43 2.78 2.65 2.7 3.49 4.44 5.22 4.9 5.22China 2.43 2.78 2.65 2.7 3.49 4.44 5.22 4.9 5.22
India 1.01 1 1.06 1.01 1 1.02 0.96 1.05 1
Malaysia 0.39 0.45 0.46 0.43 0.34 0.34 0.3 0.38 0.44
Thailand 0.1 0.11 0.11 0.1 0.11 0.11 0.1 0.12 0.13Thailand 0.1 0.11 0.11 0.1 0.11 0.11 0.1 0.12 0.13
Indonesia 0.09 0.09 0.09 0.17 0.09 0.1 0.13 0.14 0.15
World 1.08 1.01 1.03 0.99 0.99 1.03 1 1.06 1.02
Source: India Rubber Statistics Vol 32 2009
India ranks behind China in the ratio. China has over the last decade increased its consumption to much higher levelsThis is also evident in China’s exports of Rubber goods to the world It is about 8 times as
Source: India Rubber Statistics, Vol. 32, 2009
This is also evident in China s exports of Rubber goods to the world. It is about 8 times as compared to India.
Export of Finished goods to the World (20042008) (millions of US $)2004 2005 2006 2007 20082004 2005 2006 2007 2008
India 587 789 928 1013 1294China 3501 5071 6864 9396 10681
Source: UN COMTRADE database
26

Average Trade Potential and IRCA for major NR producing countries (200608)
Country Natural Rubber latex Smoked sheets Technically specified natural rubberTrade Potential IRCA Trade Potential IRCA Trade Potential IRCA
Sri Lanka 520.64 8.43 26742.57 28.87 7157.83 3.41
Th il dThailand 479.61 56.17 45143.17 71.63 53171.13 21.66
Indonesia 432.57 9.90 70486.65 13.57 40100.88 78.77Malaysia 390.33 4.91 4065.55 0.31 78724.56 33.09Vietnam 332 74 23 24 62625 15 9 04 79690 25 19 70
The table shows the average trade potential of major NR
Vietnam 332.74 23.24 62625.15 9.04 79690.25 19.70Source: UN COMTRADE database
The table shows the average trade potential of major NR producing countries with India and their International RCA’s. Sri Lanka has the highest trade potential for NR latex.
27
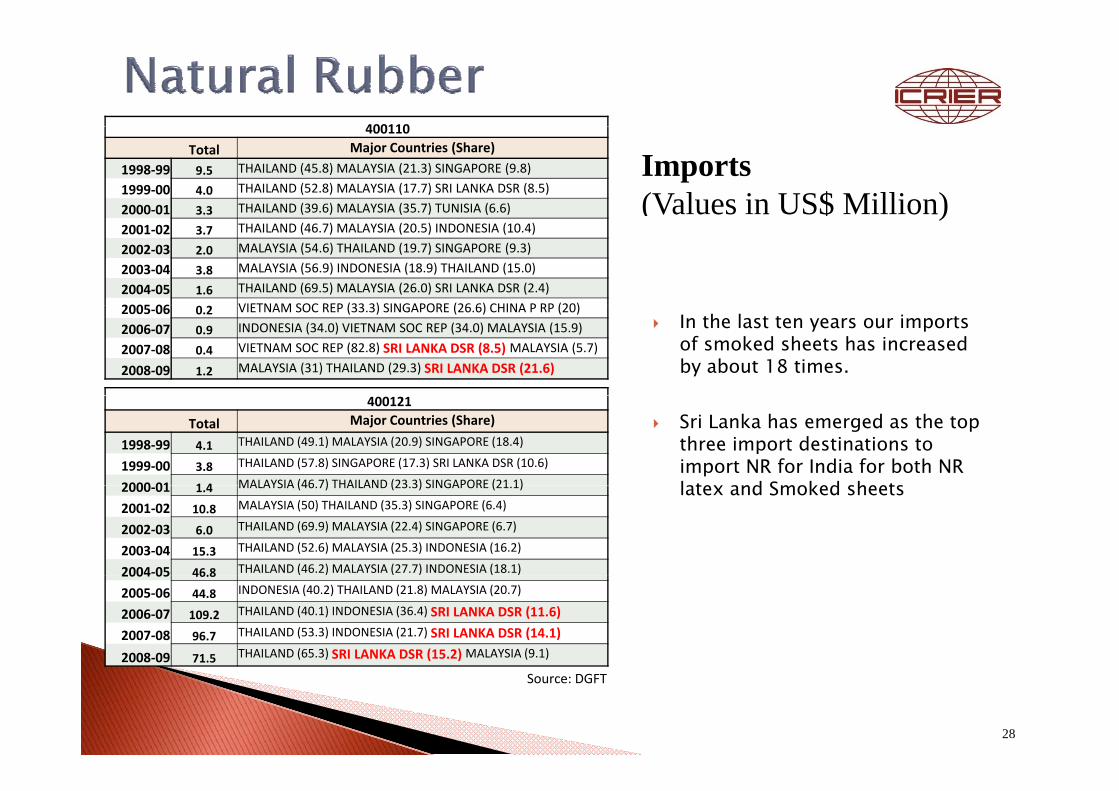
400110400110Total Major Countries (Share)
1998‐99 9.5 THAILAND (45.8) MALAYSIA (21.3) SINGAPORE (9.8)
1999‐00 4.0 THAILAND (52.8) MALAYSIA (17.7) SRI LANKA DSR (8.5)
2000‐01 3.3 THAILAND (39.6) MALAYSIA (35.7) TUNISIA (6.6)
Imports (Values in US$ M illio n)
2001‐02 3.7 THAILAND (46.7) MALAYSIA (20.5) INDONESIA (10.4)
2002‐03 2.0 MALAYSIA (54.6) THAILAND (19.7) SINGAPORE (9.3)
2003‐04 3.8 MALAYSIA (56.9) INDONESIA (18.9) THAILAND (15.0)
2004‐05 1.6 THAILAND (69.5) MALAYSIA (26.0) SRI LANKA DSR (2.4)
2005 06 0 2 VIETNAM SOC REP (33 3) SINGAPORE (26 6) CHINA P RP (20)
n n)
In the last ten years our imports of smoked sheets has increased by about 18 times.
2005‐06 0.2 VIETNAM SOC REP (33.3) SINGAPORE (26.6) CHINA P RP (20)
2006‐07 0.9 INDONESIA (34.0) VIETNAM SOC REP (34.0) MALAYSIA (15.9)
2007‐08 0.4 VIETNAM SOC REP (82.8) SRI LANKA DSR (8.5) MALAYSIA (5.7)
2008‐09 1.2 MALAYSIA (31) THAILAND (29.3) SRI LANKA DSR (21.6)
Sri Lanka has emerged as the top three import destinations to import NR for India for both NR latex and Smoked sheets
400121
Total Major Countries (Share)
1998‐99 4.1 THAILAND (49.1) MALAYSIA (20.9) SINGAPORE (18.4)
1999‐00 3.8 THAILAND (57.8) SINGAPORE (17.3) SRI LANKA DSR (10.6)
2000 01 1 4 MALAYSIA (46 7) THAILAND (23 3) SINGAPORE (21 1) latex and Smoked sheets 2000‐01 1.4 MALAYSIA (46.7) THAILAND (23.3) SINGAPORE (21.1)
2001‐02 10.8 MALAYSIA (50) THAILAND (35.3) SINGAPORE (6.4)
2002‐03 6.0 THAILAND (69.9) MALAYSIA (22.4) SINGAPORE (6.7)
2003‐04 15.3 THAILAND (52.6) MALAYSIA (25.3) INDONESIA (16.2)
2004‐05 46.8 THAILAND (46.2) MALAYSIA (27.7) INDONESIA (18.1)2004 05 46.8
2005‐06 44.8 INDONESIA (40.2) THAILAND (21.8) MALAYSIA (20.7)
2006‐07 109.2 THAILAND (40.1) INDONESIA (36.4) SRI LANKA DSR (11.6)
2007‐08 96.7 THAILAND (53.3) INDONESIA (21.7) SRI LANKA DSR (14.1)
2008‐09 71.5 THAILAND (65.3) SRI LANKA DSR (15.2) MALAYSIA (9.1)
28
Source: DGFT

16000
18 000
RSS 4 (Do m estic )
10000
12000
14000
RSS 3 (Internatio nal)
4000
6000
8 000
0
2000
4000
The Domestic NR prices for RSS 4 has moved in tandem with RSS 3 (Bangkok) price. But in the last couple of years the domestic price has risen higher than the
2003 2004 2005 2006 2007 2008 2009 2010So urc e: India Rubber Bo ard W ebsite
price. But in the last couple of years the domestic price has risen higher than the international price.In the present month, the domestic prices have reached a record level of ` 20200 per 100kg. Comparatively the international price was ` 19792 per 100 kg.
29
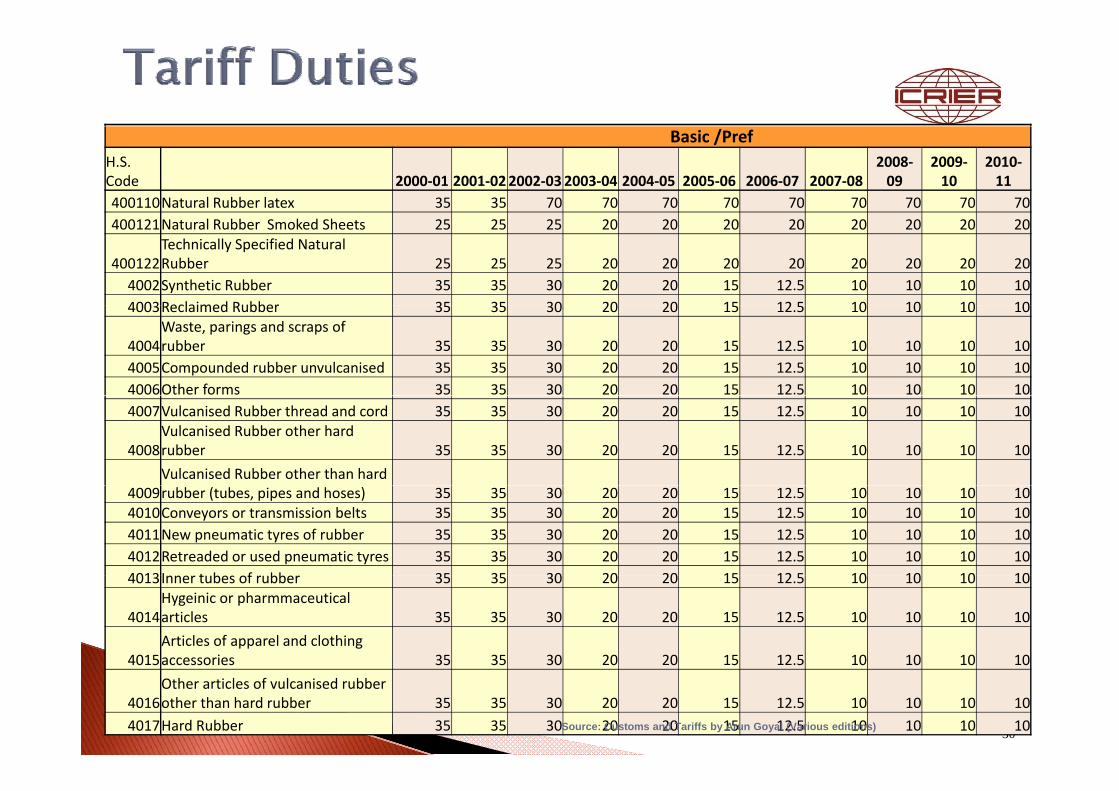
Basic /PrefH.S. Code 2000‐01 2001‐022002‐032003‐04 2004‐05 2005‐06 2006‐07 2007‐08
2008‐09
2009‐10
2010‐11
400110Natural Rubber latex 35 35 70 70 70 70 70 70 70 70 70400121Natural Rubber Smoked Sheets 25 25 25 20 20 20 20 20 20 20 20
400122Technically Specified Natural Rubber 25 25 25 20 20 20 20 20 20 20 20
4002Synthetic Rubber 35 35 30 20 20 15 12.5 10 10 10 104003Reclaimed Rubber 35 35 30 20 20 15 12 5 10 10 10 104003Reclaimed Rubber 35 35 30 20 20 15 12.5 10 10 10 10
4004Waste, parings and scraps of rubber 35 35 30 20 20 15 12.5 10 10 10 10
4005Compounded rubber unvulcanised 35 35 30 20 20 15 12.5 10 10 10 104006Other forms 35 35 30 20 20 15 12.5 10 10 10 104007Vulcanised Rubber thread and cord 35 35 30 20 20 15 12.5 10 10 10 10
4008Vulcanised Rubber other hard rubber 35 35 30 20 20 15 12.5 10 10 10 10
Vulcanised Rubber other than hard 4009rubber (tubes, pipes and hoses) 35 35 30 20 20 15 12.5 10 10 10 104010Conveyors or transmission belts 35 35 30 20 20 15 12.5 10 10 10 104011New pneumatic tyres of rubber 35 35 30 20 20 15 12.5 10 10 10 104012Retreaded or used pneumatic tyres 35 35 30 20 20 15 12.5 10 10 10 104013I t b f bb 35 35 30 20 20 15 12 5 10 10 10 104013Inner tubes of rubber 35 35 30 20 20 15 12.5 10 10 10 10
4014Hygeinic or pharmmaceutical articles 35 35 30 20 20 15 12.5 10 10 10 10
4015Articles of apparel and clothing accessories 35 35 30 20 20 15 12.5 10 10 10 10
30
4015accessories 35 35 30 20 20 15 12.5 10 10 10 10
4016Other articles of vulcanised rubber other than hard rubber 35 35 30 20 20 15 12.5 10 10 10 10
4017Hard Rubber 35 35 30 20 20 15 12.5 10 10 10 10So urc e: Custo m s and Tariffs by Arun G o y al (Vario us editio ns)

The inverted duty structure ought to be removed given the importance of rubber goods industry for India.
Following the Bangkok Agreement effective g g gfrom 9 January 2004, the preferential duty of imports for Bangladesh and Sri Lanka is 16 percent for all forms of NR except NR latex for which it is 40 percent.
31

Thank You for Your AttentionThank You for Your AttentionThank You for Your AttentionThank You for Your Attention
Nisha Taneja Sao n Ray Devjit Ro y Cho w dhury Neetika Kaushal
32
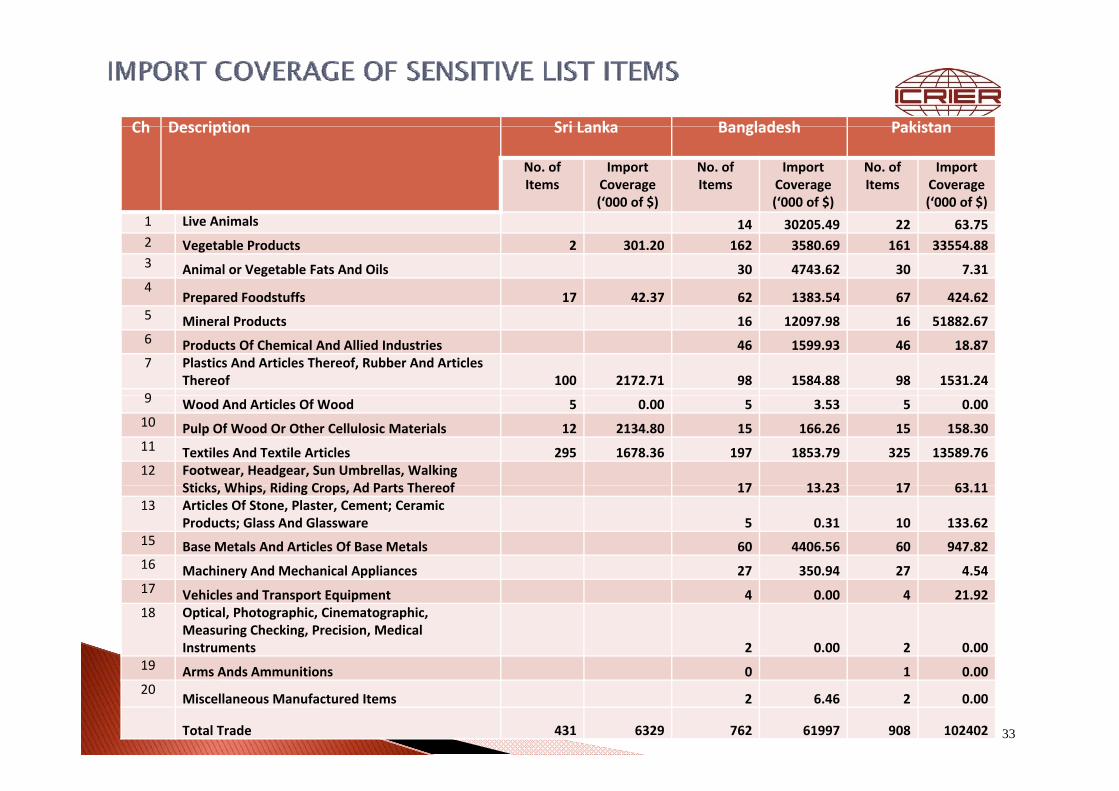
Ch Description Sri Lanka Bangladesh PakistanCh Description Sri Lanka Bangladesh Pakistan
No. of Items
Import Coverage (‘000 of $)
No. of Items
Import Coverage (‘000 of $)
No. of Items
Import Coverage (‘000 of $)
i i l1 Live Animals 14 30205.49 22 63.752 Vegetable Products 2 301.20 162 3580.69 161 33554.883 Animal or Vegetable Fats And Oils 30 4743.62 30 7.314
Prepared Foodstuffs 17 42.37 62 1383.54 67 424.625 Mineral Products 16 12097.98 16 51882.676 Products Of Chemical And Allied Industries 46 1599.93 46 18.877 Plastics And Articles Thereof, Rubber And Articles
Thereof 100 2172.71 98 1584.88 98 1531.2499 Wood And Articles Of Wood 5 0.00 5 3.53 5 0.0010 Pulp Of Wood Or Other Cellulosic Materials 12 2134.80 15 166.26 15 158.3011 Textiles And Textile Articles 295 1678.36 197 1853.79 325 13589.7612 Footwear, Headgear, Sun Umbrellas, Walking
Sticks Whips Riding Crops Ad Parts Thereof 17 13 23 17 63 11Sticks, Whips, Riding Crops, Ad Parts Thereof 17 13.23 17 63.1113 Articles Of Stone, Plaster, Cement; Ceramic
Products; Glass And Glassware 5 0.31 10 133.6215 Base Metals And Articles Of Base Metals 60 4406.56 60 947.8216 Machinery And Mechanical Appliances 27 350.94 27 4.54Machinery And Mechanical Appliances 27 350.94 27 4.5417 Vehicles and Transport Equipment 4 0.00 4 21.9218 Optical, Photographic, Cinematographic,
Measuring Checking, Precision, Medical Instruments 2 0.00 2 0.00
19
33
19 Arms Ands Ammunitions 0 1 0.0020
Miscellaneous Manufactured Items 2 6.46 2 0.00
Total Trade 431 6329 762 61997 908 102402

Chapter Description Sri Lanka Bangladesh Pakistanp p
No. of Items
Import Coverage (‘000 of $)
No. of Items
Import Coverage (‘000 of $)
No. of Items
Import Coverage (‘000 of $)
1 Live Animals4 121 4 12
2 Vegetable Products 1 40 3378 71 192443 Animal Or Vegetable Fats And Oils 10 2586 8 224 Prepared Foodstuffs; Beverages, Spirits And Vinegar; Tobacco And Manufactured
Tobacco Substitutes 14 42 18 1 27 11155 Mineral Products 2 6 536 Products Of Chemical And Allied Industries 10 77 Plastics And Articles Thereof, Rubber And Articles Thereof 32 1489 3 0 26 588 Raw Hides and Skins, Leather, Furskins And Articles Thereof; Saddlery and Harness;
Travel goods, handbags and similar containers; articles of animal gut
9 Wood And Articles Of Wood; Wood Charcoal; Cork And Articles Of Cork; Manufactures Of Straw, Or Esparto, Or Of Other Plaiting Materials; Basket Or Wickerwork 5 4 4 4
10 Pulp Of Wood Or Other Cellulosic Materials; Recovered (Waste And Scrap) Paper And Paperboard; Paper Or Paper board Articles Thereof 6 8 46
11 Textiles And Textile Articles 1 94 514412 Footwear, Headgear, Sun Umbrellas, Walking Sticks, Whips, Riding Crops, Ad Parts
Thereof; Prepared Feathers, And Articles Made Therewith; Artificial Flowers; Articles Of Human Hair 1 3 8 187
13 Articles Of Stone, Plaster, Cement, Asbestos, Mica Or Similar Materials; Ceramic Products; Glass And Glassware 5 6
15 Base Metals And Articles Of Base Metals 6 0 22 84216 Machinery And Mechanical Appliances; Electrical Equipment; Parts Thereof; Sound
R d A d R d A d P t A d A i Of S h A ti l 18 13Recorders And Reproducers, And Parts And Accessories Of Such Articles 18 1317 Vehicles, Aircraft And Vessels, And Associated Transport Equipment 1 218 Optical, Photographic, Cinematographic, Measuring Checking, Precision, Medical
Instruments and Apparatus: Clocks and Watches; Musical Instruments; Parts And Accessories Thereof
19 Arms Ands Ammunitions, Parts And Accessories Thereof 1
34
Arms Ands Ammunitions, Parts And Accessories Thereof
20 Miscellaneous Manufactured Items
21 Works Of Art, Collectors' pieces and Antiques
Total Trade 59 1531 89 5972 322 25733


