Page 1
December 2016 Quick Facts
23456789
1011121314
City of Boston OverviewRegional Map
Median Sales PriceHousing Affordability IndexInventory of Homes for SaleMonths Supply of InventoryDays on Market Until SalePercent of Original List Price Received
Monthly Indicators
Most of 2016 offered the same monthly housing market highlights. The number of homes for sale was drastically down in year-over-year comparisons, along with days on market and months of supply. Meanwhile, sales and prices were up in most markets. Unemployment rates were low, wages improved and, as the year waned, we completed a contentious presidential election and saw mortgage rates increase, neither of which are expected to have a negative impact on real estate in 2017.
Closed Sales decreased 10.2 percent for Single-Family homes and 1.0 percent for Condominium homes. Pending Sales decreased 1.7 percent for Single-Family homes but increased 3.7 percent for Condominium homes. Inventory decreased 35.0 percent for Single-Family homes and 28.6 percent for Condominium homes.
The Median Sales Price was up 9.4 percent to $547,000 for Single-Family homes and 4.8 percent to $465,000 for Condominium homes. Days on Market decreased 21.4 percent for Single-Family homes and 13.5 percent for Condominium homes. Months Supply of Inventory decreased 38.1 percent for Single-Family homes and 31.3 percent for Condominium homes.
The overwhelming feeling about prospects in residential real estate for the immediate future is optimism. Real estate professionals across the nation are expressing that they are as busy as ever. There are certainly challenges in this market, like continued low inventory and higher competition for those fewer properties, but opportunities abound for hardworking agents and diligent consumers.
Data is refreshed regularly to capture changes in market activity so figures shown may be different than previously reported. Current as of January 16, 2017. All data from MLS Property Information Network, Inc. Provided by the Greater Boston Association of REALTORS® and the Massachusetts Association of REALTORS®. Report © 2017 ShowingTime.
Single-Family Home Market Overview
- 6.3% - 10.2% - 1.0%
This is a research tool provided by the Greater Boston Association of REALTORS®. Percent changes are calculated using rounded figures.
Condominium Market Overview
Year-Over-Year (YoY) Change in Closed Sales
All Properties
Year-Over-Year (YoY) Change in Closed Sales
Single-Family Only
Year-Over-Year (YoY) Change in Closed Sales
Condominium Only
Closed Sales
Pending SalesNew Listings
Page 2
Single-Family Home Market Overview
Historical Sparkbars 12-2015 12-2016 PercentChange YTD 2015 YTD 2016 Percent
Change
- 3.9%553 390 - 29.5% 18,117 17,409
Current as of January 16, 2017. All data from MLS Property Information Network, Inc. Provided by the Greater Boston Association of REALTORS® and the Massachusetts Association of REALTORS®. Report © 2017 ShowingTime. | 2
+ 0.4%
Pending Sales 659 648 - 1.7% 14,016 14,149 + 0.9%
Pct. of Orig. List Price Received 96.1% 97.1% + 1.0% 97.9% 98.3%
New Listings
--
Days on Market Until Sale 70 55 - 21.4% 63 59 - 6.3%
Months Supply of Inventory 2.1 1.3 - 38.1% -- --
- 1.2%
Inventory of Homes for Sale 2,394 1,557 - 35.0% -- -- --
Housing Affordability Index 85 81 - 4.7% 83 82
14,073 + 1.7%
Median Sales Price $500,001 $547,000 + 9.4% $515,000 $540,000 + 4.9%
13,831
Key market metrics for the current month and year-to-date figures for Single-Family Homes Only.
Closed Sales 1,250 1,122 - 10.2%
Key Metrics
Dec 2014 Jun 2015 Dec 2015 Jun 2016 Dec 2016
Dec 2014 Jun 2015 Dec 2015 Jun 2016 Dec 2016
Dec 2014 Jun 2015 Dec 2015 Jun 2016 Dec 2016
Dec 2014 Jun 2015 Dec 2015 Jun 2016 Dec 2016
Dec 2014 Jun 2015 Dec 2015 Jun 2016 Dec 2016
Dec 2014 Jun 2015 Dec 2015 Jun 2016 Dec 2016
Dec 2014 Jun 2015 Dec 2015 Jun 2016 Dec 2016
Dec 2014 Jun 2015 Dec 2015 Jun 2016 Dec 2016
Dec 2014 Jun 2015 Dec 2015 Jun 2016 Dec 2016
Page 3
Condominium Market Overview
Historical Sparkbars 12-2015 12-2016 PercentChange YTD 2015 YTD 2016 Percent
Change
Key market metrics for the current month and year-to-date figures for Condominium Properties Only.
Closed Sales 912 903
Median Sales Price $443,750 $465,000
Inventory of Homes for Sale 1,392 994
Days on Market Until Sale 52 45
Housing Affordability Index 96
- 1.0%
Key Metrics
11,142 + 4.7%10,642
95 - 1.0% 95 91 - 4.2%
+ 4.8% $450,000 $485,114 + 7.8%
--
-- --
- 28.6% -- --
Months Supply of Inventory 1.6 1.1 - 31.3% --
- 13.5% 50
- 0.0%
Pct. of Orig. List Price Received 98.3% 98.5% + 0.2% 100.0%
- 8.0%
100.3% + 0.3%
46
Current as of January 16, 2017. All data from MLS Property Information Network, Inc. Provided by the Greater Boston Association of REALTORS® and the Massachusetts Association of REALTORS®. Report © 2017 ShowingTime. | 3
+ 3.7%Pending Sales 518 537 + 3.7% 10,897 11,299
New Listings 462 433 - 6.3% 13,424 13,419
Dec 2014 Jun 2015 Dec 2015 Jun 2016 Dec 2016
Dec 2014 Jun 2015 Dec 2015 Jun 2016 Dec 2016
Dec 2014 Jun 2015 Dec 2015 Jun 2016 Dec 2016
Dec 2014 Jun 2015 Dec 2015 Jun 2016 Dec 2016
Dec 2014 Jun 2015 Dec 2015 Jun 2016 Dec 2016
Dec 2014 Jun 2015 Dec 2015 Jun 2016 Dec 2016
Dec 2014 Jun 2015 Dec 2015 Jun 2016 Dec 2016
Dec 2014 Jun 2015 Dec 2015 Jun 2016 Dec 2016
Dec 2014 Jun 2015 Dec 2015 Jun 2016 Dec 2016
Page 4
Closed Sales
Closed Sales Single-FamilyYear-Over-Year
Change CondominiumYear-Over-Year
Change
Jan-2016 843 +17.7% 604 +24.5%
Feb-2016 589 +10.9% 473 +4.6%
Mar-2016 779 +13.9% 756 +30.6%
Apr-2016 929 +21.9% 828 +20.0%
May-2016 1,249 +17.8% 1,121 +17.0%
Jun-2016 1,938 +3.6% 1,412 +1.7%
Jul-2016 1,605 -15.6% 1,159 -15.8%
Aug-2016 1,716 +0.4% 1,215 -3.0%
Sep-2016 1,157 -5.0% 1,008 +7.0%
Oct-2016 962 -14.1% 827 -0.5%
Nov-2016 1,184 +17.6% 836 +7.9%
Dec-2016 1,122 -10.2% 903 -1.0%
12-Month Avg 1,173 +1.7% 929 +4.7%
Historical Closed Sales by Month
Current as of January 16, 2017. All data from MLS Property Information Network, Inc. Provided by the Greater Boston Association of REALTORS® and the Massachusetts Association of REALTORS®. Report © 2017 ShowingTime. | 4
A count of the actual sales that closed in a given month.
1,124
844
1,250
912
1,122
903
Single-Family Condominium
December
0
500
1,000
1,500
2,000
2,500
1-2003 1-2004 1-2005 1-2006 1-2007 1-2008 1-2009 1-2010 1-2011 1-2012 1-2013 1-2014 1-2015 1-2016
Single-Family Condominium
12,949
10,632
13,831
10,642
14,073
11,142
Single-Family Condominium
Year to Date
2014 2015 2016
- 1.0%+ 8.1%- 10.2%+ 11.2% + 0.1%+ 1.7%+ 6.8% + 4.7%
2014 2015 2016 2014 2015 2016 2014 2015 2016
+ 4.0% - 5.8% - 4.0%+ 1.0%
Page 5
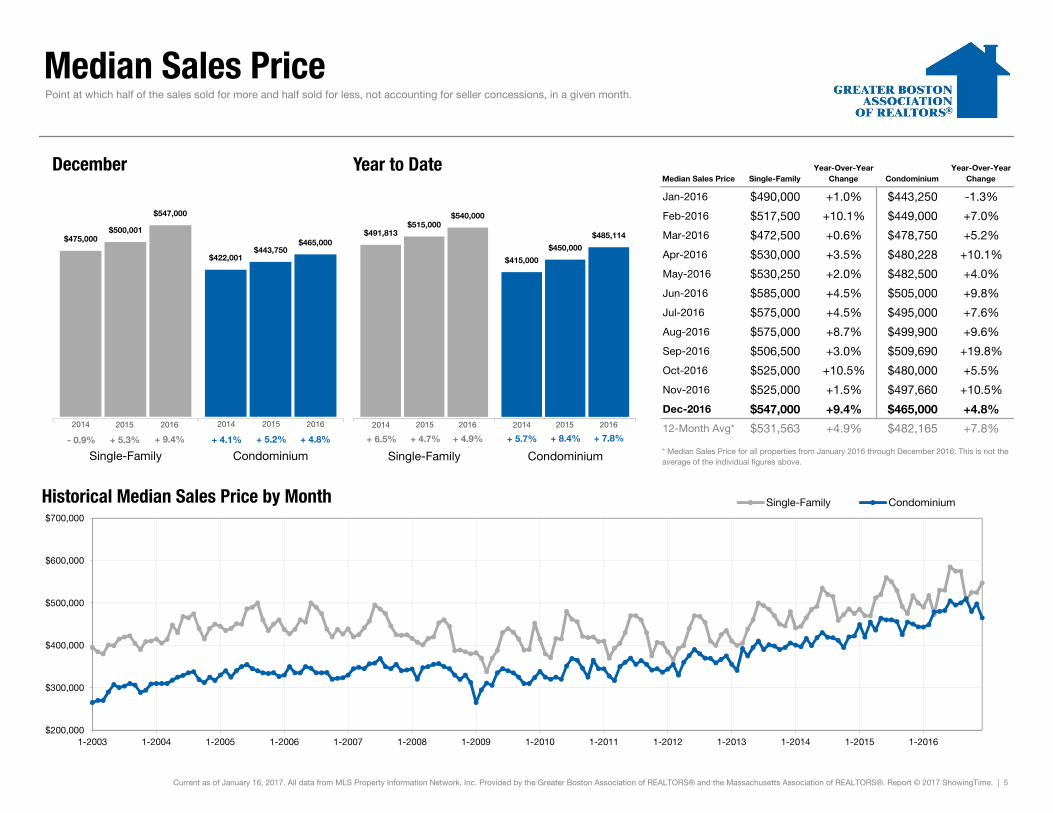
Median Sales Price
Median Sales Price Single-FamilyYear-Over-Year
Change CondominiumYear-Over-Year
Change
Jan-2016 $490,000 +1.0% $443,250 -1.3%
Feb-2016 $517,500 +10.1% $449,000 +7.0%
Mar-2016 $472,500 +0.6% $478,750 +5.2%
Apr-2016 $530,000 +3.5% $480,228 +10.1%
May-2016 $530,250 +2.0% $482,500 +4.0%
Jun-2016 $585,000 +4.5% $505,000 +9.8%
Jul-2016 $575,000 +4.5% $495,000 +7.6%
Aug-2016 $575,000 +8.7% $499,900 +9.6%
Sep-2016 $506,500 +3.0% $509,690 +19.8%
Oct-2016 $525,000 +10.5% $480,000 +5.5%
Nov-2016 $525,000 +1.5% $497,660 +10.5%
Dec-2016 $547,000 +9.4% $465,000 +4.8%
12-Month Avg* $531,563 +4.9% $482,165 +7.8%
Historical Median Sales Price by Month
* Median Sales Price for all properties from January 2016 through December 2016. This is not the average of the individual figures above.
Current as of January 16, 2017. All data from MLS Property Information Network, Inc. Provided by the Greater Boston Association of REALTORS® and the Massachusetts Association of REALTORS®. Report © 2017 ShowingTime. | 5
Point at which half of the sales sold for more and half sold for less, not accounting for seller concessions, in a given month.
$475,000
$422,001
$500,001
$443,750
$547,000
$465,000
Single-Family Condominium
December
$200,000
$300,000
$400,000
$500,000
$600,000
$700,000
1-2003 1-2004 1-2005 1-2006 1-2007 1-2008 1-2009 1-2010 1-2011 1-2012 1-2013 1-2014 1-2015 1-2016
Single-Family Condominium
$491,813
$415,000
$515,000
$450,000
$540,000
$485,114
Single-Family Condominium
Year to Date
2014 2015 2016
+ 4.8%+ 5.2%+ 9.4%+ 5.3% + 8.4%+ 4.9%+ 4.7% + 7.8%
2014 2015 2016 2014 2015 2016 2014 2015 2016
- 0.9% + 6.5% + 5.7%+ 4.1%
Page 6
Housing Affordability Index
Affordability Index Single-FamilyYear-Over-Year
Change CondominiumYear-Over-Year
Change
Jan-2016 86 -3.4% 95 -2.1%
Feb-2016 85 -7.6% 97 -6.7%
Mar-2016 92 +1.1% 91 -3.2%
Apr-2016 82 -3.5% 91 -8.1%
May-2016 82 -2.4% 90 -4.3%
Jun-2016 76 0.0% 88 -5.4%
Jul-2016 77 +1.3% 89 -2.2%
Aug-2016 77 -3.8% 89 -4.3%
Sep-2016 88 +1.1% 87 -13.9%
Oct-2016 84 -6.7% 92 -2.1%
Nov-2016 84 +2.4% 89 -5.3%
Dec-2016 81 -4.7% 95 -1.0%
12-Month Avg 83 -2.1% 91 -5.0%
Historical Housing Affordability Index by Month
Current as of January 16, 2017. All data from MLS Property Information Network, Inc. Provided by the Greater Boston Association of REALTORS® and the Massachusetts Association of REALTORS®. Report © 2017 ShowingTime. | 6
This index measures housing affordability for the region. For example, an index of 120 means the median household income is 120% of what is necessary to qualify for the median-priced home under prevailing interest rates. A higher number means greater affordability.
87
97
85
96
81
95
Single-Family Condominium
December
40
60
80
100
120
140
1-2003 1-2004 1-2005 1-2006 1-2007 1-2008 1-2009 1-2010 1-2011 1-2012 1-2013 1-2014 1-2015 1-2016
Single-Family Condominium
84
99
83
95
8291
Single-Family Condominium
Year to Date
2014 2015 2016
- 1.0%- 1.0%- 4.7%- 2.3% - 4.0%- 1.2%- 1.2% - 4.2%
2014 2015 2016 2014 2015 2016 2014 2015 2016
+ 6.1% - 1.2% - 1.0%0.0%
Page 7
Inventory of Homes for Sale
Homes for Sale Single-FamilyYear-Over-Year
Change CondominiumYear-Over-Year
Change
Jan-2016 2,337 +3.2% 1,390 +9.1%
Feb-2016 2,363 +15.0% 1,387 +13.7%
Mar-2016 2,873 +27.5% 1,650 +20.5%
Apr-2016 3,206 +7.2% 1,686 -2.1%
May-2016 3,247 -8.3% 1,678 -13.4%
Jun-2016 3,380 -8.8% 1,711 -11.6%
Jul-2016 3,210 -13.6% 1,720 -9.2%
Aug-2016 2,912 -19.1% 1,564 -13.7%
Sep-2016 3,275 -16.4% 1,885 -10.7%
Oct-2016 3,005 -20.2% 1,775 -13.5%
Nov-2016 2,355 -25.2% 1,451 -20.2%
Dec-2016 1,557 -35.0% 994 -28.6%
12-Month Avg 2,810 -9.7% 1,574 -8.0%
Historical Inventory of Homes for Sale by Month
Current as of January 16, 2017. All data from MLS Property Information Network, Inc. Provided by the Greater Boston Association of REALTORS® and the Massachusetts Association of REALTORS®. Report © 2017 ShowingTime. | 7
The number of properties available for sale in active status at the end of a given month.
2,399
1,249
2,394
1,3921,557
994
Single-Family Condominium
December
0
2,000
4,000
6,000
8,000
10,000
1-2003 1-2004 1-2005 1-2006 1-2007 1-2008 1-2009 1-2010 1-2011 1-2012 1-2013 1-2014 1-2015 1-2016
Single-Family Condominium
2014 2015 2016
- 28.6%+ 11.4%- 35.0%- 0.2%2014 2015 2016
+ 4.9% - 15.2%
Page 8
Months Supply of Inventory
Months Supply Single-FamilyYear-Over-Year
Change CondominiumYear-Over-Year
Change
Jan-2016 2.0 -4.8% 1.6 +14.3%
Feb-2016 2.0 +5.3% 1.5 +7.1%
Mar-2016 2.4 +14.3% 1.8 +12.5%
Apr-2016 2.7 -3.6% 1.8 -10.0%
May-2016 2.7 -18.2% 1.8 -21.7%
Jun-2016 2.8 -17.6% 1.8 -21.7%
Jul-2016 2.7 -20.6% 1.9 -13.6%
Aug-2016 2.5 -21.9% 1.7 -19.0%
Sep-2016 2.8 -20.0% 2.0 -16.7%
Oct-2016 2.6 -21.2% 1.9 -20.8%
Nov-2016 2.0 -28.6% 1.6 -23.8%
Dec-2016 1.3 -38.1% 1.1 -31.3%
12-Month Avg* 2.4 -15.7% 1.7 -13.5%
Historical Months Supply of Inventory by Month
* Months Supply for all properties from January 2016 through December 2016. This is not the average of the individual figures above.
Current as of January 16, 2017. All data from MLS Property Information Network, Inc. Provided by the Greater Boston Association of REALTORS® and the Massachusetts Association of REALTORS®. Report © 2017 ShowingTime. | 8
The inventory of homes for sale at the end of a given month, divided by the average monthly closed sales from the last 12 months.
2.2
1.4
2.1
1.61.3
1.1
Single-Family Condominium
December
0.0
2.0
4.0
6.0
8.0
10.0
1-2004 1-2005 1-2006 1-2007 1-2008 1-2009 1-2010 1-2011 1-2012 1-2013 1-2014 1-2015 1-2016
Single-Family Condominium
2014 2015 2016
- 31.3%+ 14.3%- 38.1%- 4.5%2014 2015 2016
+ 10.0% - 12.5%
Page 9
Days on Market Until Sale
Days on Market Single-FamilyYear-Over-Year
Change CondominiumYear-Over-Year
Change
Jan-2016 74 -11.9% 58 -1.7%
Feb-2016 91 -3.2% 64 -13.5%
Mar-2016 80 -13.0% 60 -9.1%
Apr-2016 70 -10.3% 48 -18.6%
May-2016 58 -1.7% 46 +2.2%
Jun-2016 49 -5.8% 41 +5.1%
Jul-2016 51 +4.1% 41 +2.5%
Aug-2016 56 +3.7% 41 -8.9%
Sep-2016 52 -8.8% 41 -18.0%
Oct-2016 56 -12.5% 41 -18.0%
Nov-2016 51 -16.4% 40 -28.6%
Dec-2016 55 -21.4% 45 -13.5%
12-Month Avg* 62 -6.5% 47 -8.1%
Historical Days on Market Until Sale by Month
* Days on Market for all properties from January 2016 through December 2016. This is not the average of the individual figures above.
Current as of January 16, 2017. All data from MLS Property Information Network, Inc. Provided by the Greater Boston Association of REALTORS® and the Massachusetts Association of REALTORS®. Report © 2017 ShowingTime. | 9
Average number of days between when a property is listed and when an offer is accepted in a given month.
69
55
70
5255
45
Single-Family Condominium
December
20
40
60
80
100
120
140
1-2003 1-2004 1-2005 1-2006 1-2007 1-2008 1-2009 1-2010 1-2011 1-2012 1-2013 1-2014 1-2015 1-2016
Single-Family Condominium
60
53
63
50
59
46
Single-Family Condominium
Year to Date
2014 2015 2016
- 13.5%- 5.5%- 21.4%+ 1.4% - 5.7%- 6.3%+ 5.0% - 8.0%
2014 2015 2016 2014 2015 2016 2014 2015 2016
+ 9.5% - 1.6% + 1.9%0.0%
Page 10
Percent of Original List Price Received
Pct. of Orig. List Price Received Single-Family
Year-Over-YearChange Condominium
Year-Over-YearChange
Jan-2016 95.8% -0.1% 97.9% +0.1%
Feb-2016 95.7% +0.5% 98.1% -0.1%
Mar-2016 97.7% +1.2% 99.7% +1.0%
Apr-2016 98.4% +1.0% 101.1% +0.5%
May-2016 99.3% +0.2% 101.4% +0.5%
Jun-2016 99.8% +0.1% 101.7% +0.1%
Jul-2016 99.6% +0.1% 101.5% +0.4%
Aug-2016 98.6% +0.1% 100.8% +0.2%
Sep-2016 97.9% +0.2% 100.0% +0.5%
Oct-2016 98.0% +1.3% 99.7% 0.0%
Nov-2016 98.2% +0.8% 99.7% +0.4%
Dec-2016 97.1% +1.0% 98.5% +0.2%
12-Month Avg* 98.0% +0.4% 100.0% +0.2%
Historical Percent of Original List Price Received by Month
* Pct. of Orig. List Price Received for all properties from January 2016 through December 2016. This is not the average of the individual figures above.
Current as of January 16, 2017. All data from MLS Property Information Network, Inc. Provided by the Greater Boston Association of REALTORS® and the Massachusetts Association of REALTORS®. Report © 2017 ShowingTime. | 10
Percentage found when dividing a property’s sales price by its original list price, then taking the average for all properties soldin a given month, not accounting for seller concessions.
95.6% 97.9%96.1% 98.3%97.1% 98.5%
Single-Family Condominium
December
87.5%
90.0%
92.5%
95.0%
97.5%
100.0%
102.5%
1-2003 1-2004 1-2005 1-2006 1-2007 1-2008 1-2009 1-2010 1-2011 1-2012 1-2013 1-2014 1-2015 1-2016
Single-Family Condominium
97.6% 99.3%97.9% 100.0%98.3% 100.3%
Single-Family Condominium
Year to Date
2014 2015 2016
+ 0.2%+ 0.4%+ 1.0%+ 0.5% + 0.7%+ 0.4%+ 0.3% + 0.3%
2014 2015 2016 2014 2015 2016 2014 2015 2016
- 0.5% + 0.6% + 0.6%- 0.1%
Page 11
Pending Sales
Pending Sales Single-FamilyYear-Over-Year
Change CondominiumYear-Over-Year
Change
Jan-2016 683 -3.1% 648 +18.5%
Feb-2016 883 +39.7% 823 +45.1%
Mar-2016 1,430 +29.4% 1,128 +13.3%
Apr-2016 1,586 +2.6% 1,301 +2.1%
May-2016 1,769 +0.5% 1,299 +0.2%
Jun-2016 1,608 -9.9% 1,194 -13.9%
Jul-2016 1,140 -11.1% 873 -9.4%
Aug-2016 1,115 -0.5% 882 +8.5%
Sep-2016 1,164 -4.0% 916 +6.5%
Oct-2016 1,147 -8.8% 933 -2.1%
Nov-2016 976 +2.7% 765 +6.0%
Dec-2016 648 -1.7% 537 +3.7%
12-Month Avg 1,179 +0.9% 942 +3.7%
Historical Pending Sales by Month
A count of the properties in UAG status between the first and last day in a given month, regardless of current status (based on Off Market Date).
Current as of January 16, 2017. All data from MLS Property Information Network, Inc. Provided by the Greater Boston Association of REALTORS® and the Massachusetts Association of REALTORS®. Report © 2017 ShowingTime. | 11
589
463
659
518
648
537
Single-Family Condominium
December
250
500
750
1,000
1,250
1,500
1,750
2,000
1-2003 1-2004 1-2005 1-2006 1-2007 1-2008 1-2009 1-2010 1-2011 1-2012 1-2013 1-2014 1-2015 1-2016
Single-Family Condominium
13,034
10,558
14,016
10,897
14,149
11,299
Single-Family Condominium
Year to Date
2014 2015 2016
+ 3.7%+ 11.9%- 1.7%+ 11.9% + 3.2%+ 0.9%+ 7.5% + 3.7%
2014 2015 2016 2014 2015 2016 2014 2015 2016
+ 5.9% - 5.2% - 5.6%+ 3.1%
Page 12
New Listings
New Listings Single-FamilyYear-Over-Year
Change CondominiumYear-Over-Year
Change
Jan-2016 903 +7.4% 805 +13.5%
Feb-2016 1,126 +76.8% 938 +50.6%
Mar-2016 2,168 +45.1% 1,545 +22.2%
Apr-2016 2,120 -14.2% 1,472 -15.0%
May-2016 2,071 -18.2% 1,439 -13.4%
Jun-2016 2,114 -6.9% 1,441 -8.0%
Jul-2016 1,317 -19.2% 1,109 -0.7%
Aug-2016 1,202 -9.7% 956 +2.1%
Sep-2016 1,890 -3.2% 1,476 +2.5%
Oct-2016 1,272 -16.6% 1,065 -7.6%
Nov-2016 836 -4.8% 740 -2.6%
Dec-2016 390 -29.5% 433 -6.3%
12-Month Avg 1,451 -3.9% 1,118 -0.0%
Historical New Listings by Month
Current as of January 16, 2017. All data from MLS Property Information Network, Inc. Provided by the Greater Boston Association of REALTORS® and the Massachusetts Association of REALTORS®. Report © 2017 ShowingTime. | 12
A count of the properties that have been newly listed on the market in a given month.
501
399
553
462
390433
Single-Family Condominium
December
0
1,000
2,000
3,000
4,000
1-2003 1-2004 1-2005 1-2006 1-2007 1-2008 1-2009 1-2010 1-2011 1-2012 1-2013 1-2014 1-2015 1-2016
Single-Family Condominium
17,373
12,778
18,117
13,424
17,409
13,419
Single-Family Condominium
Year to Date
2014 2015 2016
- 6.3%+ 15.8%- 29.5%+ 10.4% + 5.1%- 3.9%+ 4.3% - 0.0%
2014 2015 2016 2014 2015 2016 2014 2015 2016
+ 3.5% - 0.2% - 5.8%+ 0.3%
Page 13
City of Boston - Market Overview
Historical Sparkbars 12-2015 12-2016 PercentChange YTD 2015 YTD 2016 Percent
Change
Key market metrics for the current month and year-to-date figures for the City of Boston.
Closed Sales 459 441 - 3.9%
Key Metrics
5,346 + 0.5%
Median Sales Price $505,000 $550,000 + 8.9% $515,000 $561,000 + 8.9%
5,319
Housing Affordability Index 93 89 - 4.3% 91 87 - 4.4%
----
Months Supply of Inventory 1.7 1.3 - 23.5% --
Inventory of Homes for Sale 747 574 - 23.2% --
47 46
-- --
- 6.2% 5,465
- 2.1%
Pct. of Orig. List Price Received 98.2% 98.4% + 0.2% 99.7% 99.7% 0.0%
Days on Market Until Sale 51 44 - 13.7%
Current as of January 16, 2017. All data from MLS Property Information Network, Inc. Provided by the Greater Boston Association of REALTORS® and the Massachusetts Association of REALTORS®. Report © 2017 ShowingTime. | 13
- 0.6%
6,706 - 1.8%
5,430
New Listings 260 186 - 28.5% 6,831
Pending Sales 260 244
Dec 2014 Jun 2015 Dec 2015 Jun 2016 Dec 2016
Dec 2014 Jun 2015 Dec 2015 Jun 2016 Dec 2016
Dec 2014 Jun 2015 Dec 2015 Jun 2016 Dec 2016
Dec 2014 Jun 2015 Dec 2015 Jun 2016 Dec 2016
Dec 2014 Jun 2015 Dec 2015 Jun 2016 Dec 2016
Dec 2014 Jun 2015 Dec 2015 Jun 2016 Dec 2016
Dec 2014 Jun 2015 Dec 2015 Jun 2016 Dec 2016
Dec 2014 Jun 2015 Dec 2015 Jun 2016 Dec 2016
Dec 2014 Jun 2015 Dec 2015 Jun 2016 Dec 2016
Page 14
Regional Map
Central Middlesex Region Metro West RegionActon AshlandBedford DoverBoxboro FraminghamConcord HollistonHudson HopkintonLexington MedfieldLincoln MedwayMaynard MillisStow NatickSudbury NeedhamWayland SherbornWeston Wellesley
Eastern Middlesex Region Southern Norfolk RegionBurlington AvonMalden BellinghamMedford CantonMelrose FoxboroNorth Reading FranklinReading MansfieldStoneham NorfolkWakefield NorwoodWilmington RandolphWinchester SharonWoburn Stoughton
WalpoleMetro Boston Region WestwoodArlington WrenthamBelmontBostonBrooklineCambridgeChelseaDedhamEverettMiltonNewtonRevereSomervilleWalthamWatertownWinthrop
A map of the the 64 areas and 5 regions that make up "Greater Boston."
Greater Boston Association of REALTORS® Regional Map
Communities by Region
Current as of January 16, 2017. All data from MLS Property Information Network, Inc. Provided by the Greater Boston Association of REALTORS® and the Massachusetts Association of REALTORS®. Report © 2017 ShowingTime. | 14