Orrick, Herrington & Sutcliffe LLP Columbia Center 1152 15th Street, N.W. Washington, DC 20005-1706 +1 202 339 8400 orrick.com Erik Swenson E [email protected]D +1 202 339 8494 F +1 202 339 8500 December 22, 2017 Larine A. Moore U.S. Department of Energy FE-34 P.O. Box 44375 Washington, DC 20026-4375 Re: Application for Long-Term Authorization to Export LNG from the United States to Both Free Trade and Non-Free Trade Agreement Countries Dear Ms. Moore: Galveston Bay LNG, LLC (“GB LNG”), through its counsel Orrick, Herrington & Sutcliffe LLP, hereby submits to the Office of Fossil Energy of the Department of Energy (“DOE/FE”) the attached application by GB LNG for long-term authorizations to export liquefied natural gas (“LNG”) to (1) countries with which the U.S. has a Free Trade Agreement requiring the national treatment for trade in natural gas (“FTA”), and (2) countries with which the U.S. permits trade but the U.S. does not have a FTA. The required $50 filing fee is being sent separately by overnight courier. Any questions regarding this matter may be direct to GB LNG’s counsel: Erik J.A. Swenson Orrick, Herrington & Sutcliffe LLP 1152 15 th Street, N.W. Washington, D.C. 20005-1706 [email protected]Thank you for your attention to these matters. Respectfully submitted, /s/ Erik J.A. Swenson Erik J.A. Swenson Counsel for GB LNG, LLC EJAS Enclosures cc: Amy Sweeney
Re: Application for Long-Term Authorization to Export LNG from the United States to Both Free
Trade and Non-Free Trade Agreement Countries
Dear Ms. Moore:
Galveston Bay LNG, LLC (“GB LNG”), through its counsel Orrick, Herrington & Sutcliffe LLP, hereby
submits to the Office of Fossil Energy of the Department of Energy (“DOE/FE”) the attached application
by GB LNG for long-term authorizations to export liquefied natural gas (“LNG”) to (1) countries with which
the U.S. has a Free Trade Agreement requiring the national treatment for trade in natural gas (“FTA”),
and (2) countries with which the U.S. permits trade but the U.S. does not have a FTA.
The required $50 filing fee is being sent separately by overnight courier.
Any questions regarding this matter may be direct to GB LNG’s counsel:
Erik J.A. Swenson Orrick, Herrington & Sutcliffe LLP 1152 15th Street, N.W. Washington, D.C. 20005-1706 [email protected]
Thank you for your attention to these matters.
Respectfully submitted,
/s/ Erik J.A. Swenson
Erik J.A. Swenson
Counsel for GB LNG, LLC
EJAS
Enclosures
cc: Amy Sweeney
WoodNa
Received
woodna
Text Box
17-167-LNG
UNITED STATES OF AMERICA BEFORE THE DEPARTMENT OF ENERGY
OFFICE OF FOSSIL ENERGY
In The Matter Of: ) )
GALVESTON BAY LNG, LLC ) Docket No. 17-[___]-LNG )
APPLICATION FOR LONG-TERM, MULTI-CONTRACT AUTHORIZATION TO EXPORT LIQUEFIED NATURAL GAS
Shaun Davison Erik J.A. Swenson Senior VP, Development & Regulatory Affairs Partner Galveston Bay LNG, LLC Orrick, Herrington & Sutcliffe LLP 3 Waterway Square Place 1152 15th Street, N.W. Suite 400 Washington, DC 20005-1706 The Woodlands, TX 77380 Telephone: (202) 339-8494 Telephone & Facsimile: (832) 403-3040 Facsimile: (202) 339-8500 Email: [email protected] Email: [email protected]
Krysta De Lima Tyler J. Hall General Counsel Associate Galveston Bay LNG, LLC Orrick, Herrington & Sutcliffe LLP 3 Waterway Square Place 2121 Main Street Suite 400 Wheeling, WV 26003-2809 The Woodlands, TX 77380 Telephone: (304) 231-2592 Telephone & Facsimile: (832) 403-2198 Facsimile: (304) 231-2501 Email: [email protected] Email: [email protected]
TABLE OF CONTENTS
Page
i
I. COMMUNICATIONS AND CORRESPONDENCES ..................................................... 3
II. DESCRIPTION OF THE APPLICANT ............................................................................ 3
III. EXECUTIVE SUMMARY ............................................................................................... 4
IV. AUTHORIZATION REQUESTED .................................................................................. 7
V. DESCRIPTION OF THE PROJECT ................................................................................. 9
A. Galveston Bay LNG Project Facilities ................................................................... 9
B. Export Sources ..................................................................................................... 12
C. Commercial Arrangements .................................................................................. 18
VI. APPLICABLE LEGAL STANDARD ............................................................................ 18
VII. PUBLIC INTEREST ANALYSIS ................................................................................... 22
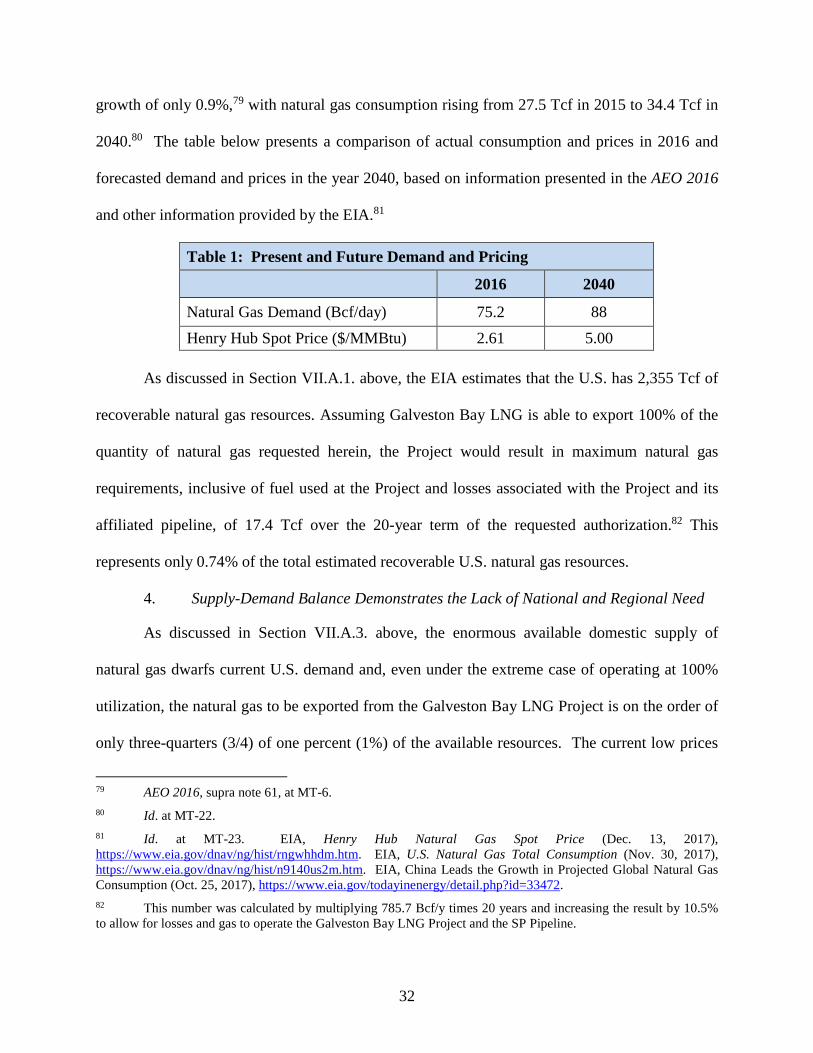
A. Analysis Of Domestic Need For Gas To Be Exported ........................................ 25
1. National Supply - Overview .................................................................... 27
3. National Natural Gas Demand ................................................................. 30
4. Supply-Demand Balance Demonstrates the Lack of National and Regional Need .......................................................................................... 31
5. Price Impacts – Natural Gas .................................................................... 32
B. Other Public Interest Considerations ................................................................... 34
1. Promote Long-Term Stability in Natural Gas Markets............................ 34
2. Benefits to Local, Regional and U.S. Economies .................................... 36
3. Benefits from Stimulation of the Natural Gas Industry ........................... 37
4. International Considerations .................................................................... 37
VIII. RELATED AUTHORIZATIONS AND ENVIRONMENTAL IMPACTS.................... 41
IX. REPORT CONTACT INFORMATION ......................................................................... 42
XI. CONCLUSION ................................................................................................................ 43
UNITED STATES OF AMERICA BEFORE THE DEPARTMENT OF ENERGY
OFFICE OF FOSSIL ENERGY
In The Matter Of: ) ) Docket No. 17 – [__] - LNG
GALVESTON BAY LNG, LLC ) )
)
APPLICATION FOR LONG-TERM, MULTI-CONTRACT AUTHORIZATION TO EXPORT LIQUEFIED NATURAL GAS
Pursuant to Section 3 of the Natural Gas Act (“NGA”)1 and Part 590 of the Department
of Energy’s (“DOE”) regulations,2 Galveston Bay LNG, LLC (“Galveston Bay LNG”) hereby
requests that DOE, Office of Fossil Energy (“DOE/FE”), grant long-term, multi-contract
authorization for Galveston Bay LNG to engage in exports of up to 785.7 billion cubic feet per
year (“Bcf/y”) of natural gas in the form of liquefied natural gas (“LNG”), which is the
equivalent of approximately 16.5 million metric tons per annum (“MTPA”) and 808.8 trillion
British thermal units per year (“Btu/y”) or 808,799,580 million Btu/y of natural gas.3 Galveston
Bay LNG requests this authorization for a 20-year term commencing on the earlier of (i) the date
1 15 U.S.C. § 717b (2012).
2 10 C.F.R. Part 590 (2017).
3 Based on 0.021 million metric tons of LNG = 1 Bcf of natural gas. See BP, Approximate Conversion Factors: Statistical Review of World Energy, https://www.bp.com/content/dam/bp/en/corporate/pdf/energy-economics/statistical-review-2017/bp-statistical-review-of%20world%20energy-2017-approximate-conversion-factors.pdf. The volumetric conversion of natural gas to heat content in Btu is based upon 1 cubic foot (“cf”) = 1,029.4 Btu. This conversion factor represents the average heat content of 1 standard cubic foot of natural gas at Station 35 (Texas) of Williams’ Transcontinental Pipeline from September 14, 2017 to December 11, 2017, as listed on the company’s website (http://www.1line.williams.com/Transco/index.html) (follow “Gas Quality” hyperlink). During this period, the heat content ranged from a maximum of 1,069.4 Btu/cf to a minimum of 1,012.6 Btu/cf with a median of 1,026.6 Btu/cf and an average of 1,029.4 Btu/cf.
2
of first export;4 or (ii) seven (7) years from the date authorization is issued to export LNG from
its proposed Galveston Bay LNG Project (“Galveston Bay LNG Project” or “Project”), to be
located in Texas City, Texas on the eastern side of the Texas City turning basin and on the
southern side of the Texas City dike, within the Texas City industrial complex cluster, adjacent
to the Port of Texas City and near the Port of Houston and the Port of Galveston.5 Galveston
Bay LNG proposes to export LNG to (a) any nation that currently has or develops the capacity to
import LNG via ocean-going carrier and with which the United States currently has, or in the
future enters into, a Free Trade Agreement requiring the national treatment for trade in natural
gas and LNG (“FTA Country” or “FTA Countries”); and (b) any nation (i) with which the U.S.
does not have an FTA requiring the national treatment for trade in natural gas and LNG; (ii) that
has, or in the future develops, the capacity to import LNG via ocean-going carrier; and (iii) with
which trade is not prohibited by U.S. law or policy (a “Non-FTA Country” or “Non-FTA
Countries”). Galveston Bay LNG is requesting this authorization both on its own behalf and as
agent for third parties who hold title to the LNG at the time of export.
4 For these purposes, “first export” refers to the initial export of LNG upon the first LNG train at the facility entering full commercial service. As has been the case for other LNG export terminals, Galveston Bay LNG intends to separately request short-term blanket authorizations to cover the export of cargoes during the start-up and commissioning process. Galveston Bay LNG requests that DOE/FE allow Galveston Bay LNG to apply for short-term export authorizations to export “Commissioning Volumes” prior to the commencement of the first commercial exports of domestically sourced LNG from the Galveston Bay LNG Project, where “Commissioning Volumes” are defined as the volume of LNG produced and exported under a short-term authorization during the initial start-up of each LNG train, before each LNG train has reached its full steady-state capacity and begun its commercial exports pursuant to long-term contracts and where such Commissioning Volumes will not be counted against the maximum level of volumes authorized by DOE/FE in response to this Application. See, e.g., Eagle LNG Partners Jacksonville II LLC., Opinion and Order Granting Long-Term, Multi-Contract Authorization to Export Liquefied Natural Gas in ISO Containers Loaded at the Eagle Maxville Facility in Jacksonville, Florida, and Exported by Vessel to Free Trade Agreement and Non-Free Trade Agreement Nations, FE Docket No. 17-79-LNG, DOE/FE Order No. 4078 (Sept. 15, 2017) (hereinafter, “Eagle LNG, DOE/FE Order No. 4078”).
5 The Galveston Bay LNG Project site is located at Latitude (North): 29° 22’13.90” and Longitude (West): 94° 52’36.84”. A locator map and additional graphical information showing the specific and relative location of the Galveston Bay LNG Project site is attached hereto as Appendix A. NextDecade has entered into two Lease Agreements granting it the exclusive right to lease the combined approximately 994-acre Galveston Bay LNG Project site from the current landowners, the City of Texas City, Texas and the Texas General Land Office. See Appendix B.
3
In support of its Application, Galveston Bay LNG states as follows:
I. COMMUNICATIONS AND CORRESPONDENCES
Galveston Bay LNG requests that all communications and correspondences regarding this
Application, including all service of pleadings and notices, should be directed to the following
persons:6
Shaun Davison Erik J.A. Swenson Senior VP, Development & Regulatory Affairs Partner Galveston Bay LNG, LLC Orrick, Herrington & Sutcliffe LLP 3 Waterway Square Place 1152 15th Street Suite 400 Washington, D.C. 20005-1706 The Woodlands, TX 77380 Telephone: (202) 339-8494 Telephone & Facsimile: (832) 403-3040 Facsimile: (202) 339-8500 Email: [email protected] Email: [email protected]
Krysta De Lima General Counsel Galveston Bay LNG, LLC 3 Waterway Square Place Suite 400 The Woodlands, TX 77380 Telephone & Facsimile: (832) 403-2198 Email: [email protected]
Tyler J. Hall Associate Orrick, Herrington & Sutcliffe LLP 2121 Main Street Wheeling, WV 26003-2809 Telephone: (304) 231-2592 Facsimile: (304) 231-2501 Email: [email protected]
II. DESCRIPTION OF THE APPLICANT
The exact legal name of Galveston Bay LNG is Galveston Bay LNG, LLC. Galveston
Bay LNG is a limited liability company organized under the laws of Texas with its principal
place of business located at 3 Waterway Square Place, Suite 400, The Woodlands, Texas 77380.
6 Galveston Bay LNG requests waiver of Section 590.202(a) of the DOE regulations, 10 C.F.R. § 590.202(a) (2017), to the extent necessary to include outside counsel on the official service list in this proceeding. Pursuant to Section 590.103(b) of the DOE regulations, 10 C.F.R. § 590.103(b) (2017), Galveston Bay LNG hereby certifies that the persons listed herein are the duly authorized representatives of Galveston Bay LNG.
4
Its telephone number is (713) 574-1880, and its fax number is (832) 426-1874. Galveston Bay
LNG is one hundred percent (100%) owned by NextDecade LNG, LLC (“NextDecade”).7
NextDecade is a U.S.-based company owned solely by NextDecade Corporation, a
publicly listed company on the NASDAQ. It is an energy project development and management
company formed around a team of professionals, each with decades of experience in
international LNG and the energy industry.
III. EXECUTIVE SUMMARY
Galveston Bay LNG is seeking multi-contract, long-term authorization to engage in
exports of up to 785.7 Bcf/y of natural gas in the form of LNG to both FTA and Non-FTA
Countries for a twenty (20) year term commencing on the earlier of the date of first export or
seven (7) years from the date of issuance of the authorization requested herein. Galveston Bay
LNG is requesting this authorization in order to act on its own behalf and as agent for third
parties.
Galveston Bay LNG is seeking this export authorization in conjunction with its proposal
to construct, own and operate the Galveston Bay LNG Project.8 The Galveston Bay LNG
Project will consist of land-based and marine components and will include natural gas treatment,
compression, liquefaction and storage facilities, as well as ancillary facilities required to receive
7 NextDecade LNG, LLC was formerly named NextDecade, LLC, but recently renamed to indicate NextDecade LNG, LLC’s core business.
8 Regulatory approval also must be obtained from the Federal Energy Regulatory Commission (“FERC”) under Section 3 of the NGA for the siting, construction and operation of the Project and under Section 7 of the NGA for the siting, construction and operation of an affiliated natural gas pipeline that will bring feed gas and fuel gas to the Galveston Bay LNG Project. Galveston Bay LNG will initiate the process to obtain such authorizations during the first half of 2018 by requesting authorization from the Director of the Office of Energy Projects to commence the FERC’s mandatory National Environmental Policy Act (“NEPA”) pre-filing review process for the Galveston Bay LNG Project and associated pipeline. The potential environmental impacts of the Project, as well as the affiliated pipeline, will be reviewed by FERC in conjunction with that proceeding.
5
and liquefy natural gas, and to store, load, and export LNG. The Project facilities are anticipated
to include four (4) LNG storage tanks, each with a storage capacity of approximately 200,000
cubic meters, three (3) LNG trains, and vessel loading facilities. Each of the LNG trains will be
capable of producing up to 5.5 MTPA of LNG, for a total capacity of 16.5 MTPA of LNG.
The Galveston Bay LNG Project will be capable of processing an average of
approximately 785.7 Bcf/y of pipeline quality natural gas.
Such gas will be delivered to the Galveston Bay LNG Project through an approximately
85-mile-long pipeline (“SP Pipeline”) to be developed by a Galveston Bay LNG affiliate, and
run to the Katy Gas Market Hub (“Katy Hub”). The SP Pipeline will be designed to have
sufficient capacity to supply all of the Galveston Bay LNG Project’s gas requirements. The
capacity is expected to approximately 3 Bcf per day, which would allow the SP Pipeline to
provide a modest amount of firm service to third parties. The exact capacity will depend on
prevailing conditions, including the level of third party interest in making long-term
commitments for firm transportation, physical constraints, economics and environmental
considerations.
The Katy Hub is a liquid gas trading point providing transparent pricing and multiple gas
buyers and sellers. Galveston Bay LNG intends to interconnect the Galveston Bay LNG Project
with several interstate and intrastate pipeline systems via the SP Pipeline, thereby allowing
natural gas to be supplied through displacement or direct access from a wide variety of supply
sources. The exact interconnections, pipeline diameter and location and amount of compression
required will be finally determined through further studies on pipeline design and natural gas
6
transportation market investigations9 to be conducted in conjunction with the FERC permitting
process for the pipeline.
The Galveston Bay LNG Project, like other LNG export projects already pending before
DOE/FE, is the result of the surge in U.S. natural gas reserves and the expanding needs for
natural gas in the form of LNG in international markets. These conditions have resulted in a
situation where exporting LNG is a viable and economically attractive option that has
transformed the U.S. from a projected LNG net importer to net exporter.10 Publicly available
information establish that domestic natural gas supplies far exceed existing and projected
domestic demand during the twenty (20) year term during which exports would occur from the
Galveston Bay LNG Project, as requested in this Application. Such information also
demonstrates that the price impact of Galveston Bay LNG’s proposed exports would not be
substantial. In this regard, DOE/FE commissioned a study, dated October 29, 2015, which,
9 The approximately 85-mile-long preliminary SP Pipeline route crosses the following twenty-two (22) natural gas pipelines, all of which are potential interconnect points for consideration: three (3) pipelines operated by Tennessee Gas Pipeline Co LLC, one (1) pipeline operated by Trunkline Gas Company LLC, two (2) pipelines operated by Natural Gas P/L Co of America LLC, two (2) pipelines operated by Transcontinental Gas PL Co LLC, one (1) pipeline operated by Gulf South Pipeline Company, LP, four (4) pipelines operated by Kinder Morgan Tejas Pipeline LLC, three (3) pipelines operated by Houston Pipe Line Company LP, two (2) pipelines operated by Enterprise Products Operating LLC, one (1) pipeline operated by Texas Eastern Transmission, LP, two (2) pipelines operated by Denbury Onshore, LLC, and one (1) pipeline operated by Florida Gas Transmission Co. LLC. Significantly, there are various other natural gas pipelines crossed by, or in proximity to, the SP Pipeline’s proposed route that may provide additional transportation options if needed.
10 See ENERGY INFORMATION ADMINISTRATION (hereinafter “EIA”), United States Expected to Become a Net Exporter of Natural Gas This Year (Aug. 9, 2017), available athttps://www.eia.gov/todayinenergy/detail.php?id=32412. (“EIA’s latest Short-Term Energy Outlook projects that the United States will export more natural gas than it imports in 2017. [. . . ] The United States’ status as a net exporter is expected to continue past 2018 because of growing U.S. natural gas exports to Mexico, declining pipeline imports from Canada, and increasing exports of liquefied natural gas (LNG)”); see also EIA, U.S. Liquefied Natural Gas Exports Have Increased as New Facilities Come Online (Dec. 7, 2017), available athttps://www.eia.gov/todayinenergy/detail.php?id=34032; see also EIA, ANNUAL ENERGY OUTLOOK 2017 at 66 (Jan. 2017), available at https://www.eia.gov/outlooks/aeo/pdf/0383(2017).pdf. (“liquefied natural gas (LNG) is projected to dominate U.S. natural gas exports by the early-2020s”) (hereinafter “AEO 2017”).
7
among other things, considered the effect on domestic natural gas prices of U.S. LNG exports
increasing from 12 to 20 Bcf/d.11 The study concluded:
The majority of the increase in LNG exports is accommodated by expanded production rather than reductions in domestic demand, which declines by about 450 mmcf/d by 2040 with the bulk of the impact split evenly across the power generation and industrial sectors. This fact that the price increase as we move from 12 Bcf/d to 20 Bcf/d of LNG exports slowly climbs to $0.50 by 2040 renders the domestic demand response to be relatively small.12
This is consistent with an earlier study, also commissioned by DOE/FE and authored by
NERA Economic Consulting (“NERA”), Macroeconomic Impacts of LNG Exports from the
United States (“NERA Report”), which states that “LNG exports have net economic benefits in
spite of higher domestic natural gas prices.”13 NERA found this to be the case even with
unlimited LNG exports from the U.S.14 Both of these studies were revisited by DOE/FE as
recently as September 15 of this year and found to remain “fundamentally sound.”15 Thus, the
11 Center for Energy Studies at Rice University’s Baker Institute and Oxford Economics, The Macroeconomic Impact of Increasing U.S. LNG Exports (2015), available athttp://energy.gov/sites/prod/files/2015/12/f27/20151113_macro_impact_of_lng_exports_0.pdf (hereinafter referred to as “2015 DOE Study”). As DOE/FE has noted, “it is far from certain that all or even most of the proposed LNG export projects will ever be realized because of the time, difficulty, and expense of commercializing, financing, and constructing LNG export terminals, as well as the uncertainties inherent in the global market demand for LNG.” Eagle LNG, DOE/FE Order No. 4078 at 33. As such, even though DOE/FE has authorized exports slightly in excess of 21 Bcf/d (Id. at 34), this conclusion remains directly applicable to the current Application.
12 2015 DOE Study at 61-62.
13 NERA ECON. CONSULTING, MACROECONOMIC IMPACTS OF LNG EXPORTS FROM THE UNITED STATES 1 (2012) (hereinafter “NERA Report”), available at http://fossil.energy.gov/programs/gasregulation/reports/nera_lng_report.pdf; see also NERA ECON. CONSULTING,UPDATED MACROECONOMIC IMPACTS OF LNG EXPORTS FROM THE UNITED STATES (2014) (hereinafter “NERA Update”), available at http://www.nera.com/content/dam/nera/publications/archive2/PUB_LNG_Update_0214_FINAL.pdf.
14 NERA Report at 12; see also NERA ECON. CONSULTING, ECONOMICS OF US NATURAL GAS EXPORTS:SHOULD REGULATORS LIMIT US LNG EXPORTS? (2016), available athttp://www.nera.com/publications/archive/2016/economics-of-us-natural-gas-exports--should-regulators-limit-us-.html, concluding that limiting U.S. LNG exports is inconsistent with simulated uncertainties and that determining the levels and destinations of exports should be left to the market.
15 Eagle LNG, DOE/FE Order No. 4078 at 28.
8
Galveston Bay LNG Project should not negatively impact U.S. consumption of natural gas to any
significant degree.
As discussed in Section VII of this Application, the Galveston Bay LNG Project presents
significant benefits to the public, including stimulating the local and regional economy through
direct job creation and other forms of personal income; increasing tax revenues and other fiscal
benefits for governmental entities; stimulating national economic activity; improving the U.S.
balance of payments; and improving security for the U.S. and its trading partners.
IV. AUTHORIZATION REQUESTED
Galveston Bay LNG requests long-term, multi-contract authorization to export up to
785.7 Bcf/y of natural gas in the form of LNG, which is the equivalent of approximately 16.5
MTPA, from the Galveston Bay LNG Project to both FTA and Non-FTA Countries. Galveston
Bay LNG requests this authorization for a twenty (20) year term commencing on the earlier of
the date of first export,16 or seven (7) years from the date of issuance of the authorization
requested herein. Galveston Bay LNG further requests that it be afforded the same three year
make-up period granted in previous LNG export authorizations, for the purpose of exporting any
volume Galveston Bay LNG is unable to export during the original export period.17
Galveston Bay LNG is requesting this authorization both on its own behalf and as agent
for other parties who will hold title to the LNG at the time of export. Galveston Bay LNG will
comply with all DOE/FE requirements for exporters and agents, including the registration
requirements as first established in Freeport LNG Development, L.P., DOE/FE Order No. 2913,
16 As noted previously, for the purposes of this Application “first export” refers to the initial export of LNG upon the first LNG train at the facility entering full commercial service (i.e., is capable of producing LNG at full, steady, capacity and has begun to supply LNG pursuant to long-term contracts).
17 See, e.g., Eagle LNG, DOE/FE Order No. 4078 at 40.
9
and more recently set forth in Jordan Cove Energy Project, L.P., DOE/FE Order No. 3413 and
referenced in Dominion Cove Point LNG, LP, DOE/FE Order No. 4046.18 In this regard,
Galveston Bay LNG, when acting as agent, will register with DOE/FE each LNG title holder for
whom it seeks to export as agent, and will provide DOE/FE with a written statement by the title
holder acknowledging and agreeing to (i) comply with all requirements in Galveston Bay LNG’s
long-term export authorization; and (ii) include those requirements in any subsequent purchase
or sale agreement entered into by the title holder. Galveston Bay LNG also will file under seal
with DOE/FE any relevant long-term commercial agreements that it enters into with the LNG
title holders on whose behalf the exports are performed.
Galveston Bay LNG is not submitting long-term supply agreements and long-term export
agreements with the instant Application and, therefore, requests that DOE/FE make a similar
finding to that in DOE/FE Order No. 2961 with regard to the transaction-specific information
requested in Section 590.202(b) of the DOE regulations.19 At present, Galveston Bay LNG
anticipates entering into long-term gas supply and long-term export contracts in conjunction with
the LNG export authorization requested herein. Both Galveston Bay LNG-affiliated and
18 See Freeport LNG Development, L.P., Order Granting Long-Term Authorization to Export Liquefied Natural Gas from Freeport LNG Terminal to Free Trade Nations, FE Docket No. 10-160-LNG, DOE/FE Order No. 2913 (Feb. 10, 2011), Errata Notice Correcting Footnote 9 in Order 2913 Issued 2/10/2009 (Feb. 17, 2011); see also Jordan Cove Energy Project, L.P., Order Conditionally Granting Long-Term Multi-Contract Authorization to Export Liquefied Natural Gas by Vessel from the Jordan Cove LNG Terminal in Coos Bay, Oregon to Non- Free Trade Agreement Nations, FE Docket No. 123-32-LNG, DOE/FE Order No. 3413 (Mar. 24, 2014); see alsoDominion Cove Point LNG, LP, Order Granting Blanket Authorization to Export Liquefied Natural Gas by Vessel from the Cove Point Terminal Located in Calvert County, Maryland, to Free Trade Agreement and Non-Free Trade Agreement Nations, FE Docket No. 16-205-LNG, DOE/FE Order No. 4046, at 16 (June 2, 2017).
19 In the May 20, 2010 order granting Sabine Pass Liquefaction, LLC (“Sabine Pass”) long-term export authorization to Non-FTA Countries, DOE/FE found that Sabine Pass was not required to submit with its application transaction-specific information pursuant to Section 590.202(b) of the DOE regulations. DOE/FE found that given the state of development for the proposed Sabine Pass export project, it was appropriate for Sabine Pass to submit such transaction-specific information when the contracts reflecting such information are executed. See Sabine Pass Liquefaction, LLC, Opinion and Order Conditionally Granting Long-Term Authorization to Export Liquefied Natural Gas from Sabine Pass LNG Terminal to Non-Free Trade Agreement Nations, FE Docket No. 10-111-LNG, DOE/FE Order No. 2961, at 41 (May 20, 2011) (hereinafter “Sabine Pass, DOE/FE Order No. 2961”).
10
unaffiliated entities are expected to enter into capacity use arrangements with Galveston Bay
LNG. In accordance with DOE/FE’s stated policy in DOE/FE Order No. 2961, Galveston Bay
LNG will submit transaction-specific information when such contracts are executed.20
V. DESCRIPTION OF THE PROJECT
A. Galveston Bay LNG Project Facilities
As discussed above, the Galveston Bay LNG Project will consist of land-based and
marine components, including natural gas treatment, compression, liquefaction and storage
facilities. It also will consist of ancillary facilities required to receive and liquefy natural gas,
and to store, load, and export LNG. The Project facilities are anticipated to include four (4) LNG
storage tanks each with a storage capacity of approximately 200,000 cubic meters, three (3) LNG
trains, and truck and marine vessel loading facilities.21 Each of the LNG trains will be capable of
producing up to about 5.5 MTPA of LNG, for a total capacity of approximately 16.5 MTPA of
LNG.
The Galveston Bay LNG Project will be located at a site situated on Galveston Bay
known as Shoal Point, with the northern and western perimeters of the Project site sitting
adjacent to the Texas City Ship Channel. The two (2) LNGC jetties and the additional LNG
bunkering jetty for the Project will be located along the northern perimeter of the Project site,
which has approximately one mile of water frontage. This is an approximately 994-acre site.
NextDecade, Galveston Bay LNG’s parent company, has entered into three (3) year lease
20 DOE/FE has previously held that the commitment to file contracts once they are executed complies with the requirement of 10 C.F.R. § 590.202(b) to supply transaction-specific information “to the extent practicable.” Id.
21 Although Galveston Bay LNG intends to load LNG trucks at the facility, it is not requesting authorization to export LNG via trucks in this application.
11
agreements with the two landholders – the Texas General Land Office and the City of Texas
City, Texas – that own parcels of land that collectively form the entire Project site.22 The short-
term leases provide that the Texas General Land Office and the City of Texas City, Texas will
each negotiate a long-term lease agreement with NextDecade for the purpose of constructing and
operating a LNG export facility. (See Appendix B). NextDecade shall make such leaseholds
available for the benefit of Galveston Bay LNG.
The site has been used as a dredge material placement area, with a portion of the site still
being used as an active dredge material placement area. The site is adjacent to the Texas City
Industrial Complex, which houses oil refineries, chemical plants and oil storage terminals.
A large portion of the LNG carriers that Galveston Bay LNG expects to load with LNG at
the Galveston Bay LNG Project will likely have a cargo volume of 170,000 to 180,000 cubic
meters, allowing such vessels to traverse the newly expanded Panama Canal third set of locks.
Given this expectation and an approximate 16.5 MTPA LNG production rate, a maximum of
three to four (3 to 4) LNG carriers per week will call on the Galveston Bay LNG Project.
However, the marine facilities at the Galveston Bay LNG Project will be designed to handle even
larger LNG carriers (e.g., Q-flex or Q-max). The use of such larger vessels would reduce the
total number of LNG carriers loaded at the Project. LNG carriers will navigate, with local pilots
aboard, to the Galveston Bay LNG Project by entering Galveston Bay and the Bolivar Roads
Ship Channel and then into the Texas City Ship Channel. These ships will enter the Galveston
Bay LNG Project berth by turning either in front of the facility, or turning in the turning basin at
the end of the Texas City Ship Channel. All waterways that the LNG carriers will navigate are
22 The lease agreements with both the Texas General Land Office and the City of Texas City, Texas were signed by NextDecade, LLC and effective as of January 1, 2017. In a subsequent corporate restructuring, the entity then known as “NextDecade, LLC” amended its name to be “NextDecade LNG, LLC”.
12
federally managed waterways at a depth of 45 feet, which is adequate for the LNG carriers that
will be visiting the site.
The Galveston Bay LNG Project will be capable of processing up to approximately 2.2
Bcf per day of pipeline-quality natural gas with all trains running at nameplate capacity. This
equates to an annual throughput of approximately 805.2 Bcf/y. However, it is anticipated that
actual average throughput on an annual basis will be somewhat lower (i.e., approximately 785.7
Bcf/y), due to occasional outages, operating constraints and the like. Such gas will be delivered
to the Galveston Bay LNG Project through the approximately 85-mile-long SP Pipeline to be
developed by a Galveston Bay LNG affiliate, and run to the Katy Hub. The Katy Hub is a liquid
gas trading point providing transparent pricing and multiple gas buyers and sellers. Galveston
Bay LNG intends to interconnect the Galveston Bay LNG Project with several interstate and
intrastate pipeline systems via the SP Pipeline,23 thereby allowing natural gas to be supplied
through displacement or direct access from a wide variety of supply sources. The SP Pipeline
will have an adequate throughput capacity to supply the Galveston Bay LNG Project with both
feed-gas for liquefaction and natural gas required to fuel any gas-fired facilities (e.g.,
compressors) comprising part of the Galveston Bay LNG Project or the SP Pipeline, taking into
account any losses or shrinkage.24 Should there be demand for additional capacity on the SP
Pipeline for uses not associated with the Galveston Bay LNG Project, the SP Pipeline may be
expanded, as operationally feasible and in accordance with applicable FERC policies and
23 See supra text accompanying note 9.
24 Galveston Bay LNG has assumed the additional demand associated with all necessary fuel gas and total operational losses (including losses associated with the SP Pipeline) equals 10.5% (8% LNG plant and 2.5% SP Pipeline) of the amount to be exported. Thus, 785.7 Bcf/y / 365.25 days/y + 0.105 * 785.7 Bcf/y / 365.25 days/y = 2.377 Bcf/d = the pipeline capacity required to supply the Galveston Bay LNG Project when operating at the maximum authorized export capacity, assuming the Galveston Bay LNG Project operates at a constant level throughout the year.
13
guidelines. This would ensure adequate capacity is available on the SP Pipeline for the Galveston
Bay LNG Project supply, regardless of the need to accommodate unrelated uses.
B. Export Sources
The Galveston Bay LNG Project will benefit from the SP Pipeline’s interconnections
with various pipeline systems, such as NGPL, TRANSCO and TET, which span states from
Texas to Illinois to Pennsylvania and New Jersey and cross multiple conventional and
unconventional gas plays. Each of these interconnecting pipeline systems has a developed
network of additional interconnects with other natural gas pipeline companies. As a result, the
Galveston Bay LNG Project will have the ability to source gas from almost any point on the U.S.
natural gas pipeline grid through direct physical delivery or by displacement. A map of the
natural gas pipelines in the region, including those with which the Galveston Bay LNG Project is
currently planning to cross appears below:
14
Figure 1: Map of Major Natural Gas Pipelines Near Galveston Bay LNG Project
With regard to physical deliveries, the Galveston Bay LNG Project’s proximity to the
Eagle Ford and conventional South Texas natural gas production makes those production areas
good candidates for natural gas supply available for export. Additionally, the SP Pipeline’s
Source: EIA U.S. Energy Mapping System
Galveston Bay LNG
Texas City
Katy Gas Hub Area
15
interconnects offer access to the Marcellus, Haynesville, Utica and Woodford supplies,25 as well
as other conventional Gulf Coast and North American production. Overall, U.S. gas production
is expected to be plentiful and growing.26
The SP Pipeline will interconnect with multiple natural gas pipelines along the
preliminary route connecting the Galveston Bay LNG Project site with the Katy gas hub area.
The receipt capacity is expected to fluctuate due to changes in flow characteristics and directions
of these pipelines. During the past few years, various major natural gas pipelines have changed
their physical flow characteristics due to a shift in location of key natural gas production regions
within North America,27 and this appears to be a continuing trend supporting additional exports
25 Natural gas production from unconventional gas resources contributed to an approximately 25% increase in the total U.S. gas production over the past seven (7) years. See EIA, U.S. Dry Natural Gas Production (Nov. 30, 2017), http://www.eia.gov/dnav/ng/hist/n9070us2a.htm. Looking forward, EIA forecasts that natural gas production in 2018 will be 6.1 Bcf/d higher than the 2017 level.” EIA, Short-Term Energy Outlook (Dec. 12, 2017), https://www.eia.gov/outlooks/steo/; see also EIA, Annual Energy Outlook 2017 at 60 (Jan. 5, 2017) (“Continued development of the Marcellus and Utica plays in the East is the main driver of growth in total U.S. shale gas production and the main source of total U.S. dry natural gas production. Production from the Eagle Ford and Haynesville plays along the Gulf Coast is a secondary contributor to domestic dry natural gas production, with the production largely leveling off in the 2030s. Continued technological advancement and improvement in industry practices is expected to lower costs and to increase the expected ultimate recovery per well. These changes have a significant cumulative effect in plays that extend over wide areas and have large undeveloped resources (Marcellus, Utica, and Haynesville)”).
26 According to the EIA, over the entire course of its most current Reference case natural gas production grows steadily, with a substantial increase between 2016 and 2040. EIA, Annual Energy Outlook 2017 at 60 (Jan. 5, 2017). “Natural gas production accounts for nearly 40% of U.S. energy production by 2040 in the Reference case.” Id. At 14.
27 See NiSource Reports Second Quarter 2012 Earnings, NISOURCE (July 31, 2012), http://ir.nisource.com/releasedetail.cfm?releaseid=696709 (in response to the changing supply and demand markets, Columbia Gas Transmission and Columbia Gulf Transmission are planning a $200 million project to reverse the flow of gas on part of the pipeline system to transport approximately 500,000 dekatherms per day of Marcellus gas production to Gulf Coast markets); see also Empire Pipeline, Inc., Letter Order in Docket Nos. RP11-2456-000 and RP11-2456-001 (Oct. 26, 2011) (approving tariff changes filed to reflect the reversal of flow in connection with the Tioga County Expansion Project); see also ANTERO RESOURCES, COMPANY OVERVIEW (Sept. 2017) at 50, available at: http://s1.q4cdn.com/057781830/files/doc_presentations/2017/09/AR-Company-Presentation-September-2017.pdf, showing substantial portions of capacity flowing to Gulf Coast markets; see also Scott DiSavino, New U.S. Pipelines to Drive Natural Gas Boom as Exports Surge, REUTERS (Apr. 12, 2017), available at: https://www.reuters.com/article/us-usa-lng-pipelines-analysis/new-u-s-pipelines-to-drive-natural-gas-boom-as-exports-surge-idUSKBN17E2CH (“The network [of new pipelines connecting the Marcellus and Utica shale plays] will bring cheaper fuel supplies for power generation and industry being built in the eastern half of Canada and the United States, especially along the Gulf Coast. It would also transport the huge volumes needed to feed facilities that chill the gas to liquid so that it can be shipped internationally.”)
16
of LNG from the Gulf of Mexico coastal region.28 In recent years, the Texas/Eagle Ford Shale
region has experienced additional natural gas processing and significant new natural gas
processing capacity coming on-line.29 Conditions in the Permian Basin hold out the promise of
continued improvement on the natural gas supply situation for the Katy Hub area. The following
chart shows the growing differential between gas pricing at Waha within the Permian Basin and
at the Henry Hub, demonstrating that Permian Basin gas is looking for demand.
28 In an article in Natural Gas Intelligence’s (“NGI”) Shale Daily, NGI director of Strategy and Research Patrick Rau was quoted as saying: “The proposed pipeline reversals would likely have additional implications on the U.S. Gulf Coast, which is still a major source of U.S. production, despite several years of gradual decline,” and “[t]he more gas that flows into the Gulf Coast, the more Gulf Coast production could be displaced, everything else being equal. However, an increase in petrochemical demand in the Gulf Coast, along with emerging gas liquefaction and export capacity in the area, more pipeline exports to Mexico, and additional deliveries west to California and east to serve growing gas-fired power generation in the U.S. Southeast are all possibilities to absorb the excess Gulf Coast supply.” Josh Fisher, Northeast Gas Surplus Spurs Pipe Flow Reversals, Capacity Additions, NGI’S SHALE
DAILY (Mar. 12, 2014), http://www.naturalgasintel.com/articles/97680-northeast-inspiring-pipe-flow-reversals-capacity-additions. This trend has continued recently, with FERC allowing a project to advance led by Kinder Morgan that would affect a portion of Tennessee Gas Pipeline to reverse its flow from the northeast to the southwest in order to transport natural gas from the Marcellus and Utica shale plays to the Gulf Coast. See, e.g., Marcellus Drilling News, FERC Advances Plan to Reverse Part of the TGP to Haul M-U NGLs to Gulf (Oct. 4, 2017), available at: https://marcellusdrilling.com/2017/10/ferc-advances-plan-to-reverse-part-of-tgp-to-haul-m-u-ngls-to-gulf/; see also Order Approving Abandonment, Issuing Certificate and Denying Rehearing, Tennessee Gas Pipeline Company, L.L.C., 160 F.E.R.C. ¶ 61,144 (September 29, 2017).
29 This quantity is based on information sourced from Bentek Energy LLC. See Luke Jackson, Bentek Natural Gas Market Update, BENTEK ENERGY, http://www.northwest.williams.com/Files/Northwest/BentekUpdate.pdf (last visited Mar. 23, 2014) (also showing a total of 14 Bcf/d of new processing capacity nationwide during the period).
17
Figure 2: Natural Gas Pricing Differential at Waha
The Permian Basin has proven to be one of the most resilient and productive regions in
the country, and analysis conducted by Wood Mackenzie Ltd. demonstrates that production in
the Permian Basin will continue to grow aggressively for the next few years.30 These gas
supplies will likely be distributed throughout the Texas Gulf Coast through the existing interstate
and intrastate pipelines discussed previously plus additional new pipelines and pipeline
expansions. For example, Boardwalk Pipeline Partners, LP and Sempra LNG & Midstream
30 WOOD MACKENZIE, LTD., HOW SUSTAINABLE IS PERMIAN TIGHT OIL GROWTH? (Sept. 18, 2017), available at: https://www.woodmac.com/news/feature/how-sustainable-is-permian-tight-oil-growth/; see also, PIONEER
NATURAL RESOURCES, EIA ENERGY CONFERENCE: PERMIAN BASIN TAKES GLOBAL STAGE (June 26, 2017), available at: https://www.eia.gov/conference/2017/pdf/presentations/scott_sheffield.pdf.
-0.500
-0.450
-0.400
-0.350
-0.300
-0.250
-0.200
-0.150
-0.100
-0.050
0.000
1/1
/20
14
3/1
/20
14
5/1
/20
14
7/1
/20
14
9/1
/20
14
11
/1/2
01
4
1/1
/20
15
3/1
/20
15
5/1
/20
15
7/1
/20
15
9/1
/20
15
11
/1/2
01
5
1/1
/20
16
3/1
/20
16
5/1
/20
16
7/1
/20
16
9/1
/20
16
11
/1/2
01
6
1/1
/20
17
3/1
/20
17
5/1
/20
17
7/1
/20
17
9/1
/20
17
11
/1/2
01
7
$ p
er M
MB
tu
Average Daily Price Differential Betweeen Waha and Henry Hubs Each Month
18
announced a non-binding open season for a Permian Basin to Katy Hub pipeline project in
August of this year.31 The pipeline proposed initial capacity is between 1.5 and 2.0 Bcf/d.
The U.S. supply picture is excellent both more broadly in the region and around the
nation. According to the EIA’s Annual Energy Outlook 2017, “[c]ontinued development of the
Marcellus and Utica plays in the East is the main driver of growth in total U.S. shale gas
production and the main source of total U.S. dry natural gas production,” and “[p]roduction from
the Eagle Ford and Haynesville plays along the Gulf Coast is a secondary contributor to
domestic dry natural gas production[. . . .]”32 Further, substantial additions to pipeline
transportation capacity into the region from other portions of the U.S are being actively pursued
by multiple established pipeline companies. For example, in 2016, Natural Gas Pipeline
Company of America LLC issued a solicitation of interest in Phase 2 of its Gulf Coast
Southbound Expansion Project, which would transport an estimated 250,000 dekatherms (“Dth”)
(or about 0.24 Bcf) per day of natural gas from connections with multiple pipelines in Illinois
and Iowa to markets in Texas.33 This is on top of the previously announced Phase 1 project
involving the addition of 460,000 Dth (or 0.45 Bcf) per day of transportation capacity. This will
contribute to natural gas produced in the region around the Project being available to users in the
region, such as the Project’s customers, as well as the availability to the Project of natural gas
from other areas in the U.S., whether physically or through displacement.
31 See SEMPRA LNG & MIDSTREAM AND BOARDWALK PIPELINE PARTNERS, Permian-Katy Pipeline (last visited Dec. 18, 2017), http://p2kpipeline.com/.
32 Supra note 10, at 60.
33 NATURAL GAS PIPELINE COMPANY OF AMERICA LLC, Gulf Coast Southbound Expansion Project Phase 2 Notice of Non-Binding Solicitation of Interest (May 10, 2016), https://www.kindermorgan.com/content/docs/NGPL_GCML_posting.pdf.
19
C. Commercial Arrangements
Galveston Bay LNG has not entered into any contractual or other capacity arrangements
at this time. As discussed above, Galveston Bay LNG currently anticipates seeking and entering
into long-term gas supply and long-term export contracts in conjunction with the LNG export
authorization requested herein. In this regard, Galveston Bay LNG may structure its commercial
arrangements in a manner that provides for third parties to hold liquefaction capacity in the
Galveston Bay LNG Project. Customers contracting for such capacity will be responsible for
sourcing their own gas supplies and arranging the delivery of the gas to the Galveston Bay LNG
Project, including obtaining transportation capacity on the SP Pipeline. Affiliates of Galveston
Bay LNG are likely to be among customers contracting for capacity at the Galveston Bay LNG
Project.
VI. APPLICABLE LEGAL STANDARD
Pursuant to Section 3 of the NGA, DOE/FE is required to authorize exports to a foreign
country unless there is a finding that such exports “will not be consistent with the public
interest.”34 Specifically, Section 717b(a) of the NGA states in relevant part:
(a) Mandatory authorization order
[N]o person shall export any natural gas from the United States to a foreign country or import any natural gas from a foreign country without first having secured an order of the Commission authorizing it to do so. The Commission shall issue such order upon application, unless, after opportunity for hearing, it finds that the proposed exportation or importation will not be consistent with the public interest.35
34 15 U.S.C. § 717b(a).
35 Id. (emphasis added).
20
Section 717b(a) thus creates a statutory presumption in favor of approval of this Application,
which opponents bear the burden of overcoming.
Moreover, with respect to exports to FTA Countries, this presumption is irrebuttable.36
DOE/FE has consistently found that, in light of its statutory obligation, there is no need for it to
engage in an analysis of factors affecting the public interest in acting on such applications. In this
regard, in Jordan Cove Energy Project, L.P., DOE/FE noted that its authority under NGA
Section 3(c), as amended by the Energy Policy Act of 1992, is limited to two (2) areas: “(1) to
ensure that applications are filed with sufficient information to confirm that the applicant is
engaged in a meaningful (i.e., not frivolous) effort to undertake natural gas export or import
activities, and (2) to provide in any order granting a section 3(c) application that the applicant
will report its export or import activities in sufficient detail to enable DOE to monitor import and
export activities.”37 Nonetheless, Galveston Bay LNG asserts that the discussion herein
demonstrating that exports from the Galveston Bay LNG Project to Non-FTA Countries are not
inconsistent with the public interest is equally applicable to exports from the Project to FTA
Countries.
With respect to Galveston Bay LNG’s request to export to Non-FTA Countries, in
evaluating other similar applications, DOE/FE has consistently applied the principles described
in DOE Delegation Order No. 0204-111, which focuses primarily on whether there is a domestic
need for natural gas that trumps exports, and the Secretary’s natural gas policy guidelines,38
36 See 15 U.S.C. §717b(c); see also Sabine Pass Liquefaction, LLC, DOE/FE Order No. 2833 (Sept. 7, 2010); Jordan Cove Energy Project, L.P., DOE/FE Order No. 3041 (Dec. 7, 2011); Carib Energy (USA) LLC, DOE/FE Order No. 2993 (July 27, 2011).
37 Jordan Cove Energy Project, L.P., supra note 18, at 8-9.
38 Policy Guidelines and Delegation Orders Relating to the Regulation of Imported Natural Gas, 49 Fed. Reg. 6,684 (Feb. 22, 1984) (hereinafter “Policy Guidelines”).
21
which presume the normal functioning of the competitive market will benefit the public.
Although DOE Delegation Order No. 0204-111 is no longer in effect, DOE/FE’s review of
export applications in decisions under current delegated authority has continued to focus on the
domestic need for natural gas proposed to be exported; whether the proposed exports pose a
threat to the security of domestic natural gas supplies; and any other issue determined to be
appropriate, including whether the arrangement is consistent with DOE’s policy of promoting
competition in the marketplace by allowing commercial parties to freely negotiate their own
trade arrangements.39 In the past, DOE/FE also has considered local interests, international
effects and the environment as factors relevant to the public interest determination.40
In the context of the instant Application and existing natural gas market conditions, the
longstanding principles of minimizing federal control and involvement in natural gas markets
39 In this regard, in DOE/FE Order No. 2961, the first DOE/FE order authorizing exports of lower-48 domestically produced LNG to Non-FTA Countries, DOE/FE confirmed that although DOE Delegation Order No. 0204-111 is no longer in effect, it continues to focus on the principles set forth therein in reviewing export applications. See Sabine Pass, DOE/FE Order No. 2961, supra note 19, at 29. DOE/FE has continued to take this approach in a series of subsequent Orders authorizing LNG exports to Non-FTA Countries, most recently in Eagle LNG, DOE/FE Order No. 4078.
40 For example, in DOE/FE Opinion and Order No. 2500, which granted ConocoPhillips Alaska Natural Gas Corporation and Marathon Oil Company authorization to export LNG from Alaska, DOE/FE considered the regional need for the gas by reviewing the natural gas supply and demand projections submitted, cited or relied on, by the parties in the proceeding and determined that there was a reasonable basis for concluding that local supplies were adequate to support the proposed export as well as to meet local demand requirements during the term of the proposed blanket authorization. ConocoPhillips Alaska Natural Gas Corp., Order Granting Authorization to Export Liquefied Natural Gas from Alaska, FE Docket No. 07-02-LNG, DOE/FE Order No. 2500, at 47 (June 3, 2008) (hereinafter “ConocoPhillips, DOE/FE Order No. 2500”). In addition, DOE found that: (1) local interests would be well served by a grant of the requested authorization because the continued operation of the applicant’s liquefaction plant provided significant benefits to the local economy; (2) exportation of LNG would help to improve the United States’ balance of payments with Pacific Rim countries during the term of the proposed blanket authorization; and (3) there was no significant environmental impact. See id. at 57-58; see also Cheniere Marketing, Inc., Order Granting Authorization to Export Liquefied Natural Gas, FE Docket No. 08-77-LNG, DOE/FE Order No. 2651, at 14 (June 8, 2009) (explaining that, consistent with the Policy Guidelines and applicable precedent, the DOE considers the potential effects of proposed exports on aspects of the public interest other than domestic need, including international effects and the environment) (hereinafter “CMI, DOE/FE Order No. 2651”).
22
articulated in the Policy Guidelines are particularly relevant.41 The Policy Guidelines emphasize
free market principles and promote limited government involvement in federal natural gas
regulation:
The market, not government, should determine the price and other contract terms for imported [and exported] gas. U.S. buyers [and sellers] should have full freedom - along with the responsibility - for negotiating the terms of trade arrangements with foreign sellers [and buyers].
The government, while ensuring that the public interest is adequately protected, should not interfere with buyers’ and sellers’ negotiation of the commercial aspects of import [and export] arrangements. The thrust of this policy is to allow the commercial parties to structure more freely their trade arrangements, tailoring them to the markets served.42
The Policy Guidelines also provide some insight into the public interest standard for
evaluating potential import and export applications. In this regard, they state that the “policy
cornerstone of the public interest standard is competition.”43 Competitive import/export
arrangements are therefore an essential element of the public interest and, so long as the sales
agreements are set in terms that are consistent with market demands, they should be considered
to “largely” meet the public interest standard.44 The guidelines continue by saying that “[t]his
policy approach presumes that buyers and sellers, if allowed to negotiate free of constraining
governmental limits, will construct competitive import [and export] agreements that will be
41 While the Policy Guidelines deal specifically with imports, the principles are applicable to exports as well. See Phillips Alaska Natural Gas Corp. and Marathon Oil Co., Order Extending Authorization to Export Liquefied Natural Gas from Alaska, FE Docket No. 96-99-LNG, DOE/FE Order No. 1473, at 14 (Apr. 2, 1999) (hereinafter “Phillips Alaska, DOE/FE Order No. 1473”).
42 Policy Guidelines, supra note 38, at 6685. The macroeconomic analysis provided in the NERA Reportreinforces DOE/FE’s continued reliance on the Policy Guidelines’ free market approach. In concluding that LNG exports will have net economic benefits in spite of higher domestic natural gas prices, NERA states “[t]his is exactly the outcome that economic theory describes when barriers to trade are removed.” NERA Report, supra note 13, at 1.
43 Policy Guidelines, supra note 38, at 6687.
44 Id.
23
responsive to market forces over time.”45 To date, DOE/FE orders granting authorization to
export natural gas continue to reflect and reinforce the principles laid out in the Policy
Guidelines by emphasizing the concepts of free trade and limited government involvement.46
VII. PUBLIC INTEREST ANALYSIS
The Galveston Bay LNG Project has been proposed, in part, due to the hugely positive
outlook for domestic natural gas reserves and production. Improved drilling techniques and
extraction technologies have contributed to the rapid growth in new supplies from
unconventional gas-bearing formations across the U.S. and have been utilized to enhance
production in some conventional fields. Such developments have completely changed the
complexion of the U.S. natural gas industry and radically expanded the resource base. DOE
Secretary Rick Perry has made clear that the export of U.S. sourced LNG not only benefits
America’s economy through jobs,47 but also America’s economy and security through bolstering
the global economy and global security. In April 2017 and again in June, he declared:
[E]nergy policy is not just a vital element of U.S. economic policy, but also a vital element of U.S. foreign policy. We have all seen energy used as a political tool to hold countries hostage. And that is an act of economic aggression that needs to be confronted. Our response cannot be lofty words, but a set of clear deeds. And one of the most important actions we can take is to use our massive shale gas
45 Id. (with reference to “exports” inserted to reflect DOE policy that “the principles are applicable to exports as well” as enunciated in Phillips Alaska, DOE/FE Order No. 1473, supra note 41, at 14).
46 See, e.g., Sabine Pass, DOE/FE Order No. 2961, supra note 19, at 29 (referencing DOE’s policy of promoting competition in the marketplace by allowing commercial parties to freely negotiate their own trade arrangements); Phillips Alaska, DOE/FE Order No. 1473, supra note 41, at 51 (stating that the public interest is generally best served by a free trade policy); ConocoPhillips, DOE/FE Order No. 2500, supra note 40, at 44-45 (stating that DOE’s general policy is to minimize federal government involvement and allow commercial parties to freely negotiate their own trade arrangements).
47 Press Briefing by Secretary of Energy Rick Perry and Principal Deputy Press Secretary Sarah Sanders, WHITE HOUSE PRESS BRIEFING (June 27, 2017), https://www.whitehouse.gov/the-press-office/2017/06/27/press-briefing-secretary-energy-rick-perry-and-principal-deputy-press. See also Ryan Collins, Liquefied Natural Gas Is All the Rage in the Trump Administration, BLOOMBERG (Apr. 25, 2017), https://www.bloomberg.com/news/articles/2017-04-25/lng-emerges-as-a-white-house-favorite-for-promoting-energy-jobs.
24
resources to begin shipping Liquefied Natural Gas overseas. We cannot allow energy to be used to cripple or harm the global economy. I can tell you that the United States of America will use our energy resources to advance energy security.48
LNG exports via the Galveston Bay LNG Project constitute a market-driven vehicle for
deploying the country’s vast energy reserves in a manner that will meaningfully contribute to the
public interest through a variety of benefits, including:
• More jobs49 and personal income, greater tax revenues, and increased economic activity;
• Improved U.S. balance of payments through the exportation of natural gas and the displacement of imports of other petroleum liquids;
• Enhanced national security, as a result of the U.S.’s larger role in international energy markets, assistance provided to our allies, and reduced U.S. dependency on foreign oil through domestic oil and natural gas production;50
• Better opportunities to market U.S. products and services abroad, as a result of new competitively priced gas supplies introduced into world markets leading to improved economies among the U.S.’s trading partners;
48 Statement by Rick Perry, U.S. Secretary of Energy, on LNG Shipments to the Netherlands & Poland, https://energy.gov/articles/statement-rick-perry-us-secretary-energy-lng-shipments-netherlands-poland.
49 The National Export Initiative, established by Executive Order (75 Fed. Reg. 12,433 (Mar. 16, 2010) recognizes that U.S. exports contribute to the creation of U.S. jobs.
50 A March 2013 American Security Project paper authored by Nick Cunningham concludes:
There are likely to be significant geopolitical benefits if exports of LNG proceed in large volumes. Many of America’s closest allies are in need of reliable energy partners, while others are at the mercy of unfriendly neighbors. U.S. LNG exports can provide an alternative source.
Allowing American natural gas to reach world markets will lower the price, offer energy diversity, and undermine expensive oil-indexed contracts. This will enhance our allies’ energy security, and weaken the grip of their adversaries.
There are significant and real geopolitical benefits of removing restrictions on LNG exports.
Nick Cunningham, The Geopolitical Implications of U.S. Natural Gas Exports, AMERICAN SECURITY PROJECT 9 (Mar. 2013), http://americansecurityproject.org/ASP%20Reports/Ref%200116%20-%20The%20Geopolitical%20Implications%20of%20U.S.%20Natural%20Gas%20Exports.pdf; see also John Deutch, The U.S. Natural-Gas Boom Will Transform the World, WALL ST. J. (Aug. 14, 2012), http://online.wsj.com/article/SB10001424052702303343404577514622469426012.html.
25
• Increased economic trade and closer ties with foreign trading partners and hemispheric allies, while displacing environmentally damaging fuels in those countries;
• Increased production capacity able to better adjust to varying domestic demand scenarios; and
• Dampened volatility in domestic natural gas prices.
Galveston Bay LNG submits that these benefits, and others discussed in this Application,
demonstrate that Galveston Bay LNG’s export proposal is not inconsistent with the public
interest. That stance is buttressed by the independent NERA Report, which key findings related
to the macroeconomic impacts of LNG exports are overwhelmingly positive. For example,
NERA found that “[a]ll export scenarios are welfare-improving for U.S. consumers. The welfare
improvement is the largest under the high export scenarios even though the price impacts are
also the largest.”51
In 2014, NERA produced an updated version of the NERA Report.52 The NERA Update
reached conclusions similar to those contained in the NERA Report¸ refuting allegations by some
that the original report was outdated. Among other things, the NERA Update states: “Across the
scenarios, U.S. economic welfare consistently increases as the volume of natural gas exports
increases. This includes scenarios in which there are unlimited exports. Unlimited exports always
create greater benefits than limited exports in comparable scenarios.”53
With regard to gross domestic product (“GDP”), NERA found that “[i]n the shortrun, the
GDP impacts are positive as the economy benefits from investment in the liquefaction process,
51 NERA Report, supra note 13, at 55.
52 NERA Update, supra note 13. The NERA Update has been placed on the record in DOE/FE Dockets No. 13-30-LNG, 13-42-LNG and 13-121-LNG, and Galveston Bay LNG requests DOE/FE to take administrative notice of this document for the current docket as well.
53 Id. at 7
26
export revenues, resource income, and additional wealth transfer in the form of tolling charges.
In the long run, GDP impacts are smaller but remain positive because of higher resource
income.”54 NERA also found that results related to aggregate consumption “suggest that the
wealth transfer from exports of LNG provides net positive income for the consumers to spend
after taking into account potential decreases in capital and wage income from reduced input.”55
A. Analysis Of Domestic Need For Gas To Be Exported
As discussed below, the domestic supply base of natural gas is sufficient to meet future
domestic demand and the proposed Galveston Bay LNG Project’s export volumes over the term
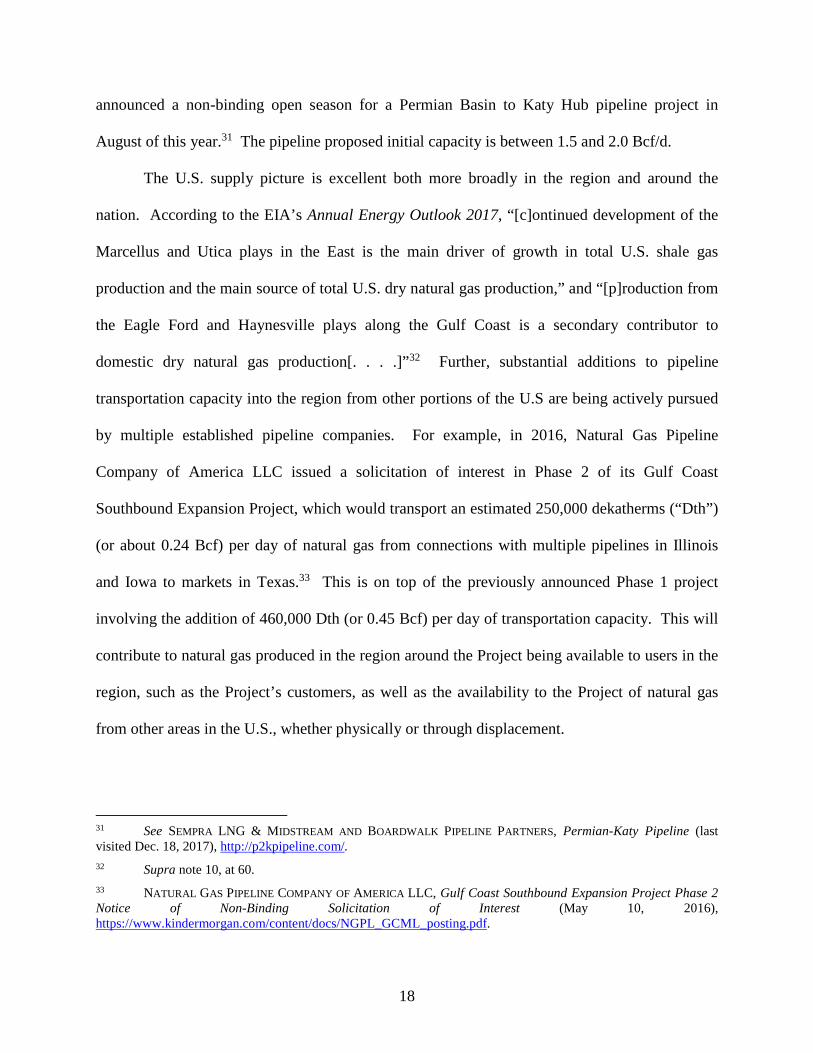
of the authorization. In this regard, proved U.S. reserves of dry natural gas have increased by
124.27 Tcf (58%) between 2001 and 2015.56 However, as illustrated by the following graph,
consumption has grown at a far slower rate:
54 NERA Report, supra note 13, at 56.
55 Id. at 57.
56 EIA, Natural Gas Summary available athttps://www.eia.gov/dnav/ng/ng_sum_lsum_a_EPG0_R11_Bcf_a.htm.
27
Figure 3: U.S. Natural Gas Consumption Compared to Proved Reserves
In concert with the increases in proved reserves over the last decade, drilling productivity
and extraction technology improvements have enabled rapid and efficient growth in the overall
U.S. natural gas production capabilities, thereby increasing the economically recoverable
reserves,57 as well as the technical recoverable reserves.58 Between 2014 and the end of 2015,
however, proved oil reserves decreased approximately 11.8% and proved natural gas reserves
have declined approximately 16.6% due to significant reductions in prices, “which resulted in a
57 See Arthur P. Steinmetz, Investing in the U.S. Energy Revolution, THE ATLANTIC (Oct. 24, 2013), http://www.theatlantic.com/sponsored/oppenheimer/2013/10/investing-us-energy-revolution/23/. The author is the Oppenheimer Funds President & Chief Investment Officer. Id.
58 The Potential Gas Committee’s latest (year-end 2016) assessment suggests that the U.S. has 2,817 trillion cubic feet of technically recoverable gas – the highest resource evaluation in the Committee’s 52-year history and an increase of 12% from the 2014 assessment. See Press Release: Potential Gas Committee Reports Record Future Supply of Natural Gas in the U.S., POTENTIAL GAS COMMITTEE (July 19, 2013), http://potentialgas.org/press-release.
0
10000
20000
30000
40000
50000
60000
70000
80000
90000
100000
0
50000
100000
150000
200000
250000
300000
350000
400000
20
01
20
02
20
03
20
04
20
05
20
06
20
07
20
08
20
09
20
10
20
11
20
12
20
13
20
14
20
15
Tota
l Co
nsu
mp
tio
n (
Bcf
/yr)
Pro
ved
Re
serv
es
(Tcf
)
Year
U.S. Proved Natural Gas Reserves versus Total U.S. Natural Gas Consumption (2001-2015)
more challenging characterization of existing economic and operating conditions that are
considered in the definition of proved reserves[. . . .]”59
As a result of the overall increase in proved reserves over the past decade, U.S. natural
gas prices have significantly decreased. The monthly average Henry Hub price for natural gas
fell from over $10.00 per MMBtu in late 2005 to an average of $2.52 MMBtu for 2016.60 In the
AEO 2016 Reference case, the EIA projects that the annual average Henry Hub spot market price
for natural gas will rise to near $5.00/MMBtu where it will remain through 2040.61 Prices for
natural gas in the U.S. market are now substantially below those of most other major gas-
consuming countries62 and substantially less than they were 15 years ago.63 The result is that
domestic gas can be liquefied and exported to foreign markets on a very competitive basis. As
discussed below, such exports can be expected to have only a nominal effect on U.S. prices.
1. National Supply - Overview
Over the last ten years, the U.S.’s total natural gas recoverable resource base has
significantly increased. The EIA estimates that as of January 1, 2015, there is 2,355 Tcf of
59 EIA, U.S. Crude Oil and Natural Gas Proved Reserves, Year-end 2015 (Dec. 14, 2016), https://www.eia.gov/naturalgas/crudeoilreserves/index.php.
60 EIA, Henry Hub Natural Gas Spot Price (Dec. 6, 2017), https://www.eia.gov/dnav/ng/hist/rngwhhdA.htm. Indeed, average U.S. natural gas prices dipped 42% between 2014 and 2015. It is important to understand that it is dropping prices, not a reduction of natural gas known to remain in the ground, that has caused the recent short-term drop in proved reserves (proved reserves reflect the amount of gas that can be produced at the current market price, so as price falls so does the amount of proved reserves). See U.S. Crude Oil, supra note 59.
61 See EIA, ANNUAL ENERGY OUTLOOK 2016 at MT-23 (Aug. 2016), available athttps://www.eia.gov/outlooks/aeo/pdf/0383(2016).pdf (hereinafter “AEO 2016).
62 See World Bank Commodities Price Data (The Pink Sheet) (Dec. 4, 2017), http://pubdocs.worldbank.org/en/980021512425353981/CMO-Pink-Sheet-December-2017.pdf (last visited Dec. 12, 2017).
63 See Henry Hub, supra note 60 (referencing a monthly average Henry Hub price of $4.13 per MMBtu in October 2002).
29
technically recoverable natural gas resources in the U.S.64 According to a 2016 study conducted
by IHS Markit, titled “Shale Gas Reloaded: The Evolving View of North American Natural Gas
Resources and Costs,” approximately 1,400 Tcf of natural gas in the lower 48 U.S. states and in
Canada is recoverable at a current break-even Henry Hub price of $4/MMBtu or less, and “[t]his
is a 66 percent increase over 2010 estimates. More than half of that (800 Tcf) can be produced at
a current break-even price of $3/MMBtu or less[. . . .]”65 Further, in 2013, the EIA estimated
U.S. onshore lower 48 states shale gas technically recoverable resources to be 637 Tcf,66 while in
2017, the EIA estimates there is 1,024.8 Tcf of technically recoverable shale gas resources in the
lower 48 states.67
With copious reserves available and growing, natural gas production is poised to rise with
increases in demand. In AEO 2017’s Reference case, “natural gas production over the 2016-20
period is projected to grow at about the same rate (nearly 4% annual average) as it has since
2005.”68 The EIA’s projections reflect, among other things, strong growth in domestic natural
gas production and reduced pipeline imports.69 According to EIA, “Natural gas production in the
United States increased from 55 billion cubic feet per day (Bcf/d) in 2008 to 72.5 Bcf/d in 2016.
Most of this natural gas—about 96% in 2016—is consumed domestically. Abundant natural gas
64 See EIA, How Much Natural Gas Does the United States Have, and How Long Will It Last? (July 25, 2017), https://www.eia.gov/tools/faqs/faq.php?id=58&t=8. As noted previously, the Potential Gas Committee has a higher estimate of 2,817 trillion cubic feet of technically recoverable gas. Press Release, supra note 58.
65 IHS MARKIT, Shale Gas Reloaded: The Evolving View of North American Natural Gas Resources and Costs (Feb. 18, 2016), http://news.ihsmarkit.com/press-release/north-americas-unconventional-natural-gas-resource-base-continues-expand-volume-and-de.
66 EIA, Assumptions to the Annual Energy Outlook 2013, 121 tbl.9.2. (May 14, 2013), http://www.eia.gov/forecasts/aeo/assumptions (hereinafter “2013 Assumptions”).
67 EIA, Assumptions to the Annual Energy Outlook 2017, 133 tbl.9.2. (July 18, 2017), https://www.eia.gov/outlooks/aeo/assumptions/pdf/0554(2017).pdf (hereinafter “2017 Assumptions”).
68 AEO 2017, supra note 10, at 54.
69 AEO 2016, supra note 10, at 79.
30
resources and large production increases have created opportunities for U.S. natural gas
exports.”70 As a result of the growth in production, U.S. natural gas production is projected to
exceed consumption in the coming years, allowing the U.S. to now transition from a net importer
of natural gas to a net exporter.71
These studies and reports indicate that the U.S. has an inventory of recoverable natural
gas resources sufficient to last beyond any practicable planning horizon. President Trump has
recently announced his support for LNG exports as an alternative to other LNG/natural gas
exporting nations, stating “[the U.S. is] committed to securing [Europe’s] access to alternate
sources of energy, so Poland and its neighbors are never again held hostage to a single supplier
of energy.”72 Indeed, as a sign of the true bipartisan nature of this matter, in his 2012 State of the
Union Address, President Obama stated: “We have a supply of natural gas that can last America
nearly 100 years.”73 This inventory is expected to continue growing as further advancements in
drilling technology are deployed to exploit additional shale gas development opportunities.74
2. Regional Supply
The proposed Galveston Bay LNG Project will be located in an area with robust access to
natural gas supplies available through the highly integrated and well-developed interstate and
70 EIA, United States Expected to Become a Net Exporter, supra note 10.
71 Id.
72 Tom DiChristopher, Trump Pitches US Natural Gas to European Leaders, Suggests Russian Gas Holds Them Hostage, CNBC (July 6, 2017), https://www.cnbc.com/2017/07/06/trump-natural-gas-europe-leaders.html.
73 President Obama’s State of the Union Address, N.Y. TIMES (Jan. 24, 2012),http://www.nytimes.com/2012/01/25/us/politics/state-of-the-union-2012-transcript.html?pagewanted=all. In his 2014 State of the Union Address, the President added: “We produce more natural gas than ever before ….” and pledged that his “administration will keep cutting red tape and speeding up new oil and gas permits” to keep the gas boom going. Remarks by the President in the State of the Union Address, THE WHITE HOUSE: OFFICE OF THE PRESS
74 See AEO 2017, supra note 10, at 58; see also U.S. Geological Survey, Assessment of Potential Additions to Conventional Oil and Gas Resources in Discovered Fields of the United States from Reserve Growth, 2012 (Aug. 2012), http://pubs.usgs.gov/fs/2012/3108/FS12-3108.pdf.
31
intrastate natural gas pipeline system. The large number of natural gas pipelines to be crossed by
the SP Pipeline reflects the natural gas transportation industry’s capability to build and expand
the capacity of pipeline infrastructure as needed to ensure adequate regional supplies.
Extensive local natural gas reserves and production lend additional support to the
proposition that the relevant regional natural gas supply is adequate to meet both the domestic
needs of the area and the demand for exported natural gas. Resource assessments of U.S. Gulf
Coast natural gas sources, as made by the U.S. Geological Survey in 2016, estimated that there is
likely to be 304.4 Tcf of technically recoverable gas in the region.75 At a production rate of 1.4
Tcf/yr,76 such recoverable resources would support continued Gulf Coast production for another
217 years. Other recent assessments are also encouraging and contribute to the conclusion that
the Project will have access to copious amounts of natural gas during the requested authorization
period.77
3. National Natural Gas Demand
Over the past decade, the U.S. has experienced modest growth in the domestic demand
for natural gas.78 In 2016, the EIA estimated long-term annual U.S. natural gas consumption
75 See U.S. GEOLOGICAL SURVEY, Assessment of Undiscovered Oil and Gas Resources in the Haynesville Formation, U.S. Gulf Coast, 2016 (April 2017), https://pubs.usgs.gov/fs/2017/3016/fs20173016.pdf (195.8 Tcf); and U.S. GEOLOGICAL SURVEY, Assessment of Undiscovered Oil and Gas Resources in the Bossier Formation, U.S. Gulf Coast, 2016 (April 2017), https://pubs.usgs.gov/fs/2017/3015/fs20173015.pdf (108.6 Tcf); see also 2012 Assessment, supra note 74, at 4 tbl.2.
76 See EIA, Table 4. U.S. shale gas plays: natural gas production and proved reserves, 2014-2015, http://www.eia.gov/naturalgas/crudeoilreserves/pdf/table_4.pdf (last visited Dec. 17, 2017).
77 See, e.g., U.S. GEOLOGICAL SURVEY, Assessment of Undiscovered Shale Gas and Shale Oil Resources in the Mississippian Barnett Shale, Bend Arch-Fort Worth Basin Province, North-Central Texas (December 2015), https://pubs.usgs.gov/fs/2015/3078/fs20153078.pdf (53 Tcf); U.S. GEOLOGICAL SURVEY, Assessment of Tight-Gas Resources in Canyon Sandstones of the Val Verde Basin, Texas, 2016 (July 2016), https://pubs.usgs.gov/fs/2016/3039/fs20163039.pdf (5.0 Tcf); and U.S. GEOLOGICAL SURVEY, Assessment of Undiscovered Oil and Gas Resources in the Spraberry Formation of the Midland Basin, Permian Basin Province, Texas, 2017 (May, 2017), https://pubs.usgs.gov/fs/2017/3029/fs2017173029%20.pdf (3.1 Tcf).
78 In 2016, natural gas consumption was approximately 19% higher than in 2006. See EIA, U.S. Natural Gas Total Consumption (Nov. 30, 2017), https://www.eia.gov/dnav/ng/hist/n9140us2A.htm.
32
growth of only 0.9%,79 with natural gas consumption rising from 27.5 Tcf in 2015 to 34.4 Tcf in
2040.80 The table below presents a comparison of actual consumption and prices in 2016 and
forecasted demand and prices in the year 2040, based on information presented in the AEO 2016
and other information provided by the EIA.81
Table 1: Present and Future Demand and Pricing
2016 2040
Natural Gas Demand (Bcf/day) 75.2 88
Henry Hub Spot Price ($/MMBtu) 2.61 5.00
As discussed in Section VII.A.1. above, the EIA estimates that the U.S. has 2,355 Tcf of
recoverable natural gas resources. Assuming Galveston Bay LNG is able to export 100% of the
quantity of natural gas requested herein, the Project would result in maximum natural gas
requirements, inclusive of fuel used at the Project and losses associated with the Project and its
affiliated pipeline, of 17.4 Tcf over the 20-year term of the requested authorization.82 This
represents only 0.74% of the total estimated recoverable U.S. natural gas resources.
4. Supply-Demand Balance Demonstrates the Lack of National and Regional Need
As discussed in Section VII.A.3. above, the enormous available domestic supply of
natural gas dwarfs current U.S. demand and, even under the extreme case of operating at 100%
utilization, the natural gas to be exported from the Galveston Bay LNG Project is on the order of
only three-quarters (3/4) of one percent (1%) of the available resources. The current low prices
79 AEO 2016, supra note 61, at MT-6.
80 Id. at MT-22.
81 Id. at MT-23. EIA, Henry Hub Natural Gas Spot Price (Dec. 13, 2017), https://www.eia.gov/dnav/ng/hist/rngwhhdm.htm. EIA, U.S. Natural Gas Total Consumption (Nov. 30, 2017), https://www.eia.gov/dnav/ng/hist/n9140us2m.htm. EIA, China Leads the Growth in Projected Global Natural Gas Consumption (Oct. 25, 2017), https://www.eia.gov/todayinenergy/detail.php?id=33472.
82 This number was calculated by multiplying 785.7 Bcf/y times 20 years and increasing the result by 10.5% to allow for losses and gas to operate the Galveston Bay LNG Project and the SP Pipeline.
33
of natural gas are a consequence of a buyer’s market with plentiful supply and limited domestic
needs. The interest in exporting gas from the U.S. despite the billions of dollars of investment
needed to develop a single LNG export terminal is a reflection of these market conditions.
5. Price Impacts – Natural Gas
A paper prepared by the Majority Staff of the U.S. House of Representatives’ Committee
on Energy and Commerce summed up the situation with respect to the impact of LNG exports on
domestic U.S. gas prices: “Some policymakers have expressed concern over the price impacts of
allowing U.S. natural gas exports. However, the body of evidence, including the study requested
by DOE, suggests that price impacts will be moderate and unlikely to be driven by the volume of
U.S. gas exported.”83 This view is not limited to members of the House of Representatives, U.S.
Senator Murkowski’s whitepaper entitled The Narrowing Window: America’s Opportunity to
Join the Global Gas Trade states: 84
Certain interests have objected to the possibility of LNG exports from the U.S. Some petrochemical producers have argued that exports of natural gas would raise the domestic price of natural gas, undercutting their own businesses and product exports by raising the cost of their fuel and feedstock.
A robust debate occurred in the analytical community, comprising universities, think-tanks, consultancies, and other research institutions. After months of discussion and analysis, the majority of reports concluded that LNG exports would provide net economic benefits to the U.S. and should be approved in a timely fashion. Virtually all of these reports concluded that the impact on domestic natural gas prices would be manageable and limited. In addition, many
83 U.S. House of Representatives – Committee on Energy and Commerce, Majority Staff, Prosperity at Home and Strengthened Allies Abroad – A Global Perspective on Natural Gas Exports, THE POLICY PAPER SERIES, 6 (Feb. 4, 2014), http://energycommerce.house.gov/sites/republicans.energycommerce.house.gov/files/analysis/20140204LNGexports.pdf.
84 Lisa Murkowski, The Narrowing Window: America’s Opportunity to Join the Global Gas Trade, ENERGY
20/20 WHITE PAPER, 13 (Aug. 6, 2013), http://www.energy.senate.gov/public/index.cfm/files/serve?File_id=986351eb-316d-4dc9-9d1a-b75abcf4b5fc(footnotes omitted).
34
of these reports have found that higher domestic natural gas prices would also actually serve to increase (and stabilize) natural gas production in the U.S. by making it economical to produce additional natural gas resources.
Nor is it limited to U.S. legislators. The NERA Update opined:
Although there are costs to consumers in the form of higher energy prices …, these costs are more than offset by increases in export revenues, along with wealth transfers from overseas received in the form of payments for liquefaction services. The net result is an increase in U.S. households’ real income and welfare.
*** Our analysis suggests that there is no support for the concern that LNG exports, even in the unlimited export case, will obstruct a chemicals or manufacturing renaissance in the United States.85
Similarly, a 2017 update to a 2013 study by the consulting company ICF entitled Impacts of LNG
Exports on the U.S. Economy: A Brief Update concluded: “Due primarily to the larger and more
price-responsive natural gas supplies, the projected price impacts of LNG exports are about one-
half of the levels expected in [an earlier 2013 report prepared by ICF]. We now estimate a price
increase of 5 to 6 cents/MMBtu per one Bcfd of exports versus the 2013 estimate of 11 to 12
cents.”86
On October 5, 2017, U.S. Senators Bill Cassidy (R-LA), Lisa Murkowski (R-AK) and
John Barrasso (R-WY) wrote to the Secretary of Energy Rick Perry expressing support for a
proposed rule intended to streamline certain U.S. LNG exports. Their letter stated, in part:
“The LNG export market is a growing and promising opportunity, and the United States is well positioned to meet the anticipated four to five percent annual growth in global natural gas demand. [2] According to the Energy Information Administration, the U.S. has an estimated 2,355 trillion cubic feet of technically recoverable natural gas, enough to last an estimated 86 years at current consumption rates. [3] As the United States has increased LNG exports in
85 NERA Update, supra note 13, at 7 and 14.
86 ICF, Impacts of LNG Exports on the U.S. Economy: A Brief Update, 1 (Sept. 2017), http://www.api.org/~/media/Files/Policy/LNG-Exports/API-LNG-Update-Report-20171003.pdf.
35
recent years, natural gas prices have remained low for domestic energy users.”87
B. Other Public Interest Considerations
1. Promote Long-Term Stability in Natural Gas Markets
Lower U.S. natural gas prices have generally led to decreased capital spending on dry
natural gas drilling and development activities.88 U.S. natural gas rotary drilling rig counts over
the last two years have been consistently lower than at any other time during at least the last 30
years.89 Exporting natural gas would create increased demand for domestically produced gas
and, as noted above, contribute to a small increase in domestic natural gas prices. Both of these
factors would help encourage investment and thereby help restore the natural gas industry.90 Of
broader importance is the stabilizing effect increased exports would have on both the price and
availability of natural gas for domestic uses. The stabilizing effects would stem from multiple
causes.
First, simply by increasing the size and diversity of the demand for natural gas to include
consumers in other nations, the volatility in demand decreases, which will contribute to more
stable prices in the U.S. This basic economic concept was well explained in a 2007 paper by Ian
87 U.S. Senators Bill Cassidy, Lisa Murkowski and John Barrasso, Untitled Letter (Oct. 5, 2017), available at https://www.cassidy.senate.gov/imo/media/doc/0618_001.pdf (Citations omitted; emphasis added).
88 See, e.g., Carolyn Davis, Chevron Saddles Up for More Permian Spending in 2018, Even as Total Capex Reduced, NATURAL GAS INTEL (Dec. 7, 2017), http://www.naturalgasintel.com/articles/112674-chevron-saddles-up-for-more-permian-spending-in-2018-even-as-total-capex-reduced.
89 See BAKER HUGHES, North American Rotary Rig Count (Dec. 17, 2017), http://phx.corporate-ir.net/phoenix.zhtml?c=79687&p=irol-reportsother (compare data for North America Rotary Rig Count (Jan 2000-Current) with North America Rotary Rig Counts through 2016).
90 For example, in the February 2012 issue of World Oil Online, the authors, from Barclays Capital, reported on the results of a survey of 351 oil and gas operating companies: “[r]oughly 27% of companies surveyed plan on increasing spending [on natural gas exploration and production activities] if natural gas prices average $4.50/MMbtu in 2012, and 70% would do so if they average $5.00/MMbtu. Nearly half of surveyed companies would cut back spending if gas averaged $3.50/MMbtu, while $3.00/MMbtu was the most popular threshold for companies to reduce budgets.” James C. West et al., 2012 Forecast: E&P Spending to Reach Record $600 Billion, WORLD OIL
Down, Associate Professor of Political Science at the University of Tennessee.91 In that paper,
Dr. Down states:
The greater the number of buyers and sellers the greater the likelihood that shocks emanating from any one source will be offset by equally sized opposite shocks emanating from another source. Moreover, the greater the number of market participants the smaller will be the contribution to total volatility of any single participant, ceteris paribus. Accordingly, larger, deeper markets will display less volatility than smaller, shallower markets. The greater size and depth of international markets relative to the markets of any single national economy implies the international economy is less volatile than any of its constituent national components. Thus, greater trade openness entails a greater degree of domestic production and consumption oriented towards larger, deeper, more stable international markets and away from smaller, shallower, more volatile domestic markets.92
Second, an increased domestic production base and upgraded gas transmission
capabilities would present an opportunity for rapid, voluntary diversion of gas supply to
domestic purposes should domestic demand change rapidly. For example, consider the
possibilities if the U.S. were to have a catastrophic event that broadly impacted a large segment
of the U.S. electric generating industry in a manner similar to what Japan has experienced with
regard to its nuclear generation. In such a situation, there could be a sudden demand for
increased natural gas fired generation that could only be immediately satisfied if sufficient
natural gas production and transportation infrastructure were already in place. A U.S. natural gas
industry that had already expanded production and transportation infrastructure to serve the
export market would be in a better position to respond quickly through a global least cost
solution. Subject to jurisdictional and commercial requirements, exporters could choose to
voluntarily cancel export shipments and divert gas for use in domestic natural gas generating
91 See Ian Down, Trade Openness, Country Size and Economic Volatility: The Compensation Hypothesis Revisited, BUSINESS AND POLITICS, Vol. 9, Iss. 2, Art. 3 (2007), http://www.unc.edu/depts/europe/conferences/tgsw/iandown-trade_openness.pdf.
92 Id. at 5.
37
facilities. In contrast, a smaller U.S. natural gas industry with infrastructure only adequate to
serve the pre-existing domestic demand would not have the option to redeploy foreign bound
gas, and production and transportation capabilities would be more limited. In that case,
producing more gas immediately would not be an option, and trying to expedite the drilling of
new wells on an emergency basis would increase the level of environmental risk. The only
immediately available course of action would involve establishing a new short-term equilibrium
in a domestic-only market with fewer options, leading to much higher prices and a greater
potential for scarcity of both natural gas and electricity.
2. Benefits to Local, Regional and U.S. Economies
Every entity proposing to export LNG from the U.S. that has studied the issue to date has
found the proposed exports would benefit the economy at local, regional, and national levels.
Similarly, DOE has recently confirmed that its own studies project that exports of LNG will
generate net economic benefits to the broader U.S. economy.93 Galveston Bay LNG submits that
there is nothing unique to its proposed exports or the Galveston area that would support a
conclusion that exports made from Galveston Bay through an export terminal located there
would not lead to similar benefits to the Galveston area, Texas or the nation.94
93 Eagle LNG, DOE/FE Order No. 4078 at 24.
94 ICF, Impacts of LNG Exports, supra note 86. An earlier version of the 2017 ICF study approaches this issue from another direction – calculating the sum total of the benefits of U.S. exports of LNG to individual states. With respect to Texas in the year 2035, this study found increased income for Texas of between $5.2 and $34.1 billion (in 2010 dollars) and an uptick in maximum state employment of between 28,019 and 155,713 jobs. ICF International, U.S. LNG Exports: State-Level Impacts on Energy Markets and the Economy, 40 and 49 (Nov. 13, 2013), http://www.api.org/~/media/Files/Policy/LNG-Exports/API-State-Level-LNG-Export-Report-by-ICF.pdf. (The study also concluded: “LNG exports have a net positive impact, or negligible net impact, across all states.”). Id. at 27. The 2017 update to the 2013 state-centric study concluded that “[. . .] the economic impacts from LNG exports will still likely be positive and substantial. Job growth from LNG exports is expected to be very positive, but those gains are likely to be more modest than shown in the 2013 Report because the same technology-driven gains that make more natural gas resources available at lower costs mean that fewer jobs in the upstream sector and its supporting industries will be needed for any given volume of incremental gas production.” ICF, Impacts of LNG Exports, supra note 86.
38
Like any other LNG export project, during construction, the Galveston Bay LNG Project
will provide a source of employment, economic activity and tax revenues to the local, regional
and national economies. Following completion of construction, the Galveston Bay LNG Project
would continue to provide considerable economic benefits through creating permanent jobs,
purchasing goods and services, and paying taxes.
3. Benefits from Stimulation of the Natural Gas Industry
Exports through the Galveston Bay LNG Project will also likely stimulate additional
development of natural gas resources by expanding the market for North American natural gas,
thereby greatly magnifying the overall benefits derived from the Galveston Bay LNG Project.
This development involves sizable investment in exploration and production activity and, thus,
further economic stimulus.
4. International Considerations
Recent world events, such as the continuing weakness of certain European Community
member country economies, have served as ample reminders that the welfare of U.S. citizens is
interdependent on the health of the world economy. Further, in its most recent export
authorization, DOE/FE noted: “To the extent U.S. exports can diversify global LNG supplies,
and increase the volumes of LNG available globally, it will improve energy security for many
U.S. allies and trading partners.”95
In May 2012, the Brookings Institution’s Energy Security Initiative released its Policy
Brief 12-01, titled “Liquid Markets: Assessing the Case for U.S. Exports of Liquefied Natural
Gas,” and in analyzing the international implications of LNG exports, the Brookings Study’s
95 Eagle LNG, DOE/FE Order No. 4078 at 29.
39
authors broke the subject down into three components: pricing, geopolitics, and the
environment.96
With respect to pricing, the Brookings Study observes: “LNG exports will help to sustain
market liquidity in what looks to be an increasingly tight LNG market beyond 2015.”97 Looser
or more liquid markets help place downward pressure on the pricing terms of oil-linked
contracts, which are common in the world markets for LNG. This has resulted, in turn, in the
renegotiation of some contracts, particularly in Europe.98 Of course, lower prices for energy in
Europe and elsewhere can contribute to an uptick in the world economy, fueling increased trade
with the U.S.
With respect to geopolitics, the Brookings Study concludes: “A large increase in U.S.
LNG exports would have the potential to increase U.S. foreign policy interests in both the
Atlantic and Pacific basins.”99 “[T]he addition of a large, market-based producer [i.e., the U.S.]
will indirectly serve to increase gas supply diversity in Europe, thereby providing European
consumers with increased flexibility and market power. *** Increased LNG exports will provide
similar assistance to strategic U.S. allies in the Pacific Basin. By adding supply volumes to the
global LNG market, the U.S. will help Japan, Korea, India, and other import-dependent countries
in South and East Asia to meet their energy needs. *** As U.S. foreign policy undergoes a ‘pivot
to Asia,’ the ability of the U.S. to provide a degree of increased energy security and pricing relief
96 Charles Ebinger et al., Liquid Markets: Assessing the Case for U.S. Exports of Liquefied Natural Gas, THE
BROOKINGS ENERGY SECURITY INITIATIVE, 38 (May 2012), http://www.brookings.edu/~/media/research/files/papers/2012/1/natural%20gas%20ebinger/natural_gas_ebinger.pdf(hereinafter “Brookings Study”).
97 Id. at 39.
98 Id. at 38.
99 Id. at 41.
40
to LNG importers in the region will be an important economic and strategic asset.”100 Today, the
Trump Administration has stated that its support of LNG exports is largely based upon the
principle that LNG exports have the potential to advance American foreign policy interests.101
Finally, as to the environment, the Brooking Study states:
According to the [International Energy Agency], natural gas in general has the potential to reduce carbon dioxide emissions by 740 million tonnes in 2035, nearly half of which could be achieved by the displacement of coal in China’s power-generation portfolio. Natural gas – in the form of LNG – also has the potential to displace more carbon-intensive fuels in other major energy users, including across the EU and in Japan, which is being forced to burn more coal and oil-based fuels to make up for the nuclear generation capacity lost in the wake of the Fukushima [nuclear] disaster. In addition to its relatively lower carbon-dioxide footprint, natural gas produces lower emissions of pollutants such as sulfur dioxide nitrogen oxide and other particulates than coal and oil.102
The Brookings Study also notes that some have expressed concern that lower gas prices
may lead to increased carbon dioxide emissions due to the displacement of nuclear and
renewable energy by cheap natural gas.103 Galveston Bay LNG Project asserts that such
concerns are misplaced. First, as the Brookings Study concludes, the export of U.S. natural gas
would not make a substantial impact on the need for other energy sources to generate
electricity.104 Second, U.S. LNG exports are driven by the price differential between the
destination markets and the U.S. natural gas market. Destination markets must command a
significant price premium in order to cover the cost of liquefaction, transportation, and
regasification. Such considerations all favor the use of nuclear and renewable energy sources
100 Id. at 43.
101 Tom DiChristopher, supra note 72; see also Tom DiChristopher, Trump’s China Trip Is a Test for US Natural Gas Exports and His “America First Energy Plan,” CNBC (Nov. 8, 2017), https://www.cnbc.com/2017/11/08/trumps-china-trip-is-a-test-for-us-natural-gas-exports.html.
102 Brookings Study, supra note 96, at 44.
103 Id.
104 Id.
41
overseas relative to their competitiveness against natural gas in the U.S. Moreover, any tendency
on the part of LNG exports to raise the cost of U.S. domestic gas supplies, not only tends to
reduce the volume of exports, it also contributes to the increased use of alternative forms of
generation in the U.S., making nuclear and renewable energy relatively more cost-effective.
Thus, any loss of competitiveness of such generating technologies abroad would be at least
partially mitigated by increased competitiveness of these technologies in the U.S.
Exporting LNG from the Galveston Bay LNG Project will also improve the U.S. balance
of trade. The U.S. has experienced large trade deficits for several decades.105 In 2016, the U.S.
trade deficit was over $504 billion.106 To date, simply taking advantage of low domestic natural
gas prices to produce things more cheaply in the U.S. has not substantially reversed the trade
deficit. As recognized by DOE/FE, LNG exports would have a positive role on U.S. trade with
destination countries, and reduce U.S. trade imbalances.107
VIII. RELATED AUTHORIZATIONS AND ENVIRONMENTAL IMPACTS
Galveston Bay LNG will request NGA Section 3 authorization from FERC so that it may
site, construct, and operate the Galveston Bay LNG Project. Galveston Bay LNG intends to
commence the FERC’s mandatory pre-filing process in the first half of 2018 and then file its
final application to obtain Section 3 authorization in the 2018 to 2019 timeframe. As necessary
to timely support the Galveston Bay LNG Project schedule, Galveston Bay LNG’s affiliate
105 U.S. DEP’T OF COMMERCE, CENSUS BUREAU, U.S. Trade in Goods and Services – Balance of Payments Basis, 1960 through 2016 (June 2, 2017), https://www.census.gov/foreign-trade/statistics/historical/gands.pdf(hereinafter “Census Bureau”).
106 Id.
107 See, e.g., Sabine Pass, Order No. 2961, supra note 19, at 35-36; see also, CMI, DOE/FE Order No. 2651, supra note 40, at 14; ConocoPhillips, DOE/FE Order No. 2500, supra note 40, at 58; see also Brookings Study, supra note 96, at vi (stating that U.S. LNG exports are likely to make a positive contribution to the U.S. trade balance).
42
developing the SP Pipeline will file an application for NGA Section 7(c) authorization to
construct, own and operate the SP Pipeline.
The potential environmental impacts of the Galveston Bay LNG Project will be reviewed
by FERC under NEPA. Consistent with the NEPA scheme applicable to applications for
authorizations under NGA Section 3 delineated by Congress in the Energy Policy Act of 2005,108
Galveston Bay LNG expects that FERC shall act as the lead agency, with DOE/FE acting as a
cooperating agency, in connection with the Galveston Bay LNG Project.
Galveston Bay LNG also anticipates that DOE/FE will cooperate with FERC in the
development of an EIS for the Galveston Bay LNG Project.109 Finally, Galveston Bay LNG
expects that upon issuance of an EIS by FERC for the Galveston Bay LNG Project, DOE/FE will
adopt the FERC EIS if DOE/FE concludes that its comments and suggestions have been
satisfied.110 To the extent it reaches such conclusion, DOE/FE may then promptly issue a record
of decision pursuant to NEPA and issue an order authorizing exports pursuant to Galveston Bay
LNG’s request herein.
IX. REPORT CONTACT INFORMATION
The contact for any reports required in connection with the requested authorization is as follows:
Shaun Davison Senior VP, Development & Regulatory Affairs Galveston Bay LNG, LLC 3 Waterway Square Place Suite 400 The Woodlands, TX 77380
108 Pub. L. No. 109-58, 119 Stat. 594 (2005).
109 10 C.F.R. § 1021.342 (2014).
110 See 40 C.F.R. § 1506.3(c) (2014). (“A cooperating agency may adopt without recirculating the environmental impact statement of a lead agency when, after an independent review of the statement, the cooperating agency concludes that its comments and suggestions have been satisfied.”).
The following appendices are attached hereto and incorporated by reference herein:
Appendix A: Locator Map and Project Location Information Appendix B: Evidence of Proposed Site’s Availability to Galveston Bay LNG Appendix C: Verification Appendix D: Opinion of Counsel
XI. CONCLUSION
For the foregoing reasons, Galveston Bay LNG respectfully requests that DOE/FE grant
Galveston Bay LNG’s request for long-term, multi-contract authorization to engage in exports of
up to approximately 785.7 Bcf/y of natural gas in the form of LNG, which is the equivalent of
approximately 16.5 MTPA, from the Galveston Bay LNG Project to both FTA and Non-FTA
Countries, for a twenty (20) year term commencing on the earlier of the date of first export or
seven (7) years from the date of issuance of such authorization.
Respectfully submitted,
/s/ Erik J.A. Swenson Erik J.A. Swenson
/s/ Tyler J. Hall Tyler J. Hall Attorneys for Galveston Bay LNG, LLC
Dated: December 22, 2017
Appendix A, Page 1 of 2
APPENDIX A
LOCATOR MAP AND PROJECT LOCATION INFORMATION
The 45-feet Texas City Channel surrounds the Northern and Western perimeters of the site – minimal dredging required for construction of berths
Site located approximately 28.5 km from the Galveston Bay entrance in the Gulf of Mexico (GOM) along federally maintained waterways of 45 feet (minimum depth) and a width varying from 400 to 1,200 feet.
Appendix A, Page 2 of 2
Appendix B
APPENDIX B
EVIDENCE OF PROPOSED SITE’S AVAILABILITY TO GALVESTON BAY LNG