Page 1
University of ConnecticutOpenCommons@UConn
Honors Scholar Theses Honors Scholar Program
Spring 5-2-2019
Decentralization and the Provision of PublicServices: A Case Study of Khyber Pakhtunkhwa,PakistanMishaal AftebUniversity of Connecticut - Storrs, [email protected]
Follow this and additional works at: https://opencommons.uconn.edu/srhonors_theses
Part of the Asian Studies Commons, Other International and Area Studies Commons, and thePolitical Science Commons
Recommended CitationAfteb, Mishaal, "Decentralization and the Provision of Public Services: A Case Study of Khyber Pakhtunkhwa, Pakistan" (2019).Honors Scholar Theses. 608.https://opencommons.uconn.edu/srhonors_theses/608
Page 2
Decentralization and the Provision of Public Services: A Case Study
of Khyber Pakhtunkhwa, Pakistan
Abstract: The effective provision of public services is integral to a functioning democracy as it
connects the public to the government and grants it legitimacy. Public services are ones that are
provided by the federal and local governments and paid for with constituent taxes. Public
services provided by the state are education, health, water/sanitation, environmental measures,
security, policing, labor and legal guidelines and so on. Whether the structure of the government
is centralized or decentralized is an important factor which impacts the provision of services.
Decentralized governments are state or local governments which receive monetary and
institutional resources from the federal government. Previous research has shown that
decentralized services are more effectively delivered than centralized services. My study
examines the impact of decentralization on the provision of two services, health and education,
in Khyber Pakhtunkhwa from 2008-2018. There are two parts to the study. First, I will use
process tracing to portray the historical context of decentralization in conjunction with
sociopolitical factors of the region of KP. The second part observes the impact of
decentralization on the health and education services. In this inductive study, I expect to find a
positive impact of decentralization on the provision of services.
Mishaal Afteb
Honors Scholar Thesis
Advisor: Professor Betty Hanson
Major: Political Science
Page 3
Afteb 2
Acknowledgments:
During the arduous process of conducting research, collecting data, and writing, I had
help from more than a few people. Professor Betty Hanson has been the ultimate guide for me
during the entire process, from which sources to look at to which sentence structure leads to the
most effective meaning. While being her student in her South Asia in World Politics class and
taking an independent study with her during my last semester of my junior year, I was able to
discover my interests related to Pakistan. I had spent the summer of 2017 in Pakistan trying to
figure out what my research interests are but was able to go again to Pakistan in 2018 with a
clearer research goal, thanks to the guidance provided by Professor Hanson. Additionally,
Professor Jennifer Sterling-Folker’s insight and feedback greatly helped me in enhancing my
writing and research. Her Senior Seminar class helped develop my thoughts into flowing
arguments.
My research would not have been possible without my travels to Pakistan for the past two
years. Here, I had the guidance of family that helped facilitate my research and stay. From
traveling to universities in the hot summers during the month of Ramadan to bringing me to the
most popular sites in the area, I would like to thank the following: Shahzad Aziz, Farhat
Shahzad, Palwasha and Qasim Qureshi, Sumbla Yousafzai, Raza Sher Khan, Tasmia Yousafzai,
Mohib Qureshi and Khurram Baig. Additionally, I am thankful for the interactions I had with
Government Postgraduate College No.1 Abbottabad, COMSATS Abbottabad, and Hazara
University Mansehra.
Lastly, I would like to thank my immediate family, especially my sister, Mahnoor and my
grandmother, Saeeda Chaudhry, for assisting me in my travels. Without all of you my research
would not have been possible.
Page 4
Afteb 3
Introduction
The effective provision of public services is integral to a functioning democracy as it
connects the public to the government and gives it legitimacy. Public services are ones that are
provided by the federal and local governments and paid for with constituent taxes. Public
services provided by the state are education, health, water/sanitation, environmental measures,
security, policing, and so on. The provision of services is important to study as it is essential for
all constituents of a nation and especially in aspiring democracies that are struggling to form
effective institutions. Whether a government centralizes or decentralizes its services can affect its
impact. When services are decentralized, state or local governments receive monetary and
institutional resources from the federal government. Decentralized governments involve
constituents in government processes more than centralized governments because of the closer
location of government institutions. Additionally, each province or state has institutional
resources to plan according to the needs of the people, as compared to centralized governments
which makes decisions at the core. Research has shown that decentralized services are more
effectively delivered than centralized services. Arguments pertaining to the effectiveness of
decentralized services will be applied to a region in Pakistan to see if it holds true in that case.
This study will focus on the impact of decentralization on the provision of services in
Khyber Pakhtunkhwa, Pakistan from 2008-2018. The services of health and education will be the
prime focus because the region struggles with them and there is lack of literature on these
services. I argue that decentralized services are beneficial through the case study of KP. Next, I
will briefly analyze how decentralization applies to my case study.
The region of Khyber Pakhtunkhwa is ethnically diverse and plagued with problems
related to terrorism and corruption. Decentralization in KP has been a continuous effort since the
Page 5
Afteb 4
early 2000s, after the nation enacted decentralization reforms under military law.
Decentralization in the region is a form of governance which aims to facilitate the delivery of
services despite those issues. By dividing KP into districts, resources are to be distributed equally
and more effectively. This is because there is less reliance on the central government for funds
and more power in the hands of the local governments. This decentralized system allows the
constituent to become closer to the government and demand accountability in terms of public
services. The physical proximity of government additionally reduces the security problems
constituents face. For example, in regions with terrorism or unsafe conditions, constituents are
unable to reach the central government regarding services. In local government systems the
constituent has certain institutions in proximity that represents his rights. After having
conceptualized decentralization and its importance in the region of interest, I will next discuss
what this means for the rest of my research.
It is imperative to see what is at stake in KP Pakistan in terms of decentralized services
and why this topic is of significance particularly for this region. During my foreign study in
Khyber Pakhtunkhwa, Pakistan, particularly the district of Abbottabad, there was an increased
focus on decentralization to improve health and education services within the region.
Particularly, the change in health and education services from the first time I went in 2017 to
2018 was notable with new public hospitals and public universities. Having the chance to visit
institutions that represent health and education services, I came across people who were more
than happy to support the new public hospitals and education institutions. KP is a region that has
been neglected in the past particularly due to its diversity which made it more difficult to govern.
With decentralized services the region seems to function in an efficient and responsible manner.
Page 6
Afteb 5
My interactions during two years has led me to believe that decentralized services are an
important component for the citizen of Pakistan. My study will attempt to explore this.
The first part of my study will analyze and engage with previous works regarding the
central themes of the provision of services, decentralization and decentralization in Pakistan.
From the literature review the following two conclusions will be reached: decentralization is not
portrayed in a larger context and decentralized services such as health and education have not
been studied enough to demonstrate the impact. The larger context of decentralization considers
the sociopolitical factors of the region of interest, KP Pakistan. This literature review provides a
foundation leading to the research design. Within the research design I will discuss the mixed
methods methodology of historical process tracing and statistical analysis. The first part will
utilize historical process tracing in analyzing decentralization in a larger context by taking the
sociopolitical factors of Afghan refugees and sectarian/religious violence, into account. The
second part will be a statistical analysis in analyzing the services of health and education in KP
from 2008-2018. Prior to discussing the literature, I will provide a brief background into the
case study of Pakistan and then discuss why democratic regimes are better in the provision of
services as compared to authoritarian regimes. This second part is to justify my choice of picking
a developing democratic nation.
Background and Literature Review
Pakistan is a federal state comprised of an Islamic Republic with a presidential
parliamentary system. It is a developing democracy as the nation has dealt with undemocratic
leadership in the form of four military coups and corrupt governments. Pakistan gained its
independence in 1947 but has spent several decades under military rule (1958 – 1971, 1977 –
1988, 1999 – 2008). The reason for Pakistan’s multiple military coups is attributed to weak
Page 7
Afteb 6
leadership and a strong central government unable to meet the needs of the diverse provinces.
Corruption, poverty, terrorism and human rights violations have weakened the state and have
been used as a reason to justify military law. Military coups in Pakistan promise to alleviate the
problems of the state by punishing the corrupt leadership. Military governments also adopt
policies that are democratic in nature to appease the democratic parties in the nation and
internationally. One change in Pakistan’s constitution has been decentralization efforts.
Military governments have often passed pro-decentralization legislation aimed at
increasing effective public service delivery. There were three main periods in Pakistan’s history
when decentralization efforts were initiated. Those were General Ayub’s Basic Democracies
Ordinance 1959, General Zia-Ul-Haq’s 1979 revival of Basic Democracies Ordinance, and
General Musharraf’s Devolution Plan (Salman 2009, 8-10). The efforts by General Ayub and
General Haq were short-term and were not followed through. The nature of their decentralization
efforts was limited to allocating funds to different provinces without establishing proper
institutions to validate the proper usage of those funds. This lack of accountability led to more
corruption as funds would be misused and not utilized for planned projects in the provinces.
However, the Musharraf Government adopted comprehensive reforms dedicated to
decentralization which are evident in Pakistan today with additional amendments.
Decentralization efforts in Pakistan, how other scholars have discussed it and why their
explanations are incomplete, will be discussed in the “Decentralization in Pakistan” section of
my literature review.
As this case study focuses on a democracy (albeit a struggling one) it is essential to
briefly discuss why democratic regimes are considered by scholars to be better at the provision
of services than authoritarian regimes. Scholars have cited two reasons, elections and distribution
Page 8
Afteb 7
of services. Elections in a democratic regime are the linkage between the people and the leaders.
Elections make the leaders and their party accountable to adequately meet the needs of the
people in the form of public services. Thus, it is argued that elections in democracies offer
accountability that encourages effective public service delivery (Deacon 2009, 244; Lake and
Baum 2001; Mesquita et al 2003; Min 2008). Even though authoritarian regimes have elections,
they are not free and fair, rather rigged and often for lip service (Deacon 2009, 242). Regular
elections are a facet of democracy that sets it apart from autocracies and makes the regime more
likely to provide better quality and quantity public services
Elections in a democracy make leaders accountable to the whole nation and, thus, more
likely to distribute services to the whole nation. On the other hand, authoritarian regimes do not
have the accountability that comes from elections. Consequently, their services are often focused
on the elite (Ross 2012, 69; Goldberg and Wibbles, 4). Any services the non-elite have, are often
poorer in quantity and quality, as compared to democracies. (Haber and Menaldo 2011, 5;
Przeworski 2012, 18). Given the focus of this study, it is important, then, to look at the three
bodies of literature, provision of services, decentralization and decentralization in Pakistan.
Provision of Services
The first theme is the literature on the provision of services which consists of quantitative
and qualitative studies on undemocratic and democratic nations. Since my case study of KP,
Pakistan is a developing democracy, the literature will be limited to provision of services in
developing democratic regimes. The first set of scholars who study developing democracies
believe that the consistent ineffectiveness of the delivery of public services is due to the legal
structure of the nation (Asunka and Afulani 2001). The nations that were studied had lack of
legislation or enforcement of law. Different institutions of the nation such as a national
Page 9
Afteb 8
government and state governments lack in communication. Effective service delivery is hindered
when the legal structures do not harmonize and there is lapse in policy. Some authors use
statistical regressions to measure the provision of services through a time frame or during the
passage of legislation aimed to impact the service. Others use historical analysis with some
quantitative data (Figures, polls) etc. to account for the provision of services. A consensus
among the scholars is that budget problems and lax institutional structure within nations is what
accounts for ineffectiveness in the provision of services (Sances 2018; Mintrom 2003, 41). Lax
institutional structure refers to a lack of governance and planning of institutions. On the other
hand, the literature fails to establish a relationship between the provision of services and
decentralization and in their specific case studies. Scholars do not present decentralization as a
main factor impacting the provision of services. Qualitative studies do a better job at looking at
the internal factors that impact provision of services through historical backtracking, but their
focus is still on projects or legislation that has affected the services. Projects and legislation
meant to impact specific public services on a smaller scale are accounted for more as compared
to looking at systemic phenomenon such as decentralization. Although the factor of
decentralization is not completely ignored within the literature on the provision of services, it is
not developed any further. The provision of public services also looks at responsiveness and
participatory government.
Additionally, the measurement of responsiveness within a nation related to the provision
of public services is a widely discussed topic that has its shortcomings. It is important that I
discuss the benefits and disadvantages of measuring responsiveness in relation to the provision
of services. Responsiveness is “an outcome that can be achieved when institutions and
institutional relationships are designed in such way that they are cognizant and respond
Page 10
Afteb 9
appropriately to the universally legitimate expectations of the citizens” (Popescu 2016, 68).
There are benefits to measuring responsiveness because it does tie the government to the people.
The responsiveness factor contains facets about accountability, which is essential for
understanding public service delivery. If the polls or public opinion data set says that water and
sanitation has not been good in a specific region, perhaps right after a particular law, election, or
natural disaster, then that data is highly reliable especially if paired with quantitative data
regarding water and sanitation (scholars mostly look at clean water zones and sewage drainages
in particular distances) (Popescu 2016; Hendriks 2010). Responsiveness of the public shows how
accountable the nation is to the problems of the people.
Unfortunately, basing literature mainly on the relationship between responsiveness and
provision of services has its disadvantages because it is incomplete and cannot apply to all case
studies and situations. First, the sample that is picked must be able to represent the entire region
being studied. Since public services and their quality, are quite subjective, it is difficult to see
only through responsiveness. Additionally, the responsiveness literature is useful in assessing the
public’s perception of the quality of service but does not provide data on the actual quality. This
is because open-ended questions cannot account for the opinions of all constituents causing
limitation on public service delivery data.
Furthermore, the scholars look at how a participatory government, “one in which
constituents have institutions that involve them in the lawmaking process,” can improve service
delivery (Thompson et al 2018; Bauer 2009, 35; Dauti 2014). A participatory government works
hand in hand with the data obtained on responsiveness of a government. Data collected about
responsiveness is utilized in creating a participatory government. This is because the
responsiveness data helps to include the constituents into the lawmaking process. For example, if
Page 11
Afteb 10
a region is unresponsive regarding health services, because surveys obtained showed that most
people do not know how to get a referral for a specialist, then the participatory government
would use this data to set up institutions that would improve the health services and address this
problem. It can be inferred that accountability will benefit and the provision of services will be
better if citizens are more involved with their government’s decisions. But, the results in the long
term do indicate that measures put in place to increase responsiveness and set up a participatory
government are sometimes short-term projects by governments prior to election season. These
promises are not meant to be implemented in the long run, thus have no long-term impact on
service delivery (Karuri et al 2010).
The literature on provision of services can numerically present sufficient data sets on a
particular service, backing it up with a historical analysis, but looks at the provision of services
in a one-dimensional framework that is only affected by budget, lax institutional structure, and
responsiveness. These are important facets of the inner working of the provision of services but
are not enough in explaining public service delivery in developing democratic nations, as
decentralization is overlooked. The general literature on decentralization of public services
agrees that decentralization allows for the effective provision of services in developing
democratic nations. Arguments against decentralization are not against the idea but claim that
widespread corruption and ineffective institutions hamper effective decentralization in practice.
Next, I will discuss the second theme of decentralization in the literature review.
Decentralization
Decentralization is a topic widely discussed in political science. To understand
decentralization, it is best to define it and then offer the pro and con arguments by scholars.
Decentralization is the “transference of authority, legislative, judicial or administrative, from a
Page 12
Afteb 11
higher level of government to a lower level (Reddy 1999,16). It signifies a growing international
acceptance of a more democratic and participatory approach to local governance, where direct
services can be ensured by empowering the citizenry and integrating them into the local policy
making process (Reddy 2010, 67).” The linkage between decentralization and provision of
services is made in several case studies particularly the African and Latin American regions,
with a lack of adequate planning and resources as the main culprit for unsatisfactory public
service delivery (Baban’umma 2010; Asunka and Afulani 2018; Hendriks 2010; Musekiwa and
Chatiza, 2015). These scholarly debates show that decentralization is sometimes problematic in
practice. The provision of services is measured through a specific time period and linked with
decentralization efforts in the particular nation. Effectiveness of services is determined by the
tenets of effective public service provision laid out by governments or international
organizations.
Scholars who favor the decentralization argument agree that by empowering the local and
provincial governments, the needs of the public are met in a quicker and more comprehensive
manner. There is a view that federal governments cannot possibly meet the demands of all its
constituents thus, a distribution of power is necessary. The studies the scholars use to back up
their claims often trace decentralization efforts in struggling democracies such as South Africa or
Nigeria. This is done by observing the long-term outcomes of service delivery projects in local
governments (Hassen 2003). Most of the findings indicate that decentralization is hindered when
there is misuse of funds by local governments and a lapse of communication and strategic
planning prior to the fiscal year (Ahlborg 2015; Keefer and Khemani 2005). The literature on the
pros of decentralization does highlight its benefits and propose models that would mitigate the
hurdles to establish decentralized services. Most scholars acknowledge that there are benefits of
Page 13
Afteb 12
decentralization, but the misuse of funds is what gets in the way of decentralized services. The
pros scholars mainly argue that decentralization is effective in the provision of public services
when governments do not misuse funds.
The con argument towards decentralization is a smaller group of scholars that argue that
the idea is idealistic. These scholars refer to themselves as pro “top down” (Mccort 2012;
Escobar 1995; Scott 1998). They argue that allocating most of the budget and resources for the
federal government is effective in catering to the needs of the public. This makes them against
decentralization because they do not want the majority of the resources in the hands of provincial
or local governments. The work of Escobar shows that local governments are known to misuse
funds and have inadequate personnel overseeing big projects, which otherwise the federal
government can do far better. The counter argument would be to equip local government with
resources that ensure proper institutions and personnel oversee projects. But, Mccort, Escobar,
and Scott argue that it is a waste of time and money for the federal government to delegate and
set up programs in local governments when the federal government itself can do all the work.
Both groups of scholars do argue that some level of decentralization is needed in nations
as it reduces the middleman or several layers of institutions the common man must go through to
get something done. For example, if a constituent of a specific region needs clean water for his
neighborhood it is difficult for him to go to the federal institutions that are not only far away, but
also busy with other duties. That is where the local institutions come in and help mitigate
conflict. From the arguments of the scholars, the main problem with decentralization is
corruption and a lack of planning for the building of effective institutions.
In summary, the scholarship on decentralization indicates that it is an effective form of
governance. Critics have attributed the lack of benefits to poor implementation and misuse of
Page 14
Afteb 13
funds. Nations and institutions have misused funds and have planned poorly to decentralize
services, a main culprit of decentralization. Leading to our case study, the larger context around
decentralization in particular regions has often been overlooked. This means that decentralization
has been studied by scholars without utilizing a historical context and involving factors unique to
the region of interest. This would allow one to see how those factors affect decentralization (and
vice versa). The same can be said about KP Pakistan. Decentralization has been studied in
Pakistan but an analysis of decentralization in a larger context is missing. The first part of this
study is to provide a larger context of decentralization in KP Pakistan. The subsequent section
will provide more detail about how decentralization has been studied in Pakistan so far.
Decentralization in Pakistan
Turning to the case study of Pakistan, research has been done on decentralization in
Pakistan and most notably in the region of interest, Khyber Pakhtunkhwa. This section will first
discuss decentralization efforts in Pakistan, scholarly explanations of decentralization, and then a
critique of the explanation. After the military coup of General Musharraf’s military government,
the local government system started in August 2001 through the Local Government Ordinance
(LGO) 2001. This was the third in a series of decentralization reforms but “much more
comprehensive and significantly more ambitious in their aim to transfer meaningful power to the
local governments” (Aslam and Yilmaz 2011, 162). These efforts, called the Devolution Plan,
“introduced radical institutional changes to help redress key issues around political participation,
governance, resource distribution, and service delivery,” and to improve government
accountability by empowering citizens to hold the state directly accountable (Khan 2015, 575).
In Pakistan there are scholars who favor and others who oppose decentralization. Devolution is a
type of decentralization and is used synonymously with decentralization in Pakistan as it “not
Page 15
Afteb 14
only transfers power to lower levels but also makes a case for ownership of assets as well as the
transfer of whole governance responsibility to the local or sub-national level” (Saud and Khan
2016, 399).” It is pertinent to discuss how scholars have viewed the outcome of decentralization
in Pakistan since the Devolution Plan, and the relationship developed thus far with the provision
of services.
The literature argues that the goals of the decentralization reforms in Pakistan were
initially to create “create political allies of the regime at the local level to counter opponents at
the national and provincial levels,” and to create “avenues for local government to respond to
popular pressure for service improvements” (Hasnain 2010, 129). The goals of decentralization
were equal distribution of services amongst all provinces. However, top- down scholars, such as
Watson and Khan, argue that the quality of the services is low and not well-regulated as
compared to being headed by the federal government, again with the argument of misuse of
funds and inadequate institutional structure. Their argument is further supported by specific
research done in provinces in which decentralization negatively impacted developmental projects
aimed to provide efficient services (Khan and Ghalib 2012; Watson and Khan 2010). This
research mostly looked at development projects in Punjab that were defunded due to the
adaptation of decentralization efforts. Prior to decentralization these projects related to roads and
water/sewage were funded and well-functioning, but the transfer of power disrupted the process
(Watson and Khan 2010). Primarily, it was not the idea of decentralization but the way it was
implemented in its early years. But there are some flaws in the scholars’ interpretation and
methodology of measuring decentralization in the nation.
The focus on the provision of physical infrastructure by scholars has limited our
understanding of the delivery of other public services. This is called sector prioritization which is
Page 16
Afteb 15
when there is prioritization of the “provision of physical infrastructure - specifically, roads,
water and sanitation, and rural electrification - at the expense of education and health” (Hasnain
2010, 130). This practice is done by politicians but even scholars researching on decentralization
tended to focus on services that were related to the physical infrastructure of the nation or region.
This is because those improvements in the physical sector show that decentralization reforms
have finally worked. Measuring education and health is more complicated as the criteria are
much nuanced and not straightforward as compared to the black and white nature of measuring
physical infrastructure. (e.g. a bridge or road is either built or not). Education and health are
continuously ignored by scholars as they do not fit into the framework of their research. Thus,
physical structure prioritization of services became the issue in seeing the actual impact
decentralization reforms have on the provision of services. The second part of my study is to
overcome sector prioritization, studying health and education services in KP from 2008-2018.
Summary
In Pakistan decentralization efforts from the early 2000s have generally been appreciated
by scholars and criticized for the same reason of corruption and ineffective institutions.
However, what has not been studied is a larger context of decentralization in the region of KP
Pakistan. By focusing on specific services more than others, scholars and politicians have
ignored the rest of the services (health and education), particularly in Pakistan. The dearth of
literature regarding the provision of services and decentralization post 2001 reforms in Pakistan,
will be met in the following manner: the first part will utilize historical process tracing to present
decentralization in KP in conjunction with the sociopolitical factors of the region. The second
part will utilize statistical analysis to measure the services of health and education, in order to
study their impact on decentralization (and vice versa). This study expects to find a positive
Page 17
Afteb 16
impact of decentralization on the provision of public services in KP Pakistan based on the
literature conduced thus far. The subsequent sections will explain how I have collected data on
the two parts related to my research. The research design section will provide an in-depth
overview of my study.
Introduction to Research Design
Research on the provision of services has investigated the decentralized implementation
of public service delivery (Asunka and Afulani 2001; Sances 2018; Mintrom 2003; Thompson et
al 2018; Bauer 2009; Dauti 2014). When public services are decentralized, the federal
government delegates monetary and institutional authority to state/local governments. Although
scholars argue that sometimes decentralized services are more effective in theory than in
practice, it was found that decentralization of services is more effective than the centralization of
services. Regarding KP, I am arguing that decentralized services are in fact more effective in
practice.
The delivery of public services is particularly difficult for developing democracies
because of lack of resources, poor institutional structure, and systemic corruption. In order to
enhance public services, some developing nations have embarked on a path towards
decentralization. Pakistan is a developing democracy that headed towards decentralization
through reforms provided by three military government and the 18th Amendment. The case
study of Pakistan is interesting as more than half of Pakistan’s history consists of a centralized
government under military rule. More interesting is the Khyber Pakhtunkhwa region of Pakistan,
located between the border of Pakistan and Afghanistan. This region encompasses a variety of
sociopolitical factors such as Afghan refugee crisis, corruption, ethnic violence, and informal and
formal law, which are impediments to the decentralization of services. The tradition of
Page 18
Afteb 17
centralized government and the effect of these sociopolitical factors make this province a good
test of the effectiveness of decentralization on the delivery of services.
This province was chosen because the characteristics of this province have made
decentralization difficult. The KP region is riddled with problems internal to its political
structure and security as compared to other provinces. Studying decentralization and the
provision of services is essential for this region to see how they have overcome the odds against
them. Additionally, the changes the government of KP has made in these ten years will become
evident through the data collection. As I will study the effect of decentralization on public
services in a particular province of a nation, ultimately, my argument is: based on the
literature to date, I expect to find that decentralization had a positive impact on the
provision of public services in Khyber Pakhtunkhwa, Pakistan from 2008-2018.
Methodology
I have looked at the historical context of decentralization in Khyber Pakhtunkhwa,
Pakistan by observing primary (government documents) and secondary documents (history
books or scholarly analyses), that tell the points in history when decentralization began, the
political situation of the province, and the sociopolitical factors that affect decentralized public
services. The primary government documents come from the website of the KP Government that
discuss legislation regarding decentralization. The secondary documents are history books on
decentralization in the nation or works of other scholars regarding decentralization. The second
part of my study utilized government statistics to focus on the health and education services
because they have been neglected in previous studies and are important for the nation. I
measured the effectiveness of the two services by using the objectives outlined from the KP
Page 19
Afteb 18
government. There are three datasets whose information will come from a mix of government
statistical reports.
The larger construct of decentralization is to be studied, measured and operationalized in
the following manner: the method of process tracing is utilized to analyze the history of
decentralization in Khyber Pakhtunkhwa, Pakistan. Factors of the KP region such as Afghan
refugees and religious violence, are the prime focus in analyzing the sociopolitical factors
affecting the decentralization process. These are chosen because there is past and present
research on them. As I observed the history of decentralization in the KP region in relation to the
characteristics of the region, patterns emerged to explain the evolution of decentralization in KP.
For example, the influx of undocumented Afghan refugees in the region affects the provision of
public services in the region, as the decentralized state cannot support the population with equal
distribution. The relationship of a porous border and decentralization shape decentralized
services for several years in KP. Instead of offering a one-dimensional historical analysis of
decentralization in KP which focuses only on dates and policies implemented, this study aimed
to account for factors of the region that have shaped decentralization. This method of process
tracing allows us to see the following but not limited to: the impact of decentralization on the
government of KP, which factors of the region have shaped decentralization, the periods in
which decentralization struggled, and how the provision of services in the second part of the
study have been affected. The second part of the study is quantitative and deals with education
and health services in KP.
Studying, measuring, and operationalizing health and education
The construct of the provision of public services, that is health and education, is studied,
measured, and operationalized by utilizing government statistics. The two services in KP are
Page 20
Afteb 19
measured from 2008-2018. The following sections will provide detail as to how the effectiveness
of each service was measured. The subsequent section will attempt to explain what the process
tracing of decentralization combined with the statistics of services means for the research
question.
Health
According to the Health Department of Khyber Pakhtunkhwa, problems of economic
growth, terrorism, and security have plagued the region and inhibited the development of the
health sector. Thus, the government of KP and the health department outline objectives, which
will be basis of our measurement of health in KP from 2008-2018. Health outcomes in KP are
compared to the following objectives:1
1. “Enhancing coverage and access to essential health services especially for the poor and
vulnerable.”
2: “A measurable reduction in morbidity and morbidity due to common diseases especially
among vulnerable segments of the population.”
Health Objectives and Sub-Objectives
Health Objectives Sub-Objectives
1) “Enhancing coverage and access to
essential health services especially for
the poor and vulnerable.”
1a) Hospital Environment
2) “A measurable reduction in
morbidity and morbidity due to
common diseases especially among
vulnerable segments of the
population.”
2a) Vaccinations
2b) Hospital Treatment
1 Obtained from Khyber Pakhtunkhwa Health Sector Strategy (Government of KP)
Page 21
Afteb 20
Within these objectives, there are several goals. For example, regarding the first outcome, there
is a special focus on increasing the doctor to hospital ratio in rural areas of KP and decreasing the
cost for emergency services. For the second objective, initiatives to fight diseases such as malaria
are to be taken. Effectiveness of the health services over the ten-year period will be determined
by the improvement of the objectives from one year to the next. Improvement will be determined
by the following: in the health reports filed by the KP government and health department, there
is a section that is titled “outcomes.” Outcomes outline the initiatives to be taken to meet the
objectives within the yearly time frame or five-year term. If those specific outcomes were met
from one year to the next (keeping in mind the several subsections of the outcome) then the data
will determine the improvement in service delivery.
To validate whether the outcomes are met, government statistics within the region will be
utilized. Government statistics are organized into three varying data sets. The first one is a
simple chart organized with the health objectives and sub-objectives. If bolded, then those
objectives or sub-objectives were met.
The second organization method is more complex as it will look to the sub-objectives by
year. This will provide more detail than chart, which is meant to provide a visual summary for
the data collection. The specific organization method that will be used for the data is to be
determined after the data has been collected. The third data set looks at the budget allocation to
the varying health objectives per year. Increases or decreases in budget as compared to the two
data sets, will show whether budget allocation affected the objectives. If budget in health
increased from one year to the next, and the health services in the budget did not improve, then
what does this say about where the money is being allocated? Should it be utilized towards or a
different objective, or does there need to be institutional reform to meet the initiatives? Thus,
Page 22
Afteb 21
decentralization is questioned. If it is determined that decentralization efforts have been strong
for a given year or two (increased budget means more power to provinces through institutions),
and health services did improve, then there is a positive impact of decentralization in KP. After
the collection of the data for health, a variety of patterns and questions will arise that will explain
our study. After analyzing health, we will measure and analyze education services in KP.
Education
Education services are measured and analyzed in the same manner as health. The first
data set consists of the following objectives outlined by the KP government by year:2
1: “Improving Quality.”
2: “Enhancement of enrollment.”
3: “Infrastructure and Environment.”
Education Objectives and Sub-Objectives
Education Objectives Sub-Objectives
1) “Improving Quality.” 1a) Government institutions by school type
1b) Government teachers in by school type
1c) Total number of teachers by year
2) “Enhancement of enrollment.” 2a) Government school enrollment by school type
2b) Male and female enrollment by school type
2c) Total government school enrollment by gender
2d) Complete enrollment by year
3) “Infrastructure and Environment 3a) Primary schools without basic facilities
3b) Secondary schools without basic facilities
3c) High schools without basic facilities
3d) Higher ed. schools without basic facilities
2 Obtained from Khyber Pakhtunkhwa Education Sector Plan (Government of KP)
Page 23
Afteb 22
Similarly, the first data set is a simple chart organized with the health objectives and sub-
objectives. The second data set is more detailed as it will consist of the sub -objectives of
education. The third data looks at budget allocation to the varying education services per year.
Akin to health services, numerous questions regarding the relationship between effective
education services and decentralization are raised and addressed. Now I will discuss how these
two parts of the study-process tracing of decentralization and statistical analysis of services will
complement one another.
In our case study of KP, Pakistan, the mixed method usage of process tracing and
government statistics addresses the research question. Again, I am trying to see the impact of
decentralization on public service delivery from 2008-2018 in Khyber Pakhtunkhwa. The
method of process tracing provides the background information on decentralization in KP but
also with respect to the socioeconomic factors of the region. The second part in which I
measured and analyzed health and education services from 2008-2018, tells of the overall
effectiveness of services in this ten-year period and the impact of decentralization on the
services. I will present the impact of factors on decentralization in KP, prior to the quantitative
section on services. This insight from the first part allows us to see in the second par, the impact
of decentralization on the provision of the two services. But there are some limitations to the two
parts of our proposed data.
Limitations
For the first part of our study, I process traced decentralization. Although previous
studies discuss the history of decentralization in Pakistan, socioeconomic factors of KP have
been disregarded. But there are some weaknesses to my approach. Firstly, it is difficult to
account for all the characteristics of the region that impact decentralization. Secondly there are
Page 24
Afteb 23
several factors such as corruption, which do impact the provision of services but there is
insufficient scholarly work and data to support any claims. I also prioritize some characteristics
more than others, such as Afghan refugees and religious violence. This prioritization limits my
study of decentralization of KP. Fortunately, this limitation can be met by acknowledging the
difficulty in measuring every single possible characteristic of a region. These factors on
decentralization are pertinent to the issue of provision of services.
Another limitation regarding the second part of our study, the quantitative analysis, is
lack of numerical data for all the objectives and sub-objectives for every year from 2008-2018.
This was met by trying to utilize my sources in Pakistan to get all the data I need. Another
limitation is bias or credibility issues regarding the data set. Conflict arises if government sites
report different numerical data on service delivery as compared to other government sources. In
this case, the varying data sets will be discussed in the results section. Regarding the limitations
of the two methods, I tried my best to overcome them through utilization of varying sources.
Part 1: Historical Process Tracing
The subsequent sections will serve the following purpose: first, to trace the
decentralization reforms in the case study of KP, Pakistan. Second, I will connect the
sociopolitical factors of the region of KP to decentralization efforts to show how they are
obstacles and whether they have been overcome. We will see through the historical analysis how
decentralized services have improved when these obstacles have been mitigated in KP. Further
evidence of how decentralized services have become more effective over time will be seen in the
second part of the study; the quantitative section.
Page 25
Afteb 24
1.1 History and Analysis of Decentralization Efforts
Earlier I discussed decentralization reforms under the Devolution Plan, which is used
interchangeably as the Local Government Ordinance 2001, were enacted to start decentralization
reforms in Pakistan. I also discussed how this brought more focus on local and provincial
governments thus, better provision of services. However, now I will go into detail as to what
these recent reforms entail and how they take in place KP in conjunction with the sociopolitical
factors.
I will first explain what the Devolution Plan does to the layers of government in Pakistan.
Previously there was a provincial government and national government, with the former not
empowered through monetary resources. Local governments failed to exist, primarily because
they were a threat to military governments who wanted to hold monetary control of the nation.
However, this plan allows the local government to be divided into three tiers within each of the
four provinces (also known as divisions) in Pakistan. The three tiers are the following: district
(zilah), tehsil, and union council. A district is the first of the tiers and divides each province
further, such as the concept of states in the U.S. There are District Governors or District
Coordination Officers, similar to mayors in the U.S. In Pakistan total there are a total of 129
districts and 34 in KP (Commonwealth Local Government Forum on Pakistan 2017). The district
serves to carry out the functions of the provinces within district (“state”) lines and focuses on
agriculture, community development, education and health.
Secondly, the tehsil is the second tier of local government which breaks up the districts
and is akin to an administrative headquarters of the district. In KP there are 3,339 tehsils, which
includes village and local councils. KP is the only district with tehsils primarily because of the
diverse ethnic makeup of the region. There is no governor in these but rather a Tehsil Council
Page 26
Afteb 25
Officer and council which is akin to a larger city government. A tehsil serves to carry out
functions related to the infrastructure of buildings, roads, schools, etc.
Finally, the third tier of local government is the union council which serves the locals
through direct elections and is synonymous to a city hall or town hall council. There is a total of
7,979 union councils in Pakistan and 2,835 in KP (Commonwealth Local Government Forum on
Pakistan 2017). Additionally, since there are urban and rural areas across Pakistan, the councils
are often known as “rural” or “urban,” to receive adequate resources according to their needs.
These union councils serve to meet the community needs of the area, such as local crime
reduction, community or recreational activities, housing etc. After discussing what the local
government system entails, it is important to see how it is justified for the nation and region of
KP as well.
Prior to decentralization reforms there have been times in Pakistan's history in which
elections on the provincial level were held. This mostly occurred during military coups of Haq
and Ayub who sought to legitimize their military rule with pseudo decentralization reforms,
involving similar plans like the Devolution Plan but no complete enactment. It is only after the
Devolution Plan that local elections received importance. These local elections are the
foundation upon which decentralization has the possibility to prosper. These elections strengthen
the three-tier system of local governance which scholars believe will bring political power to the
lower level and better service provision (Kharl et al, 57).
Giving resources through a local three tier system benefits the rural population as
decentralization in Pakistan “entails a net transfer of fiscal resources from richer to poorer areas”
(Kharl et al 60). An ethnically diverse region like KP has lacked proper provision of services
because the former centralized system led to allocation of the majority of resources to other
Page 27
Afteb 26
provinces or other areas within the region that were better financially. To better understand the
benefits of decentralized services, I will spend the subsequent sections discussing how health and
education is decentralized in Pakistan.
Now moving to the particulars of decentralized health services in Pakistan and in KP, I
will discuss the institutions in Pakistan that control the several aspects of the healthcare industry.
First, it is important to know that health care in Pakistan is a mixed system with both private and
public hospitals and institutions. However, the challenge is that private healthcare makes up 70%
of all the healthcare facilities in Pakistan, as the government has poorly managed the public
sector in the past (Kumar 2017).
Since services were decentralized in the early 21st Century, public healthcare systems
have been renovated, The Ministry of National Regulations and Services functions at the federal
level and “plays a key role in the formulation of policies, strategies, setting a vision, and
planning” (Kumar 2017). However, it is the provincial and local government that takes charge of
the operationalization of the policies. Additionally, there are two different tiers of the health care
system. The first or primary health care facilities is provided by Basic Health Units, Government
Dispensaries in a village area, and Rural Health Care Centers if it is a town. The secondary
health care facilities are called Taluka Head Quarters and District Head Quarters at the district or
city level. Financing public health care is now done primarily at the district level rather than a
federal or provincial level. This leaves 60% of the government health expenditure to be managed
at the district level” (Kumar 2017). Apart from government revenue, under decentralization the
public health care sector is supported by “out of pocket payments, developmental partners,
private insurances, external resources to NGOs and world funding” (Kumar 2017). With the
Page 28
Afteb 27
public health system being managed at the district level, healthcare in KP has improved, which
will be seen in the quantitative section.
Similarly, with education in a decentralized Pakistan, there are several institutions and
tiers that manage education to make it a more local effort. As with health, education is also
privatized in Pakistan, and government schools have been neglected in the past. The Devolution
Plan was enacted to reduce this neglect by creating several tiers within different services. For
education there are three levels of education, federal, provincial and district. The federal
government is responsible for “national policy formulation, addressing issues regarding access to
education, equity and quality of education, setting teacher pay levels, defining required teacher’s
qualifications, setting the norms for national curriculum and assessing student’s performance
through national assessment systems” (Shah 2003, 5). The provincial government is now in
charge of the “formulation of Provincial Education Policy in the light of National Education
Policy, coordinating with the federal government for implementation of ESR program as well as
with the respective districts, arranging pre service and in-service teacher training, assuring
equity, access to schooling, quality of education and influencing curriculum” (Shah 2003, 5).
However, the district is more accountable to the people and directly impacts the
community and is the most pivotal part of the Devolution Plan. Decentralized education brings
the local governments accountable to the citizens as the district is responsible for “planning,
monitoring and devaluation of education system at the district level” (Shah 2003, 5). They are
also responsible for recruitment, salary, managing teaching and non-teaching staff at the district
level. The district level is given these jurisdictions over the public education department in order
make sure that education is a local effort.
Page 29
Afteb 28
Regarding how education is financed the district can obtain money from the district
governments’ own resources, provincial non-earmarked block grants (money granted to districts
for a specific expenditure), and from ad-hoc federal education grants (grants for unexpected
expenditures) to provinces and districts (Khan & Mirza 2011, 157). It is now the responsibility of
the district regarding how much is to be spent on education. The district governments are now
“fully empowered to allocate expenditures to various sectors in accordance with their own
spending priorities that are evident from the annual budgets” (Khan & Mirza 2011, 158). Even
though most of the money and resources come from the federal and provincial governments,
districts still have their own resources and much of the responsibility to meet the health and
education needs of their constituents under decentralization. However, there are obstacles for
decentralized health and education services. These obstacles are sociopolitical factors of the
region in KP—Afghan refugees and religious violence
1.2 Sociopolitical Factor 1: Afghan Refugees
While observing the arduous process of decentralization Pakistan has undergone, it can
be agreed that extending the provision of public services to the largest population possible is one
of the main reasons Pakistan changed its government structure. The Afghan refugee crisis began
in 1979, a time where there had been two previous attempts to decentralize public services. One
was by General Ayub in 1958 and the other by General Zia in 1979. However, both plans were
not to be actually implemented in the long run and simply legitimized military rule. Mainly, the
majority of Pakistan rejected these decentralization attempts as they were being headed by a
military government. At the same time of Zia’s planned decentralization efforts, the Soviet
Invasion in Afghanistan prompted the Pakistani government to welcome their Afghan neighbors.
However, the already porous border (the Durand Line) brought in a large number of refugees for
Page 30
Afteb 29
years to come. Later in history, the Pakistani government’s inability to provide for this
population will ignite an array of issues. During the analysis of the sociopolitical factor of
Afghan refugees, first I will detail the history of the influx of Afghan refugees, next I will
discuss how this conflicts with decentralized services, and I will conclude with the current
situation and possibility of improvement of this obstacle. Perhaps, decentralized services can
actually aid Afghan refugees and others in Pakistan through correct integration of their
neighbors.
Prior to discussing the history of Afghan refugees in Pakistan, it is essential to define
what a refugee is. The most appropriate definition during 1979 comes from the Geneva
Conventions of 1958. According to the Geneva Conventions “the term refugee shall apply to
anyone to anyone who...owing to a well-founded fear of being persecuted for reasons of race,
religion, nationality, membership of a particular social group or political opinion, is outside the
country of his nationality and is unable to or, owing to fear is unwilling to avail himself of the
protection of that country” (Khattak 2003, 198). During the time of the Cold War, Western Allies
and the U.S. supported many who were fleeing under USSR rule. Pakistan was involved with
the Cold War as they were allied with the U.S. for containing Soviet expansion. Acceptance of
Afghan refugees by the Zia regime did not serve to be merely a goodwill gesture. Rather it was
the military regime’s “attempt to gain internal and external legitimacy, and to strengthen itself on
the military, economic, diplomatic fronts by taking anti-communist stance and toeing the
American line in its supports of the Afghans” (Khattak 2003, 198-199). Additionally, Pakistan
was receiving plentiful aid to accommodate the Afghan refugees and to establish madrassas to
train the mujahideen in order to defeat the Soviets in Afghanistan. However, Pakistan would not
have this foreign aid for long. By the late 1980s the end of the Cold War, the 1990 breakup of the
Page 31
Afteb 30
Soviet Union, the dismantlement of the Soviet-backed Afghan 1992 government, and subsequent
1996 Taliban invasion, led to decreased support for aid for the Afghan refugees. Pakistan and
predominantly the KP region were left with millions of refugees without any resources to protect
them. At this time, Pakistan had countless documented and undocumented Afghan refugees.
After 9/11, Pakistan sealed its border and would no longer allow any Afghan refugees to enter,
citing fear of terrorism in the nation. However, international pressure made them change the
policy and allow 1.5 million to enter. Similarly, in 1979 and subsequent years, the refugees lived
in camps. The difference now is that the refugees were forced to live in the cold mountainous
terrain compared to relatively good and welcoming camps back when Pakistan was receiving aid.
This issue of Afghan refugees also plays a role in religious violence as an obstacle for
decentralized services in KP and will be discussed after the subsequent section on the impact of
refugees towards decentralization.
Although the Zia regime implemented pseudo decentralized efforts consisting of non-
politically elected governing bodies (religious leaders), the majority of the financial resources
was still in control of the national government. The illegitimate military government could not
afford to lose its hold over Pakistan by giving provinces power. Through 1979 and the early
1990s, centralized services worked well for Afghan refugees because of foreign aid. However,
without foreign aid this centralized system offered no support. Thus, the entry of the Devolution
Plan formally introduced Pakistan to decentralization. In provinces such as Punjab and Sindh,
this task was mandated by a policy that would account for all the population. However, KP
suffered due to its large refugee population. The provision of service delivery under a
decentralized system was also difficult for KP due to this population. Furthermore, most refugees
were ethnically Pashtun, which is the primary ethnicity in KP, making them more similar to the
Page 32
Afteb 31
culture of Pakistan as compared to most refugees from other foreign nations. This similarity
somehow made the government even more responsible to meet their needs as they were like their
own. But, KP failed to have the economic means to accommodate the Afghan refugees. Thus,
even after the Devolution Plan, decentralized services in KP encountered an obstacle in the form
of Afghan refugees, a population that was already marginalized economically, socially, and
politically. Consequently, an increase in repatriations began in the early 2000s. An article by the
Journal of Urban Regeneration & Renewal, by Ammar Malik, says in early 2016, 1.5 million
documented and 1 million undocumented refugees lived in Pakistan, the majority in KP (Malik
et al 2017, 31). Additionally, since 2009 an average of 56,839 Afghan refugees leave per year.
However, just between July-November of 2016, 369,580 documented refugees and 200,000
undocumented refugees left Pakistan. Human Rights Watch (HRW) and United Nations High
Commissioner for Refugees (UNHCR) believe that these repatriations are rather forced based on
the interviews of 150 former Afghan refugees. These repatriations were mainly done to decrease
the economic burden on the state and KP province, along with lessening the chances of cross-
border terrorism. Although through the quantitative data I will show that health and education
services improved immensely under a decentralized form of services in 2008 to 2018, is it at the
cost of these repatriations? To conclude I will discuss the most current Afghan refugee situation
and offer an approach to how this obstacle to decentralized services can be transformed into an
ally of decentralized services.
Afghan refugees have been a subject to a variety of conditions and hardships in Pakistan,
primarily because they are seen as a burden on national and provincial governments, which as a
result, cannot provide adequate services. However, the past few years brings a shift in policy that
is in the interest of the Afghan refugees. Since September 2018, newly elected Prime Minister
Page 33
Afteb 32
Imran Khan has promised to grant Afghan refugees citizenship in Pakistan. This is due to
mounting international pressure from human rights groups and the fact that as many as 60
percent of Afghans in Pakistan were born there to Afghan refugees (Barker 2018). Birthright
citizenship is a concept in Pakistan and was previously denied to Afghan refugees. The newly
elected government of Pakistan Tehreek-e-Insaf is more inclined to help integrate Afghans into
Pakistan, especially since it has been the ruling party in KP since 2013.
Previously, I acknowledged that the Afghan refugee crisis is one of the sociopolitical
factors that has been an obstacle to decentralized services in KP because of the economic
shortcomings of the provincial government. This is still true for earlier years, but recent times
show that this obstacle is slowly decreasing due to decentralized services. Institutions such as
Commissionerate Afghan Refugees (CAR) in KP, is backed by UNHCR and works with the KP
government to help Afghans integrate into society by offering a multitude of social services
(kpkcar.org). Regarding the specific public services of health and education, the KP government
has included Afghan refugees. In the health sector, the UNHCR signed a memorandum with the
KP Ministry of Health to bring forth the provincial immunization program to refugee camps and
to other Afghans in KP (UNHCRpk.org). Additionally, the KP government supported
universities welcoming Afghan refugees, such as the Peshawar Afghan University and helped
integrate refugees in primary government schools (reliefweb.int). With more programs that
integrate this large population into the province’s platforms, this once great obstacle against
decentralized services can help make the province even more successful in decentralized efforts
with a healthy and educated population.
Page 34
Afteb 33
1.3 Sociopolitical Factor 2: Religious Violence
Unlike Afghan refugees, this sociopolitical factor does not become a benefactor to
decentralized services in KP, but rather a reason for policy change in Pakistan and KP’s
framework to combat terrorism. Terrorism or religious violence are the main obstacles to
implementing decentralized services effectively in KP. Closely tied to the Afghan refugee crisis,
this is a negative by product of a porous border which has involved Pakistani society as well as
refugees. For this sociopolitical factor I will follow a similar route of analysis: first I will look at
the history of religious violence in KP, and next I will show how this negatively impacted
decentralized services. Finally, I will conclude with the current situation and consider whether
there is room for improvement to combat this obstacle.
There are two main causal factors of the origins of religious violence in KP and in
Pakistan overall: increased Islamization of the nation and the Afghan refugee/porous border. In
its early beginnings, Pakistan was envisioned as a parliamentary democracy without a religious
government, but a land for Muslims and other religions to live as they wish. However, the nation
still lacked an identity and purpose. Thus, in 1973 Zulfiqar Ali Bhutto, founder of Pakistan
Peoples Party, sought to bring Pakistan a national identity into regional and global politics. He
started the concept of unity under an Islamic nationalist identity which further fueled sectarian
violence—violence amongst the different sects of Islam. Specifically in KP, violence was on the
rise due to extensive military involvement which fueled divide amongst different sects (Sunni vs
Shia) (Edgett 2010, 18). Although Bhutto was overthrown in a military coup in 1977, the
military regime of Zia Ul Haq furthered Sharia Law in the nation through constitutional
amendments that would take decades to overturn. Examples of this include blasphemy laws,
separate Sharia courts to decide cases under an Islamic lens, and a Council of Islamic Ideology
Page 35
Afteb 34
that can make and overturn legislation in favor of their interpretation of Islam. In the domestic
life, legislation was created to impose inhumane punishments for fornication, adultery, rape etc.,
to enforce censorship in all spheres of life, and to appoint religious staff into all sectors of
government (Edgett 2010, 20). Most of Zia’s legislation was pro-Sunni, which fueled violence
between other sects especially in KP. Under law, Sunnis were given more preference over other
sects, which caused Shia groups and other minorities to rise. This, however, led to violence in the
form of bombings, bestowed upon minorities. The government’s silence signaled a sponsorship
to this violence. In KP, citizens relied on the ISI (Inter-Services Intelligence) to maintain control,
even though they were not on the minorities side. KP suffered tremendously at the hands of
Islamization and state sponsored violence. Concurrently the Afghan refugee crisis has made KP a
hotspot for terrorism.
The influx of Afghan refugees in 1979, as explained in the first socio-political factor, also
caused religious violence. This is not because of a stereotypical rhetoric that all refugees are in
favor of terrorism, but rather a display of the institutions created in the guise of offering Afghan
refugees a place away from their Soviet backed government. Madrassas were religious schools
built in KP that taught Afghan refugees. These schools were to teach the first generation of
mujahideen, religious fighters that were against Soviet rule. This program was sponsored by the
West and the U.S. With foreign aid and the best of technology, millions were taught military
tactics and motivated through a corrupt version of religion to fight the Soviets. Pakistan was
fighting a war it should have had no part in. However, Pakistan’s own agenda to legitimize
military law and keep its citizens under control was the reason for their support of the Afghan
mujahideen. In the future, when the West pulled their support as did Pakistan, these mujahideen
were left with no home and only the violence they were taught. Thus, Pakistan’s long battle with
Page 36
Afteb 35
religious terrorism and the Taliban began, with the contemporary War on Terror to combat
terrorism within its borders.
In a region which consists of religious violence and animosity amongst sects, it is
impossible for the local and provincial governments to effectively provide public services despite
a well-developed decentralized plan. Religious leaders with increasing political power negatively
impact education and health services. Schools were also Islamized by the Haq era and female
participation was not restricted but looked down upon. Healthcare in the form of birth control,
immunizations, hospitals etc. have been lacking in KP because of threats and religious rulings
(fatwas) by political clergymen (Schetter 2013, 54). The creation of extremist and nationalist
political parties also paved way for violence to continue and disturb public services (Asim &
Bilal 2017, 368). Political culture in KP became increasingly intolerant and violent owing to the
complicated conditions of an influx of refugees and state sponsored violence.
Conditions began to improve through international pressure on Pakistan to remove
terrorist safe havens and conduct crackdowns on religious groups, especially after 9/11. This
prompted then President Musharraf to cooperate with the U.S. in removing terrorists’ safe
havens, mainly situated in KP. The crackdown on extremist religious parties and figures also
began when Musharraf ordered the army to seize control of the Red Mosque in Islamabad, whose
members and madrassas were responsible for terrorist attacks throughout the nation (Asim &
Bilal 2017. 367). More recently in 2014, border security increased and new institutions to fight
terrorism were created, after a terrorist attack on a school in Peshawar, KP. This attack included
the involvement of two Afghan nationals, prompting the nation to control the border.
Additionally, The National Action Plan was created in 2015, which serves to crackdown
on terrorism. This plan was created with the agreement of the major political parties in Pakistan
Page 37
Afteb 36
and outlined twenty different objectives. Some of them were: executions of terrorists, crackdown
on hate speech, and registration of all religious schools (Ahmed 2015). In recent years, there has
been a crackdown on banned outfits and extremist parties in Pakistan. The most recent and
notable one was on March 4, 2019 when the Pakistani government “issued the UN Security
Council (Freezing and Seizure) Order, 2019 in accordance with the provisions of Pakistan's
United Nations Security Council (UNSC) Act, 1948” to seize the assets and properties of banned
political parties (Siddiqui 2018). The government justified this action under the National Action
Plan.
To conclude, it seems that Pakistan is on an upwards trajectory regarding the battle
against religious violence. Religious violence has been an obstacle for decentralized services for
KP because this region’s geographical nature and ethnic makeup led it to be more susceptible to
terrorism. No public services can flourish under violence. Through the second part on education
and health services, it will be shown how KP has improved from 2008-2018, regarding
decentralized services. This is an indicator of the sociopolitical factor of Afghan refugees as no
longer impeding the provision of services as they have become a part of the nation in recent
years. Additionally, improvement in services indicated that religious violence is being combated
by KP.
Part 2: Health and Education Services Statistics
2.1 Health
Now turning to the quantitative section of the study, it is imperative to see what I strive to
accomplish through this data and what it means for my overall expectation regarding the
relationship between decentralization and public service delivery. Through these subsequent
sections I attempt to show the most current data on health and education services through 2008
Page 38
Afteb 37
and 2018. By showing the different categories of each service, I strive to show the different
improvements or lack thereof in KP. Regarding my expectations, I have had hunches that
decentralization will lead to improved service delivery primarily because of my observation of
the KP region during my foreign study over the course of two years. Additionally, the literature
on decentralization is compelling and led me to believe that decentralized services will give more
benefit to the region of Pakistan. The previous qualitative section attempted to show the
obstacles for decentralized services, while the subsequent section will show how these services
functioned despite those factors.
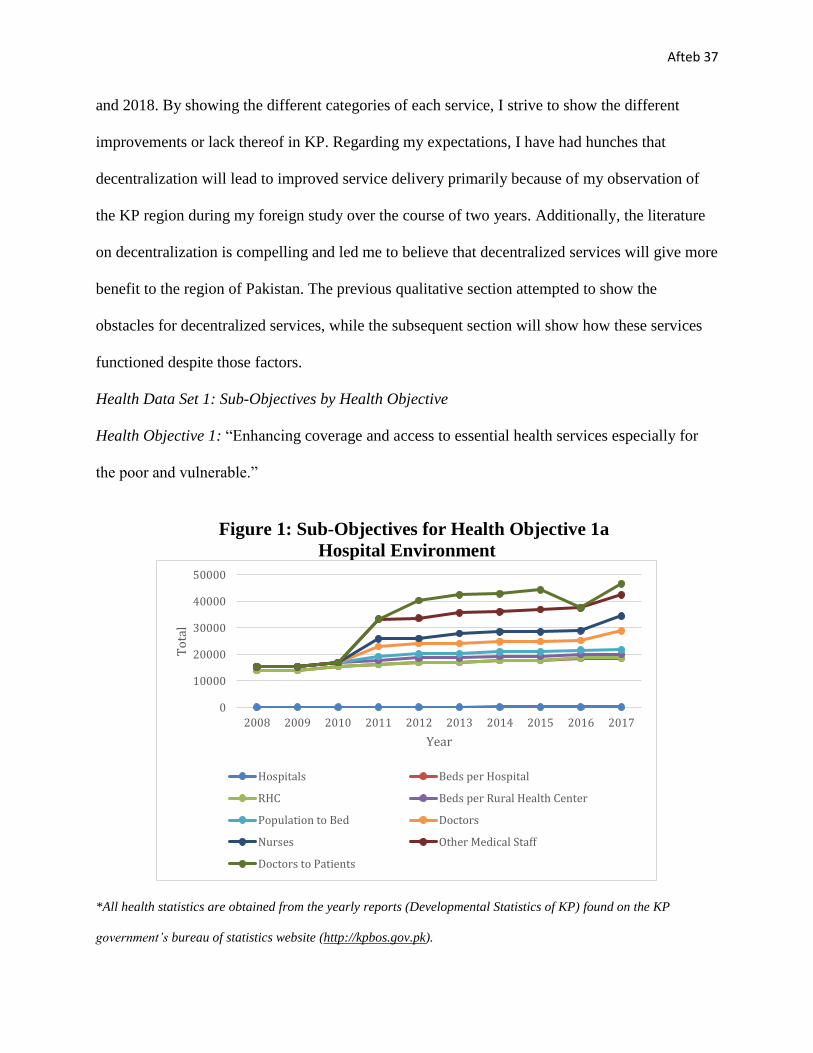
Health Data Set 1: Sub-Objectives by Health Objective
Health Objective 1: “Enhancing coverage and access to essential health services especially for
the poor and vulnerable.”
Figure 1: Sub-Objectives for Health Objective 1a
Hospital Environment
*All health statistics are obtained from the yearly reports (Developmental Statistics of KP) found on the KP
government’s bureau of statistics website (http://kpbos.gov.pk).
0
10000
20000
30000
40000
50000
2008 2009 2010 2011 2012 2013 2014 2015 2016 2017
To
tal
Year
Hospitals Beds per Hospital
RHC Beds per Rural Health Center
Population to Bed Doctors
Nurses Other Medical Staff
Doctors to Patients
Page 39
Afteb 38
The nine statistics indicated in figure 1, concern the poor and vulnerable more than the middle
and upper classes, as the former is more likely to attend government health facilities as they bear
little to no cost. It is pertinent to discuss each statistic in detail through the ten years. In terms of
the number of hospitals in KP from 2008-2018 the number has steadily risen from 163 (2008) to
238 (2017). Although there have been three occurrences when two consecutive years had the
same number of hospitals (2008-2009, 2012-2013 and 2016-2017), the number has not declined.
Accordingly, the number of beds per hospital has increased per year. Even in the years in which
no additional hospitals were made, additional beds were added with more wards created within
the hospitals already. Turning to rural health care centers, which are situated in areas which are
farther from the nearest government hospital, the number has increased from 88 (2008) to 91
(2017), but with some declines (2010-2011 and 2016-2017). Similarly, with the increase and
decrease of RHC’s beds have also either increased or decreased. Overall, hospitals and beds per
hospitals have had a better turnout as compared to RHCs but that is not much of a concern. This
is because most of KP has become increasingly urban and access to cars and public
transportation allows persons to be able to get to government hospitals faster than they could in
2008 as compared to present times. It can be concluded that hospital and RHC statistics have
steadily improved.
Turning to population per bed, this number has not really had much of a rapid increase or
decrease, but rather a steady pace. This is rather expected as the number of hospitals, RHCs, and
number of beds per institution increased steadily. Turning to staff, the first statistic of doctors
featured a relatively steady increase (with some decreases), it nearly doubled from being in the
high 3000s to 7,173 doctors in 2017. As to be seen further, increases in the health budget related
to salaries is responsible for the ability of the KP to hire a large number of doctors within one
Page 40
Afteb 39
year. Fortunately with the increase in doctors, the doctors to patient ratio has decreased as well,
indicating that the KP health budget regarding hiring more staff is a good decision. Similarly, the
number of nurses significantly increased from the lowest point of 1,929 (2012) to 5,622 by 2017.
Regarding the number of other medical staff there was no significant increases or decreases and
the number stayed within the 7000 to 8000 range throughout these years. Overall it can be said
that objective 1 was in fact met more times in these ten years as all the decreases (such as RHC)
were made in accordance of necessity.
Health Objective 2: “A measurable reduction in morbidity and morbidity due to common
diseases especially among vulnerable segments of the population.”
Figure 2: Sub-Objectives of Health Objective 2a
Vaccinations by Year
*BCG= Bacillus Calmette–Guérin for TB
OPV= Oral Polio Vaccine
DPT= diphtheria, pertussis, and tetanus.
T.T= Tetanus
0
200,000
400,000
600,000
800,000
1,000,000
1,200,000
2008 2009 2010 2011 2012 2013 2014 2015 2016 2017 2018
Nu
mb
er o
f P
eop
le
Year
Measles BCG OPV-0 DPT-1 DPT-2 DPT-3 T.T-1 T.T-2 T.T-3 T.T-4 T.T-5
Page 41
Afteb 40
Figure 2 shows the vaccinations by year administered in KP. They held relatively steady with a
high of all vaccinations in 2014. However, alarmingly the series of vaccines did not stay
consistent with the first vaccine in the series. Relatively, most of residents stuck through with the
DPT series, however, this was not the case with T.T series. By T.T.5, the numbers were
drastically less than the beginning of the series. Most of the population stuck with T.T until T.T-
2. However, the numbers increased by half from T.T-3 to T.T-4 and so forth, particularly from
the years 2009, 2010, 2017 and 2018. Thus, KP’s vaccination program has helped with
administrating malaria, BCG, OPV-0, DPT-1 to DPT-3 (still decreases with each dose but not as
much as compared to T.T) but needs to do more for T.T throughout the ten years.
Table 1:
Sub Objectives of Health Objective 2b
Hospital Treatments
Year ORS (Oral Rehydration Salts) Distributed
Malaria Cases Treated Infant Mortality Rate
2008 74.00
2009 73.50
2010 186000 37927 72.00
2011 1297050 53117 70.50
2012 447316 33828 69.00
2013 765894 37970 67.50
2014 910010 74551 66.10
2015 1039426 64374 64.60
2016 1109665 74551 63.20
2017 62.85
2018
Page 42
Afteb 41
As indicated in Table 1, ORS administered in government hospitals, there has been an overall
increase from the point of origin. This is due to more hospitals, beds, and staff to administer the
ORS. The same goes for malaria cases which had some highs and lows, which may attribute to
several things such as an occurrence of an outbreak or environmental conditions. A high or low
in malaria cases may not indicate much about the adequacy of the facilities to treat cases, as we
would need statistics for the total number of recorded malaria cases—treated and those resulting
in death. Fortunately, the infant mortality rate has decreased steadily over the years in KP.
Health Data Set 2: Objectives Met?
Table 2: Health Objectives by Year Health Objectives and Sub-Objectives
Health Objectives Sub-Objectives
1) “Enhancing coverage and access
to essential health services especially
for the poor and vulnerable.”
1a) Hospital Environment
2) “A measurable reduction in
morbidity and morbidity due to
common diseases especially among
vulnerable segments of the
population.”
2a) Vaccinations
2b) Hospital Treatment
*KEY: Bolded objectives mean the objective was met over the ten-year period.
Overall all the objectives were relatively met over the ten-year period except for “vaccinations”
and a few exceptions. Regarding Health Objective 1, it was met all the years except for 2009 and
2013. This is because the statistics had overall stayed consistent with the previous year with little
to no improvement. Although some statistics (hospitals and RHCs) had stayed the same from
2016 to 2017, the remarkable increase of staff and decrease of doctors per patient made this
objective as met. Regarding Health Objective 2, it was met all the years except for 2009, 2010,
2017, and 2018. This is because these years featured the highest rate of decrease from the first
Page 43
Afteb 42
dose of T.T-1 to T.T-5, as compared to the other years which stayed within the range. The
numbers during these four years went anywhere from 500,000-600,000 that got T.T-1 to only
11,000 or even 6,000 that received the final dose of T.T-5. Thus, for vaccinations the sub-
objective was not met.
Health Data Set 3: Health Budget
Figure 3: Health Budget by Year
*The yearly health budgets were obtained from the KP Finance Department online
(http://www.finance.gkp.pk), from the Annual Budget Reports.
With increasing government expenditures relating to population and more concentration of the
population in urban areas, the budget has increased accordingly. The most dramatic yearly
increases have been from 2013 to 2014 and 2017 to 2018. For most of the ten years it seems the
increases in the health budget is justified, as most of the objectives have been met (see Table 2).
However, the red numbers on Table 2, which indicate that the objective has not been met also
indicated that the health budget was inadequately used. For example, in 2009 both objectives
were not met, because hospital and staff increases were insufficient (objective 1) and vaccine
5,4169,888 11,052
1487216,38320,868
36,413
41,27643,000
51,052
65,700
0
10,000
20,000
30,000
40,000
50,000
60,000
70,000
2008 2009 2010 2011 2012 2013 2014 2015 2016 2017 2018
PK
R M
illi
on
Year
Page 44
Afteb 43
retention rates were low (objective 2). This is disappointing as the budget significantly increased
from 2008 to 2009.
From 2008-2018, there has been improvement in the health sector in KP as indicated by
the above statistics. Despite not being able to include many statistics due to lack of availability
other than that of a few years, decentralized services are working for the health sector. For our
first objective, the hospital environment has increased by number of personnel in the medical
profession to the facilities available. Increased budget has allowed the districts in KP to
appropriately staff hospitals. However, despite improvement for the hospital treatment in the
second objective, there is room for improvement because the rates for vaccinations through a
cycle are relatively low. This means that children are not protected against easily preventable
diseases.
Turning to education, this section will show the structural data on education such as
number of institutions to enrollment and the infrastructure/environment of schools. As budgets
have increased each year, it is essential to see whether budgets are being used to improve
education in KP. My expectations for this section are far more for health as more of the budget
has been allocated towards education.
Page 45
Afteb 44
2.2 Education
Education Data Set 1: Sub-objectives by Education Objective
Education Objective 1: “Improving Quality”
Figure 4: Sub-Objectives of Education Objective 1a
Number of Government Institutions by Year
*All education statistics are obtained from the yearly reports (Developmental Statistics of KP) found on the KP
government’s bureau of statistics website (http://kpbos.gov.pk) and from the yearly reports found on the Elementary
& Secondary Education Department Government of Khyber Pakhtunkhwa’s website (http://www.kpese.gov.pk)
As indicated in figure 4, there has been an increase in the number of each type of government
school, except for a couple of decreases in primary and secondary schools. However, high
schools and higher educational schools have not had any decreases, perhaps signaling to more
enrollment or even more classroom space (to be seen in Objective 2 Enrollment). The total
number of institutions had a high in 2012 but continued to fluctuate after that.
2008 2009 2010 2011 2012 2013 2014 2015 2016 2017 2018
Primary 22335 22398 22608 22760 23073 22892 22717 22044 22044 21180
Secondary 2350 2526 2540 2557 2577 2612 2592 2579 2579 2673
High 1648 1697 1759 1836 1980 2029 2108 2174 2175 2227
Higher Ed. 280 286 300 303 345 361 406 464 464 643
Total 26793 26907 27207 27456 27975 27892 27823 27261 27262 27514
0
5000
10000
15000
20000
25000
30000
Nu
mb
er o
f Sc
ho
ols
Year
Primary Secondary High Higher Ed. Total
Page 46
Afteb 45
Figure 5: Sub-Objective of Education Objective 1b
Number of Teachers by Type of Government School
Figure 5 shows the number of teachers by type. The number of teachers per school type can be
characterized as suitable to the needs of the school, with a couple of fluctuations in primary and
secondary schools. Overall, primary, high and higher education resulted in significantly more
teachers from where they started out from, owing to more educational institutions being built in
KP. Secondary schools overall stayed similar in number thus the number of teachers
corresponded.
2008 2009 2010 2011 2012 2013 2014 2015 2016 2017 2018
Primary 70591708327100371992721057137072110708767087276476
Secondary 15005149911484314622146141408115238152071521915666
High 21380216322196522384240102452926471281862829733259
Higher ed 7388 7114 7903 7951 8545 8766 9561 109961099817222
0
10000
20000
30000
40000
50000
60000
70000
80000
90000
Primary
Secondary
High
Higher ed
Page 47
Afteb 46
Figure 6: Sub-Objective of Education Objective 1c
Number of Total Government Teachers
Figure 6 shows small increases and decreases throughout the time period for the
total number of government teachers. This is normal as the number of institutions featured
changes as well. The most drastic change from one year to the next is from 2016 to 2017, with
almost 20,000 more government teachers being employed. This reflects the data in Figure D and
Figure E, as both show the number of institutions and teachers increasing during this time frame
(major increases were primarily made in high school and higher education).
114364
114569
115714
116949
119274
118754
123380
125265
125386142623
0
20000
40000
60000
80000
100000
120000
140000
160000
2008 2009 2010 2011 2012 2013 2014 2015 2016 2017 2018
Page 48
Afteb 47
Education Objective 2: “Enhancement of enrollment.”
Figure 7: Sub-Objective of Education Objective 2a
Total Government School Enrollment by Type of School
As indicated in figure 7, enrollment in primary and secondary schools featured small increases
and decreases throughout the years, with the final three years (2015-onwards) gaining
increasingly more enrollment. It is the high and higher education schools that featured little to
none decreases and in fact, increased drastically from 2008 to 2017. High schools in 2008 had
535,000 students enrolled and by 2017 almost 814,000. In higher education there were 194,000
students enrolled and by 2017 nearly 315,000. The above data shows that the KP government
spent these ten years adding more high and higher education school, along with staff. Increased
enrollment is a positive result of their efforts.
0
500000
1000000
1500000
2000000
2500000
3000000
3500000
2008 2009 2010 2011 2012 2013 2014 2015 2016 2017 2018
Primary Secondary High Higher ed
Page 49
Afteb 48
Figure 8: Sub-Objectives of Education Objective 2b
Male and Female Enrollment by Type of School
Figure 8 provides two important statistics regarding female enrollment. Firstly, female
enrollment in each institution is about half of the male enrollment in that institution. Secondly,
female enrollment has increased rapidly from 2008 to 2018. KP and most of Pakistan has been
criticized for lack of female education in all forms of institutions. The criticism is correct as there
is an increasing amount of difference between female and male enrollment. However, through
the most recent year, 2017, it seems that female enrollment is catching up to male enrollment in
all types of institutions. Since these figures indicate a positive trajectory throughout the years, I
expect that the next couple of years will feature a larger number of females enrolled.
0
500000
1000000
1500000
2000000
2500000
Nu
mb
er o
f St
ud
ents
Male Year Female
Primary Secondary High Higher ed
Page 50
Afteb 49
Figure 9: Sub-Objective of Education Objective 2c
Total Government Schools Enrollment by Gender
In Figure 9, which is an extension of figure 8 shows, the disparity between male and female
enrollment is more visible. However, as mentioned above, the gap is becoming less over time.
0
500000
1000000
1500000
2000000
2500000
3000000
2008 2009 2010 2011 2012 2013 2014 2015 2016 2017 2018
Male Female
Page 51
Afteb 50
Figure 10: Sub-Objective of Education Objective 2d
Complete Enrollment by Year
Figure 10 shows the second education objective, overall enrollment in government institutions
features mainly increases, with one decrease in 2012. Overall enrollment has gone up to
approximately one million more students in 2017 as compared to 2008. Regarding overall
enrollment KP is making progress, which is understandable considering the increased amount of
schools being built, particularly in higher educational institutions. Female enrollment throughout
was significantly less than that of male but did increase and the gap is closing with the more
recent year.
3588973
3597080
3763796
3871580
3930019
4162465
4174369
4219789
4220812
4558638
0
500000
1000000
1500000
2000000
2500000
3000000
3500000
4000000
4500000
5000000
2008 2009 2010 2011 2012 2013 2014 2015 2016 2017 2018
Page 52
Afteb 51
Education Objective 3: “Infrastructure and Environment”
Figure 11: Sub-Objective of Education Objective 3a
Primary Schools Without Basic Facilities by Year
The most positive aspect about these results is that each year (except for 2013) the number of
schools without the respective basic facilities decreased as indicated in figure 11. With 21,180
primary schools in 2017, 9.6% have no boundary wall, 21.1 % have no drinking water available,
30.2 % have no electricity in classrooms, and 9.9% do not have available bathrooms. These
numbers are still considerably alarming.
2008 2009 2010 2011 2012 2013 2014 2015 2016 2017 2018
Boundary wall 5113 4643 4402 4182 5413 3816 2035
Water 6795 6543 6753 6611 7533 7189 4476
Electricity 10054 9516 9458 9317 10257 9158 6388
Bathrooms 4424 3984 3760 3493 5055 3486 2093
0
2000
4000
6000
8000
10000
12000
To
tal
Page 53
Afteb 52
Figure 12: Sub-Objective of Education Objective 3b
Secondary Schools Without Basic Facilities by Year
Similarly, with secondary schools, there is an overall decrease with the number of schools
without basic facilities, with a few exceptions (2011, 2013 for water and bathrooms, and 2014
for water and electricity). By 2017, out of 2673 secondary schools, 4.26 % do not have a
boundary wall, 15.38 % do not have water, 23 % do not have electricity, and 3.85 % do not have
bathrooms. Understandably, there are more primary schools than secondary, but secondary
schools have far better results than the former regarding improved conditions.
2008 2009 2010 2011 2012 2013 2014 2015 2016 2017 2018
Boundary wall 624 544 545 463 426 424 114
Water 666 645 678 668 688 717 411
Electricity 829 765 792 790 780 806 615
Bathrooms 377 336 345 318 327 308 103
0
100
200
300
400
500
600
700
800
900T
ota
l
Page 54
Afteb 53
Figure 13: Sub- Objective of Education Objective 3c
High Schools Without Basic Facilities by Year
For boundary wall and bathrooms, there has been relative improvement from the starting to the
end point. By 2017, out of 2227 high schools, 2.20 % do not have a boundary wall, 6.26 % do
not have water, 7.09 % do not have electricity, and 1.39 % do not have bathrooms. KP struggles
to improve on water and electricity at the same rate for high schools as there are a lot of ups and
downs in the data. However, overall the most recent number for all categories is far less than the
starting point.
2008 2009 2010 2011 2012 2013 2014 2015 2016 2017 2018
Boundary wall 309 271 277 238 208 210 49
Water 224 221 254 252 253 279 138
Electricity 223 222 227 219 231 233 158
Bathrooms 162 127 115 121 109 100 31
0
50
100
150
200
250
300
350T
ota
l
Boundary wall Water Electricity Bathrooms
Page 55
Afteb 54
Figure 14: Sub-Objective of Education Objective 3d
Higher Ed. Schools Without Basic Facilities by Year
Similarly for higher education, boundary walls and bathrooms made more substantial
improvement as compared to water and electricity. By 2017, out of 643 higher ed. schools,
0.78 % do not have a boundary wall, 3.42 % do not have water, 3.27 % do not have electricity,
and 0.31 % do not have bathrooms. All but, electricity improved by 2017.
2008 2009 2010 2011 2012 2013 2014 2015 2016 2017 2018
Boundary wall 33 24 21 21 20 23 5
Water 27 23 25 23 29 34 22
Electricity 17 15 17 14 13 16 21
Bathrooms 13 11 10 9 12 6 2
0
5
10
15
20
25
30
35
40
To
tal
Boundary wall Water Electricity Bathrooms
Page 56
Afteb 55
Education Data Set 2: Objectives Met?
Table 3
Education Objectives and Sub-Objectives
Education Objectives Sub-Objectives
1) “Improving Quality.” 1a) Government institutions by school type
1b) Government teachers in by school type
1c) Total number of teachers by year
2) “Enhancement of enrollment.” 2a) Government school enrollment by school type
2b) Male and female enrollment by school type
2c) Total government school enrollment by gender
2d) Complete enrollment by year
3) “Infrastructure and
Environment
3a) Primary schools without basic facilities
3b) Secondary schools without basic facilities
3c) High schools without basic facilities
3d) Higher ed. schools without basic facilities
*KEY: Bolded objectives mean the objective was met over the ten-year period.
Objective 1 was met for all the years as the number of government schools by type of school
increased or decreased based on teacher increases and decreases. Furthermore, the increases in
high school and higher education institutions along with more teachers in those institutions
indicate that KP is investing in higher education, not just basic education. Objective 2 was more
difficult to accommodate for as there was low female enrollment as compared to male enrollment
in all the years. However, overall enrollment in government institutions, especially in high
school and higher education increased each year. Thus, only the years 2008 and 2014 were when
the objective was not met because the gap between male and female was the most or decreased
from the year before. Objective 3 was met for all the schools except for higher education schools
because the most recent statistic did not indicate improvement.
Page 57
Afteb 56
Education Data Set 3: Education Budget
Figure 15: Education Budget by Year
*The yearly education budgets were obtained from the KP Finance Department online
(http://www.finance.gkp.pk), from the Annual Budget Reports.
Education budget increases are far more prominent as compared to health budget increased.
especially for the years 2014 and 2015, in which the budget nearly tripled from 2013. These
increases are responsible for the increase in staff and enrollment of students particularly for high
and higher education (objectives 1 and 2). From the limited objective 3 data it seems the budget
focused on improving environmental conditions but could not do so completely (based on
primary and secondary schools’ objective 3 data).
More objective years were met for education as compared to health. This is also due to
more budget allocation for education on average. Budgets featured near doubles and resulted in
enrollment and school environment to increase drastically. The structure of the education system
leads to more power for the district which has led to increased involvement. KP has improved
on decentralized services of health and education, but the results of education are more notable,
as are the number of statistics.
4,8119,37411,778
15,13620,510
31,202
101,508108,666
43,81348,000
43,000
0
20,000
40,000
60,000
80,000
100,000
120,000
2008 2009 2010 2011 2012 2013 2014 2015 2016 2017 2018
PK
R M
illi
on
Year
Page 58
Afteb 57
Conclusion
My goal for this study was to provide a historical and statistical analysis for how
decentralized services have affected KP Pakistan during 2008 to 2018. My own experiences
during a course of two years led me to explore decentralization as a mechanism that is flawed but
has many advantages for Khyber Pakhtunkhwa which has been at a disadvantage when it comes
to border security and terrorism. These issues decreased the region’s ability to be economically
secure and provide public services. Decentralization was started by previous government regimes
but never reached its full potential as the purpose was to legitimize military law. It was only the
Devolution Plan in which decentralized services became a part of Pakistan. Although the
effectiveness of decentralization of public services has been debated in the literature, I have
found that decentralized services are in fact helpful to a conflict-ridden region such as KP.
Through mixed methods I have tried to achieve the following: 1) the historical process
tracing of decentralization combined with the sociopolitical factors explain the obstacles in KP
regarding the provision of public services, especially when decentralization was implemented. It
was concluded that the factor of Afghan refugees did put KP at a disadvantage because the
economy and the region was insufficient in providing for its constituents. Until there was foreign
aid, centralized services worked for the region as it relied on the madrassas and refugee camps to
provide for the refugees without economically harming the rest of the region. But without aid,
the region’s turn to decentralized services was also tough because accommodating for such a
large population is difficult. Here comes the second factor of religious violence, which partly
came from the Islamization of Pakistan and due to Afghan refugees with the involvement against
the Soviet Union. Under a state of religious violence and an uncontrolled number of refugees,
public services suffered in Pakistan. However, as reflected in the quantitative data, KP has been
Page 59
Afteb 58
overcoming these sociopolitical factors. Afghan refugees have either decreased in quantity by
returning to Afghanistan or have become citizens and a part of the region’s system through
programs implemented by the UNHCR and KP Government in recent years. Although religious
violence caused increased backlash over Afghan refugees, the recent government’s rhetoric is in
support of refugees by granting them citizenship, as religious violence has overall decreased in
KP due to the counter-terrorism efforts in the region. These obstacles against decentralization
have started to subside, letting decentralized services become more beneficial for KP.
The statistical data obtained from the KP Government shows that KP has improved the
services of health and education, which have often been neglected in scholarly research. For
health services, all these objectives were met except for the sub-objective of vaccinations.
Hospital environment and treatment improved as number of beds, doctors, malaria cases treated
etc., went up till 2018. However, the rate of vaccinations decreased through the several vaccine
series, citing less outreach and responsibility by the districts in charge. Turning to education, all
objectives were met except for infrastructure for higher education schools. Enrollment, number
of institutions, environment in schools etc. was shown to have increased during the ten years.
However, KP still does need to work on meeting the basic necessities of schools such as
electricity and water. The increases in budget for the most part is justified and used to improve
conditions in health and education. Although there is a lack of more comprehensive data that is
available in other nations, these statistics themselves provide a glimpse of an improved provision
of health and education services under a decentralized structure.
The data also brings up the issue of causality and correlation. It is not to say that the
improvement of these services is only because of decentralization but rather a multitude of
factors such as the political situation of Pakistan, the fiscal policy at the given time frame, federal
Page 60
Afteb 59
regulations implemented etc. However, with the overall positive results obtained for health and
education one can say that decentralization is most definitely one of the factors that has
improved health and education for KP Pakistan. KP still has several shortcomings, including
improving vaccination retention rates and school environmental conditions, but for the most part
has succeeded in improving the services. I believe that that this study has been able to contribute
to the scholarship on decentralized services in a nation on a path to become democratic.
Turning to what comes next for decentralized public services, recently, the new
administration has launched several programs related to poverty, health insurance, and the
building of stronger educational institutions. All these programs are being launched within a
decentralized framework. In the next couple of years, there needs to be more research on the
importance of decentralized services in a struggling democratic Pakistan. My study has shown
that decentralization of public services has improved health and education in KP—the next step
is to see the impact of these new programs on Pakistan. Moreover, there has been some
controversy in the nation regarding decentralized government and some challenges to the
passage of funding for provincial governments. In the political climate that Pakistan is in, it will
be interesting to see how further studies will characterize decentralization in the upcoming years.
However, this study has found that decentralization is an important asset for a developing
democratic Pakistan. This can also be applied to other emerging democracies that are struggling
with the provision of services. Utilizing the case study of Khyber Pakhtunkhwa, Pakistan speaks
to the importance of the need of strong democratic institutions in struggling and developed
democracies.
Page 61
Afteb 60
Bibliography
Ahmad, Z., Khalid, I., & Muzaffar, M. (2015). An Analysis of the Relationship Between Local
and Provincial Governments in Pakistan (2001-2009). Journal of Political Studies, 22(1), 63–74.
Asim, F., & Bilal, M. (2017). Peshawar School Massacre, Pakistan: A Qualitative Account of
Citizens’ Perception. Journal of Political Studies, 24(2), 365–379.
Aslam, G., & Yilmaz, S. (2011). Impact of Decentralization Reforms in Pakistan on Service
Delivery-An Empirical Study. Public Administration & Development, 31(3), 159–171.
Asunka, J., & Afulani, P. A. (2018). Politics and Public Service Provision in Africa’s New
Democracies. International Journal of Politics, Culture & Society, 31(3), 207-227.
Baban'umma, MB 2010, 'DEMOCRATIC GOVERNANCE AND DELIVERY OF SOCIAL
SERVICES IN NIGERIA: A CASE OF WATER AND SANITATION', Trakia Journal of
Sciences, vol. 8, no. 3, pp. 70-76.
Bauer, C. (2009). Public participation and the lack of service delivery before and after the 2006
local government elections in the Free State. Politeia (02568845), 28(1), 28-45.
Dauti, M. (2014). Can participatory governance enhance public services in a transitional
democracy? Lessons from Albania. Social Development Issues: Alternative Approaches to
Global Human Needs, 36(2), 65–77.
Page 62
Afteb 61
Deacon, R. T., & Saha, S. (2006). Public good provision by dictatorship: a survey. In A. F. Ott,
& R. J. Cebula (Eds.), The companion in public economics: empirical public economics.
Cheltenham: Edward Elgar.
Edgette, A. V. (2010). A Mecca for Militants An Examination of the Development of
International Terrorism in Peshawar, Pakistan, 1970-2010. Hinckley Journal of Politics, 11, 15–
24.
Hasnain, Z. (2010). Devolution, Accountability, and Service Delivery in Pakistan. The Pakistan
Development Review, Vol. 49, No. 2 (Summer 2010), pp. 129-152. Pakistan Institute of
Development Economics, Islamabad.
Hassen, E.-K. (2003). The Power behind the Desk: Democracy, Collective Bargaining and the
Public Service in South Africa. In G. Mhone & O. Edigheji (Eds.), Governance in the new South
Africa: The challenge of globalisation (pp. 114–143). Lansdowne.
Hendriks, B. (2010). City-wide governance networks in Nairobi: Towards contributions to
political rights, influence and service delivery for poor and middle-class citizens? Habitat
International, 34(1), 59–77.
Karuri-Sebina, G., Hemson, D., & Carter, J. (2010). Putting people first versus embedding
autonomy: Responsiveness of the democratic developmental state to effective demand side
governance in South Africa's service delivery. Systemic Practice And Action Research, 23(1),
87-100.
Page 63
Afteb 62
Khan, I. A., & Ghalib, A. K. (2012). Absence of Vertical Linkages and the Quest for
Decentralized Service Delivery in Pakistan: An Innovation under Constraints. International
Journal of Public Administration, 35(7), 482–49.
Khan, A. M., & Mirza, M. S. (2011). Implementation of Decentralization in Education in
Pakistan: Framework, Status and the Way forward. Journal of Research and Reflections in
Education, 5(2), 146 -169.
Keefer, P., & Khemani, S. (2005). Democracy, Public Expenditures, and the Poor:
Understanding Political Incentives for Providing Public Services. World Bank Research
Observer, 20(1), 1–27.
Khan, S. A. (2015). Devolution Plan 2000: dictatorship, democracy, and the politics of
institutional change in Pakistan. Development in Practice, 25(4), 574–586.
Khattak, S. G. (2003). IN/SECURITY Afghan Refugees and Politics in Pakistan. Critical Asian
Studies, 35(2), 195.
Kumar, S. & Bano, S. (2017). Comparison and Analysis of Health Care Delivery Systems:
Pakistan versus Bangladesh. Journal of Hospital & Medical Management. 3(1).
LAKE, D. A., & BAUM, M. A. (2001). The Invisible Hand of Democracy: Political Control and
the Provision of Public Services. Comparative Political Studies, 34(6), 587–621.
Page 64
Afteb 63
Przeworski, A., Alvarez, M., Cheibub, J., & Limongi, F. (2000). Democracy and Development:
Political Institutions and Well-Being in the World, 1950–1990 (Cambridge Studies in the Theory
of Democracy). Cambridge: Cambridge University Press.
Malik, A. A., Mohr, E., & Irvin-Erickson, Y. (2017). Can refugees provide the impetus for urban
regeneration? Economic integration, social networks and well-being in Peshawar, Pakistan.
Journal of Urban Regeneration & Renewal, 11(1), 30–43.
Mccourt, W. (2012). Can Top-Down and Bottom-Up be Reconciled? Electoral Competition and
Service Delivery in Malaysia. World Development, 40(11), 2329-2341.
Min, B. (2008). Who Gets Public Goods? Democracy and the Provision of Electrification in the
Developing World. Department of Political Science. University of California, Los Angeles.
Mintrom, M. (2003). MARKET ORGANIZATIONS AND DELIBERATIVE DEMOCRACY:
Choice and Voice in Public Service Delivery. Administration & Society, 35(1), 52.
Musekiwa, N., & Chatiza, K. (2015). Rise in resident associational life in response to service
delivery decline by urban councils in Zimbabwe. Commonwealth Journal of Local Governance,
(16/17), 123–139.
POPESCU, L. G. (2016). Responsiveness Governance and Convergence of Agendas. Journal of
Public Administration, Finance & Law, (8), 67–83.
Page 65
Afteb 64
Reddy, P. S. (2010). Democratic decentralisation and local democracy in South Africa re-
examined: quo vadis? Politeia (02568845), 29(3), 66–87.
Salman, A. (2009). Decentralization in Pakistan - Lessons and Challenges. University of
Albany.
Sances, M. W. (2018). Something for Something: How and Why Direct Democracy Impacts
Service Quality. Quarterly Journal of Political Science, 13(1), 29–57.
Saud, A., & Khan, K. A. (2016). Decentralization and Local Government Structures: Key to
Strengthening Democracy in Pakistan. Journal Of Political Studies, 23(2), 397-412.
SCHETTER, C. (2013). The Durand Line The Afghan-Pakistani Border Region between
Pashtunistan, Tribalistan and Talibanistan. Internationales Asienforum, 44(1/2), 47–70.
Pakistan
Shah, D. (2003). Country Report on Decentralization in the Education System of Pakistan:
Policies and Strategies. Academy of Educational Planning and Management Ministry of
Education, Government of Pakistan, Islamabad.
Siddiqui, N., Nellis, G. (2018). Secular Party Rule and Religious Violence in Pakistan. American
Political Science Review, 112(1), 49–67.
Page 66
Afteb 65
The Local Government System in Pakistan. (2018). Commonwealth Local Government Forum.
PDF.
Thompson, L., Tapscott, C., & Wet, P. T. D. (2018). An Exploration of the Concept of
Community and Its Impact on Participatory Governance Policy and Service Delivery in Poor
Areas of Cape Town, South Africa. Politikon: South African Journal of Political Studies, 45(2),
276–290.
Watson, D., & Khan, A. Q. (2010). Capacity development for education service delivery in
Pakistan: Top-down devolution. Public Administration & Development, 30(1), 11-26.