\ \ \ Dechlorination of PCBs in Sediments of New Bedford Harbor James L. Lake, Richard J. Pruell, and Frank A. Osterman U.S. Environmental Protection Agency Environmental Research Laboratory-Narragansett South Ferry Road Narragansett, RI 02882 August 30, 1989 64499 SDMS DocID
Transcript
\ \
\
Dechlorination of PCBs in Sediments of New Bedford Harbor
James L. Lake, Richard J. Pruell, and Frank A. Osterman
U.S. Environmental Protection Agency Environmental Research Laboratory-Narragansett
South Ferry Road Narragansett, RI 02882
August 30, 1989
64499 SDMS DocID
Abstract
The distributions of PCBs in New Bedford Harbor Superfund
Site (NBHSS) sediments showed considerable compositional
alterations relative to (1) inputs of Aroclor 1242 and 1254
standards, and (2) distributions present in sediments from lower
New Bedford Harbor and Black Rock Harbor, CT. The compositional
alterations, which presumably result from reductive
dechlorinations by bacteria, became more extensive with
decreasing distance from the Aerovox Plant (which is suspected as
the source), and increasing sediment PCB concentrations. The
most extensively altered PCB distribution was found in the 6 to 7
inch deep section of a core from nearest the plant's outfall, and
less altered PCB residues were found in the upper (0-1 and 2-3
inch) core sections. The dechlorinating bacteria appear to
preferentially attack the potentially toxic coplanar and mono
ortho substituted congeners and, therefore, these processes may
decrease the potential toxicity of these residues. Estimates of
the rates of the dechlorination processes showed considerable
variability depending on the congener and the sediment sample.
Introduction
The breakdown of PCB congeners in situ in sediments heavily
contaminated with PCBs by processes called reductive
dechlorinerticns have been reported (Brown et al., 1984; Brown et
al., 1987(a); Brown et al., 1987(b)). These studies
characterized several distinct dechlorination patterns, caused by
different strains of anaerobic bacteria, which resulted in PCB
residues that were altered from the original Aroclor inputs. In
the area designated as the New Bedford Harbor Superfund site
(NBHSS) which was heavily contaminated by Aroclor 1254 (used from
1947-1963) and Aroclor 1242 (used from 1963-1970) releases from a
capacitor plant, the dechlorination patterns have been
designated H and H' (Brown and Wagner, 1986). The alterations in
PCB residues which occur as a result of pattern H and H'
dechlorinations in 2-3 inch and 6-7 inch sections of cores taken
in the Northern part of the NBHSS near the plant outfall have
been documented (Brown and Wagner, 1.986). However, sediment core
sections taken in the Southern part of the NBHSS as part of an
experimental dredging project and analyzed by ERL-Narragansett
showed no clear evidence of dechlorinations in 0-6, 6-12 and 12
18 inch core sections. The present study was undertaken to
determine the extent to which dechlorination processes were
occurring in the NBHSS so knowledge of those processes could be
incorporated into evaluations of proposed remediation of the
site.
Methods
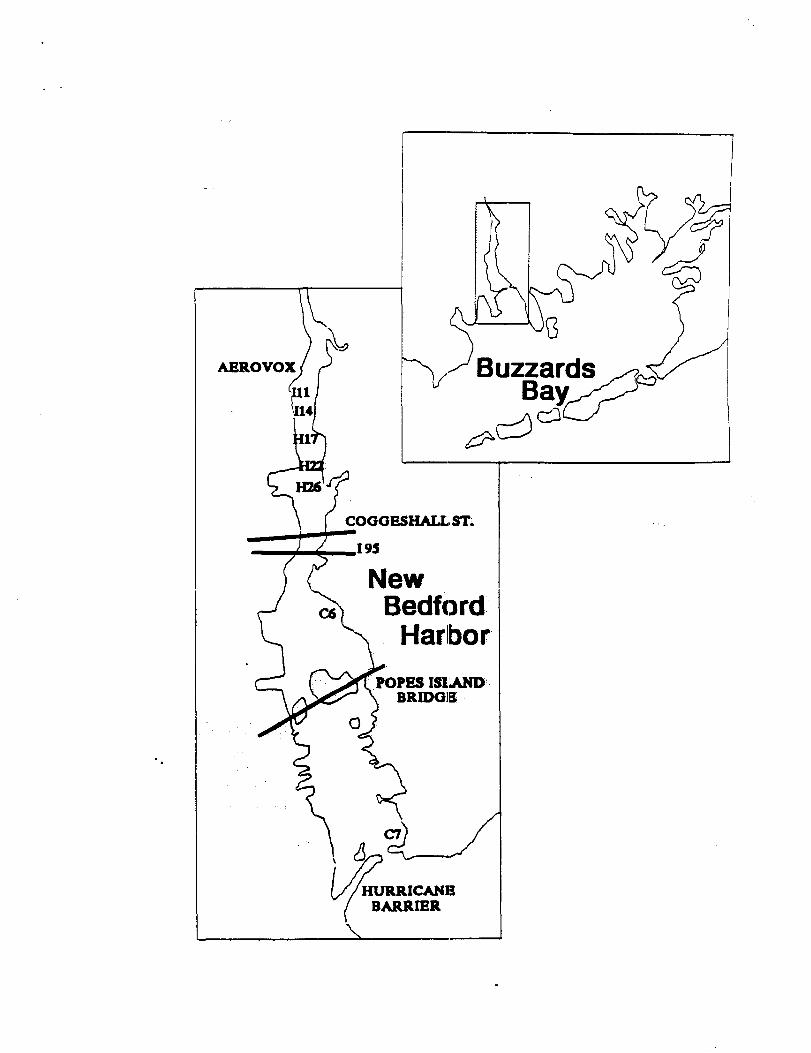
Sediment cores were collected by piston corer in the New
Bedford Harbor Superfund Site (NBHSS) and Lower New Bedford
Harbor (LNBH) during the period July 5-7, 1988, at the locations
shown (Figure 1, Table 1). Cores were capped and placed inside
sealed plastic bags. The cores were stored in water ice shortly
after collection and during the transport to the ERLN (EPA-
Narragansett) and then frozen (-20°C) at ERLN. From collection
to the time they were frozen, cores were held vertically to avoid
mixing of sediment layers. Samples of core sections were taken
from frozen cores using a power drill and a one-inch diameter
hole saw to cut a plug from the cores at the desired depths. The
hole saw used for sampling was washed in a soap and water
solution followed by washing in acetone between cuttings to avoid
cross contamination of samples. The depths of sediment sections
were taken in inches to facilitate comparison with other work
(Brown and Wagner, 1986). Core sections were taken at 0-1, 2-3,
6-7, 12-13, 18-19, and 24-25 inches, but in shorter cores only
the top sections could be sampled. The core section samples were
extruded into precleaned glass jars, capped and stored at -20°C
until analysis.
The sediment sample from Black Rock Harbor, CT, was part of
a large collection of sediment dredged from the Harbor and used
in the joint EPA Corps of Engineers Field Verification Project
(Lake et al., 1985).
Analytical Methods
Core sections were thawed, mixed thoroughly with a stainless
steel spatula and a weighed aliquot was dried in a dessicator to
constant weight to determine sediment water content. A one gram
aliquot of the wet sediment was extracted with five ml of acetone
for 30 seconds using an Ultrasonic Probe (Model W-370) Heat
Systems - Ultrasonics Inc. The sample was centrifuged to
separate the phases and the acetone extract was saved. The
extraction was repeated, and the extracts combined. Five ml of
deionized water were added to the combined acetone extracts along
with one ml of heptane. The sample extract was shaken for 30
seconds and centrifuged to separate the layers. The heptane
extract was removed and reacted with 1 ml concentrated H-SO,.
The heptane layer was removed and reacted with reduced copper
powder to remove elemental sulfur and then analyzed for PCBs.
Sediment extracts were analyzed for PCBs on a Hewlett-
Packard 5890A gas chromatograph equipped with a splitless
injection port, electron capture detector and a 60 meter fused
silica column coated with a 0.25 micron coating of DB-5 (J+W
Scientific, Inc.). The injector temperature was 270°C and the
detector temperature was maintained at 315°C. The column was
held at 150°C for one minute following injection then programmed
to 290°C at l°C/minute and held at 290°C for five minutes. The
output from the detector was collected on a Perkin Elmer LIMS
Mention of product names does not constitute endorsement by the U.S. EPA.
3210 computer.
Due to the high concentrations of extracts, they were
diluted prior to GC analysis with measured amounts of heptane
containing octachloronaphthalene (OCN). The OCN served as an
internal injection standard for peak identification.
The congeners comprising a peak were identified by
injections of individual congener standards. For peaks for which
standards were not available, identifications were based on
literature values (Brown and Wagner, 1986; Schultz et al., 1989).
Selected peaks were eliminated from analysis because their
distorted peak shape (due to coelution of numerous congeners)
resulted in ambiguities in their identification and
quantitation. Other peaks which are only very minor constituents
of A-1242 and A-1254 also were eliminated from analysis. The
peaks utilized in this study, the corresponding congeners, and
the method of identification are shown (Table 2).
Quantitation of concentrations was done using external
standards of A-1242 and A-1254. Spike and recovery tests of the
procedure showed an average recovery of 106.3% (S.D. 23.7%) for
individual peaks present in a mixture of Aroclor standards.
Results were not corrected for recovery efficiencies. Blanks
were processed with sample sets and showed no contamination which
interfered with analysis of FCBs examined.
A computer program was developed to calculate the
percentages of A-1242 and A-1254 content of samples from this
study. This program used peak P039B as representative of A-1242
and peak P061 as representative of A--1254. These peaks were
selected as representative of the Aroclor mixtures because they
were found to be the most resistant to changes as a result of
dechlorinations in this, and another study (Brown and Wagner,
1986). Since these peaks are both present in A-1242 and A-1254
the computer program does a series of. successive approximations
and corrections to determine the concentrations and percentage
mixture of Aroclors in the residue. These data were used with
relative concentration data from A-1242 and A-1254 standards to
reconstruct the original composition of the PCB mixtures which
contaminated a specific sediment sample. The heights of peaks
calculated to be in these original mixtures are called predicted
values and are compared with measured values obtained from
analyses of extracts from sediment samples. Comparative
abundance plots (CAPs) are used to show the measured abundances
(the abundance of congener X extracted from a sediment) relative
to the predicted abundance (the abundance of a congener X in the
mixtures which contaminated a specific sediment) and thereby show
changes in PCB residues which have occurred since impact.
Results and Discussion
The results of sediment analysis showed that PCB
concentrations increased from South to North in the New Bedford
Harbor Superfund Site (NBHSS), and the highest concentrations
were found nearest the Aerovox capacitor plant (Figure 1, Table
3). In surface core sections (0-1") within the superfund site
(SS) PCB concentrations as total of A-1242 and A-1254 ranged from
102 ppm to 912 ppm. Surface sections of cores C6 and C7 from
lower New Bedford Harbor (LNBH) had lower concentrations, 2.1 and
9.4 ppra, respectively. The sediment sample from Black Rock
Harbor, CT, contained 21.4 ppm PCBs.
Concentrations in cores from the SS generally increased with
depth to the 6-7 inch section then decreased rapidly in lower
core sections. The highest concentration (2,970 ppm) was found
in the 6-7 inch section of Core 111. Core C7 from LNBH showed
about the same PCB concentration (9.4-7.4 ppm) in sections from
0-1 to 12-13 inches. Core C6 and Core H26 contained only trace
amounts (< 0.2 ppm) of PCB in sections deeper than 0-1 inches
(C6) and 2-3 inches (H26).
In some cores from the SS the percentage composition of A
1242 and A-1254 changed with depth. Cores 111 and H22 showed a
relative increase in the percentage of A-1254 at the 6-7 inch
section. Core 114 showed a similar change at the 12-13 inch
section, but Core H17 showed little change in the percentage
Aroclor composition with depth. A small relative increase in the
A-1254 composition was observed in the 2-3 inch section of core
H26. The increases in percentage composition of A-1254 observed
in lower core sections may reflect the history of inputs of
Aroclor mixtures to the SS. Prior to 1963, the inputs are
believed to be predominantly A-1254, from 1963 to 1970 A-1242 was
used and from 1970 to 1979, A-1016 was used (Plant Records,
1985). The fact that Aroclor mixtures change differently from
8
core to core and the presence of A-1242 and A-1254 at all depths
probably result from differences in depositional rates and/or
percolation of PCB mixtures into the sediments. These results
indicate that a historical record of PCB inputs to the SS is not
well preserved in some cores and underscores the difficulty in
attempting to estimate rates of processes based on sedimentation
rates. Core C7 shows a percentage composition of A-1242 and A
1254 which is lower in A-1242 and higher in A-1254 than found in
the SS cores. The percentage composition of this core is about
38% A-1242:65% A-1254 for the top sections, but changes to 51% A
1242:49% A-1254 at the 12-13 inch section. This NBH core is
located just inside the Hurricane Barrier and may have received
inputs from sources other than the one that contaminated the SS.
Substantial changes in the relative distributions of PCB
congeners which appear to be due to reductive dechlorinations
were found in many samples from the SS, but samples from LNBH and
BRH showed only small alterations. Comparisons of the relative
distributions of PCBs were made using chromatograms of extracts
and using comparisons of the abundances of congeners in a sample
with those present in the original mix of Aroclor which were
input to the particular sediment sample. The comparative
abundance plots (CAPs) are particularly useful, because they
readily show which peaks are changing relative to the original
inputs and are therefore useful to identify peaks which changed
as a result of environmental processes. CAPs for a mixture of
A-1242 and A-1254 (53:47) standards for core sections H2267, and
11167 and for the BRH sediment are shown (Figure 2). CAPs for
the mixture of Aroclor standards showed only small changes
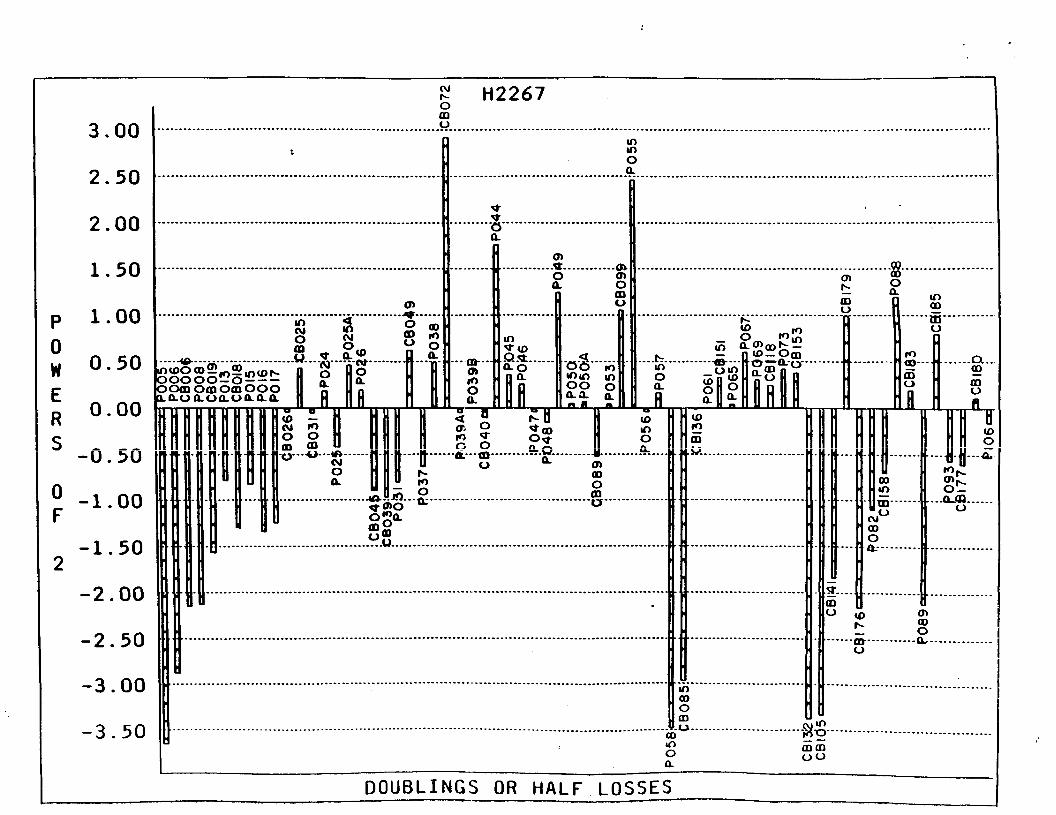
between the predicted and measured abundances. For the H2267
core section the bars to the left showed measured abundances
which were below predicted values (less than zero) (Figure 2).
These bars represent peaks containing congeners which are of
relatively low molecular weight and are more volatile and more
soluble than most of the other PCBs present. The decreased
abundance of these congeners probably result from evaporative
and/or dissolution losses of these congeners prior to
incorporation into consolidated sediment. At higher molecular
weights, peaks CB072, P044, P055, CB179 and P088 show measured
values which are two or more times greater than the predicted
values. These peaks also increase in the sample from BRH and
therefore may not be indicative of dechlorination processes.
Notable decreases in the relative abundances of peaks P058,
CB085, CB132 and CB105 are shown in the CAP for H2267, but
similar decreases in the relative abundance of these peaks in the
CAPs for BRH or for core C7 from Lower NBH were not observed. In
the most highly dechlorinated samples 11167 (Figure 2c), the
above peaks as well as other peaks (e.g., CB031, P045, P046,
P047, P048, P053, CB099, CB153 and CB118) showed considerable
decreases, while others (e.g., CB026, CB025) showed increases in
relative abundance.
The general changes observed as a result of the
dechlorinations include a decrease in concentration of selected
10
higher molecular weight (MW) congeners and an increase in the
abundance of selected lower MW PCBs. Another change as a result
of dechlorinations of PCBs in sediments from the SS is the
degradation of mono ortho substituted congeners. Mono-ortho
substituted congeners and coplanar (non-ortho) congeners induce
mixed function oxidase enzyme systems and are considered toxic
(Kannan et al., 1988). Examinations of dechlorinations of
coplanar compounds (which are considered more toxic than mono
ortho substituted compounds) are underway. Preliminary results
indicate that coplanar congeners are also broken down as a result
of dechlorinations in the NBHSS. Changes in the PCB mixtures as
a result of dechlorinations in the SS will result in a PCB
residue which is lower in molecular weight (and therefore less
persistent in the environment) and less toxic as measured by
capability to induce MFO enzyme systems. It is emphasized,
however, that a large quantity of partially dechlorinated PCBs
remain in the sediments of the NBHSS and the toxicity of the
remaining mixtures is not known.
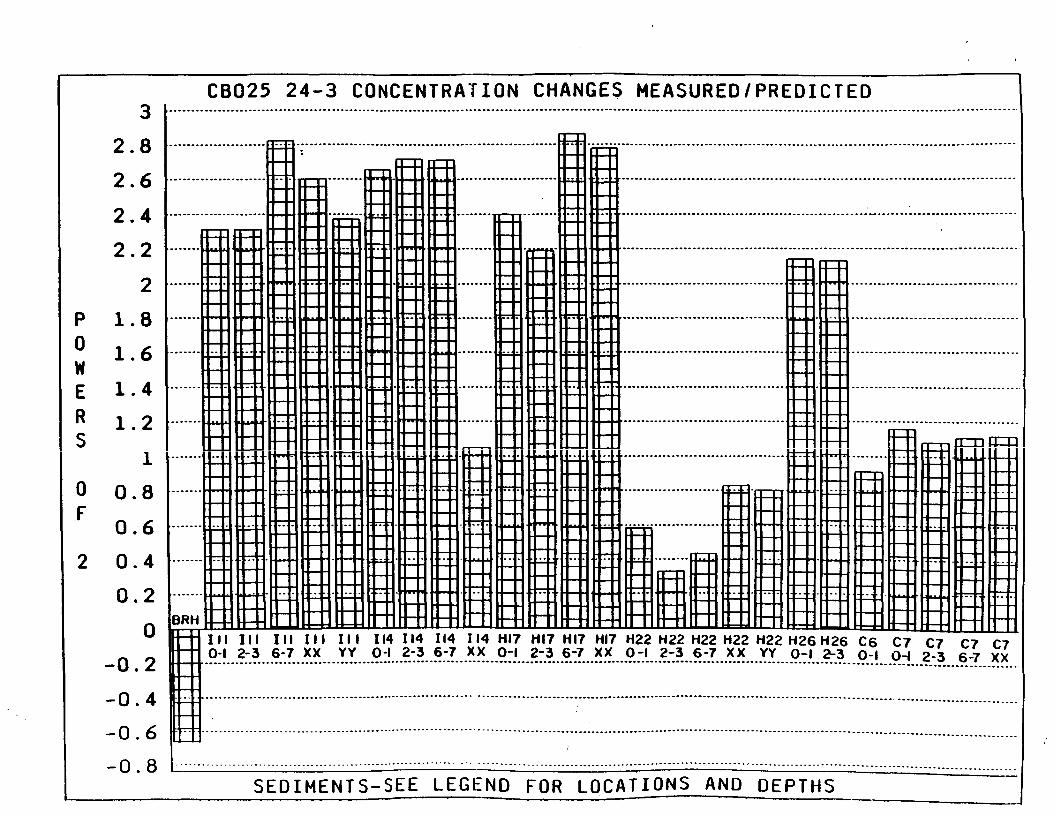
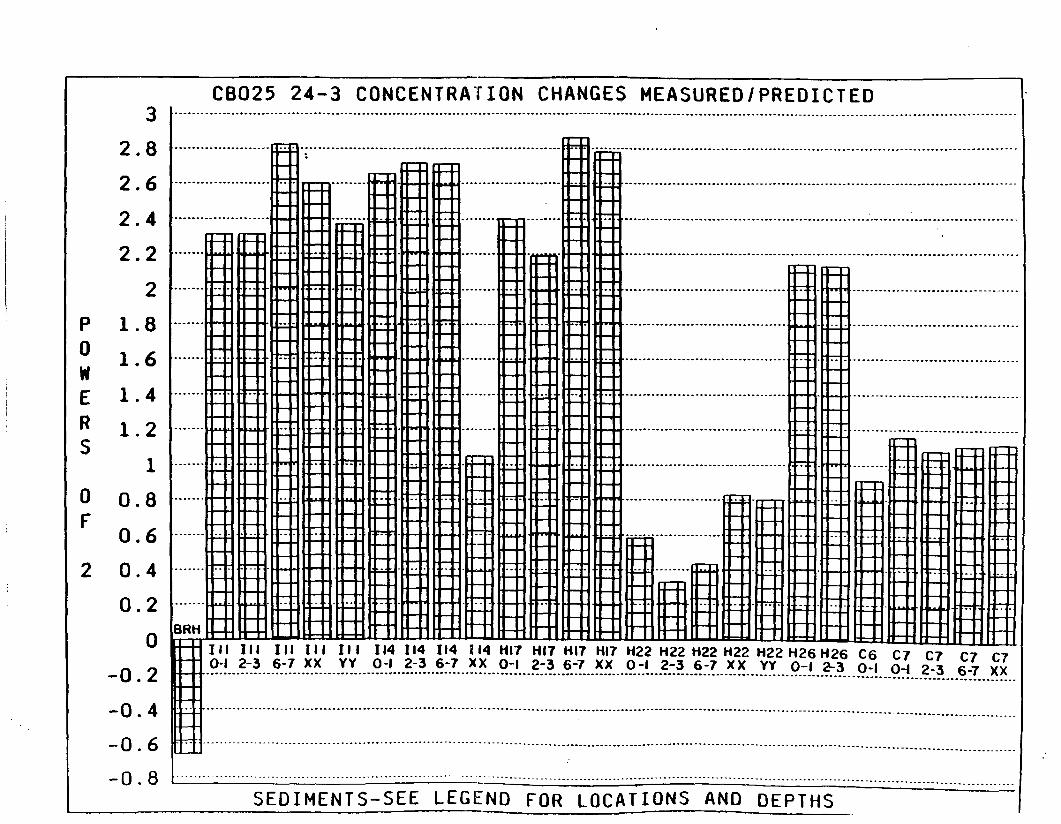
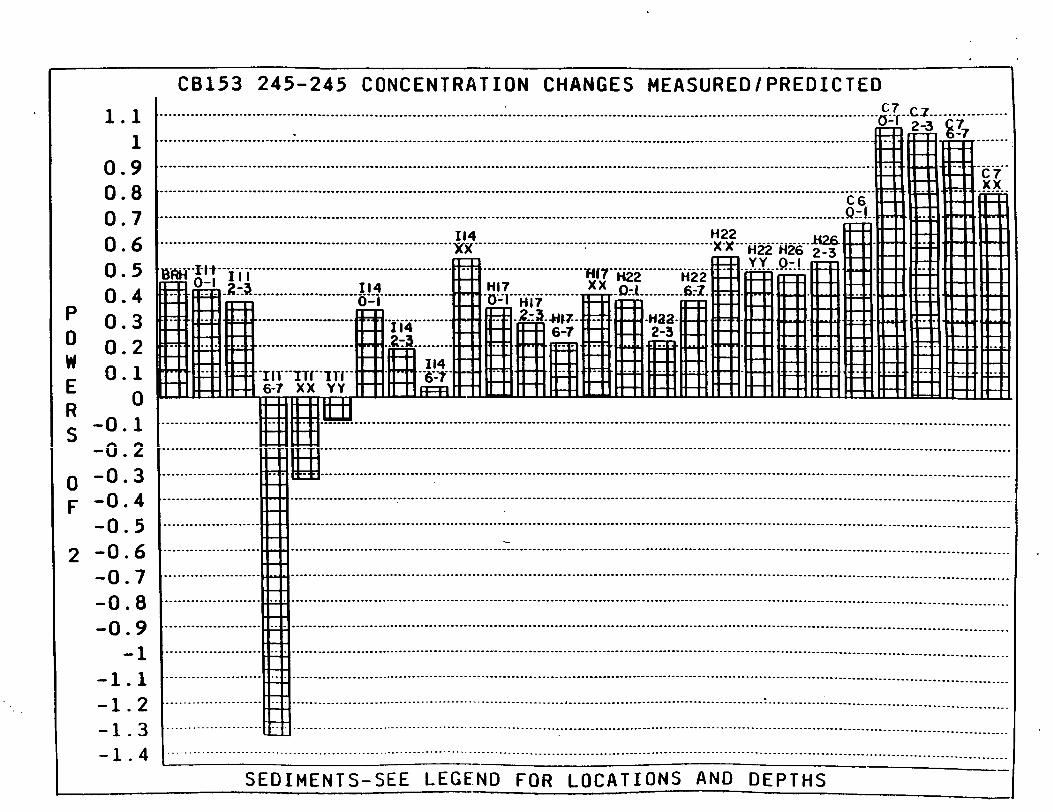
Plots of the relative abundance of peaks CB025 (structure
24-3), CB105 (structure 34-234), CB118 (structure 34-245), and
CB153 (structure 245-245) demonstrate the variability in
dechlorination between locations, core sections and congeners
(Figure 3a-d). These figures show the magnitude of increase or
decrease in abundance of a peak measured in a sample relative to
the predicted abundance of that peak in the mixture of A-1242 and
A-1254 standards calculated as input for the sample.
11
The plot of the relative abundance of CB025 shows a decrease
in the BRH sample, but increases of varying magnitude are
observed in samples from the SS and lower NBH. The congener
which comprises this peak (CB025) is a minor component of A-1242
and A-1254 and its increase in samples has been reported as
indicative of a reductive dechlorination process (Brown et al.,
1987b). Most of the samples from the SS show a factor of 4 or
more increase in relative abundance of this congener. Core
section 114 12-13 and all sections of core H22 show relative
increases which are similar to those observed for lower NBH cores
C6 and C7. Increases in relative abundance from the 0-1 and 2-3
inch sections to the 6-7 and 12-13 inch sections are found in
cores 111, and H17, but differences are not pronounced within
cores except for the 114 12-13 inch section. The lower relative
abundances of CB025 in 114 12-13 and the H22 core may reflect
conditions which are unfavorable to dechlorination or retard
dechlorination rates. The increases in relative abundance
observed in C6 and C7 cores may demonstrate the initiation of
dechlorination in these samples or may reflect down bay transport
and deposition of partially dechlorinated residues.
Plots of the relative abundance of peak CB105 shows only
small changes for BRH, H22 2-3 and ceres C6 and C7, however,
samples from the SS show considerable decreases in abundance of
this congener. Lowered relative abundance of CB105 also has been
found to be indicative of dechlorination in sediments from the
Hudson River (Brown et al., 1984). For cores 111, H17 and H22
12
considerable decreases in relative abundance of CB105 are
observed between the top (0-1 and 2-3 inch) and lower (6-7, 12
13, 18-19) core sections. These findings show residues are more
dechlorinated near the plant and at depth in core sections than
in surface sections in lower NBH.
Plots of the relative abundance of CB118 showed BRH, H22,
H26 and lower NBH (C6 and C7) samples had small increases, but
other SS samples, except for 114 12-13, showed decreases. In the
SS the greatest decreases are found in the 6-7 inch sections with
upper core sections (0-1 and 2-3 inch sections) showing smaller
losses. Core section 111 6-7 shows the greatest loss.
A relative abundance plot of CB153 shows an increase in this
congener in all samples except for 11167, 11112-13 and 11118-19
(Figure 3d). The greatest relative decrease is observed for
11167.
Comparison of the relative abundance plots for these four
compounds between the sediment samples shows that the
dechlorination processes are not proceeding at equal rates or to
equal extents. It appears from these data that the
dechlorinations (which are presumably anaerobic microbial
processes) may be a stepped series of dechlorinations with each
change in step occurring when the concentration of substrate
falls below a suitable level. For example, all sections of core
111 show considerable decreases in relative abundance of CB105,
but the decreases are much smaller for the 0-1 and 2-3 inch
sections for CB118. For CB153 only core section 6-7 shows large
13
decreases in relative abundance, it appears that the
dechlorinating organisms may have depleted the CB105 in section
6-7 then switched to CB118 and then to CB153. The
dechlorinations in other samples are less advanced in the
stepwise process. An alternative explanation for this switching
is that different bacteria are responsible for the
dechlorinations. In this hypothesis, as a substrate (e.g.,
CB105) is completely utilized by one bacterial strain another
organism multiplies to utilize a different substrate (e.g.,
CB118). These processes also could cause the observed
distributions.
The plots for CB105, CB118 and CB153 show the differences in
the extent of dechlorination between congeners and sites and
illuminate the difficulties in determining dechlorination rates.
From these plots it is evident that to estimate rates of
dechlorination the congeners being dechlorinated and the sample
location must be specified. A further difficulty in estimating
rates of dechlorination in the SS and NBH is that the history of
PCB inputs to the SS have not been maintained in the sediments.
Although the Aroclor mixtures utilized and presumably
discharged by the plant changed over the years of manufacture
distinct changes in inputs are not reflected in samples from
sediment cores. PCBs were used as impregnation fluids in
capacitors from 1947 until 1978. Plant records show A-1254 was
utilized until 1963 when it was replaced with A-1242. In 1971,
A-1016 completely replaced A-1242 as an impregnation fluid
14
(Weaver, 1982).
Measurements and estimates of sediment depositional rates in
NBH vary considerably depending on location and have increased
substantially from a few mm/year to a few centimeters/year since
construction of the Hurricane Barrier in 1966 (Summerhayes et
al., 1977). A computer model of the SS utilized to predict the
distribution and fate of FCBs utilizes a sediment deposition rate
of < 1 mm/year (Dr. Gerald Miller, 1989, personal communication),
while another report estimates the rate at approximately 3
mm/year (U.S. Army Corps of Engineers, 1988). Using these
estimates of depositional rates, the depth in the sediment which
corresponds to the change from A-1254 to A-1242 in 1963 would be
(1989-1963 - 25 years) between 2.5 and 7.5 cm (about 1 to 3
inches). As described earlier, depths of the changes from A-1254
to A-1242 varied in the core samples taken in the SS (depth to
change was > 19" in core H17), but depths to the change were all
in excess of the 3 inches estimated from depositional rates.
Further, sediment samples from the SS show mixtures of A-1242 and
A-1254 in all sections suggesting that following input the
different PCB mixtures were down mixed into sediments by benthic
processes (e.g., bioturbation) or that mixtures percolated
through sediments after deposition. Regardless of what process
is responsible, it appears that the age of a contaminant in a
sediment section within the SS may not be reliably estimated by
using sediment depositional rates.
Although sediment deposition rates cannot be used to age PCB
15
residues in cores from the SS, estimates of the average rates of
dechlorination from input to time of sampling can be made by
assuming the time of input of the Aroclor mixtures. Assuming an
input of PCBs in 1963 and first order kinetics, rate constants
and half lives were calculated for congeners CB031, CB105, CB118
and CB153 using sediment samples which are representative of
lower (H2267) and higher (11167) extents of dechlorination (Table
4). For CB031, the rate constants are .001 (t"1) and .053 (t"1)
and the half lives are 465 years and 13.2 years for H2267 and
11167 samples, respectively. Considerable differences in half
lives were also observed between congeners within the same
sample. For example, sample H2267 has a half life of 465 years
for CB031 and a half life of 7.5 years for CB105. These
differences emphasize that estimates of dechlorination rates vary
greatly depending on the congener and the sample. The calculated
rate constants represent averages over the 25 year time period
from input to sample collection; other average rate constants and
half lives would be obtained if different input times were
specified. The average rate constants do not give specific
information regarding the past dechlorination rates. For
example, the FCB congeners may have been dechlorinated over a
short period of time followed by years of dormancy. Further,
these average rate constants offer no information on present
dechlorination rates (if any) or if and at what rate these
processes will continue in the future.
16
Conclusions
1. PCBs in sediments from the New Bedford Harbor Superfund
Site (NBHSS) showed considerable compositional alterations
relative to predicted starting mixtures of Aroclors 1242 and
1254. These alterations included (1) a relative loss of lower MW
PCB congeners in all samples presumably due to dissolution and
evaporation prior to incorporation into sediment, and (2)
relative decreases in the content of specific PCB congeners and
the build up of other congeners in some samples by processes
which were presumed to be dechlorinations.
2. The dechlorination processes varied in extent between
samples with the largest changes observed for samples closest to
the outfall from the capacitor plant at the 6-7" sediment depth.
There was a trend toward less dechlorinated residues with
distance from the capacitor plant. Samples from lower NBH showed
only small evidence of dechlorination while control samples from
Black Rock Harbor, CT, showed none.
3. Samples with a lower extent of dechlorination showed
relative decreases in abundance of specific congeners (e.g.,
P058, CB085, CB132, CB105). In more extensively dechlorinated
samples relative decreases in abundance of these and other
CB153 and CB118), and increases in abundance of congeners (e.g.,
CB026, CB025) which resulted from loss of chlorine atoms from
more highly chlorinated congeners were observed.
The potentially toxic coplanar and mono-ortho congeners
17
appear to be among those congeners most readily dechlorinated in
the NBHSS. .Therefore, the dechlorination processes in the NBHSS
may have decreased the potential toxicity (as measured by mixed
function oxidase enzyme induction) of the PCB residues. However,
large quantities of partially dechlorinated PCBs remain in the
sediments of the NBHSS and the toxicities of these remaining
mixtures are not known.
4. Considerable differences were observed in the calculated
average rate constants for the dechlorinations depending on the
sample and the congener.
18
Figure 1.
Map showing locations of cores taken in this study.
AEROVOX
COGGESHALL ST.
195
New Bedford
Harbor
POPES IS1AND BRIDGE
HURRICAN1Z BARRIER
Figure 2.
(a) Comparative abundance plot for a 53%:47% (weight:weight)
mixture of A-1242 and A-1254 standards.
(b) Comparative abundance plot for six to seven inch section of
core H22 (H2267).
(c) Comparative abundance plot for six to seven inch section of
core 111 (11167).
(d) Comparative abundance plot for Black Rock Harbor sediment.
(e) Comparative abundance plot for six to seven inch section of
core C7 (C767).
Plots were made by determining the original mix of PCBs
using peaks P039B and P061 which are representative of A-1242 and
A-1254 inputs, respectively, but appear to be resistant to
reductive dechlorinations. Measured abundances relative to the
predicted starting mix of A-1242 and A-1254 are shown by the
length of bars and is expressed to the power of two. Therefore,
a value of 2 would indicate the measured abundance of that peak
in the sediment was 4 times above the computer prediction of the
abundance of that peak in the A-1242 and A-1254 inputs which were
incorporated in the sediment. A value of -2 shows that the
abundance of that peak is 1/4 of the computer prediction of the
original input.
rvjN H2267 O COO
inin O <L
O)..tt. -OV ...o <n en 00 o. o N O
00 a. in mo CO o p oo o
S g in .•o
0 a. ro .Q.t. ....t-r.. Oo-« m 15" D... O> Q-o CD 00 W a. «om m o O moooooo--- 10 CD OO o o. oOOffiOODOOQOOO On n O o-a. a. E 0.00.00.00.0.0. B J I H O. nU
R to <\l 10 10 mo o O CD oS m OD g SII JJl ...a.<n o f
N oo 10, a. IO o GO
in St 0 O ID •O." OF"" ..cun.. tn .o F ogo. o
S.S....
m o O>
00 o
•too
-3.00 m ao o m «n
-3.50 OOo-
in CD CD 00
DOUBLINGS OR HALF LOSSES
0.30
0.25
0.20
0.15
0.10 P
0 0.05 W E 0.00 R S -0.05
0 -0.10 F
-0.15 2
-0.20
-0.25
-0.30
-0.35
-0 .40
MIX
5 w§
O ^u 2 ?! > t
?o8|rO""|r s£°n
u
iflfllii 1 « 1 I!O
O 1L""
OF A-1242 AND A-1254 (53:47) o
g . ^t?
cL 00ffi o
O O»
S » 0 a !S 2
"«o £ gj 0 CJ" g — a>Q n ^
(0 tocjS °n a> S n1^ tf)(O. — (L.U 1 rti
O ^ U^* n II wffi 7T in to o> n 5°* nil00*-'
3 Sl&r- — • S'w dfl-§ w°-HoS (novm*o y mo •Onj^^-O N
...
iiiilllill IDflS Us Q-"a.Q.B n u ^ ^ H I illllii I
Peak designation as P numbers are used for peaks containing coeluting congeners or where identifications are ambiguous
5 Identifications listed as tentative because standards for
all congeners were not available and other congeners may coelute in the peaks listed.
• 3 (S) identified by coinjection of standard; (L) identified by comparison with literature values (Brown and Wagner, 1986; Schulz et al., 1989).
Numbering according to Ballschmiter and Zell (1980).
Dominant congeners (believed to comprise ̂ 90% of peaks) are underlined. Congeners comprising < 0.5% of Aroclors are identified by (M) (Schultz et al., 1989).
Numbers indicate position of chlorine atoms on each ring.
BRH - SEDIMENT FROM BLACK ROCK HARBOR CT. OTHER NAMES REFER TO LOCATIONS IN NEW BEDFORD - SEE MAP FOR LOCATIONS. XX - 12-13 INCH SECTION. YY - 18-19 INCH SECTION. ZZ - 24-25 INCH SECTION.
Table 4
Rate Constants and Half Lives for Dechlorination
of Selected PCS Congeners
Congener Rate Constants(t~ ) Half Lives (years) H2267 11167 H 2 2 6 7 i T T 6 7
CB031 .001 .053 465 13.2
CB105 .092 .16 7.5 4.4
CB118 .10 6.8
CB153 .04 18.8
Peak showed increase in relative abundance therefore calculation of rate and half life were not made.
References
Ballschmiter, K. and M. Zell. 1980. Analysis of Polychlorinated Biphenyls (PCB) by Glass Capillary Gas Chromatography:Composition of Technical Aroclor-and Clophen-PCB Mixtures. Fresenius Zeitschrift fur Analytische Chemie, Vol 302:210-31.
Brown, J.F., Jr., R.E. Wagner, D.L. Bedard, M.J. Brennan, J.C. Carnaham, R.J. May and T.J. Tofflemire. 1984. PCB transformations in upper Hudson sediments. Northeast Environ. Sci. 3:167-179.
Brown, J.F., Jr., R.E. Wagner, H. Feng, D.L. Bedard, M.J. Brennan, J.C. Carnahan, and R.J. May. 1987(b). Environmental Dechlorination of PCBs. Environ. Tox. and Chem. Vol 6:579-593.
Brown, J.F., Jr., and R.E. Wagner. 1986. Polychlorinated Biphenyl (PCB) Movement and Transformation in Acushnet Estuary Sediments. Draft of September 26, 1988.
Kannan, N., S. Tanabe and R. Tatsukawa. 1988. Toxic Potential of Non-ortho and Mono-ortho Coplanar PCBs in Commercial PCB Preparations: "2,3,7,8-T, CDD Toxicity Equivalence Factors Approach." Bull. Environ. Contam. Toxicol. Vol 41:267-276.
Lake, J., G. Hoffman and S. Schimmel. 1985. "Bioaccumulation of Contaminants from Black Rock Harbor Dredged Material by Mussels and Polychaetes," Technical Report D-85-2, prepared by the U.S. Environmental Protection Agency, Environmental Research Laboratory, Narragansett, RI, for the U.S. Army Engineer Waterways Experiment Station, Vicksburg, MS.
Miller, Gerald, Ph.D. 1989. Personal Communication. Battelle. Duxbury, MA.
Plant Records. 1985. New Bedford harbor/Monsanto Total PCB by Each Customer for Each Year 11/22/1985, Customer Name: Aerovox.
SchuJLz, D.E., G. Petrick and J.C. Duinker. 1989. Complete characterization of Polychlorinated Biphenyl Congeners in Commercial Aroclor and Clophen Mixtures by Multidimensional Gas Chromatography-Electron Capture Detection. Environ. Sci. Technol., Vol 23:852-859.
Summerhayes, C.P., J.P. Ellis, P. Stoffers, S.R. Briggs and M.G. Fitzgerald. 1977. Fine-Grained Sediment and Industrial Waste Distribution and Disposal in New Bedford Harbor and Western Buzzards Bay, Massachusetts, Woods Hold Oceanographic Institution. WHOI-76-115.
References (cont.)
U.S. Army Corps of Engineers. 1988, Technical Report EL-88-15. Dec. 88, Report #2.
Weaver, G. 1982. PCB Pollution in the New Bedford, Massachusetts, Massachusetts Coastal zone Management, Commonwealth of Massachusetts.
Appendix 1
Residues in Organisms
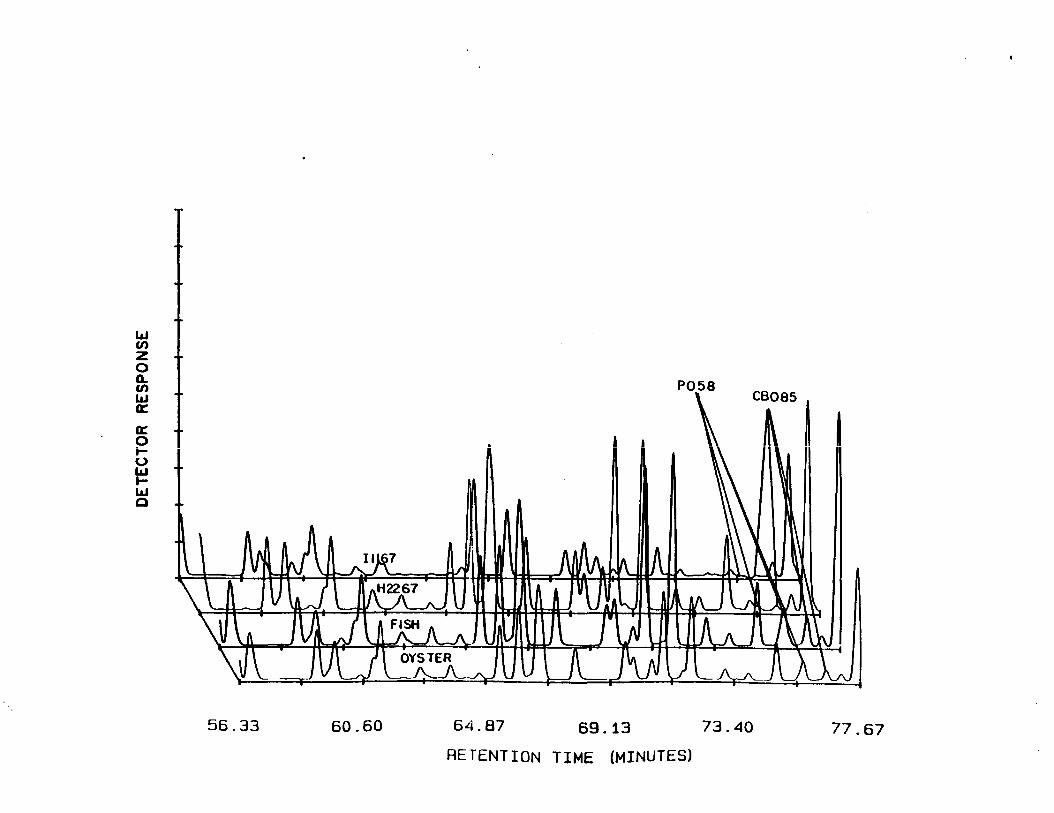
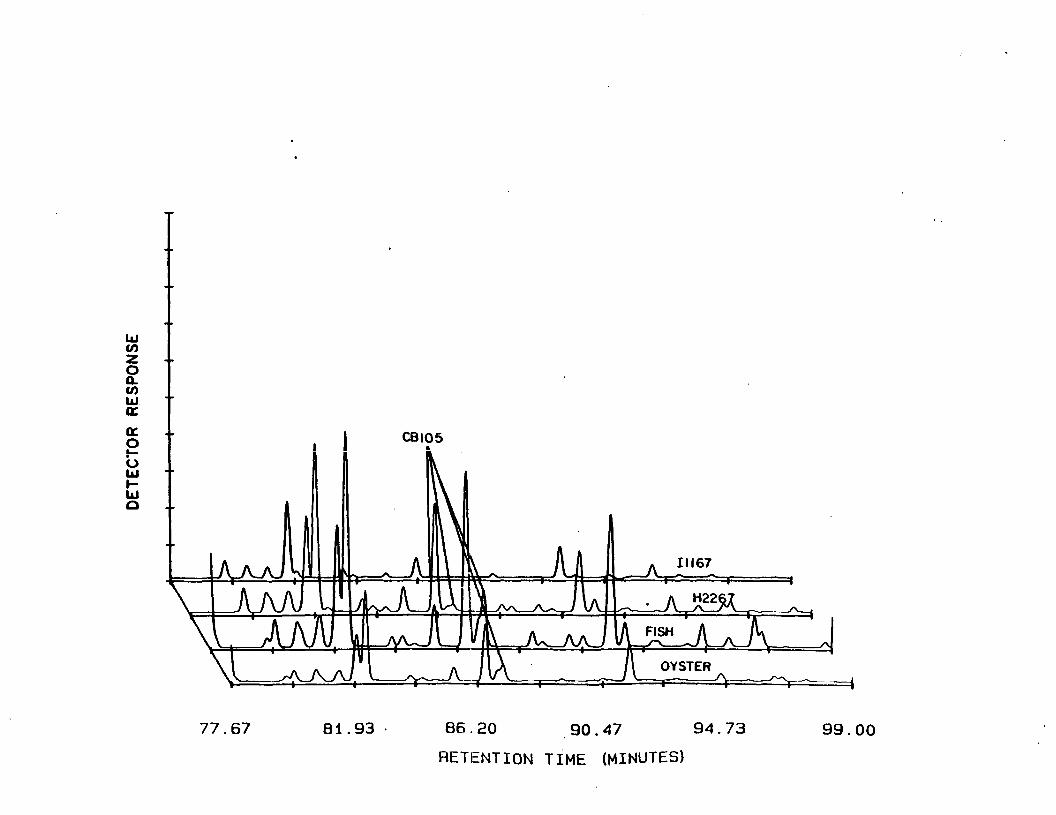
The PCB patterns in extracts of organisms collected at the
Southern end of the NBHSS (under the Coggeshall St. Bridge - see
Figure 1) were compared with sediment extracts representative of
low (sample H2267) and high (sample 11167) extents of
dechlorination to determine the impact of dechlorination
processes on the distributions of PCBs accumulated by these
organisms. Te extracts from the fish (Menidia menidia) and
oyster (Crassostrea virginica) were more similar to the extract
from H2267, than to the extensively dechlorinated extract from
11167 (Figure A-l). The PCBs accumulated by the organisms,
however, show even less dechlorination than the PCBs in sediment
sample H2267. Decreases in the relative heights of peaks P058,
CB085 and CB105, which appear to be sensitive indicators of
dechlorination, are more pronounced in sediment H2267 than in the
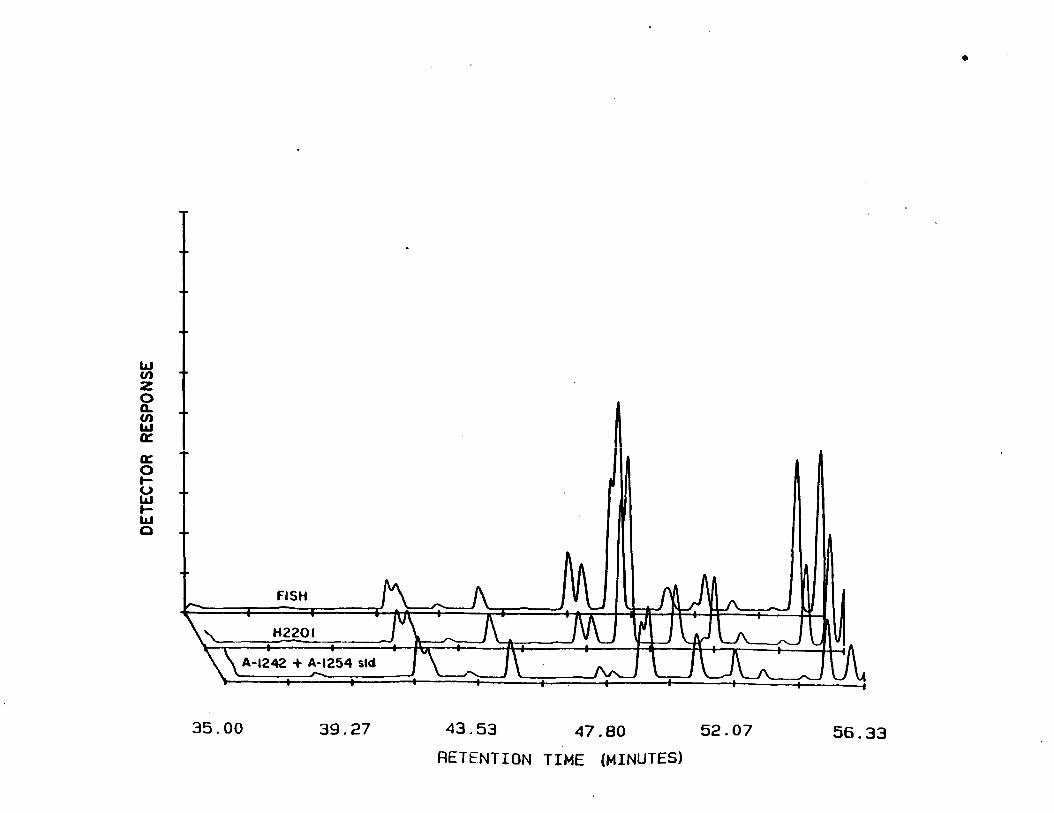
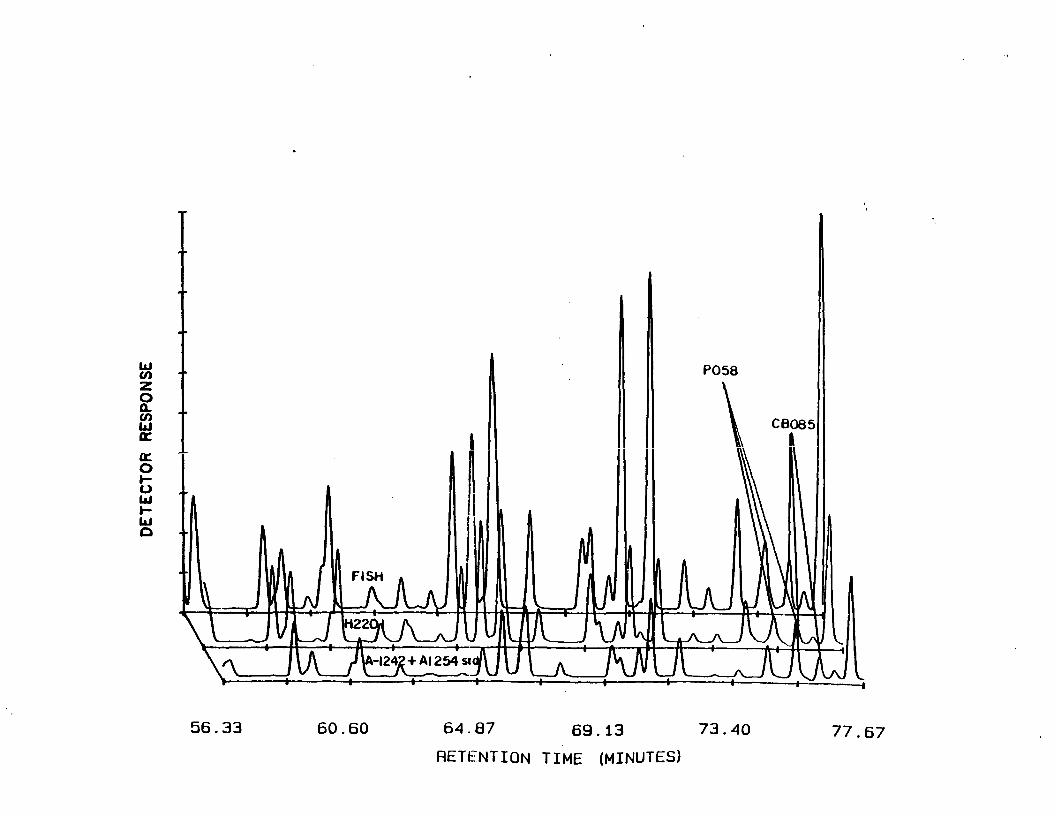
fish and oysters. Comparisons of g'as chromatograms of organism
extracts with different sediment extracts from the NBHSS showed
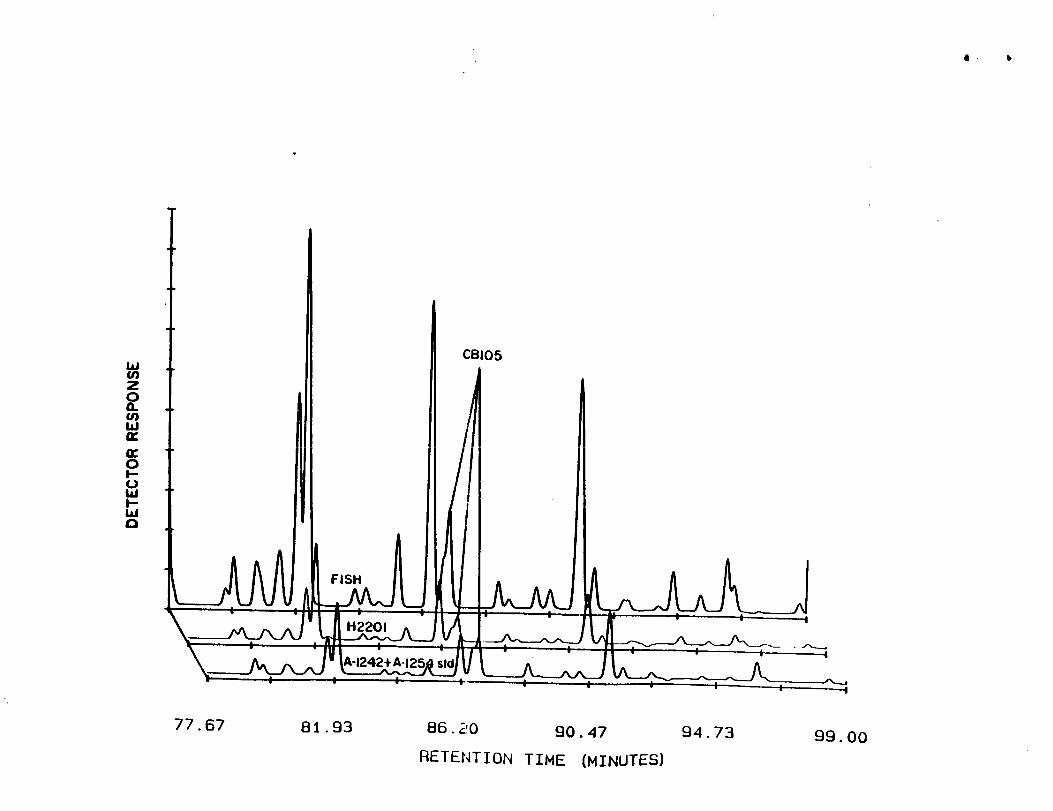
the closest match between the organisms and H2201 (Figure A2).
This surface sediment shows only minor dechlorination as
indicated by the small relative decreases of peaks P058, CB085
and CB105 compared to the relative abundances of these peaks in a
mixture of A-1242 and A-1254 standards (Figure A2). It appears
that organisms exposed at the southern end of the NBHSS
accumulated PCBs from sediments such as those at H2201 which
showed only a minor extent of dechlorination. An alternative
hypothesis that explains the patterns of these residues is that
the organisms accumulated small amounts of heavily dechlorinated
residues and large amounts of nondechlorinated residues.
Analysis of Organism Samples
Mussels from each sample were homogenized using a polytron
and 2 to 5 grams of each weighed into an acetone rinsed 100 ml
centrifuge tube. Octachloronaphthalene was added as an internal
standard. The samples were extracted with 25 ml of acetone by
polytroning the sample and acetone in the centrifuge tube for 20
seconds. The sample was centrifuged and the supernatant poured
into a 500 ml separatory funnel containing 150 ml of water. This
procedure was repeated two more times combining extracts in the
separatory funnel. The sample in the separatory funnel was then
extracted three times with 25 ml portions of freon. The extracts
were combined, treated with sodium s;ulfate and volume reduced
using a heating mantle and a Kuderna-Danish evaporator with a 3
ball Snyder column. The extract was reduced in volume and
solvent exchanged to about 10 ml of hexane. The sample was
transferred to a concentrator tube and the volume adjusted to 10
ml. One ml was removed for lipid weight determination and the
remaining 9 ml was partitioned against concentrated sulfuric
acid. The sample was then volume reduced and solvent exchanged
to 1 ml of heptane using a concentrator tube and stored in a
screw-top vial prior to instrumental analysis. Extracts of
organisms were analyzed using the same instrumental conditions
used for the analysis of sediment samples.
Appendix 2
Recommendations for Future Work
In order to estimate the impact of dechlorination processes
on the New Bedford Harbor Superfund Site (NBHSS) and on lower New
Bedford Harbor and to allow better assessment of remediation
options, the following areas of research should be addressed:
1. Determination of the extent of dechlorination of PCBs at
the highest concentration locations in the NBHSS. The data in
this report show that dechlorination processes are more extensive
as the concentration of PCBs in sediments increases. In this
study, however, the highest PCB concentrations in sediment were
approximately 3 parts per thousand. At some locations near the
outfall of the Aerovox plant the PCB concentrations are in excess
of an order of magnitude higher than those reported in this
study. Detailed analyses of the composition of PCBs present in
sediments from these hotspot locations should be done to
determine the extent of dechlorination which has occurred.
2. Studies should be conducted to determine the rates of
dechlorination processes to allow predictions of the types and
quantities of PCB which will be present in the future if no
remediation of the NBHSS is undertaken.
3. The toxicity of residues following dechlorination
should be examined to allow evaluation of potential environmental
benefits associated with these processes.
Figure A--1
Comparison of gas chromatograms from (top to bottom) sediment
11167, sediment H2267, fish (Menidia menidia) and oyster
(Crassostrea virginica).
CO
o a. en UJ oc. oc.
O
35.00 39.27 43.53 47.80 52.07 56.33
RETENTION TIME (MINUTES)
o 0.tn P058
CB085
oc p r— O
Ul O
56.33 60.60 64.87 69.13 73.40 77.67
RETENTION TIME (MINUTES)
UJ C/> z o a.
oc. CBI05 o w O UJ H UJ O
77.67 81.93 86.20 90.47 94.73 99.00
RETENTION TIME (MINUTES)
Figure A-2
Comparison of gas chromatograms from (top to bottom) fish
(Menidia menidia), sediment H2201 and mixture of A-1242 and A
1254 standards (53:47% w/w).
UJ CO z o a.
a: oto Ul
o
35.00 39.27 43.53 47.80 52.07 56.33
RETENTION TIME (MINUTES)
UJ CO z O Q. CO Ul OC.
UL O
O
56.33 60.60 64.87 69.13 73.40 77.67
RETENTION TIME (MINUTES)
77.67 81.93 86.20 90.47 94.73 99.00 RETENTION TIME (MINUTES)
Appendix 2
Recommendations Eor Future Work
in order to estimate the impact of dechlorination processes
on the New Bedford Harbor Superfund Site (NBHSS) and on lower New
Bedford Harbor and to allow better assessment of remediation
options, the following areas of research should be addressed:
1. Determination of the extent of dechlorination of PCBs at
the highest concentration locations in the NBHSS. The data in
this report show that dechlorination processes are more extensive
as the concentration of PCBs in sediments increases. In this
study, however, the highest PCS concentrations in sediment were
approximately 3 parts per thousand. At some locations near the
outfall of the Aerovox plant the PCB concentrations are in excess
of an order of magnitude higher than those reported in this
study. Detailed analyses of the composition of PCBs present in
sediments from these hotspot locations should be done to
determine the extent of dechlorination which has occurred.
2. Studies should be conducted to determine the rates of
dechlorination processes to allow predictions of the types and
quantities of PCB which will be present in the future if no
remediation of the NBHSS is undertaken.
3. The toxicity of residues following dechlorination
should be examined to allow evaluation of potential environmental