Page 1 of 6 STRATEGIC MANAGEMENT GROUP STRATEGIC MANAGEMENT GROUP Deciphering India’s Demographic Puzzle: A Consumer & Retail Perspec tive The projected shift in age groups, emergence of large distinct income groups, increasingrelevance of urban India and growing share of large cities within urban India are important triggers for companies in consumer facing industries to revisit their strategies, else risk being caught off guard, say Pankaj Gupta, Practice Head - Consumer & Retailand Rajiv Subramanian of Tata Strategic Management Group. Between 2006 and 2016, India’s increase in population is expected to be 157 Mn, which is a little greater than the current population of Russia. Within this addition, demographic shifts like a larger working population, increasing urbanization and a burgeoning middle class have been topics of extensive discussion. However, certain other trends like the decrease in the <14 years age group, increase in >60 years age group, greaterconcentration of urban India and rapid increase in the number of high income households may have been overlooked. These trends could be crucial for companies in the consumer centric products and services domain in identifying future opportunities and threats. India’s Changing Age Mix Projections indicate a 35 Mn increase in the old age population (>60 years) between 2006 and 2016. This is facilitated by the anticipated improvement in the life expectancy levels from 68.1 in 2006 to 71.1 in 2016. States like Tamil Nadu, Andhra Pradesh, West Bengal, Maharashtra and Uttar Pradesh are the m ajor contributors of this addition. •118 Mn old age population (>60 years) by 2016 •17 Mn reduction in the <14 years age population •U.P, Maharashtra, Bihar, Rajasthan and M.P contribute to >50% of the addition in working age(15-59 years) population <14 years 27% 15-59 years 64% >60 years 9% >60 years 8% <14 years 32% 15-59 years 60% 2006 2016 Table 2: Shifting Age Mix Proportion (Percentage) 669 811 83 118 ~356 ~340 2006 2016 Table 1:Shiftin g Age Mix (Mn Persons) <14 years 15-59 years >60 years 1108 1269 Source: Population Projections 2001-2026 (Census Commissioner), Analysis by Tata Strategic <14 years 27% 15-59 years 64% >60 years 9% >60 years 8% <14 years 32% 15-59 years 60% 2006 2016 Table 2: Shifting Age Mix Proportion (Percentage) 669 811 83 118 ~356 ~340 2006 2016 Table 1:Shiftin g Age Mix (Mn Persons) <14 years 15-59 years >60 years 1108 1269 <14 years 27% 15-59 years 64% >60 years 9% >60 years 8% <14 years 32% 15-59 years 60% 2006 2016 Table 2: Shifting Age Mix Proportion (Percentage) 669 811 83 118 ~356 ~340 2006 2016 Table 1:Shiftin g Age Mix (Mn Persons) <14 years 15-59 years >60 years 1108 1269 Source: Population Projections 2001-2026 (Census Commissioner), Analysis by Tata Strategic
STRATEGIC MANAGEMENT GROUPSTRATEGIC MANAGEMENT GROUP
Deciphering India’s Demographic Puzzle: A Consumer & Retail Perspective
The projected shift in age groups, emergence of large distinct income groups, increasing
relevance of urban India and growing share of large cities within urban India areimportant triggers for companies in consumer facing industries to revisit their strategies,
else risk being caught off guard, say Pankaj Gupta, Practice Head - Consumer & Retail
and Rajiv Subramanian of Tata Strategic Management Group. Between 2006 and 2016, India’s increase in population is expected to be 157 Mn, which
is a little greater than the current population of Russia. Within this addition, demographic
shifts like a larger working population, increasing urbanization and a burgeoning middle
class have been topics of extensive discussion. However, certain other trends like the
decrease in the <14 years age group, increase in >60 years age group, greater
concentration of urban India and rapid increase in the number of high income
households may have been overlooked. These trends could be crucial for companies in
the consumer centric products and services domain in identifying future opportunities
and threats.
India’s Changing Age Mix
Projections indicate a 35 Mn increase in the old age population (>60 years) between
2006 and 2016. This is facilitated by the anticipated improvement in the life expectancy
levels from 68.1 in 2006 to 71.1 in 2016. States like Tamil Nadu, Andhra Pradesh, West
Bengal, Maharashtra and Uttar Pradesh are the major contributors of this addition.
• 118 Mn old age population (>60 years) by 2016
• 17 Mn reduction in the <14 years age population
• U.P, Maharashtra, Bihar, Rajasthan and M.P contribute to >50% of the addition
in working age(15-59 years) population
<14
years
27%
15-59
years
64%
>60
years
9%>60
years
8%
<14
years
32%15-59
years
60%
2006 2016
Table 2: Shifting Age Mix Proportion (Percentage)
669811
83
118
~356 ~340
2006 2016
Table 1:Shifting Age Mix (Mn Persons)
<14 years
15-59 years
>60 years1108
1269
Source: Population Projections 2001-2026 (Census Commissioner), Analysis by Tata Strategic
<14
years
27%
15-59
years
64%
>60
years
9%>60
years
8%
<14
years
32%15-59
years
60%
2006 2016
Table 2: Shifting Age Mix Proportion (Percentage)
669811
83
118
~356 ~340
2006 2016
Table 1:Shifting Age Mix (Mn Persons)
<14 years
15-59 years
>60 years1108
1269
<14
years
27%
15-59
years
64%
>60
years
9%>60
years
8%
<14
years
32%15-59
years
60%
2006 2016
Table 2: Shifting Age Mix Proportion (Percentage)
669811
83
118
~356 ~340
2006 2016
Table 1:Shifting Age Mix (Mn Persons)
<14 years
15-59 years
>60 years1108
1269
Source: Population Projections 2001-2026 (Census Commissioner), Analysis by Tata Strategic
STRATEGIC MANAGEMENT GROUPSTRATEGIC MANAGEMENT GROUP
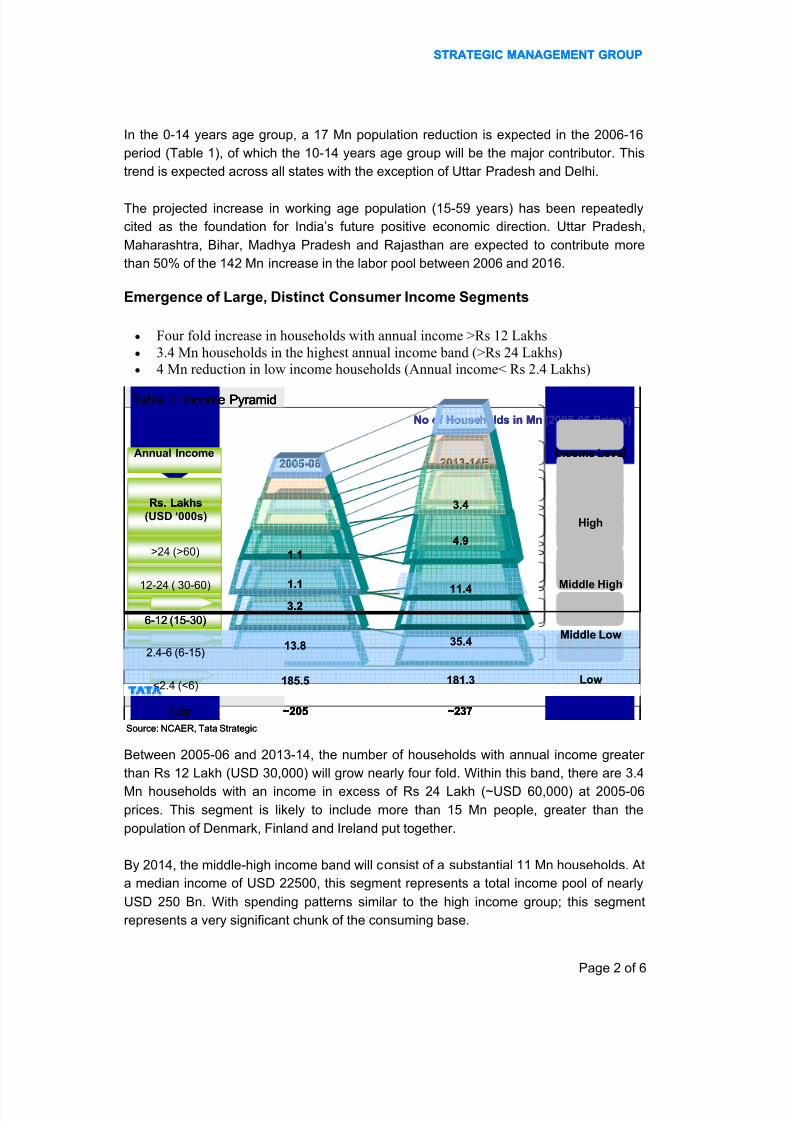
A positive trend is seen in the middle-low band as well, where the number of households
is likely to increase from ~14 Mn in 2006 to over 35 Mn in 2014. While low income
households will remain the largest segment, their numbers are expected to decrease byabout 4 Mn (0.3% CAGR) in the same period. While these households are largely rural,
a substantial portion would be in urban India as well.
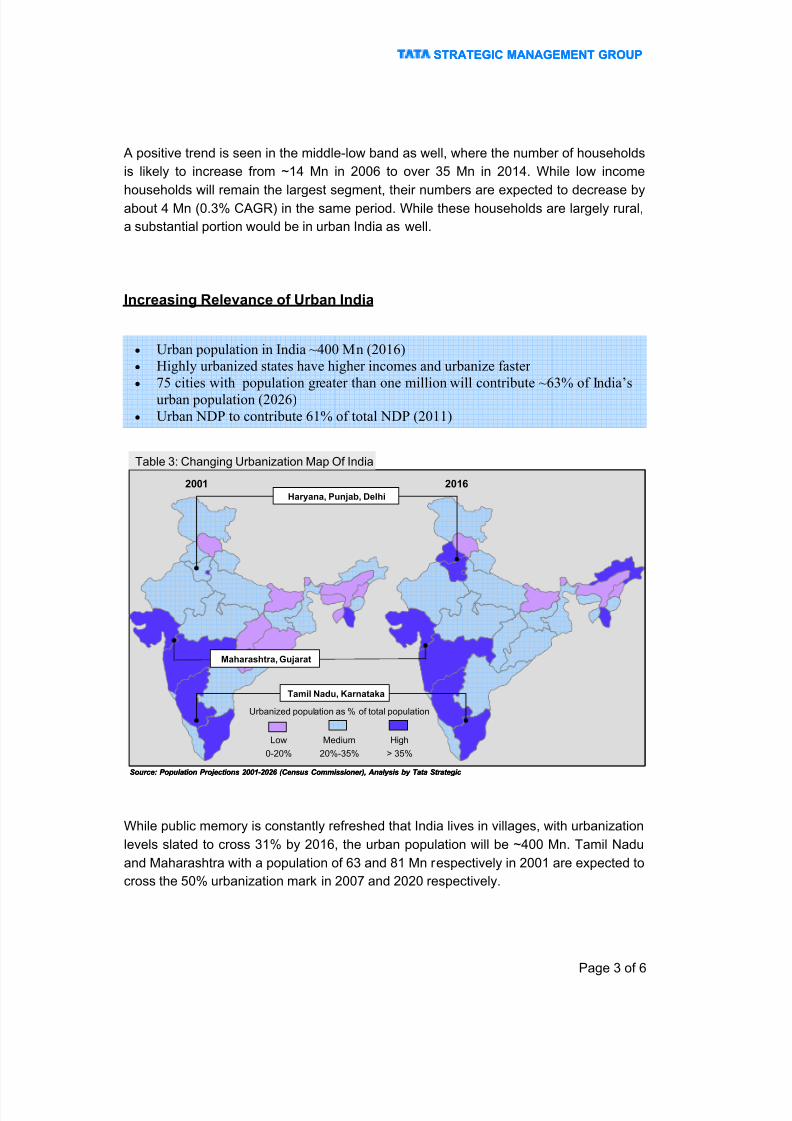
Increasing Relevance of Urban India
While public memory is constantly refreshed that India lives in villages, with urbanization
levels slated to cross 31% by 2016, the urban population will be ~400 Mn. Tamil Nadu
and Maharashtra with a population of 63 and 81 Mn respectively in 2001 are expected to
cross the 50% urbanization mark in 2007 and 2020 respectively.
• Urban population in India ~400 Mn (2016)
• Highly urbanized states have higher incomes and urbanize faster
• 75 cities with population greater than one million will contribute ~63% of India’s
urban population (2026)
• Urban NDP to contribute 61% of total NDP (2011)
Source: Population Projections 2001-2026 (Census Commissioner), Analysis by Tata Strategic
2001 2016
Urbanized population as % of total population
0-20%
Low
> 35%
High
20%-35%
Medium
Tamil Nadu, Karnataka
Maharashtra, Gujarat
Haryana, Punjab, Delhi
Table 3: Changing Urbanization Map Of India
Source: Population Projections 2001-2026 (Census Commissioner), Analysis by Tata Strategic
STRATEGIC MANAGEMENT GROUPSTRATEGIC MANAGEMENT GROUP
Incomes are slated to increase faster in urban India than in rural India. The ratio of per
capita incomes in urban to rural India is expected to go up from 3.3 in 2004-05 to 3.7 in
2010-11 (Table 6). Expectedly, share of urban India in the country’s net domesticproduct would go up from 52% in 2000 to over 60% in 2011 (Table 7).
Increasing Marginal Utility Of Time
Lack of time is fast becoming the basis for many consumer preferences in urban India.Smaller trends listed below are contributory factors to this shift in consumer behaviour.
Indians have been typically referred to as hard workers. This perception has been
strengthened by a recent study which revealed that Indian business leaders typically put
in the maximum number of working hours (57 hours) per week as compared to their
counterparts from 31 other countries.
The non-working time available to an urban Indian has been gradually eroded by the
increased travel time caused by the increase in traffic on the roads. Sales of two
wheelers and passenger cars put together have increased from 42 Lakhs in 2000-01 to
~70 Lakhs in 2004. With a less than proportionate increase in the length of roads, trafficon the road is bound to go up resulting in increased travel times.
Indian women traditionally stayed back at home to look after the kitchen and the
household. There has been a gradual but steady increase in the working urban women
in India. This has led to an increased realization of lack of time in double income
households in urban India. This need is more likely to be felt in the southern states of
Andhra Pradesh, Kerala, Karnataka and Tamil Nadu which have a higher urban working
women proportion of 16% as against a national average of less than 12%.
These factors contribute to the increase in marginal utility of time in urban India with
lesser number of hours available for the same or more number of tasks.
• Lack of time is increasingly shaping consumer preferences in urban India
• Rise in urban working women has amplified the trend