27
Core Purpose: To Enable Organisations Become Ha Decision Analysis- Part II
| Date post: | 06-Aug-2015 |
| Category: |
Business |
| Upload: | ask-to-solve |
| View: | 45 times |
| Download: | 2 times |

Core Purpose: To Enable Organisations Become Happier
Decision Analysis- Part II

Apr 15, 2023 2Data Analytics | Execution | Deployment | Training | QinT
What is Decision Analysis?
• A quantitative framework for making decisions
• Selection of a decision from a set of possible decision alternatives when uncertainties regarding the future exist
• Goal is to optimize the resulting payoff in terms of a decision criterion

Apr 15, 2023 3Data Analytics | Execution | Deployment | Training | QinT
Decision Models
• Deterministic models
• Probabilistic models• Decision-making under pure uncertainty
• Maxmin
• Maxmax
• Minmax
• Decision-making under risk
• Expected value returns
• Expected value of perfect information
• Expected value of additional information- Bayesian analysis

Apr 15, 2023 4Data Analytics | Execution | Deployment | Training | QinT
Decision Analysis- Part I
• Deterministic models
• Probabilistic models• Decision-making under pure uncertainty
• Maxmin
• Maxmax
• Minmax

Apr 15, 2023 5Data Analytics | Execution | Deployment | Training | QinT
Decision Analysis- Part II
• Probabilistic models• Decision-making under risk
• Expected value returns
• Expected value of perfect information
• Expected value of additional information- Bayesian analysis

Apr 15, 2023 6Data Analytics | Execution | Deployment | Training | QinT
Decision Analysis- Part III
Application and comparisons of:
• Criteria Based Matrix
• Decision analysis tools

Apr 15, 2023 7Data Analytics | Execution | Deployment | Training | QinT
Decision Analysis- Part I
• Deterministic models
• Probabilistic models• Decision-making under pure uncertainty
• Maxmin
• Maxmax
• Minmax

Apr 15, 2023 8Data Analytics | Execution | Deployment | Training | QinT
Case Study
States of nature
>1000 points 300-1000 +/-300 -300 to -
1000<-1000 points
Large rise Small rise No change Small fall Large fall
Alternatives
Bonds 9% 7% 6% 0% -1%
Stocks 17% 9% 5% -3% -10%
Fixed deposit 7% 7% 7% 7% 7%

Apr 15, 2023 9Data Analytics | Execution | Deployment | Training | QinT
MaxMin
Pessimistic approach based on worst case scenario
1. Write min for each row
2. Choose max of the above
States of nature
>1000 points
300-1000 +/-300 -300 to -
1000<-1000 points
Large rise
Small rise
No change Small fall Large fall Min
Alternatives
Bonds 9% 7% 6% 0% -1% -1%
Stocks 17% 9% 5% -3% -10% -10%
Fixed deposit 7% 7% 7% 7% 7% 7%
Apr 15, 2023 10Data Analytics | Execution | Deployment | Training | QinT
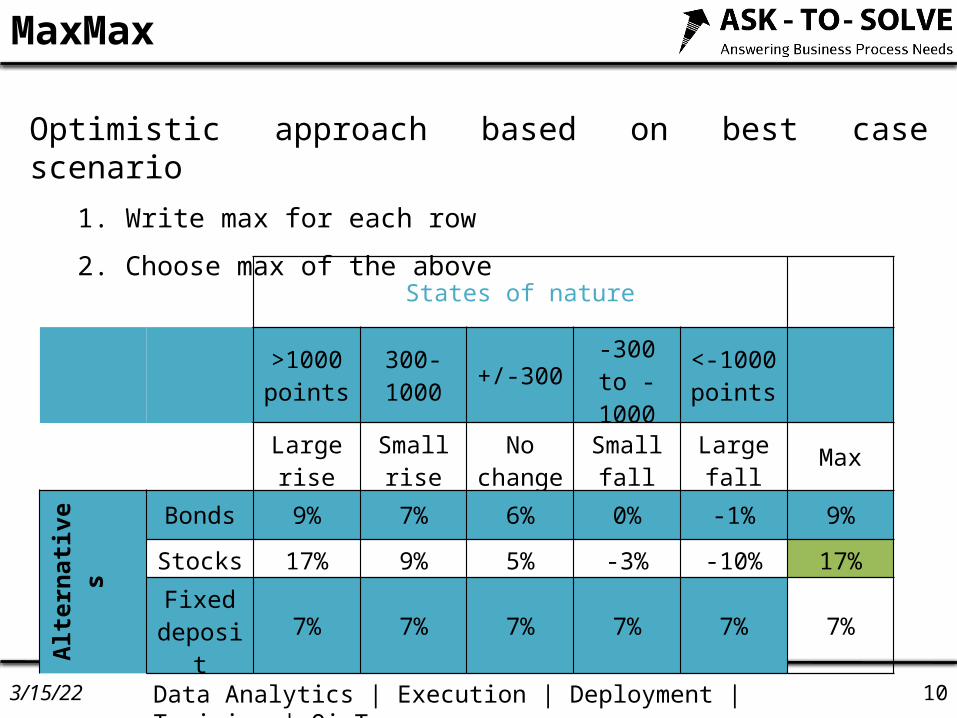
MaxMax
Optimistic approach based on best case scenario
1. Write max for each row
2. Choose max of the above
States of nature
>1000 points
300-1000 +/-300 -300 to -
1000<-1000 points
Large rise
Small rise
No change Small fall Large fall Max
Alternatives
Bonds 9% 7% 6% 0% -1% 9%
Stocks 17% 9% 5% -3% -10% 17%
Fixed deposit 7% 7% 7% 7% 7% 7%

Apr 15, 2023 11Data Analytics | Execution | Deployment | Training | QinT
MinMax
Pessimistic approach to minimize regret or opportunity loss
1. Take the largest number in each coloumn
2. Subtract all the numbers in the coloumn from it
3. Choose maximum number for each option
4. Choose minimum number from step 3

Apr 15, 2023 12Data Analytics | Execution | Deployment | Training | QinT
Case Study
States of nature
>1000 points 300-1000 +/-300 -300 to -
1000<-1000 points
Large rise Small rise No change Small fall Large fall
Alternatives
Bonds 9% 7% 6% 0% -1%
Stocks 17% 9% 5% -3% -10%
Fixed deposit 7% 7% 7% 7% 7%

Apr 15, 2023 13Data Analytics | Execution | Deployment | Training | QinT
Regret Matrix
States of nature
>1000 points 300-1000 +/-300 -300 to -
1000<-1000 points
Large rise Small rise No change Small fall Large fall
Alternatives
Bonds (17%-9%) (9%-7%) (7%-6%) (7%-0%) (7%+1%)
Stocks (17%-17%) (9%-9%) (7%-5%) (7%+3%) (7%+10%)
Fixed deposit (17%-7%) (9%-7%) (7%-7%) (7%-7%) (7%-7%)

Apr 15, 2023 14Data Analytics | Execution | Deployment | Training | QinT
Regret Matrix
States of nature
>1000 points 300-1000 +/-300 -300 to -
1000<-1000 points
Large rise Small rise No change Small fall Large fall Max
Alter
natives
Bonds 8% 2% 1% 7% 8% 8%
Stocks 0% 0% 2% 10% 17% 17%
Fixed deposit 10% 2% 0% 0% 0% 10%
Apr 15, 2023 15Data Analytics | Execution | Deployment | Training | QinT
Decision Analysis- Part II
• Probabilistic models• Decision-making under risk
• Expected value returns
• Expected value of perfect information
• Expected value of additional information- Bayesian analysis
Apr 15, 2023 16Data Analytics | Execution | Deployment | Training | QinT
Expected Value Approach
• Neutral approach to find optimal decision
• The probability estimate for the occurrence ofeach state of nature can be incorporated to arrive at the optimal decision
1. For each decision add all the payoffs
2. Select the decision with the best expected payoff

Apr 15, 2023 17Data Analytics | Execution | Deployment | Training | QinT
Case Study
States of nature
>1000 points 300-1000 +/-300 -300 to -
1000<-1000 points
Large rise Small rise No change Small fall Large fall
Alternatives
Bonds 9% 7% 6% 0% -1%
Stocks 17% 9% 5% -3% -10%
Fixed deposit 7% 7% 7% 7% 7%
Probability 25% 20% 40% 10% 5%

Apr 15, 2023 18Data Analytics | Execution | Deployment | Training | QinT
Expected Value Calculation
States of nature
>1000 points
300-1000 +/-300 -300 to -
1000<-1000 points EV
Large rise
Small rise
No change Small fall Large fall
Alternativ
es
Bonds 9% 7% 6% 0% -1% 6%
Stocks 17% 9% 5% -3% -10% 7.25%
Fixed deposit 7% 7% 7% 7% 7% 7%
Probability 25% 20% 40% 10% 5%
EV(Bonds)= 25%x9% + 20%x7% + 40%x6% + 10%x0% + 5%x(-1%)

Apr 15, 2023 19Data Analytics | Execution | Deployment | Training | QinT
States of nature
>1000 points 300-1000 +/-300 -300 to -
1000<-1000 points
Large rise Small rise No change Small fall Large fall
Alternatives
Bonds 9% 7% 6% 0% -1%Stocks 17% 9% 5% -3% -10%
Fixed deposit 7% 7% 7% 7% 7%
Probability 25% 20% 40% 10% 5%
• ER(PI)= 25%x17% +20%x9% + 40%x7% + 10%x7% + 5%x7% = 9.9%
• Expected value of perfect information: 9.9%-7.25% =2.65%
Expected Value of Perfect Information

Apr 15, 2023 20Data Analytics | Execution | Deployment | Training | QinT
• Uses Bayes’ theorem to calculate refined probabilities
Expected Value of Additional Information
Large rise Small rise No change Small fall Large fall
Positive 80% 70% 50% 40% 0%
Negative 20% 30% 50% 60% 100%

Apr 15, 2023 21Data Analytics | Execution | Deployment | Training | QinT
Probability- Positive Growth
State of nature Prior probability
Probability (State|Positive)
Joint probability
Posterior probability
Large rise 25% 80% 20% 34.5%
Small rise 20% 70% 14% 24.1%
No change 40% 50% 20% 34.5%
Small fall 10% 40% 4% 6.9%
Large fall 5% 0% 0% 0%
Probability (Forecast=Positive) = 58%

Apr 15, 2023 22Data Analytics | Execution | Deployment | Training | QinT
Probability- Negative Growth
State of nature Prior probability
Probability (State|Negative)
Joint probability
Posterior probability
Large rise 25% 20% 5% 11.9%
Small rise 20% 30% 6% 14.3%
No change 40% 50% 20% 47.6%
Small fall 10% 60% 6% 14.3%
Large fall 5% 100% 5% 11.9%
Probability (Forecast=Negative) = 42%

Apr 15, 2023 23Data Analytics | Execution | Deployment | Training | QinT
States of nature
>1000 points 300-1000 +/-300 -300 to -
1000<-1000 points
Large rise Small rise No change Small fall Large fall
Alternatives
Bonds 9% 7% 6% 0% -1%Stocks 17% 9% 5% -3% -10%
Fixed deposit 7% 7% 7% 7% 7%
P (Positive) 34.5% 24.1% 34.5% 6.9% 0%
P (Negative) 11.9% 14.3% 47.6% 14.3% 11.9%
• EV(Bonds|Positive)= 9%x34.5% +7%x24.1+ 6%x34.5% + 0%x6.9% + (-1%) x 0%= 6.86%• EV(Bonds|Negative)= 9%x11.9% +7%x14.3+ 6%x47.6% + 0%x14.3% + (-1%) x 11.9%= 4.81%
Conditional Expected Values

Apr 15, 2023 24Data Analytics | Execution | Deployment | Training | QinT
Positive Forecast
Negative Forecast
Alternatives
Bonds 6.86% 4.81%
Stocks 9.55% 4.07%
Fixed deposit 7% 7%
• Expected Return from Additional Information: 58%*9.55%+42%*7% = 8.48%• Expected Value of Additional Information: 8.48%-7.25% = 1.23%
Conditional Expected Values Contd…

Apr 15, 2023 25Data Analytics | Execution | Deployment | Training | QinT
Summary
States of nature
>1000 points 300-1000 +/-300 -300 to -
1000<-1000 points
Large rise Small rise No change Small fall Large fall
Alternatives
Bonds 9% 7% 6% 0% -1%
Stocks 17% 9% 5% -3% -10%
Fixed deposit 7% 7% 7% 7% 7%
Probability 25% 20% 40% 10% 5%
• Expected Value Returns: = 7.25%• Expected value of perfect information: 9.9%-7.25% = 2.65%• Expected Value of Additional Information: 8.48%-7.25% = 1.23%

Apr 15, 2023 26Data Analytics | Execution | Deployment | Training | QinT
References
• University of Baltimore: http://home.ubalt.edu/ntsbarsh/opre640a/partIX.htm
• John Wiley & Sons

Apr 15, 2023 27Data Analytics | Execution | Deployment | Training | QinT
Thanks!!!


