43
Decision Analysis

Decision Analysis
Objective of Decision Analysis
Determine an optimal decision under uncertain future events

Formulation of Decision Problem
• Clear statement of the problem• Identify:
– The decision alternatives– The future events that could impact the
decision. These are referred to as chance events
– The consequences: the outcomes associated with each decision alternative and chance event

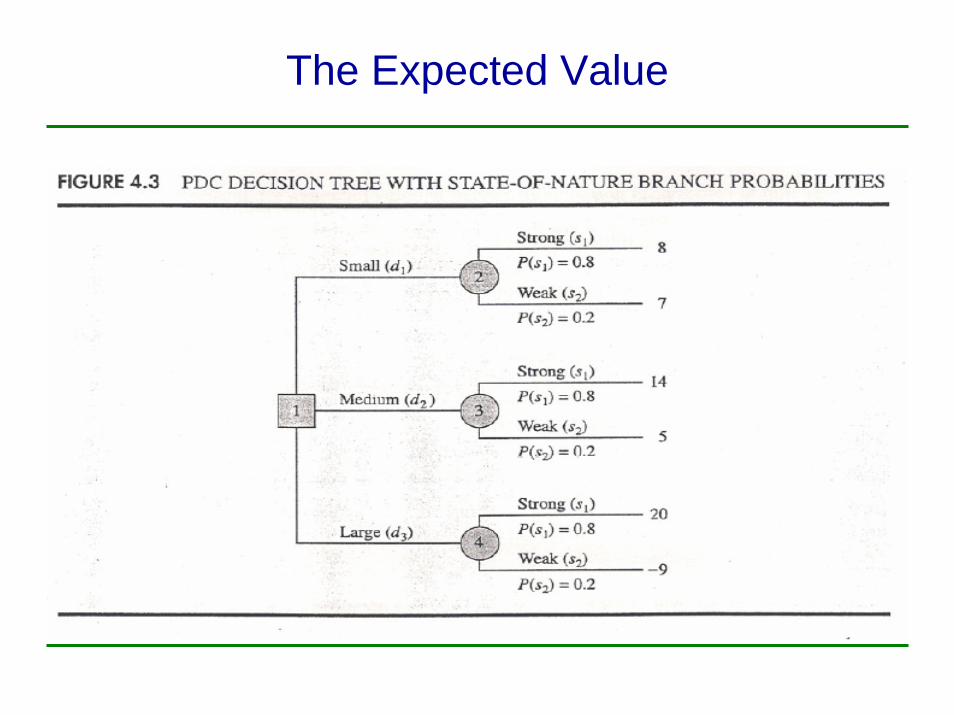
Example: PDC Constructing Luxury Condominium Complex
• Problem: How large should the complex bePDC limited the options to:d1 = small complex with 30 condominiumsd2 = medium complex with 60 condominiumsd3 = large complex with 90 condominiums
• Future chance events were limited to:s1 = strong demand for the condominiumss2 = weak demand for the condominiums
Representation of the Decision Problem
• Payoff Tables• Decision Tree
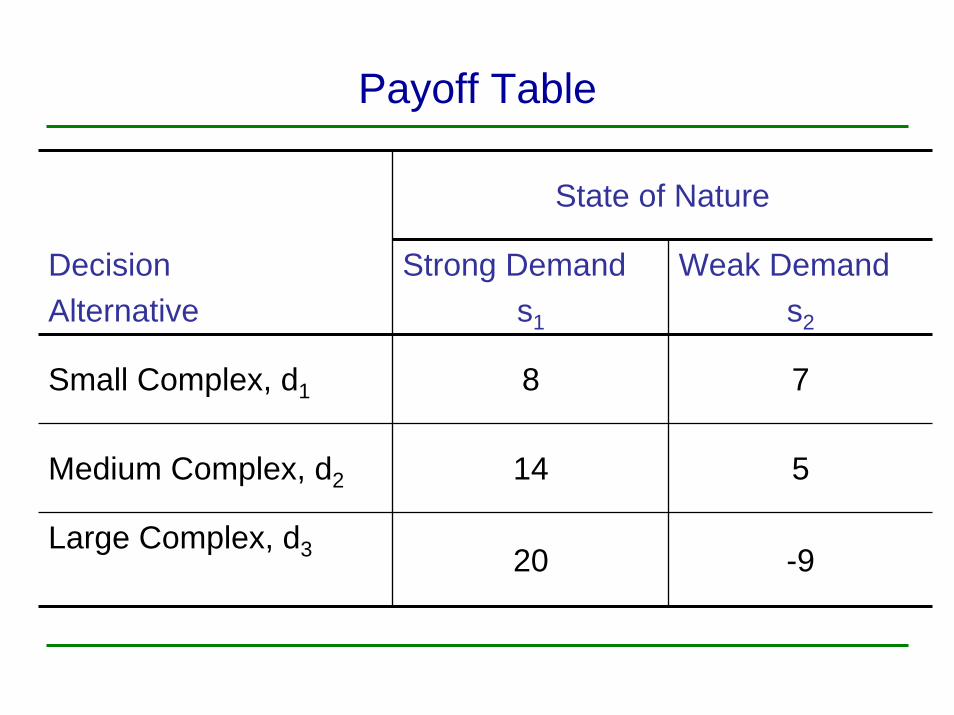
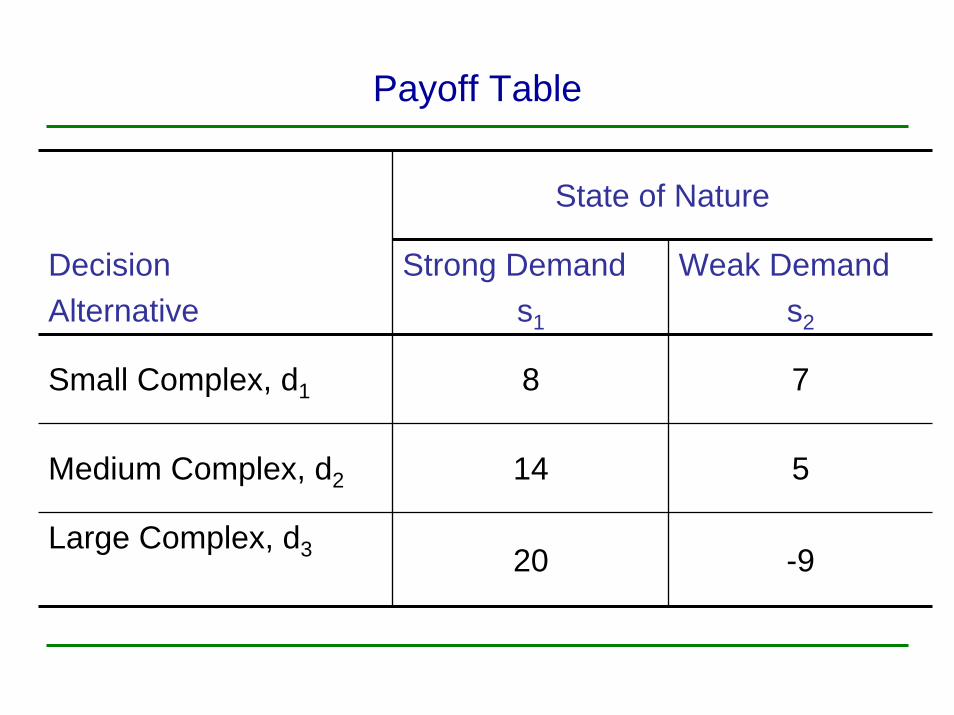
Payoff Table
State of Nature
DecisionAlternative
Strong Demands1
Weak Demands2
Small Complex, d1 8 7
Medium Complex, d2 14 5
Large Complex, d3 20 -9

Decision Tree

Decision Making without Probabilities
• Optimistic Approach• Conservative Approach• Minimax Regret Approach

Optimistic Approach
• Select the highest payoff (for maximization) or lowest payoff (for minimization)
Decision Alternative Maximum Payoff
Small Complex, d1 8
Medium Complex, d2 14
Large Complex, d3 20Maximum of the
maximum payoffs
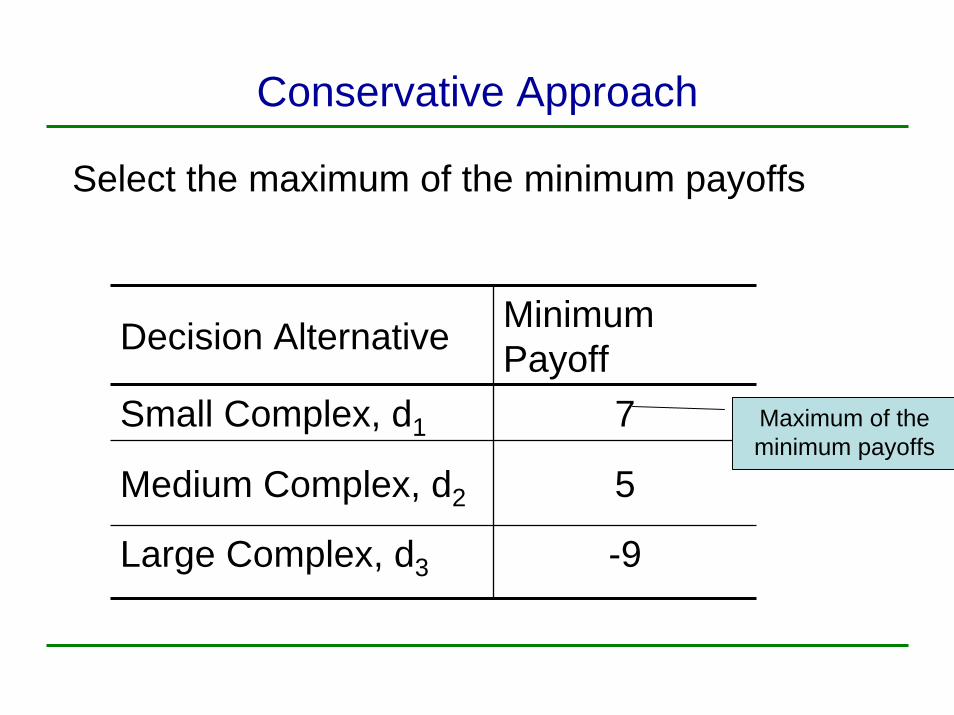
Conservative Approach
Select the maximum of the minimum payoffs
Decision Alternative Minimum Payoff
Small Complex, d1 7
Medium Complex, d2 5
Large Complex, d3 -9
Maximum of the minimum payoffs

Minimax Regret Approach
• An approach between the optimistic and the conservative
• Regret is the opportunity loss between the payoffs of the best decision given a state of nature and the decision you made

Regret Table
State of Nature for Demand
DecisionAlternative
Strong, s1 Weak, s2
Small Complex, d1 12 0
Medium Complex, d2 6 2
Large Complex, d3 0 16

Minimax Regret Approach
Select the minimum of the maximum regrets
Decision Alternative Maximum Regrets
Small Complex, d1 12
Medium Complex, d2 6
Large Complex, d3 16Minimum of the
maximum regrets

Decision Making with Probabilities
j
1
s nature of state theofy probabilit thenature of states ofNumber
)()(:asdefinedisealternativan for valueexpected The
==
∑==
)P(sN
VsPdEVid
j
N
jijji
The Expected Value

The Expected Value
The Expected Value of Perfect Information
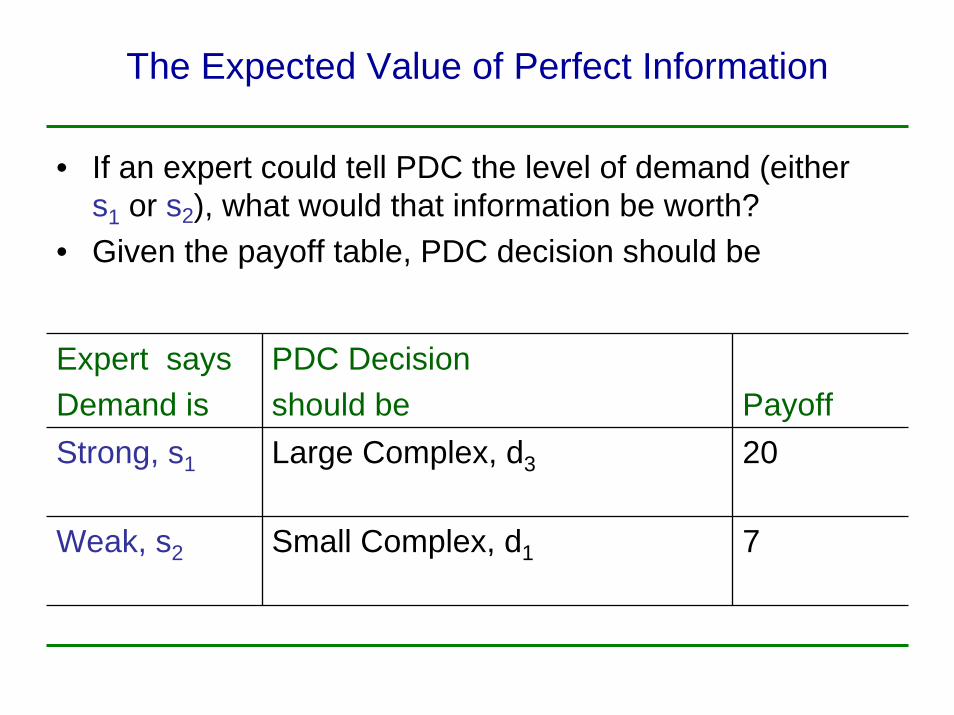
• If an expert could tell PDC the level of demand (either s1 or s2), what would that information be worth?
• Given the payoff table, PDC decision should be
Expert saysDemand is
PDC Decisionshould be Payoff
Strong, s1 Large Complex, d3
Small Complex, d1
20
Weak, s2 7
Payoff Table
State of Nature
DecisionAlternative
Strong Demands1
Weak Demands2
Small Complex, d1 8 7
Medium Complex, d2 14 5
Large Complex, d3 20 -9

The Expected Value of Perfect Information
• The EV of the above strategy is referred to as the EV with perfect information and can be determined as:
EVwPI = 0.8(20) + 0.2(7) = 17.4
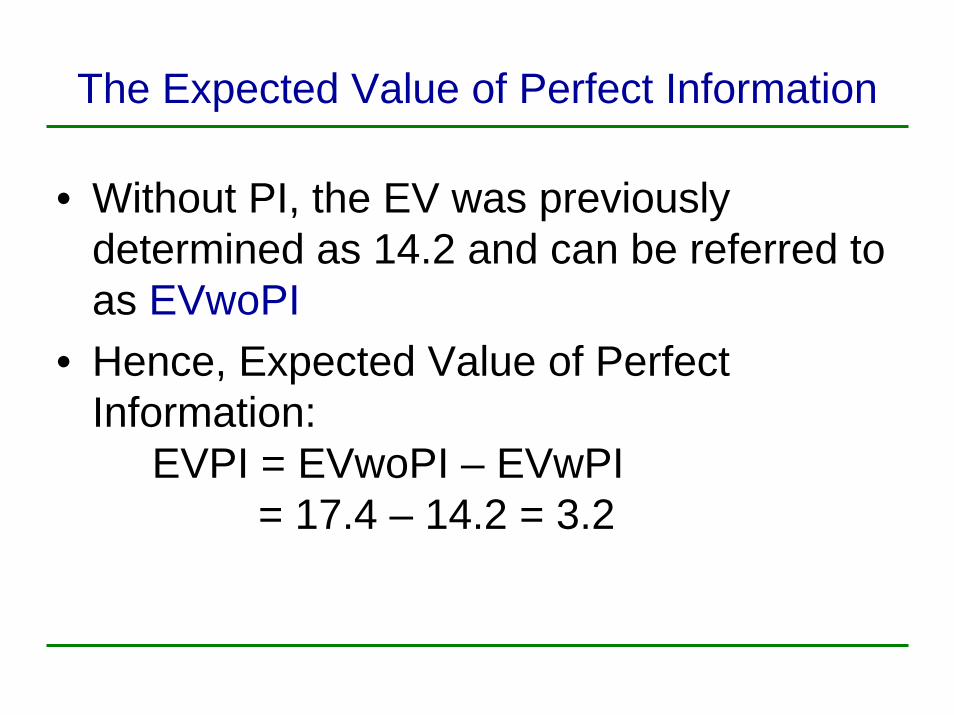
The Expected Value of Perfect Information
• Without PI, the EV was previously determined as 14.2 and can be referred to as EVwoPI
• Hence, Expected Value of Perfect Information:
EVPI = EVwoPI – EVwPI= 17.4 – 14.2 = 3.2

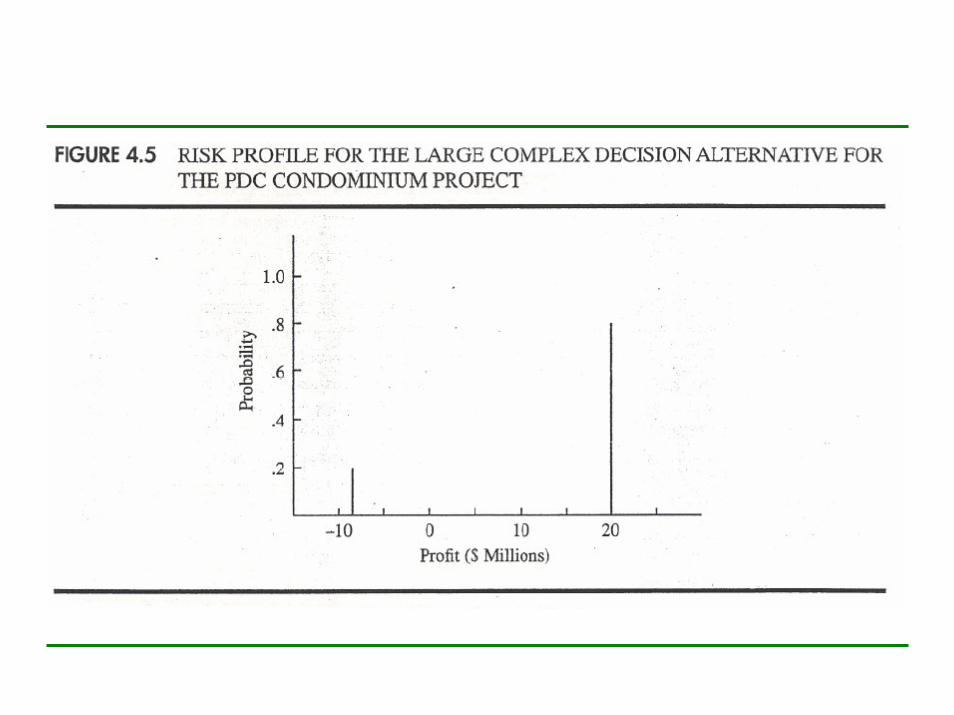
Risk Profile
• A risk profile is a graph showing the probability associated with each of the payoffs for a decision.
• A risk profile gives and indication of the degree of risk of a decision. It helps the decision maker to properly consider the risk and may lead to a decision other than that arrived at by the EV approach.
• Compare d2 and d3


Sensitivity Analysis• A study of how changes in value of one item,
while maintaining the others constant, can effect the solution (decision selected)
• If the decision is changed with minor changes in the value of an item Decision is sensitive to the item Decision maker should try to obtain best estimate of value
• If the decision is not changed even with moderate changes in the value of an item Decision is not sensitive to the item Decision maker should not worry about obtaining better estimate of item.
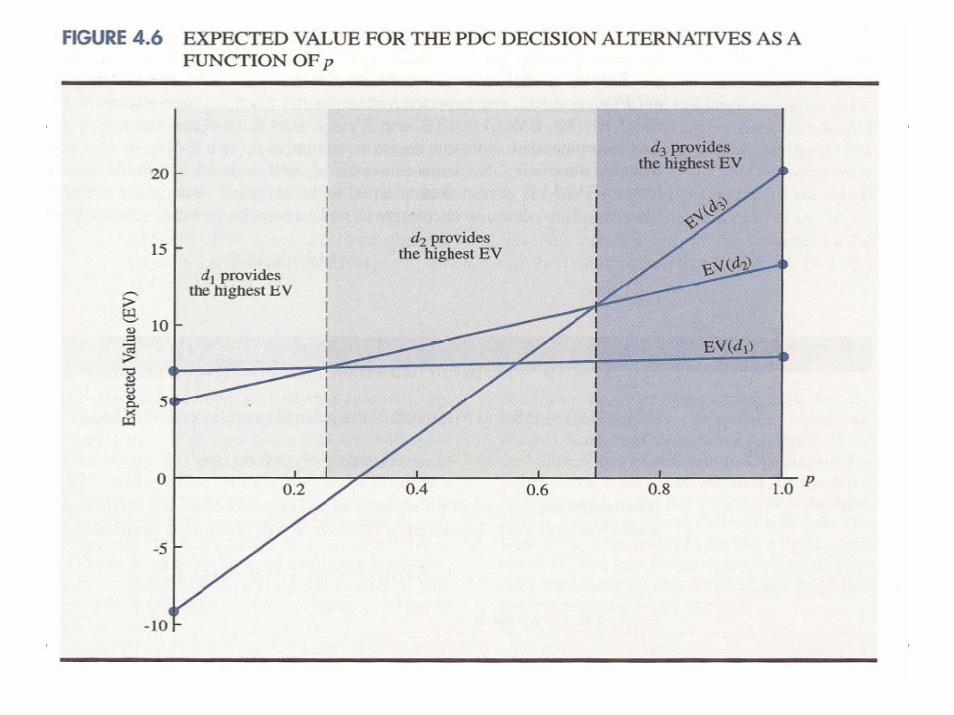

Expected Value as a Function of p
7 8
5
14
-9
20
-15
-10
-5
0
5
10
15
20
25
0 0.1 0.2 0.3 0.4 0.5 0.6 0.7 0.8 0.9 1
Probability
EV
Small, d1Medium, d2Large, d3

Decision Analysis with Sample Information
• Decision maker starts with initial probability assessments (prior probabilities)
• Often the decision maker will decide to do additional studies in order to arrive at better estimates of the probabilities (posterior probabilities)
• The new information is obtained through sampling from the population of concern and thus referred to as sample information.
PDC Decision Considering Sample Information
• PDC wishes to consider a market research study to improve its knowledge of the demand.
• The results of the study will be one of two:– Favorable: indicating interest of a large
number of people in purchasing condominiums
– Unfavorable: indicating interest of only few people in purchasing condominiums
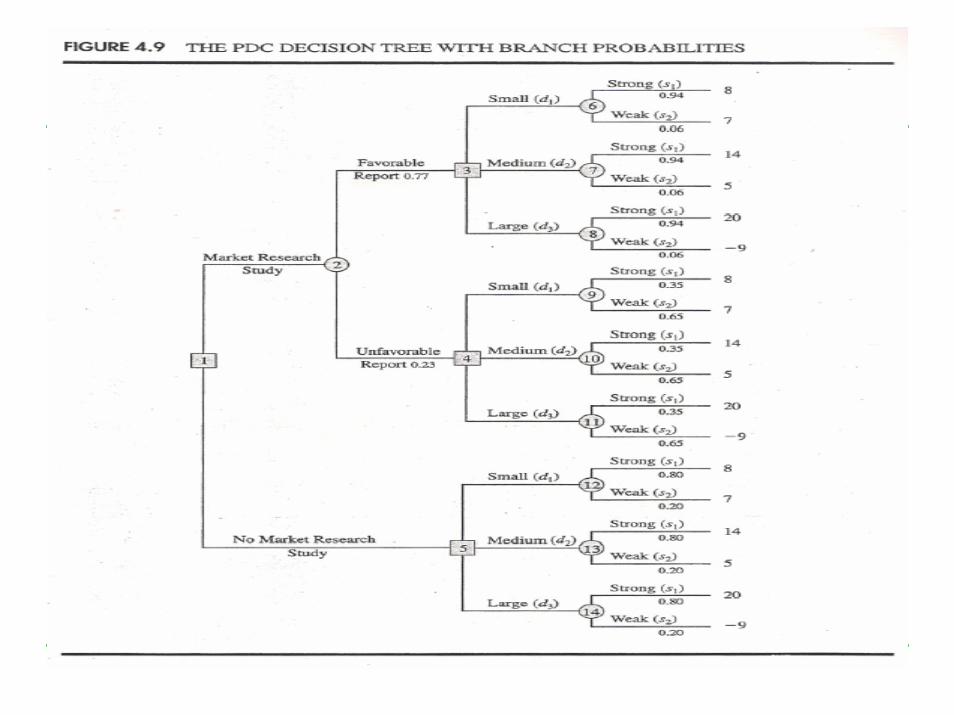
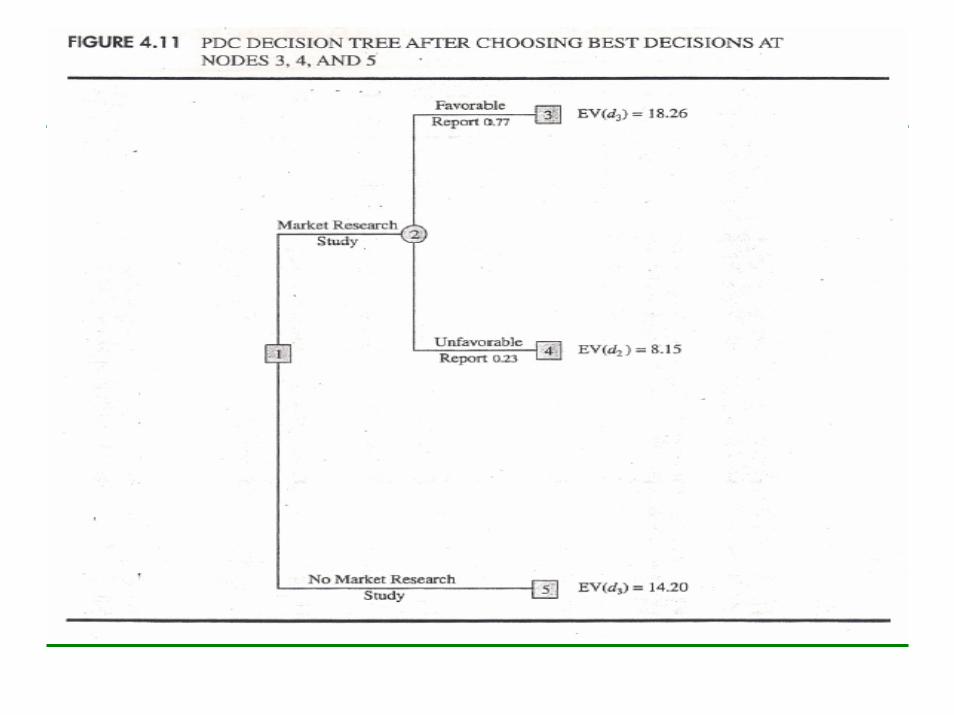
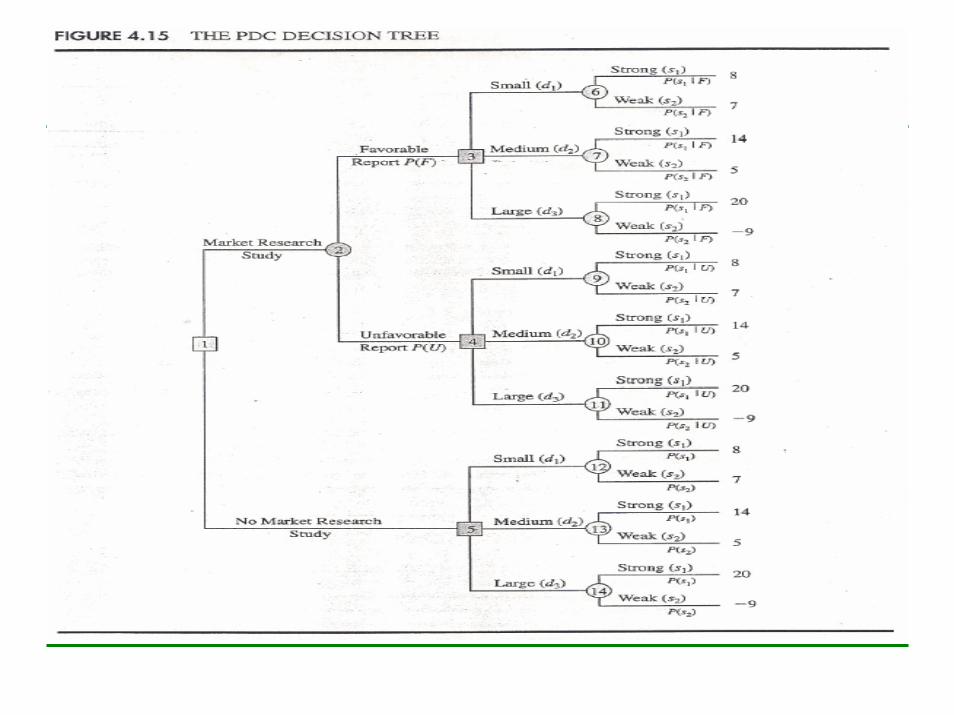
Decision Trees

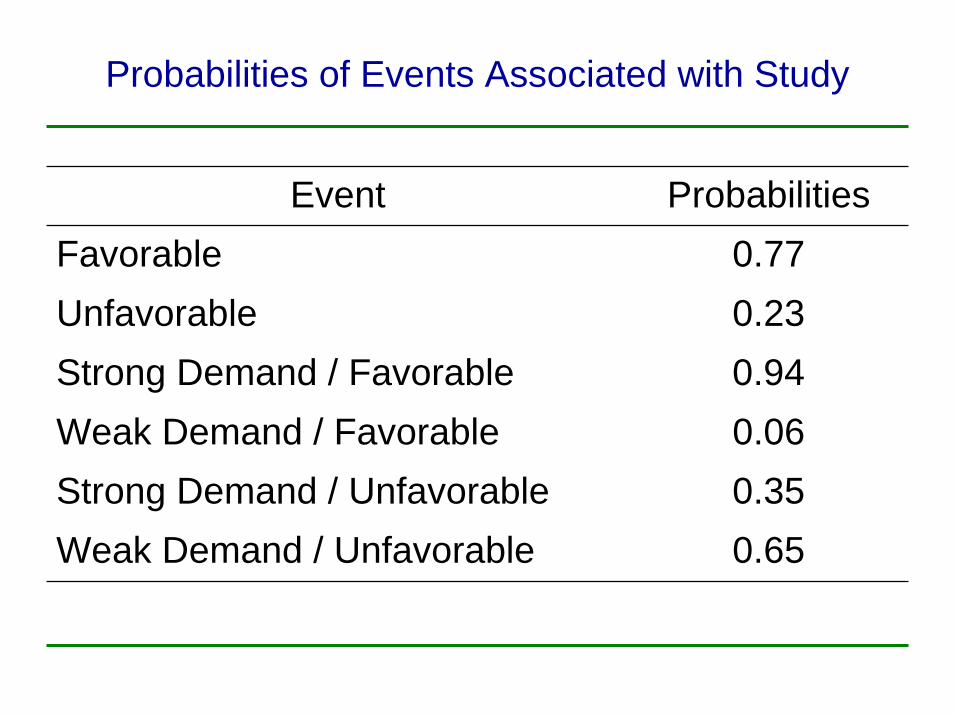
Probabilities of Events Associated with Study
Event ProbabilitiesFavorable 0.77Unfavorable 0.23Strong Demand / Favorable 0.94Weak Demand / Favorable 0.06Strong Demand / Unfavorable 0.35Weak Demand / Unfavorable 0.65


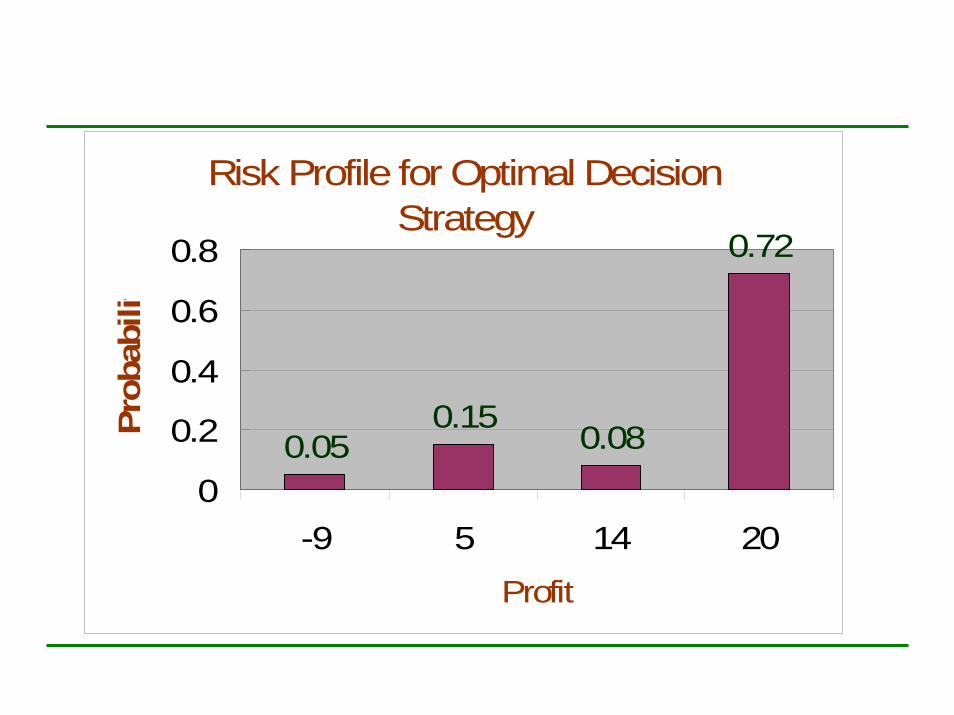
Risk Profile for Optimal Decision Strategy
0.05 0.08
0.72
0.15
0
0.2
0.4
0.6
0.8
-9 5 14 20Profit
Prob
abili
t
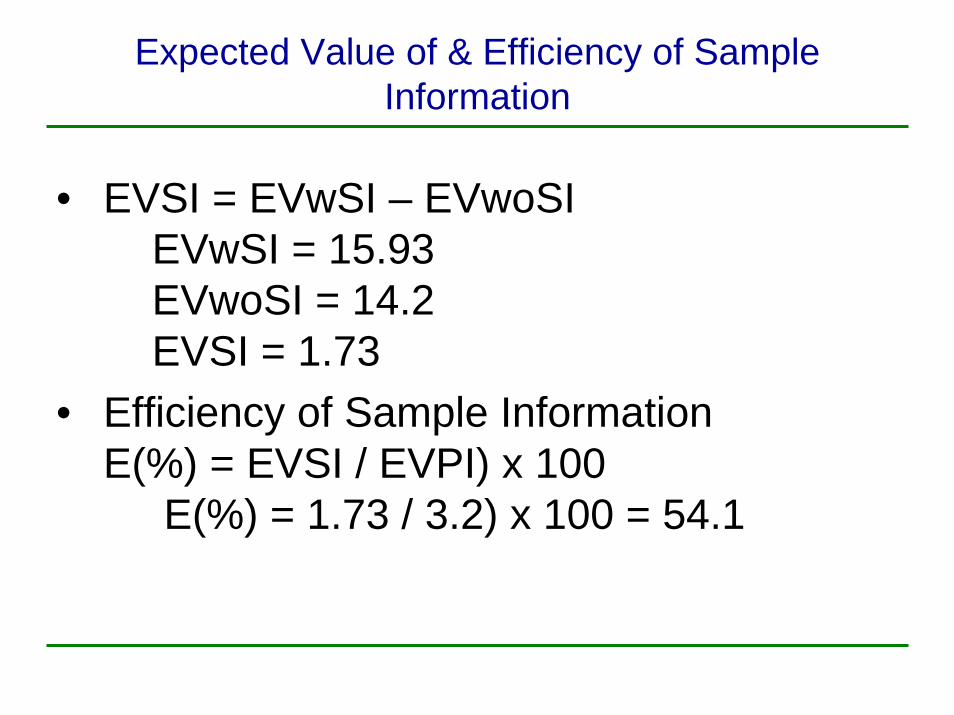
Expected Value of & Efficiency of Sample Information
• EVSI = EVwSI – EVwoSIEVwSI = 15.93EVwoSI = 14.2EVSI = 1.73
• Efficiency of Sample InformationE(%) = EVSI / EVPI) x 100
E(%) = 1.73 / 3.2) x 100 = 54.1

Computing Brach Probabilities
• The Probabilities [P(s1/F), P(s1/U), P(s2/F)] etc. that were used to solve the tree, are referred to as posterior probabilities.
• In order to determine these probabilities we need to know the conditional probabilities of favorable or unfavorable report given the state of nature of a strong or weak demand; that is [P(F/s1), P(U/s1, P(F/s2), P(U/s2)]. This can found from previous results of such studies
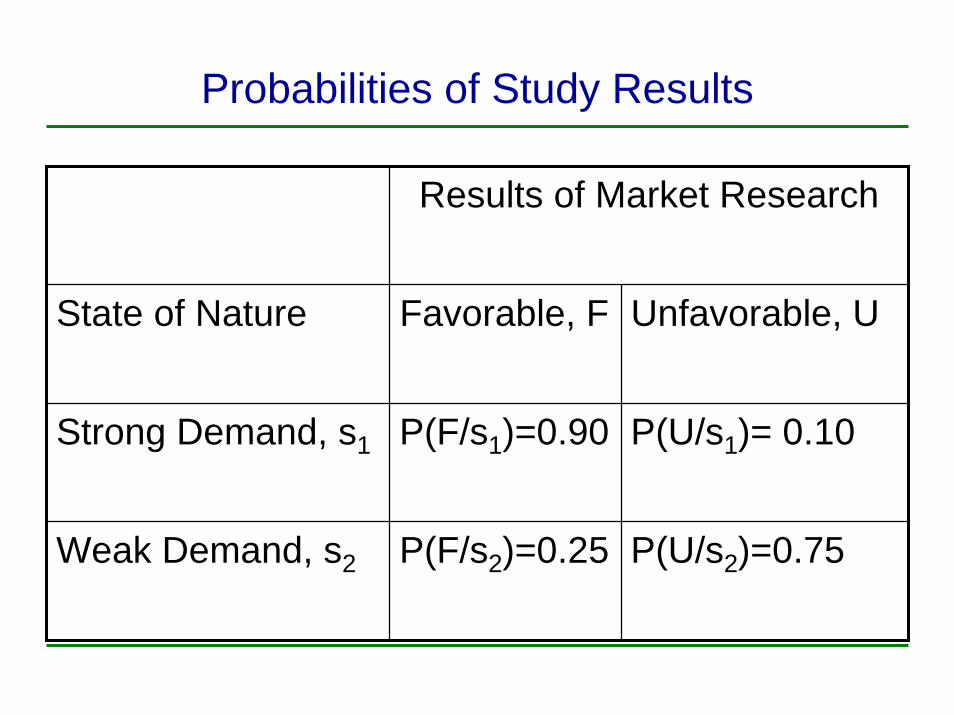
Probabilities of Study Results
Results of Market Research
State of Nature Favorable, F Unfavorable, U
Strong Demand, s1 P(F/s1)=0.90 P(U/s1)= 0.10
Weak Demand, s2 P(F/s2)=0.25 P(U/s2)=0.75

Branch Probabilities for Favorable Market
State of Nature
sj
Prior Probability
P(sj)
Prior Probability
P(F|sj)
JointProbability
P(F∩sj)
Posterior Probability
P(sj|F)
s1 0.80 0.90 0.72 0.94
s2 0.20 0.25 0.05 0.06
P(F) = 0.77 1.00

Branch Probabilities for Unfavorable Market
State of Nature
sj
Prior Probability
P(sj)
Prior Probability
P(U|sj)
JointProbability
P(U∩sj)
Posterior Probability
P(sj|U)
s1 0.80 0.10 0.08 0.35
s2 0.20 0.75 0.15 0.65
P(U) = 0.23 1.00


