Borehole depth decision Page 1 Decision basis for the final depth of the WAIS Divide borehole: Final report Jeff Severinghaus, Chief Scientist for Borehole Deepening and Replicate Coring Professor of Geosciences Scripps Institution of Oceanography Jan. 2, 2012 WAIS Divide, Antarctica
Transcript
Borehole depth decision
Page 1
Decision basis for the final depth of the WAIS Divide borehole: Final report
Jeff Severinghaus, Chief Scientist for Borehole Deepening and Replicate Coring Professor of Geosciences
Scripps Institution of Oceanography
Jan. 2, 2012 WAIS Divide, Antarctica
Borehole depth decision
Page 2
Overview The WAIS Divide ice core deepening process was halted on Dec. 31, 2011 at a true depth of 3400 m (cable depth 3405 m). This choice of stopping depth safely ensures 50 m of environmental barrier to prevent accidental contamination of the subglacial water system by drilling fluid and its associated microbiota. This document describes the factual basis and reasoning of the decision-making process that resulted in the final depth, and other precautions taken to insure stewardship. Introduction In recent decades it has become widely accepted that stewardship of biological resources is a paramount responsibility of all scientists working in Antarctica, especially those drilling into subglacial or near-subglacial environments that may harbor unique life forms adapted to extreme conditions (NRC, 2007). The primary goal of the WAIS Divide ice core project (79.468 S, 112.086 W) is a uniquely high-resolution reconstruction of climate and greenhouse gases, over a time interval that is already well covered by other ice cores (at lower resolution). Thus there is little scientific value lost by stopping just short of the bed. Development of “clean access” technology is still in its infancy as of this writing, so a major technological effort would be required to access the WAIS bed in a way that does not compromise stewardship of the subglacial environment. Taking all these considerations into account, the WAIS Divide Executive Committee made the decision in 2009 to stop drilling 50 m short of the bed. The rationale for this figure of 50 m comes from a desire to leave a 20 m thick impermeable ice barrier between the borehole and the nearest liquid water with hydraulic connections to the subglacial water system. The possibility that englacial plumbing exists near the bed of an ice sheet was highlighted by the sudden penetration of water into the NGRIP borehole while still some 6 meters off the bed. Taking this into account, we chose to add another 20 m buffer as a conservative estimate of the potential distance required to avoid englacial plumbing or bed irregularities. No measurement of remaining ice thickness is perfect, so we added another 10 m buffer to allow for measurement uncertainty, bringing the total to 50 m. This thickness is referred to as the “stewardship thickness”. A contributing factor to the NGRIP encounter with water may have been that the borehole was ~6 bar undercompensated at the time. For this reason we additionally chose to closely pressure-compensate the borehole during the deepening process, to avoid the possibility that a fracture would propagate up from the water system into the borehole. To this end, I accurately measured the pressure at the bottom of the WAIS borehole prior to deepening (and in fact found that it was very nearly compensated, see below). Pursuant to the goal of stopping 50 m short of the bed, two independent methods were employed to measure the remaining ice thickness with high accuracy, downhole seismic (Leo Peters) and downhole sonar (Jakob Schwander). These downhole methods were
Borehole depth decision
Page 3
expected to provide much better accuracy than surface methods of measuring total ice thickness, because the borehole was only about 150 m above the bed compared to >3400 m for the total ice thickness. The expected error of these borehole methods was 1-3 m. Unfortunately, both methods failed to detect the bed. While mechanical malfunction may have contributed, it is probable that the dominant cause of failure is that the bed is composed of unexpectedly low density, water-rich sediment that makes the acoustic impedance contrast low and thus simply very difficult to image with these methods. Our planning for the season had assumed that at least one of these two methods would succeed, and the decision of where to stop drilling would be straightforward. Thus we were forced to fall back on estimates of total ice thickness, in combination with the known borehole depth, to calculate the remaining ice thickness by difference. The uncertainties in total ice thickness are an order of magnitude larger than for the downhole methods, making this approach more difficult.
As the Chief Scientist for Borehole Deepening and Replicate Coring, it was my predesignated responsibility to make the decision of where to stop drilling (see attached documents, “Process for deciding how deep to drill the WAIS Divide borehole”, and “Role of the Science Coordination Office Representative, WAIS Divide Ice Core Project”). However, based on a letter from Karl Erb dated Nov. 9, 2011, it appears that Don Voigt was granted the ultimate authority over this decision (see attached letter). As it turned out, Don and I worked collaboratively to make the decision and Don gave his approval on the final choice.
Decision making process After the second downhole method failed (sonar), I collected and scrutinized all available existing information on total ice thickness. These fall into three general categories: radar, surface seismic (in which geophones are placed on the surface rather than down the borehole), and thermal models that start with Gary Clow’s precise temperature log and the observed age-depth relationship in the core, to infer bed depth given a particular assumed value of the melting point. Radar Three prior studies had imaged the bed with radar, the airborne University of Texas Institute for Geophysics (UTIG) survey (Morse et al., 2002), a surface study by Conway et al. (2005) that was conducted as part of site selection for the WAIS Divide core, and the CRESIS surface radar study done around the borehole site (Laird et al., 2006). Because ice and water are so very different in their dielectric properties (dielectric constant of 3.15 for ice, 81 for water), radar has no problem detecting this particular bed. Both the Conway (3465 m) and CRESIS (3470 m) findings described very bright reflectors that were tentatively interpreted as indicating the presence of water and a relatively flat, smooth bed (the UTIG survey did not overfly the ice core site exactly). Uncertainty estimates were not provided in the papers, however.
Borehole depth decision
Page 4
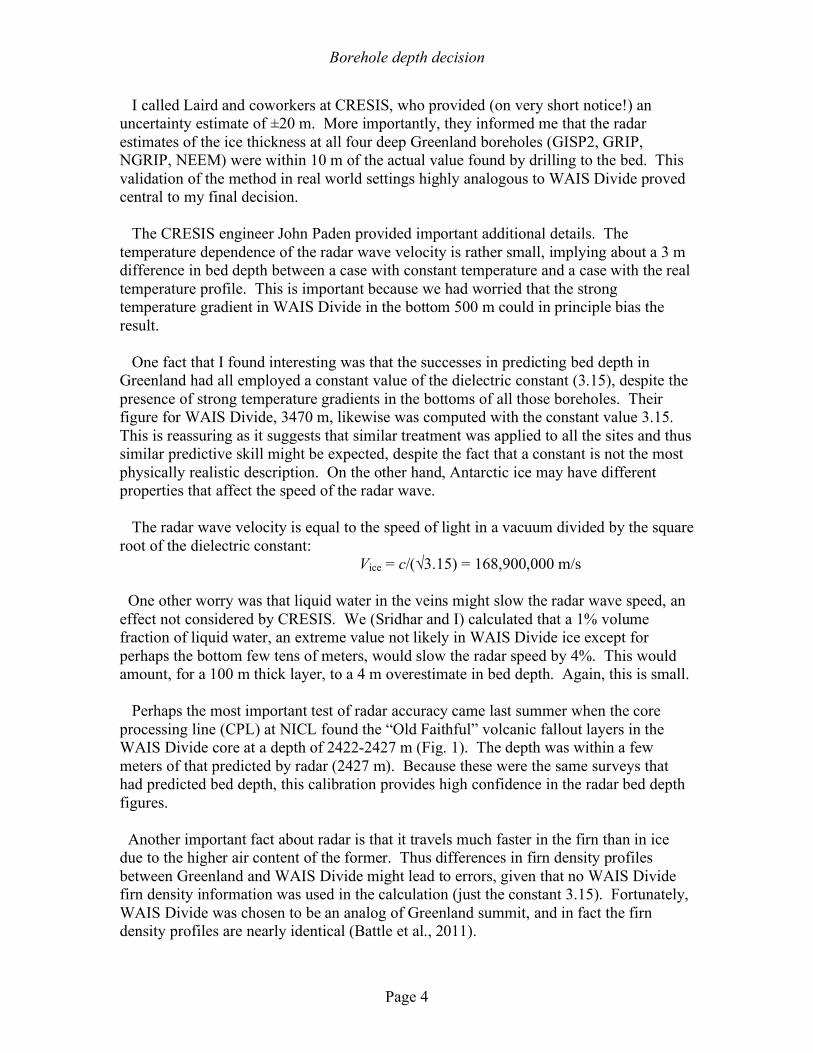
I called Laird and coworkers at CRESIS, who provided (on very short notice!) an uncertainty estimate of ±20 m. More importantly, they informed me that the radar estimates of the ice thickness at all four deep Greenland boreholes (GISP2, GRIP, NGRIP, NEEM) were within 10 m of the actual value found by drilling to the bed. This validation of the method in real world settings highly analogous to WAIS Divide proved central to my final decision. The CRESIS engineer John Paden provided important additional details. The temperature dependence of the radar wave velocity is rather small, implying about a 3 m difference in bed depth between a case with constant temperature and a case with the real temperature profile. This is important because we had worried that the strong temperature gradient in WAIS Divide in the bottom 500 m could in principle bias the result. One fact that I found interesting was that the successes in predicting bed depth in Greenland had all employed a constant value of the dielectric constant (3.15), despite the presence of strong temperature gradients in the bottoms of all those boreholes. Their figure for WAIS Divide, 3470 m, likewise was computed with the constant value 3.15. This is reassuring as it suggests that similar treatment was applied to all the sites and thus similar predictive skill might be expected, despite the fact that a constant is not the most physically realistic description. On the other hand, Antarctic ice may have different properties that affect the speed of the radar wave. The radar wave velocity is equal to the speed of light in a vacuum divided by the square root of the dielectric constant:
Vice = c/(√3.15) = 168,900,000 m/s One other worry was that liquid water in the veins might slow the radar wave speed, an effect not considered by CRESIS. We (Sridhar and I) calculated that a 1% volume fraction of liquid water, an extreme value not likely in WAIS Divide ice except for perhaps the bottom few tens of meters, would slow the radar speed by 4%. This would amount, for a 100 m thick layer, to a 4 m overestimate in bed depth. Again, this is small. Perhaps the most important test of radar accuracy came last summer when the core processing line (CPL) at NICL found the “Old Faithful” volcanic fallout layers in the WAIS Divide core at a depth of 2422-2427 m (Fig. 1). The depth was within a few meters of that predicted by radar (2427 m). Because these were the same surveys that had predicted bed depth, this calibration provides high confidence in the radar bed depth figures. Another important fact about radar is that it travels much faster in the firn than in ice due to the higher air content of the former. Thus differences in firn density profiles between Greenland and WAIS Divide might lead to errors, given that no WAIS Divide firn density information was used in the calculation (just the constant 3.15). Fortunately, WAIS Divide was chosen to be an analog of Greenland summit, and in fact the firn density profiles are nearly identical (Battle et al., 2011).
Borehole depth decision
Page 5
Figure 1. Validation of the radar method using the Old Faithful radar reflector.
Borehole depth decision
Page 6
John Paden re-ran the WAIS Divide radar estimate using some actual DEP (dielectric profiling) data, and this produced a 7 m reduction in the calculated depth (3463 m). This gives some rough indication of the sensitivity of the result to variations in dielectric properties, and may suggest that the higher impurity contents in Greenland ice than Antarctic ice lead to slightly slower velocities in Greenland. This would suggest that Antarctic depths are slightly overestimated when using the 3.15 value, consistent with the slightly deeper (~2 m) radar estimate of Old Faithful than seen in the core. [Because of borehole inclination, the true depth of Old Faithful is 4 m less than its core depth, so the radar depth is in fact in error by ~6 m.] Taken together, all these observations suggest that the radar central estimate of WAIS Divide depth could be about 3460 m, but it seems premature to make corrections due to many remaining uncertainties. The 20 m error bar on the radar estimate seems to adequately subsume these small potential biases, in any case. Surface seismic Several weeks ago Leo Peters and Sridhar Anandakrishnan performed a total ice thickness measurement at WAIS Divide using surface geophones, in addition to their downhole experiment. A report of the results is attached. Briefly, the powerful aspect of this method is that they essentially calibrate the seismic velocity locally by detecting the direct arrival of a wave from the explosion at the surface, with the borehole seismometer at 3330 m. Thus any imperfectly known velocities in firn are essentially canceled or calibrated out. Then they apply this local velocity to the reflection off the bed, which was weak but adequate. This gives 3450 ±30 as the total ice thickness. They go one step further and subtract the then-current borehole depth of 3330 m, obtaining 120 ±30 m of remaining ice. [However, they did not make a correction for borehole inclination, so their result should be updated to 125 ±30 m of remaining ice.] The main reason that the surface seismic did succeed in imaging the bed, but the downhole one did not, is that the downhole seismometer was not coupled to the ice due to the failure of a wall lock during a test. It is also possible that there are local variations in the impedance contrast of the bed, for example due to inhomogeneous water distribution or variable degrees of sediment cementation, and our core site happens to sit on top of a low-impedance contrast spot such that the downhole methods could not “see” the bed. As the spatial footprint of the surface observations is larger (~500 m) it may have picked up some areas with higher impedance contrast. The uncertainty in this experiment (±30 m) is mainly due to the fact that the direct signal arrival at the downhole seismometer was not perfectly impulsive and thus the picking uncertainty was larger than in an ideal case (due in part to failure of the wall lock). The estimated uncertainty in bulk ice velocity is 15 m s-2, leading to an uncertainty in total ice thickness of 27 m. Several other small sources of error brought the total uncertainty to ±30 m.
Borehole depth decision
Page 7
Thermal/Dansgaard-Johnsen ice flow models Gary Clow’s precision temperature log (Fig. 2), taken at the beginning of the season, can in principle provide a powerful constraint on bed depth due to the fact that heat conduction, advection, and production obey well-known physical laws. Ed Waddington, Gary Clow, and Jakob Schwander all separately modeled the profile, and obtain very similar results using a variety of methods. Jakob’s and Ed’s included an ice flow model, and Ed’s included the transient from the last glacial period, whereas Jakob’s was steady state. The one major unknown, however, is the melting point. The pressure melting point for pure water at WAIS Divide depths is -2.7 ˚C (Cuffey and Paterson, 2010). However, the thermal models using this figure seem to predict very deep beds that are in conflict with the other bed estimates. Thus it seems probable that there is some freezing point depression at WAIS, which lowers the melting point to around -4˚C. Salts seem an unlikely candidate for this freezing point depression due to the steady melting over millennia of major volumes of water, which should have washed all the salts away. However, gases may provide the needed freezing point depression. Air in glacial ice is normally released as the air is delivered to the melting bed, and goes into solution. It is then transported down the subglacial water system with the water, so it does not accumulate (unless there is freeze-on, which rejects gases, causing them to accumulate to extreme concentrations, such as at Lake Vostok).
Figure 2. Heat/ice model constraints on bed depth, from Gary Clow’s temperature log.
Conway
Borehole depth decision
Page 8
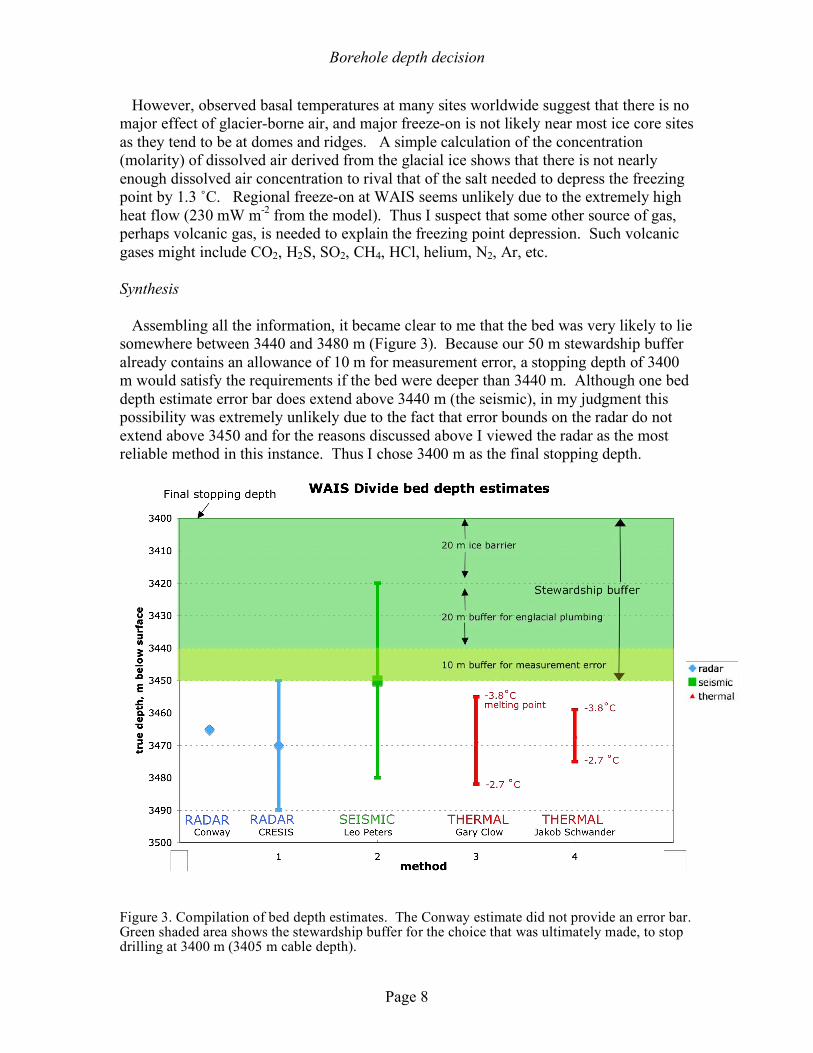
However, observed basal temperatures at many sites worldwide suggest that there is no major effect of glacier-borne air, and major freeze-on is not likely near most ice core sites as they tend to be at domes and ridges. A simple calculation of the concentration (molarity) of dissolved air derived from the glacial ice shows that there is not nearly enough dissolved air concentration to rival that of the salt needed to depress the freezing point by 1.3 ˚C. Regional freeze-on at WAIS seems unlikely due to the extremely high heat flow (230 mW m-2 from the model). Thus I suspect that some other source of gas, perhaps volcanic gas, is needed to explain the freezing point depression. Such volcanic gases might include CO2, H2S, SO2, CH4, HCl, helium, N2, Ar, etc. Synthesis Assembling all the information, it became clear to me that the bed was very likely to lie somewhere between 3440 and 3480 m (Figure 3). Because our 50 m stewardship buffer already contains an allowance of 10 m for measurement error, a stopping depth of 3400 m would satisfy the requirements if the bed were deeper than 3440 m. Although one bed depth estimate error bar does extend above 3440 m (the seismic), in my judgment this possibility was extremely unlikely due to the fact that error bounds on the radar do not extend above 3450 and for the reasons discussed above I viewed the radar as the most reliable method in this instance. Thus I chose 3400 m as the final stopping depth.
Figure 3. Compilation of bed depth estimates. The Conway estimate did not provide an error bar. Green shaded area shows the stewardship buffer for the choice that was ultimately made, to stop drilling at 3400 m (3405 m cable depth).
Borehole depth decision
Page 9
Sonar Although the sonar was unable to detect the bed, it raised interesting questions about the nature of the sediment, or other properties of the bed that would make it “invisible”.
Figure 4. Sonar results from Jakob Schwander’s pinger. The signal of the bed is expected in the range of 30 to 40 milliseconds, independent of tool depth. The tool was raised in the hole and data collected at successively larger distances from the hole bottom, which creates the observed time-transgressive reflector. These data highlight just how weak the impedance contrast between bed and underlying sediment must be, by the lack of any signal.
Borehole depth decision
Page 10
Pressure-compensating the borehole for stewardship purposes The first task was to calculate the ice hydrostatic pressure. This was done by measuring or estimating the ice density and integrating its product with the local acceleration of gravity. The value of gravity used was from an absolute reference point at Thwaites Surface Camp (9.8248 m s-2, Diehl et al. 2008; with depth increase in the ice of +0.21 mgal m-1). Measured density in the WDC05A core, drilled ~2 km from the main borehole, was used for the upper 110 m of the density profile, and after that density was calculated from Bader’s ice density formula and Gary Clow’s temperature log, combined with a bubble volume calculated on the assumption that the bubbles were at hydrostatic pressure. Below 800 m partial (1300 m pure) clathrates were assumed, and a small correction was made for the fact that clathrate is slightly less dense than ice (-2.4 g m-3). The density of the entire column (including the firn) was adjusted for compression with an adiabatic compressibility of 1.1 x 10⁻¹⁰ Pa-1 (Zumberge et al. 1990).
Figure 5. Density profile of ice used to calculate actual ice hydrostatic pressure. Next, a highly accurate pressure measurement was made in the borehole fluid for comparison with the calculated ice pressure. The measurement was done with two logging pressure transducers on loan from Mark Zumberge at Scripps Institution of Oceanography, who uses them in the deep ocean. The actual pressure transducer is made by Paroscientific and has a manufacturer’s stated accuracy of 100 ppm (0.3 m of water at
Borehole depth decision
Page 11
3400 m) and a precision of 0.02 m of water. I had the two units calibrated for absolute pressure just prior to departing for Antarctica at the Scripps Institution’s Nimitz Marine Facility, using a deadweight tester that is accurate to 0.2 m of water. The units were immersed in a -8.9 C ethanol bath to mimic WAIS borehole bottom temperature and calibrated over the relevant range of 2800-3200 m water equivalent (Figure 6).
Figure 6. Absolute pressure calibration results. A mass of precisely known weight is placed on a piston of precisely known surface area, giving an absolute pressure on a fluid (mineral oil) that is connected to the pressure loggers. The loggers are maintained in a bath at -8.9˚C.
Borehole depth decision
Page 12
The two pressure loggers were deployed inside the chip chamber of the DISC drill, where they fit snugly. One stop on the way down was made at 2000 m. The loggers were allowed to sit on the bottom for 30 min. The result indicated a pressure at the bottom equivalent to 25 m of undercompensation (0.92 density equivalent), and a pressure at 2000 m depth that is 45 m undercompensated. This latter is not surprising because the fluid is compressible so it has a higher density in the lower part of the borehole. An alternative, less precise method (Method 2 in planning documents) is to use measured density data in the borehole fluid, with compressibility taken into account. This method gave 29.8 ±0.3 MPa, consistent with the pressure measurement. I considered the 25 m to be small enough that no fluid need be added for the deepening process. IDDO was informed and they will implement the compensation in the next few weeks. These undercompensation figures apply to the situation when the DISC drill is at the bottom of the 3330 m fluid column. Jakob calculated the volume of the cable and drill to be 15 m of fluid level equivalent. Therefore, if compensation is desired when the drill is not in the hole, then 15 m more fluid should be added (for example, during the winter). Calculation of true borehole depth from inclination data The DISC drill records inclination and azimuth, which means the direction the borehole is pointing when it is not perfectly vertical. Because the hypotenuse of a right triangle is longer than the upright vertical leg, borehole length will generally be slightly longer than vertical depth. The vertical depth can be calculated by multiplying the borehole length, say one meter, by the cosine of the inclination angle. I did this for the WAIS Divide borehole, integrating in one meter increments, finding that true depth is 5 m less than cable depth at 3330 m.
Figure 8. Onboard sensor data from the DISC drill during one of its final runs of the 2010-2011 season. Note the coherent oscillations in azimuth and inclination, as expected for helical “corkscrewing”, with inclination lagging azimuth by 90˚.
Borehole depth decision
Page 13
Although the azimuth data has had issues in the past, it seems fairly stable in this data set and consistently stays around 200 deg or S. IDDO staff confirmed that the data are referenced to a datum of true North. This suggests that the borehole bottom is located about 160 m to grid east of the drilling arch (Figure 9). Interestingly, the borehole inclination is in the down-flow direction, as if the fabric had influenced the inclination direction during drilling. It is not clear at this point why the fabric, which is a vertical girdle, would have this effect.
Figure 9. Radar estimates of ice thickness, newly reprocessed by John Paden, from the CReSIS survey. The y axis is parallel to the zero longitude meridian (Greenwich is toward the top of the image; Polar Stereographic Projection). Arrow shows true (geographic) North. Contour interval 5 m. Ice flow is from left to right. Black lines show the survey tracks, and gaps show where data was not acquired. The surface position of the borehole is shown by the circle with a cross in it; the position of the bottom of the borehole is just to the right of it (~160 m grid east). The reprocessed ice thickness is 3460 m, 10 m less than the original estimate of 3470 m.
N
Borehole depth decision
Page 14
_______________________________________________________________________ References Battle, M. O., J. P. Severinghaus, E. D. Sofen, D. Plotkin, A. J. Orsi, M. Aydin, S. A. Montzka, T. Sowers, and P. P. Tans (2011). Controls on the movement and composition of firn air at the West Antarctic Ice Sheet Divide. Atmos. Chem. Phys. 11, 11007-11021. Conway, H., T.A. Neumann, S. Price, D. Morse, P.A. Mayewski, D. Dixon, K. Taylor and E.D. Waddington (2005). Candidate drill sites near the Ross-Amundsen ice divide, West Antarctica. US Ice Core Working Group, available online http://nicl-smo.sr.unh.edu/icwg/ Cuffey, K. M. and W. S. B. Paterson (2010). The Physics of Glaciers, 4th ed., Pergamon, Oxford, U. K. Diehl, T.M., Holt, J.W., Blankenship, D.D., Young, D.A., Jordan, T.A., Ferraccioli, F., 2008. First airborne gravity results over the Thwaites Glacier catchment, West Antarctica. G-cubed, DOI:10.1029/2007GC001878. Diehl, T.M., 2008. Gravity Analyses for the Crustal Structure and Subglacial Geology of West Antarctica, Particularly Beneath Thwaites Glacier. Doctoral Dissertation, University of Texas, 2008. Hammer, C. U., H. B. Clausen, and C. C. Langway, Jr. (1994). Electrical conductivity method (ECM) stratigraphic dating of the Byrd Station ice core, Antarctica, Ann.Glaciol. 20, 115–120. Jacobel, R., and B. C. Welch (2005), A time marker at 17.5 kyr BP detected throughout West Antarctica, Ann. Glaciol. 41, 47–51. Laird, C. M., W. A. Blake, K. Matsuoka, H. Conway, C. T. Allen (2010). Deep Ice Stratigraphy and Basal Conditions in Central West Antarctica Revealed by Coherent Radar, IEEE Geoscience and Remote Sensing Letters 7, 246-250. Morse, D., D.D. Blankenship, E.D. Waddington, T.A. Neumann (2002). A site for deep ice coring in West Antarctica: results from aerogeophysical surveys and thermo-kinematic modeling Annals of Glaciology 35, 36-44. Neumann, T. A., H. Conway, S. F. Price, E. D. Waddington, G. A. Catania, and D. L. Morse (2008), Holocene accumulation and ice sheet dynamics in central West Antarctica, J. Geophys. Res. 113, F02018, doi:10.1029/2007JF000764. NRC (2007). Exploration of Antarctic Subglacial Aquatic Environments: Environmental and Scientific Stewardship. The National Academies Press, Washington D.C. 166p Zumberge, M. et al. 1990. The Greenland Gravitational Constant Experiment. J. Geophys. Res. 95, 15483-15501. The next pages are attached supporting documents.
Borehole depth decision
Page 15
Process for deciding how deep to drill the WAIS Divide borehole During the 2011/2012 field season we will have the opportunity to deepen the WAIS Divide Borehole. It is essential that the hole not make a hydraulic connection to a basal water layer, for biological stewardship reasons. If we are confident that the bed is frozen and there is not a basal water layer, we can safely drill as deep as possible including recovering some soft sediments (which would have a large science return as marine diatoms of last interglacial age may be present). If there is even a remote possibility that there is a liquid water layer at the bed, we must stop drilling above the bed to insure that a hydraulic connection is not formed. To maximize the science return we intend to drill as deep as possible with the available equipment, while always being confident that a hydraulic connection will not be created. Highly accurate (±0.01˚C) and precise (±0.001˚C) borehole temperature measurements will be made at the initiation of the season to determine the existing temperature gradient at the bottom of the hole. These measurements will be made before other operations have disturbed the thermal state of the borehole. Seismic measurements will be made to determine the amount of ice remaining below the borehole. Both the temperature and seismic measurements will include an estimate of the uncertainty of the measured values. The maximum expected basal temperature will be estimated using the information from the borehole temperature and seismic measurements. Ice melts at -2.7 ±0.1oC at the pressure present at the bottom of the ice sheet. Additional logging may be performed at any time during the deepening process to refine the estimate of the maximum expected basal temperature. The Lead Driller’s primary responsibility is for the safety of the drilling crew and equipment. A secondary responsibility is to collect core as deep as requested by the Chief Scientist for Borehole Deepening and Replicate Coring (Severinghaus). The Chief Scientist for Borehole Deepening and Replicate Coring is responsible for making the decision of how deep to drill following the procedures presented below. The SCO Representative (Voigt) is responsible for the safety of the science crew, and also has the authority stop the drilling or any science activity at any time if safety is jeopardized. The Chief Scientist for the WAIS Divide ice core project (Taylor, who will not be in the field) will review the decisions made in the field to the extent that is practical. If the maximum expected basal temperature (taking into account all uncertainties) is colder than -5oC, the bed will be considered to be safely frozen. [The 2.3˚C difference between this threshold and the melting temperature is a conservative buffer to allow for possible unknown factors.] In this case drilling may continue as deep as possible, perhaps even into the bed. Drilling will be halted when the drill is unable to penetrate deeper, or drilling is halted by either 1) the Lead Driller, 2) the Chief Scientist for Borehole Deepening and Replicate Coring, or 3) the SCO Representative. If the maximum expected basal temperature is warmer than -5oC, it will be considered possible that a liquid water layer is present at the bed. In this case drilling will continue until there is 50 m of ice below the borehole. This 50 m of ice is called the “stewardship buffer” and is intended to conservatively insure that at least 20 m of fluid-impermeable barrier remains, taking into account measurement uncertainties and the possibility of englacial plumbing or bed irregularities. During drilling the fluid level in the borehole will be adjusted to a near-neutral state of pressure compensation to reduce the risk of a fracture propagating up from the bed into the borehole. Written by Jeff Severinghaus and Kendrick Taylor 6/30/11, updated by JS 8/31/11
Borehole depth decision
Page 16
Role of the Science Coordination Office Representative, WAIS Divide Ice Core Project
The role of the Science Coordination Office Representative (SCO Rep) is to represent the interests of the WAIS Divide ice core science community at the WAIS Divide Ice Core Project site (WSD) for the 2011-2012 Antarctic field season.
The SCO Rep will have authority over all scientific activities and staff at WSD that are related to the WAIS Divide ice core project, except where noted below with asterisks. The SCO-Rep is the POC for all science operations that happen in the field. He is tasked with finding and implementing the best balance between the goals established by the Chief Scientists for borehole logging and replicate coring, the individual PIs, and RPSC and IDDO. The SCO Rep will be the main interface between the science community and RPSC and IDDO during the 2011-2012 field season. Specifically, the SCO Rep will be the lead on the following:
• Safety of the borehole logging and ice core logging operations, and all science staff. This may include setting mandatory training requirements and procedures, or issuing stop orders for any activity involving science staff.
• Scheduling the deployment of all science staff to WSD. • Representing all WSD science groups to the RPSC work centers while in MCM. • Safety training for all science personnel while in McMurdo and at WSD. • Deployment of the borehole logging winch. The technical details will be worked out
by the Chief Scientist for borehole logging and IDDO. • The ice core handling operations. • Collection and processing of the ice core while consulting with NICL for proper
handling and archiving of the core. • Decisions on priorities of operations and determining how much time to spend on
borehole logging, deepening the main hole, and replicate coring. These decisions will be made after consultation with the Chief Scientists and support staff on site. If it is practical the Science Coordination Office and the WSD Executive Committee will be included in the decision making process.
• Activities that involve RPSC, IDDO, and the PIs for borehole logging. • Αctivities that involve RPSC, IDDO and the Chief Scientist for replicate coring and
deepening of the main borehole. This includes issues related to core quality and production rate and being the main science interface with IDDO.
• Supervising the SCO science technicians. • Regular reporting to NSF and the SCO of conditions at WSD and progress of the
borehole logging and coring operation.
The SCO Rep will coordinate science and RPSC operations before and throughout the field season on issues related to cargo, flights, personnel movements, training, supplies, and camp support. The SCO Rep will also coordinate science requests and IDDO
Borehole depth decision
Page 17
operations before and throughout the field season on issues related to access to the borehole, IDDO support of borehole logging operations, deepening the main hole, replicate coring and the hand off of core to the core handling operations.
Prior to the 2010-2011 field season the SCO Rep will assist with planning for the season, coordination of logistics and preparation of the SIP. The SCO Rep and SCO will work with science technicians hired for the season to enable the team to be prepared for the season. This includes completion of an NSF required medical and dental exam, a visit to the National Ice Core Laboratory during this summer’s core processing, attendance at the WAIS Divide science meeting held in La Jolla, CA during October, and travel to Antarctica at the start of the season.
****Decisions regarding how much to deepen the main hole, and where to replicate core, will be made by the Chief Scientist for replicate coring. If practical the WSD Executive Committee will be consulted while making these decisions.
****Decisions regarding the sequence and time allotted to specific borehole logging operations will be made by the Chief Scientist for borehole logging.
As of April 2, 2011, the following positions are filled by the stated individuals.
Science Coordination Office Representative: Don Voigt
Chief Scientist for borehole logging: Gary Clow
Chief Scientist for replicate coring and deepening the main hole: Jeff Severinghaus
The Field Chief Scientist for the 2011/2012 WAIS Divide field season will be determined by NSF at a later date. Normally NSF does not make this announcement until November.
Kendrick Taylor
Chief Scientist, WAIS Divide Ice Core Project
Research Professor, Desert Research Institute
Borehole depth decision
Page 18
Borehole depth decision
Page 19
Borehole depth decision
Page 20
Borehole depth decision
Page 21
the borehole seismometer. While a firn velocity profile has been calculated for the area, the assumption is that this profile is constant at each source location, the borehole, and the surface geophone array; this contributes <5m of depth uncertainty. The lowermost ice velocity is derived from the difference between the average velocity to the base of the borehole and the RMS velocity calculated from the surface geophone array; this also contributes <5m of uncertainty given the remaining thickness of ice beneath the drill site. The uncertainty within the overall velocity of the ice to the base of the borehole contributes ∼30m of uncertainty. The location uncertainty of the seismic sources and the zero mark of the borehole contributes <5m to the depth uncertainty. Considering the inclination of the borehole itself, the position of the seismometer at the base of the borehole contributes a maximum of <5m to the depth uncertainty. At this point, a best estimate of 120 ±30m of ice remains at the WAIS Divide drill site. Further processing of the seismic data will likely yield a more constrained result, but this will require more time and thorough processing of the data, which will not be completed until after the field season.