Decision-support methodology to manage the efficiency of ground movements in a critical environment Ricardo Mega Machado Disserta¸c˜ ao para a obten¸c˜ ao de Grau de Mestre em Engenharia de Redes de Comunica¸ c˜ oes J´ uri Presidente: Prof. Doutor Paulo Jorge Pires Ferreira Orientador: Prof. Doutor Gabriel C´ esar Ferreira Pestana Vogal: Prof. Doutor Paulo Jorge Fernandes Carreira Outubro de 2011
Transcript
Decision-support methodology to manage the efficiency of groundmovements in a critical environment
Ricardo Mega Machado
Dissertacao para a obtencao de Grau de Mestre em
Engenharia de Redes de Comunicacoes
Juri
Presidente: Prof. Doutor Paulo Jorge Pires Ferreira
Orientador: Prof. Doutor Gabriel Cesar Ferreira Pestana
Vogal: Prof. Doutor Paulo Jorge Fernandes Carreira
Outubro de 2011
Acknowledgements
First of all, I would like to express my sincere gratitude to my supervisor, Prof. Gabriel Pestana, for
his contribution during the development of this thesis. I would like to thank his persistence and effective
interventions both in the research period and the implementation of this project. I also would like to thank
Prof. Joana Matos for her expertise knowledge about routing algorithms, having contributed with several
pertinent remarks.
I am very grateful for having the opportunity to integrate a research group within INESC-Inovacao, which
provided the required technical support to fulfill with expected goals. A special thank to Nuno Magalhaes
for his invaluable help and pertinent ideas resolving a set of issues during the design and development of the
implemented solution.
I also owe the success of this work to my family and friends, mainly for the emotional and affective support
that contributed to my motivation and devotion to accomplish my personal goals. Many of the moments I
spent with them allowed me to retrieve some strength to proceed.
Finally, I would like to thank my girlfriend Maria Joao for her patience and understanding during this
year. Without her love and friendship, it would be impossible to carry out this work.
iii
Resumo
Em ambientes complexos, como e o caso de um aeroporto, os controladores devem ser continuamente infor-
mados sobre as operacoes que estao a decorrer. Este facto requer a implementacao de um mecanismo de
controle capaz de dar suporte, em tempo-real e de forma eficiente, a gestao dos movimentos que ocorrem
no solo. Hoje em dia, os avancos tecnologicos ja permitem a implementacao de diferentes nıveis de servicos
baseados na localizacao por forma a assegurar a seguranca e eficiencia dos movimentos no solo do aeroporto
independentemente do fluxo de transito, do nıvel de visibilidade e da complexidade do espaco aeroportuario.
No entanto, a maioria dos aeroportos modernos ainda sofrem determinadas ineficiencias operacionais nas
situacoes mais complexas (por exemplo nas horas de ponta e em condicoes meteorologicas adversas), cau-
sadas pela organizacao ineficiente dos sistemas e recursos envolvidos, levando por sua vez a uma gestao
deficiente do aeroporto, o que compromete o nıvel de seguranca exigido. Por forma a resolver este problema,
esta tese apresenta uma analise detalhada sobre uma metodologia que implementa os nıveis de encamin-
hamento e guiamento especificados no conceito A-SMGCS, definido pela ICAO e o EUROCONTROL. Esta
analise inclui a implementacao da metodologia proposta com dados de trafego do aeroporto de Lisboa, assim
como a apresentacao de um algoritmo capaz de lidar dinamicamente com os conflitos entre os movimentos e
os desvios das rotas que foram atribuıdas a cada aviao.
Palavras-chave: A-SMGCS, Servicos baseados na localizacao, Encaminhamento, Guiamento, Prob-
lema do caminho mais curto.
v
Abstract
In complex environments, as it is the case of an airport, decision-makers need to be continuously informed
about ongoing operations. Such service requires the implementation of a control mechanism capable of
providing an effective support at managing traffic ground movements in real-time. Nowadays, technology
became available for the implementation of different levels of location-based services aiming to ensure the
safety and efficiency of airport surface movements under all circumstances with respect to traffic density,
visibility and complexity of the airport layout. However, the majority of modern airports still allow a set of
operational inefficiencies in extreme situations (e.g. rush hours, bad meteorological conditions) caused by an
inefficient orchestration of all the intervenient systems and resources, leading in turn to a dysfunction of the
airport that compromises the required level of safety. In order to address this problem, this thesis presents
an in-depth analysis of a methodology that implements the routing and guidance requirements specified by
the A-SMGCS concept defined by ICAO and EUROCONTROL. This includes the analysis and discussion of
a site test implementation of the proposed methodology with traffic data from the Lisbon airport, in addition
to an algorithm to dynamically deal with conflicts and deviations from assigned routes.
AIRNET Airport Network for Mobiles Surveillance and Alerting
ADS-B Automatic Dependent Surveillance Broadcast
A-GPS Assisted-GPS
AoA Angle of Arrival
AP Access Point
A-SMGCS Advanced Surface Movement Guidance and Control System
ASR Approach Surveillance Radar
ATC Air Traffic Control
ATCO Air Traffic Controller
ATGS Advanced Taxiway Guidance System
ATM Air Traffic Management
ATOPS A-SMGCS Testing of Operational Procedures by Simulation
AVOL Aerodrome Visibility Operational Level
BS Base Station
CDMA Code Division Multiple Access
CTPN Colored Timed Petri Net
DB Database
D-GPS Differential-GPS
EGNOS Geostationary Navigation Overlay Service
EMMA European Airport Movement Management by A-SMGCS
xiii
EUROCONTROL European Organization for the Safety of Air Navigation
FAA Federal Aviation Administration
ICAO International Civil Aviation Organization
I&D Investigation and Development
ITS Intelligent Transportation Systems
GHMI Ground Human Machine Interface
GIS Geographic Information Systems
GLONASS Global Navigation Satellite System
GNSS Global Navigation Satellite Systems
GPRS General Packet Radio Service
GPS Global Positioning System
GSM Global System for Mobile Communications
HMI Human Machine Interface
HSGPS High Sensitivity GPS
LBS Location Based Services
LEONARDO Linking Existing ON ground, ARrival and Departure Operations
LVO Low Visibility Operations
MILP Mixed-Integer Linear Programming
MLAT Multilateration
NAS National Airspace System
NAVSTAR Navigation Satellite Timing and Ranging
NVO Normal Visibility Operations
OBU On-Board Unit
OGC Open Geospatial Consortium
R&D Research and Development
RIMCAS Runway Incursion Monitoring Collision Avoidance System
xiv
RFID Radio Frequency Identification
RTLS Real Time Locating Systems
RTT Round-Trip Time
RWY Runways
SAMS SMGCS Airport Movement Simulator
SBSS Surveillance and Broadcast Services System
SMR Surface Movement Radar
SSR Secondary Surveillance Radar
TDOA Time Difference of Arrival
TETRA Terrestrial Trunked Radio
TWY Taxiways
UAT Universal Access Transceiver
UML Unified Modeling Language
WGS World Geodetic System
WiMAX Worldwide Interoperability for Microwave Access
WLAN Wireless Local Area Network
XML Extensible Markup Language
xv
Chapter 1
Introduction
This chapter introduces the problem of the dynamic management of traffic movements in critical environ-
ments, where the likelihood of incidents must be maintained as low as possible. The compliance with a
set of business rules must be guaranteed by the continuous monitoring of ongoing operations, triggering an
alert whenever a safety hazard is detected. However, existing safety management procedures do not allow
controllers to efficiently coordinate and schedule operational tasks, for instance in airports. This thesis pro-
poses a methodology that intends to contribute to this problem by providing decision-support tools that will
increase the airport capacity by avoiding delays and minimizing conflicts, while reducing the workload of
airport stakeholders.
1.1 Motivation and problem statement
With the advent of wireless technologies and embedded systems, a large number of complex environments
adopted a network of sensors as an innovative monitoring and alerting system. It is the case of ports and
airports, where ships and aircrafts, respectively, have to comply with a set of safety and security procedures
to move along predefined pathways within a restricted area [1]. Such movements are performed under the
supervision of specialized controllers and have to follow strict business rules to avoid conflicts among moving
objects within the monitored area. The non-compliance of these rules might lead to unexpected emergency
situations, compromising the safety of operations. For instance, two boats with containers sailing towards
each other should trigger an alert, specially if they carry flammable products. In airports, a similar situation
may occur if there is a lack of coordination between an aircraft and a vehicle. These situations have to be
dealt in a responsive manner, aiming to avoid conflicts between uncoordinated and concurrent movements.
Airports are considered as very large, dynamic and complex systems that have to deal with emergency
situations that must be resolved as soon as possible. There is a need of a permanent surveillance of ongoing
operations in order to report every single incident to safety managers. The major challenge is to efficiently
detect infringements, providing a reliable situational awareness to ATCOs, which are responsible to manage
the ground movements within the airside of an airport. This thesis mainly focus on airport surface movements,
1
where 82% of the accidents occur. This percentage is very high, considering that only 18% of the flight time
is spent taxiing on the ground [2].
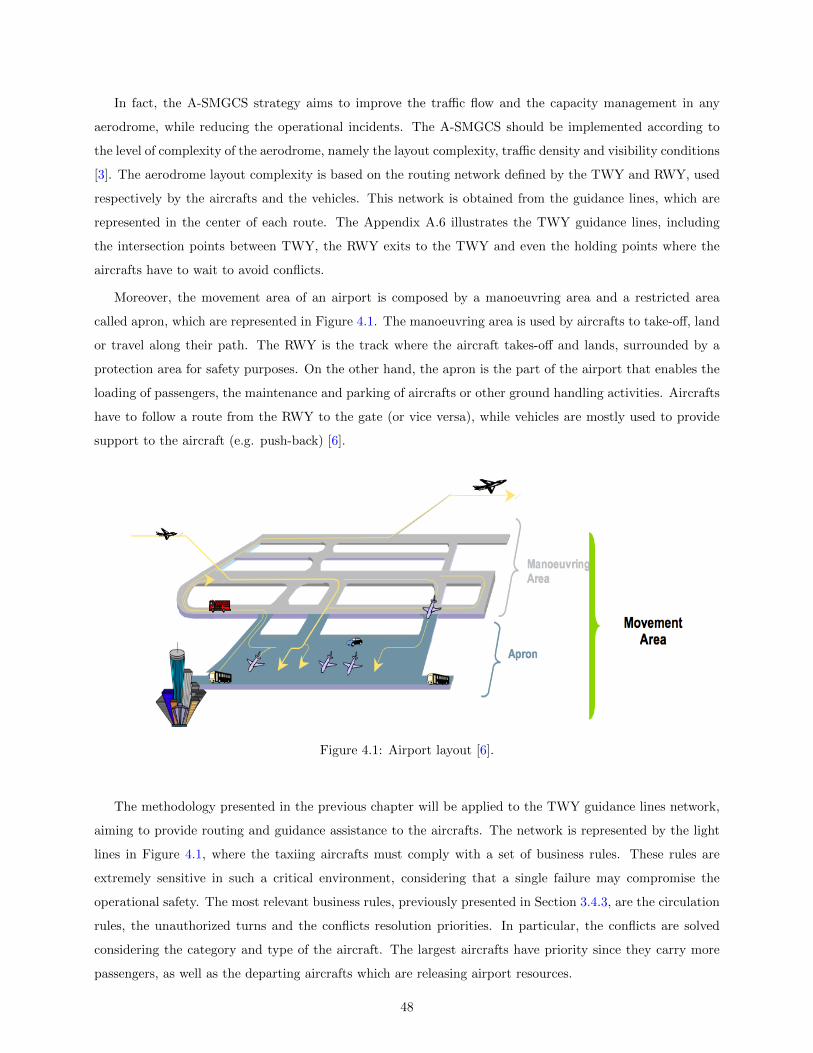
In an airport, the movement area is composed by a manoeuvring area and a restricted area called apron.
The manoeuvring area is used by aircrafts to take-off, land or travel along their path. The runway is the
track where the aircraft takes-off and lands, surrounded by a protection area for safety purposes. On the
other hand, the apron is the area of the airport that enables the loading of passengers, the maintenance and
parking of aircrafts or other ground handling activities. The apron is the heart of the operational area of
the airport, organized by a set of taxiways and roadways used by aircrafts and airport vehicles, respectively.
Within the apron area, aircrafts and vehicles are the main monitored targets that must be coordinated in
order to efficiently manage their movements. Aircrafts have to follow a route from the runway to the gate
(or vice versa), while vehicles are used to provide support to the aircraft (e.g. push-back). Thus, there is
a need to guide the aircraft along the route, while considering the location of other moving objects. This
guidance mechanism will improve the turnaround process, which corresponds to the lifecycle of the aircraft
since it arrives until it leaves the aerodrome [3].
Along the last decades, the growth of air traffic caused an increase of the workload of both field and
control personnel, which have to manage and coordinate all the ground movements to achieve tied schedules.
Such complexity leads to the lack of resources and very often the pressure imposed by airline companies
causes safety breaches, in particular those derived from human error [4]. In such stressing environments,
surface operations mostly rely on the principle ”see and be seen” to maintain a safety spacing when trailing
another target or even to identify intersections. Furthermore, visual and voice aids enable pilots and vehicle
drivers to follow their assigned route, becoming responsible for avoiding conflicts. However, relying on visual
observations becomes complex and often misleading, particularly at rush hours when many operations must
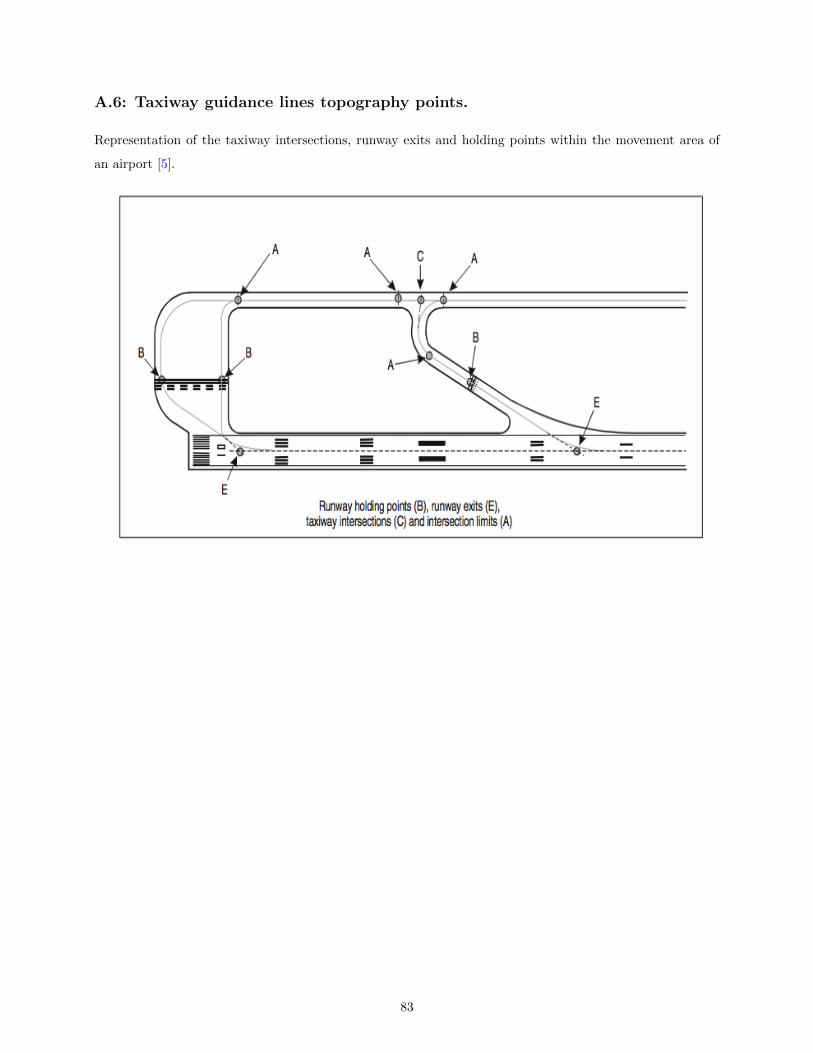
be managed simultaneously, sometimes under low visibility conditions [5].
Furthermore, the management of the involved organizations is performed independently, without having
a collaborative view of ongoing operations. Such lack of coordination leads to a limited knowledge about the
current traffic situation, preventing a proactive contribution from stakeholders (e.g. ATCO, handling agents
supervisors, pilots, vehicle drivers) involved in the decision-making process [6]. Consequently, incidents are
difficult to identify, as well as the field worker responsible for it. At the same time, stakeholders are not aware
about the positioning of each field worker due to absence of electronic monitoring means in some moving
objects. This lack of efficiency may increase the likelihood of congestions and consequently the number of
incidents.
Existing safety management procedures do not allow stakeholders to timely make efficient decisions to
business service demands. Therefore, recent technological advances in mobile computing are to be considered
in the surveillance of moving objects through location based services by providing solutions capable to
overcome operational constraints [7]. In this context, the airport layout is represented in a map-based
display with the spatial context and a set of metadata associated, representative of the operational business
rules. Such environment requires the ability of a GIS engine to correlate spatial information with operational
2
rules, while representing continuous positioning data about moving aircrafts and vehicles that are equipped
with a location device [8].
Moreover, the congestion resulting from increasing flows of traffic is reducing airports capacity. This
problem affects both the economy, reducing the turnaround efficiency, and the environment, with emissions
polluting the air. The congestion also affects the workload of each stakeholder, probably increasing the
occurrence of safety hazards. All these factors contribute to the need of developing automated tools to
control ground movements more efficiently, while releasing controllers workload [9].
1.2 Location based services
In complex environments, there is a real-time requirement in continuously monitoring moving objects, where
services are dependent on the location of each one. LBS is defined by the international OGC as a ”wireless-IP
service that uses geographic information to serve a mobile user”. In other words, LBS is the service requested
by a user located in a given geographic position at a certain point in time. For instance, the guidance of
a moving vehicle or the detection of a conflict requires the continuous tracking of the movement, while
considering the current traffic situation and other parameters such as the pretended destination, circulation
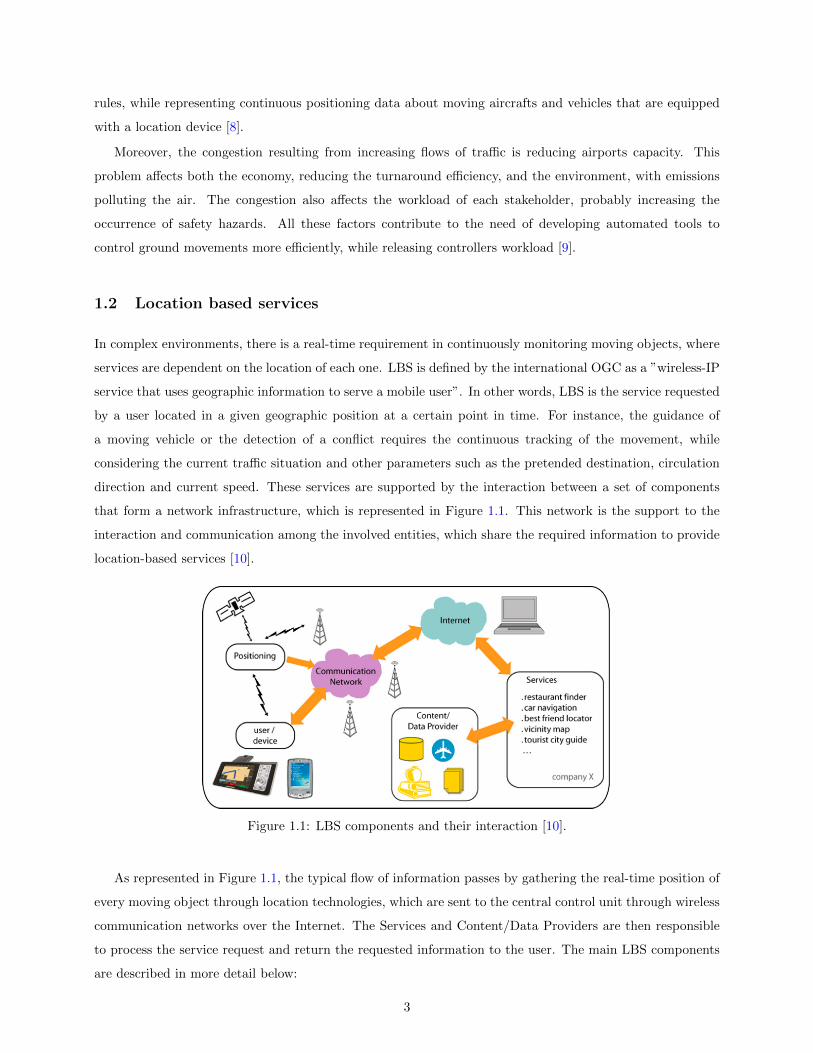
direction and current speed. These services are supported by the interaction between a set of components
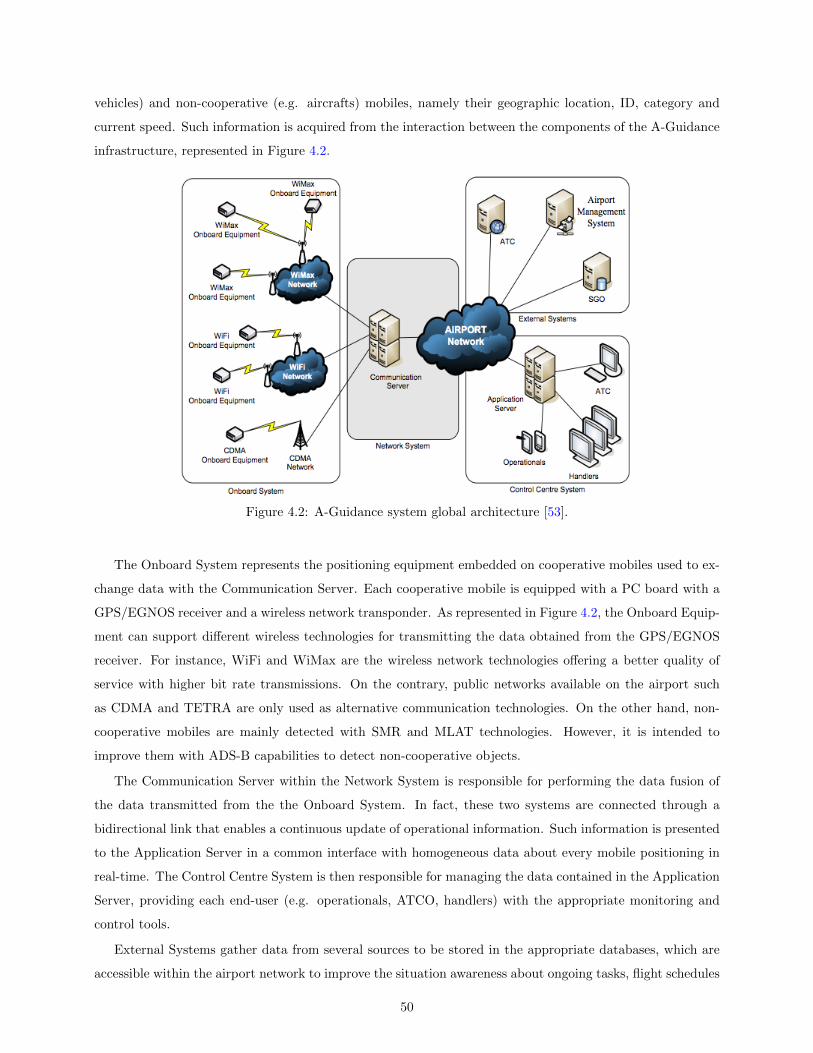
that form a network infrastructure, which is represented in Figure 1.1. This network is the support to the
interaction and communication among the involved entities, which share the required information to provide
location-based services [10].
Figure 1.1: LBS components and their interaction [10].
As represented in Figure 1.1, the typical flow of information passes by gathering the real-time position of
every moving object through location technologies, which are sent to the central control unit through wireless
communication networks over the Internet. The Services and Content/Data Providers are then responsible
to process the service request and return the requested information to the user. The main LBS components
are described in more detail below:
3
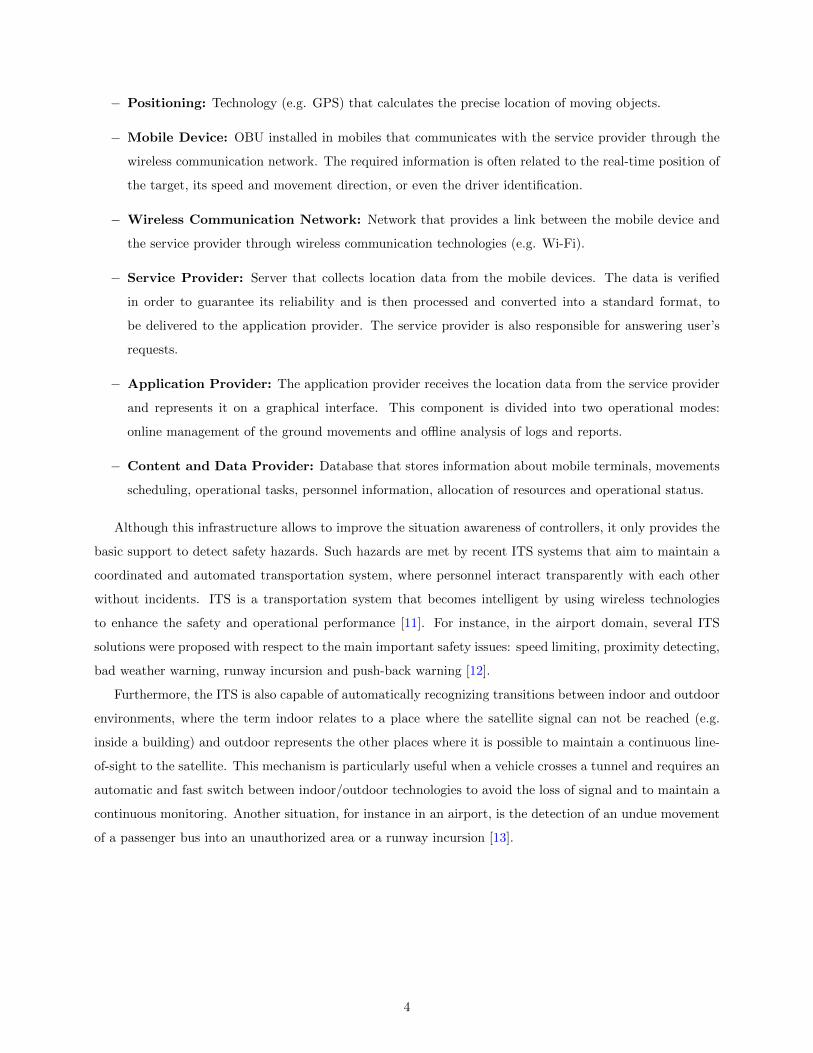
− Positioning: Technology (e.g. GPS) that calculates the precise location of moving objects.
− Mobile Device: OBU installed in mobiles that communicates with the service provider through the
wireless communication network. The required information is often related to the real-time position of
the target, its speed and movement direction, or even the driver identification.
− Wireless Communication Network: Network that provides a link between the mobile device and
the service provider through wireless communication technologies (e.g. Wi-Fi).
− Service Provider: Server that collects location data from the mobile devices. The data is verified
in order to guarantee its reliability and is then processed and converted into a standard format, to
be delivered to the application provider. The service provider is also responsible for answering user’s
requests.
− Application Provider: The application provider receives the location data from the service provider
and represents it on a graphical interface. This component is divided into two operational modes:
online management of the ground movements and offline analysis of logs and reports.
− Content and Data Provider: Database that stores information about mobile terminals, movements
scheduling, operational tasks, personnel information, allocation of resources and operational status.
Although this infrastructure allows to improve the situation awareness of controllers, it only provides the
basic support to detect safety hazards. Such hazards are met by recent ITS systems that aim to maintain a
coordinated and automated transportation system, where personnel interact transparently with each other
without incidents. ITS is a transportation system that becomes intelligent by using wireless technologies
to enhance the safety and operational performance [11]. For instance, in the airport domain, several ITS
solutions were proposed with respect to the main important safety issues: speed limiting, proximity detecting,
bad weather warning, runway incursion and push-back warning [12].
Furthermore, the ITS is also capable of automatically recognizing transitions between indoor and outdoor
environments, where the term indoor relates to a place where the satellite signal can not be reached (e.g.
inside a building) and outdoor represents the other places where it is possible to maintain a continuous line-
of-sight to the satellite. This mechanism is particularly useful when a vehicle crosses a tunnel and requires an
automatic and fast switch between indoor/outdoor technologies to avoid the loss of signal and to maintain a
continuous monitoring. Another situation, for instance in an airport, is the detection of an undue movement
of a passenger bus into an unauthorized area or a runway incursion [13].
4
The ITS is then a benefit regarding guidance functional requirements, since it allows to detect unpre-
dictable events while guiding a mobile. This means that the system is fitted with intelligent mechanisms
that are able to continuously provide support to monitoring activities. Situations compromising the safety of
operations, such as deviations from the pre-defined route or speeding, automatically trigger an alert to allow
the controller to make a decision.
1.3 Advanced Surface Movement Guidance and Control System
Current air traffic movements outlines the need to find a way to improve the airport safety, mainly regarding
the incidents caused by uncoordinated ground movements. Such approach is addressed by EUROCONTROL
with the A-SMGCS concept [14]. The A-SMGCS consists of a set of mechanisms and safety rules that aim to
improve the safety and efficiency of all ground movements in the airport. The ICAO also defines the concept
as a ”system providing routing, guidance, surveillance and control to aircraft and affected vehicles in order
to keep movement rates under all local weather conditions within the AVOL whilst maintaining the required
level of safety” [3].
The A-SMGCS implements four distinct services [5]:
− Surveillance: positioning of moving objects within the airside area of an airport.
− Control: detection and resolution of safety hazards and other conflicts.
− Routing: generation of a route for each aircraft and vehicle, allowing to adapt a possible path deviation.
− Guidance: indications to allow the pilots and vehicle drivers maintaining their assigned path.
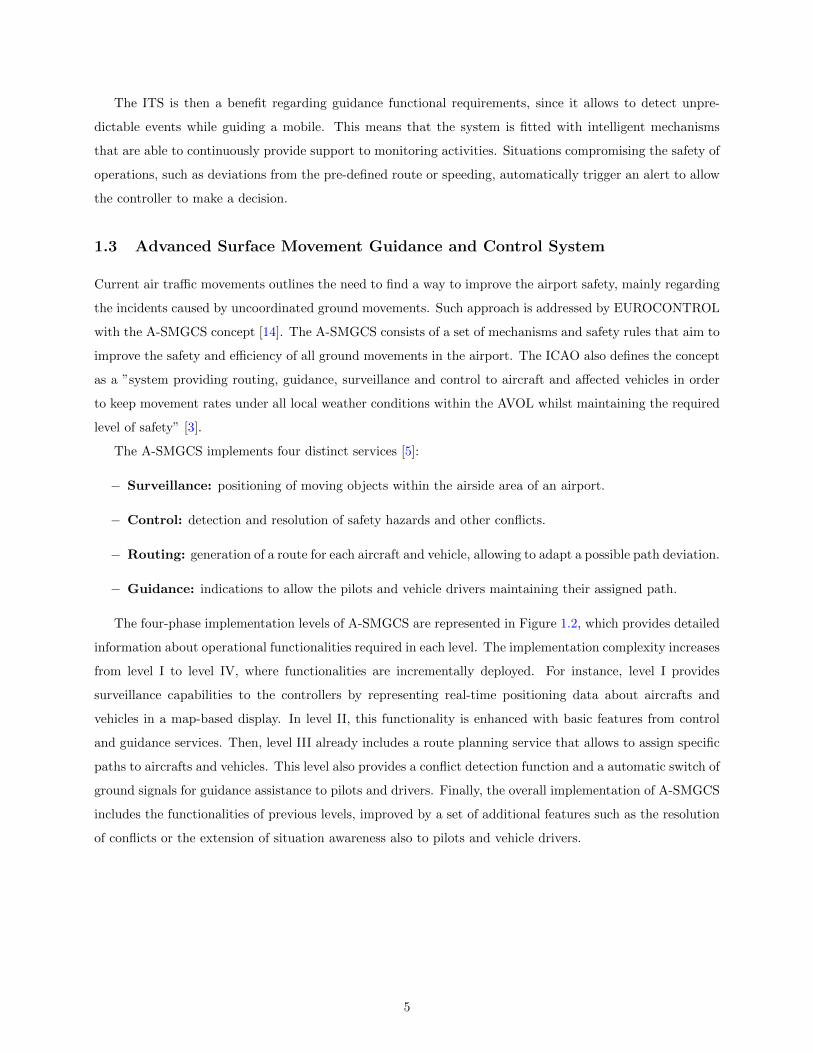
The four-phase implementation levels of A-SMGCS are represented in Figure 1.2, which provides detailed
information about operational functionalities required in each level. The implementation complexity increases
from level I to level IV, where functionalities are incrementally deployed. For instance, level I provides
surveillance capabilities to the controllers by representing real-time positioning data about aircrafts and
vehicles in a map-based display. In level II, this functionality is enhanced with basic features from control
and guidance services. Then, level III already includes a route planning service that allows to assign specific
paths to aircrafts and vehicles. This level also provides a conflict detection function and a automatic switch of
ground signals for guidance assistance to pilots and drivers. Finally, the overall implementation of A-SMGCS
includes the functionalities of previous levels, improved by a set of additional features such as the resolution
of conflicts or the extension of situation awareness also to pilots and vehicle drivers.
5
Figure 1.2: A-SMGCS implementation levels [3].
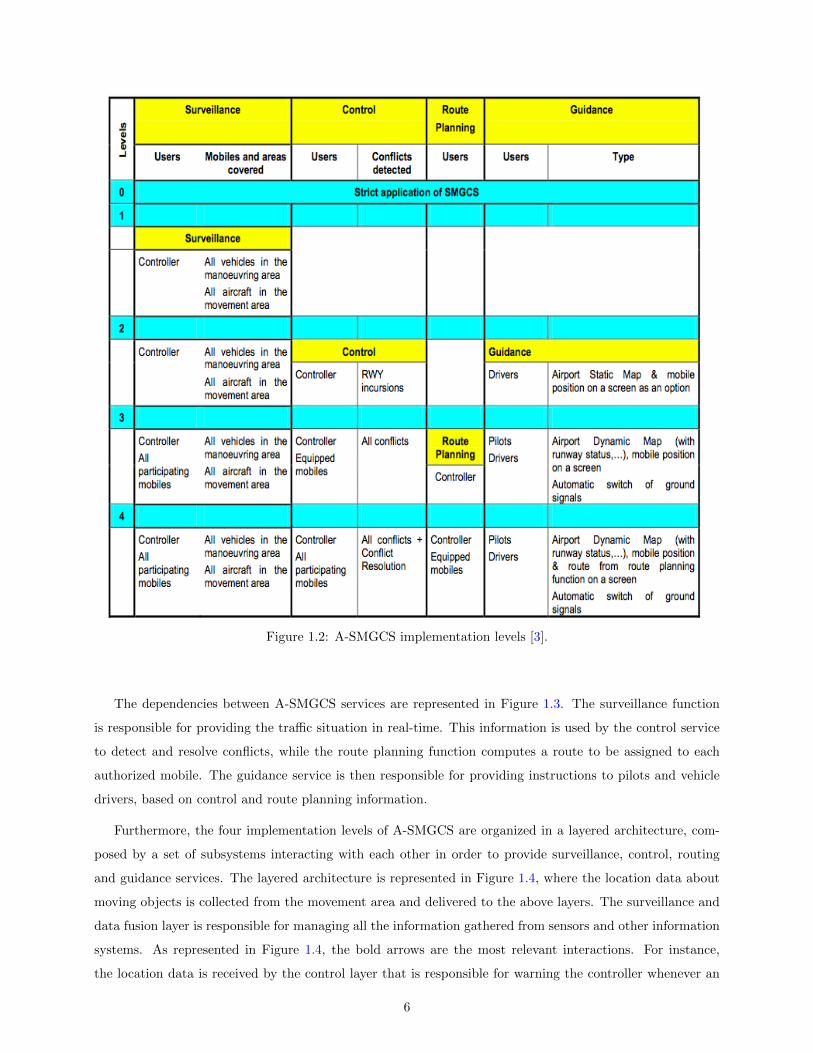
The dependencies between A-SMGCS services are represented in Figure 1.3. The surveillance function
is responsible for providing the traffic situation in real-time. This information is used by the control service
to detect and resolve conflicts, while the route planning function computes a route to be assigned to each
authorized mobile. The guidance service is then responsible for providing instructions to pilots and vehicle
drivers, based on control and route planning information.
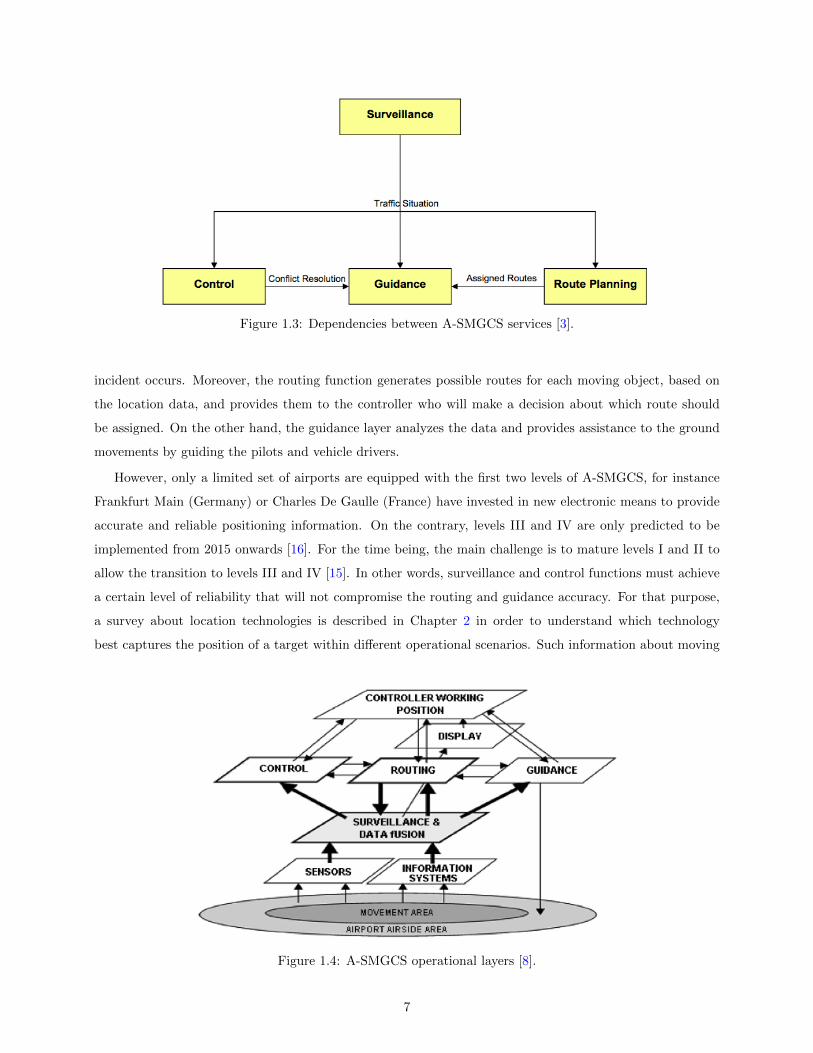
Furthermore, the four implementation levels of A-SMGCS are organized in a layered architecture, com-
posed by a set of subsystems interacting with each other in order to provide surveillance, control, routing
and guidance services. The layered architecture is represented in Figure 1.4, where the location data about
moving objects is collected from the movement area and delivered to the above layers. The surveillance and
data fusion layer is responsible for managing all the information gathered from sensors and other information
systems. As represented in Figure 1.4, the bold arrows are the most relevant interactions. For instance,
the location data is received by the control layer that is responsible for warning the controller whenever an
6
Figure 1.3: Dependencies between A-SMGCS services [3].
incident occurs. Moreover, the routing function generates possible routes for each moving object, based on
the location data, and provides them to the controller who will make a decision about which route should
be assigned. On the other hand, the guidance layer analyzes the data and provides assistance to the ground
movements by guiding the pilots and vehicle drivers.
However, only a limited set of airports are equipped with the first two levels of A-SMGCS, for instance
Frankfurt Main (Germany) or Charles De Gaulle (France) have invested in new electronic means to provide
accurate and reliable positioning information. On the contrary, levels III and IV are only predicted to be
implemented from 2015 onwards [16]. For the time being, the main challenge is to mature levels I and II to
allow the transition to levels III and IV [15]. In other words, surveillance and control functions must achieve
a certain level of reliability that will not compromise the routing and guidance accuracy. For that purpose,
a survey about location technologies is described in Chapter 2 in order to understand which technology
best captures the position of a target within different operational scenarios. Such information about moving
Figure 1.4: A-SMGCS operational layers [8].
7
objects will improve the situational awareness of the ATCOs, while releasing their workload. A graphical
interface allows the controller to monitor targets moving along the airport spatial context, together with
an alert mechanism that triggers an alarm whenever the operations safety is compromised. In addition to
the surveillance and control functions, it is required to improve the surface movements efficiency. Then, a
routing mechanism should generate a set of path possibilities to assign to each moving object, improving the
controller knowledge about conflict-free routes generated automatically. The guidance capability is another
requirement, in order to maintain pilots and vehicle drivers traveling along their assigned route [4].
1.4 Contributions
The main contribution of this thesis is to provide a decision-support methodology to manage the efficiency
of airport surface movements. It is intended to extend an existing platform, namely A-Guidance, to routing
and guidance functionalities, complying with A-SMGCS operational and performance requirements. This
project is experimentally deployed at Lisbon and OPorto airports in Portugal, already equipped with an
LBS infrastructure providing surveillance and control services. Based on the real-time positioning data
about aircrafts and metadata about the airport layout, the proposed methodology aims to optimize TWY
operations by routing and scheduling each movement within the movement area.
The proposed methodology is based on the representation of the airport TWY guidance lines as a directed
weighted graph with nodes and arcs. Each node of the graph represents an intersection between two or more
TWY, where the arcs are the segments between each node. Over that representation, a routing algorithm
is applied in order to find the shortest path between two nodes. Thus, a static path planning function
determines which route will be assigned to each aircraft. However, such approach may generate a set of
conflicts between uncoordinated movements that have to be handled by a dynamic scheduling function.
There are three types of conflicts that can occur: two aircrafts crossing an intersection, a persecution in
which the separation distance decreases due to speeding, and two aircrafts moving towards each other [17].
These conflicts are avoided by scheduling each pathway taking into account the other movements as time
passes by. Then, a continuous monitoring of each movement allows to detect deviations from assigned routes
or non-compliance with business rules, resolved by re-routing to alternative paths or by defining a set of
holding points in strategic places.
The main goals of this thesis are:
− Increase the airport capacity and efficiency by avoiding delays and minimizing conflicts.
− Optimize turnaround times by computing shortest paths.
− Reduce the airport stakeholders workload.
The mentioned contributions and goals intend to respond to the increasing complexity of modern airports,
by improving the ability to manage simultaneous operations while complying with safety and security rules.
The extension of existing solutions to levels III and IV of A-SMGCS will contribute to reduce the energetic
8
consumption with an efficient guidance lighting system, as well as to reduce operational costs by improving
the turnaround efficiency. Thus, the number of allocated resources required to provide support to the aircraft
and the likelihood of safety hazards would considerably decrease.
1.5 Document structure
The remaining of this document is organized as follows. Chapter 2 presents the related work about wireless
location technologies and performs a survey about existing routing algorithms. This chapter intends to
discuss the state-of-the-art about existing solutions contributing to the implementation of the A-SMGCS
concept. Chapter 3 provides an in-depth analysis of the proposed methodology, describing the architectural
model and the implementation conception. The methodology was applied to the airport domain as the case
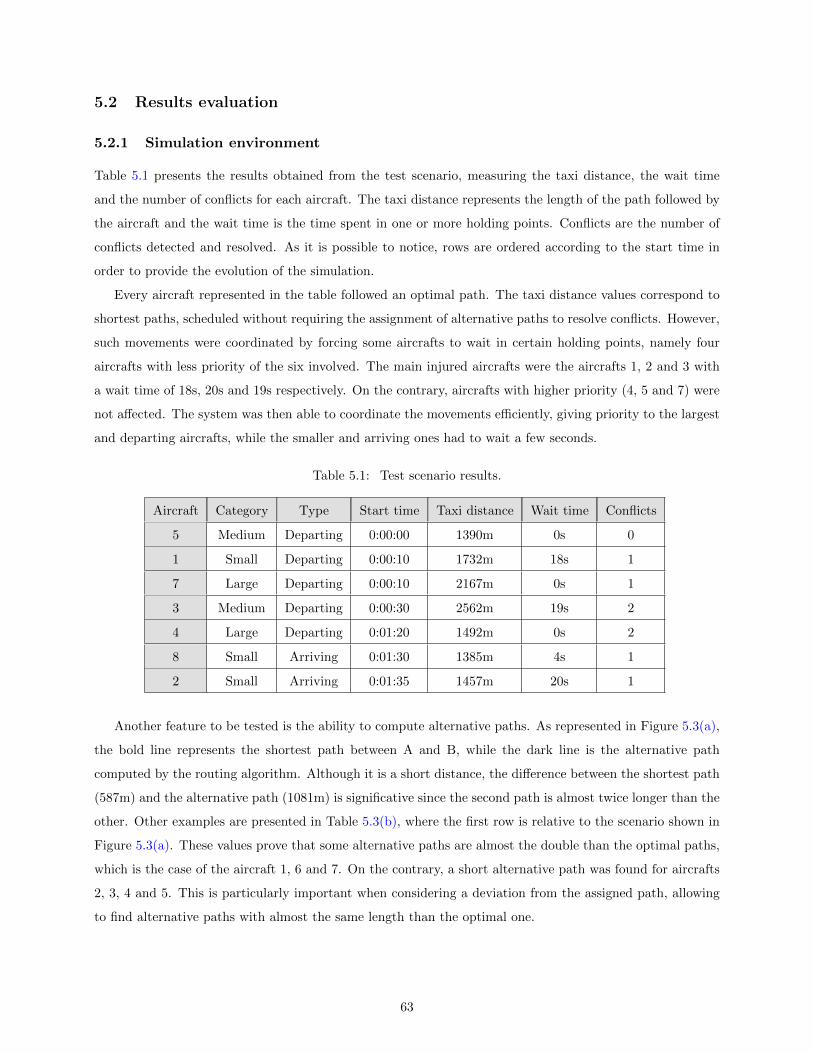
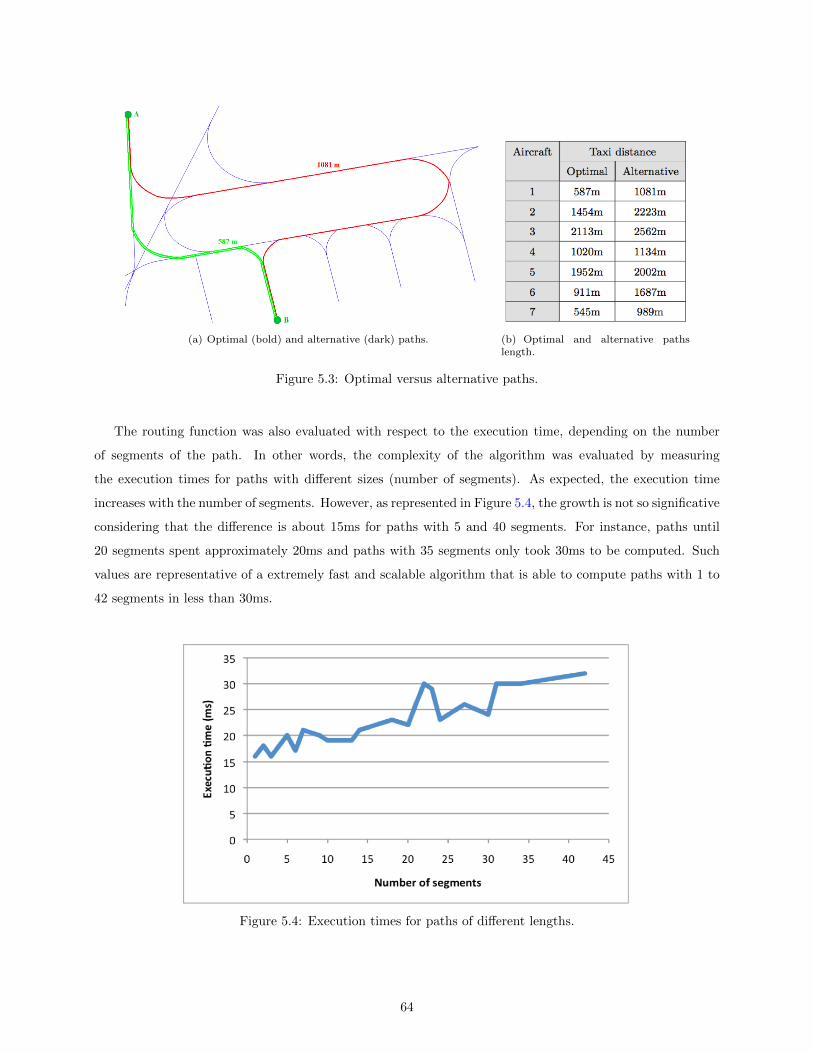
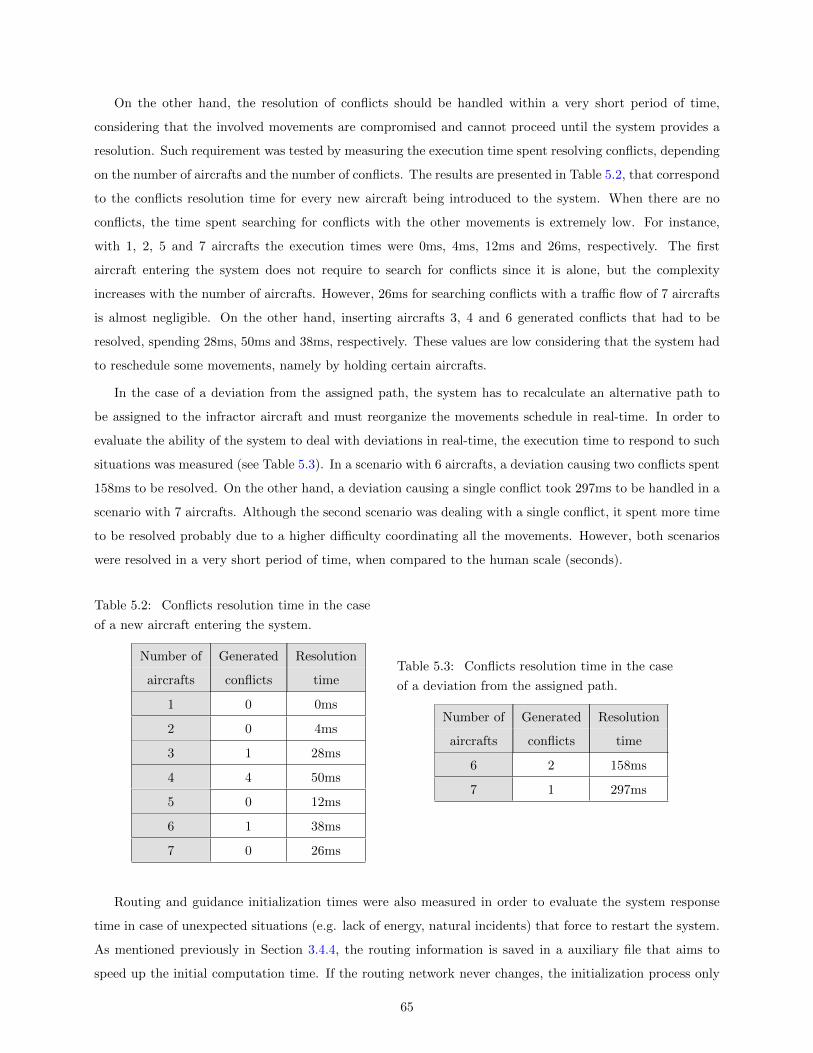
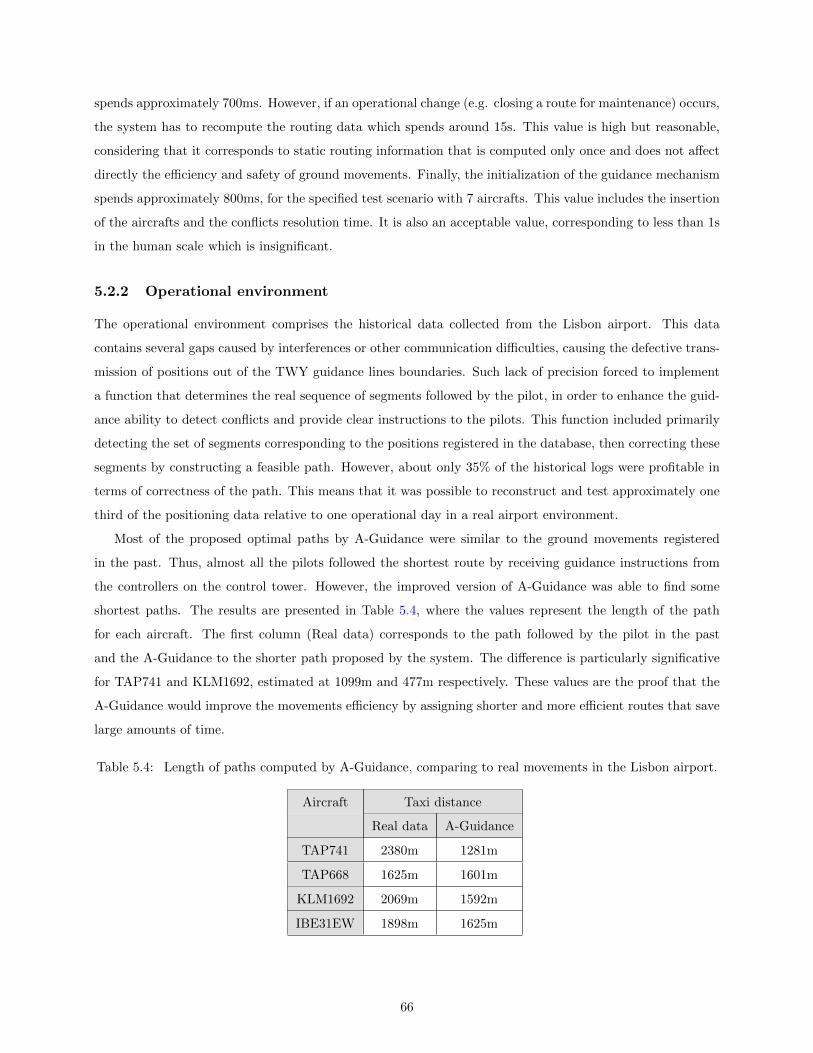
study, presented in Chapter 4. Chapter 5 provides a detailed assessment to the implemented solution in order
to validate the compliance with operational and performance A-SMGCS requirements. Chapter 6 ends with
a set of conclusions about the contributions made along this thesis, as well as a reflection about the future
work.
9
Chapter 2
State of the art
In the last decades, the improvements made to RTLS1 have evolved in order to take advantage from mobile
devices as a network of sensors to detect moving objects within restricted areas. In this context, this chapter
makes a survey about existing location technologies used to provide support to an LBS infrastructure. The
accuracy and reliability achieved by those technologies are then assessed to evaluate if the level of surveillance
is adequate to proceed with routing and guidance functionalities.
The resulting spatio-temporal context is then represented in a map-based display and managed by a GIS
engine, which description will allow to understand how the provided metadata allows to implement a path
planning system. This system will be based on one of the surveyed routing algorithms addressing the
shortest path problem. Nevertheless, the assignment of static optimal paths must operate under a dynamic
programming model that is able to simulate the time evolution and schedule non-conflicted movements over
that representation.
2.1 Location technologies
2.1.1 Non-cooperative technologies
There are two main categories of moving objects: cooperative and non-cooperative. Targets are considered
cooperative when they are equipped with a transponder that is able to communicate its precise location to
the service provider, while the monitoring of non-cooperative objects requires the ability to detect any mobile
within the operational area without the collaboration of the target. Focusing primarily on non-cooperative
technologies, their surveillance is performed by electronic means without requiring the installation of any
electronic device within the object. This means that it is possible to detect the location of a moving object
without being intrusive. For instance, in the case of an airport, it is very useful to detect aircrafts, vehicles
and other obstacles that may appear on the ground [3]. The following non-cooperative technologies are
considered:
1RTLS are systems designed to detect, in real-time, the positioning of active mobiles that are equipped with a device ableto interact with the system [18].
11
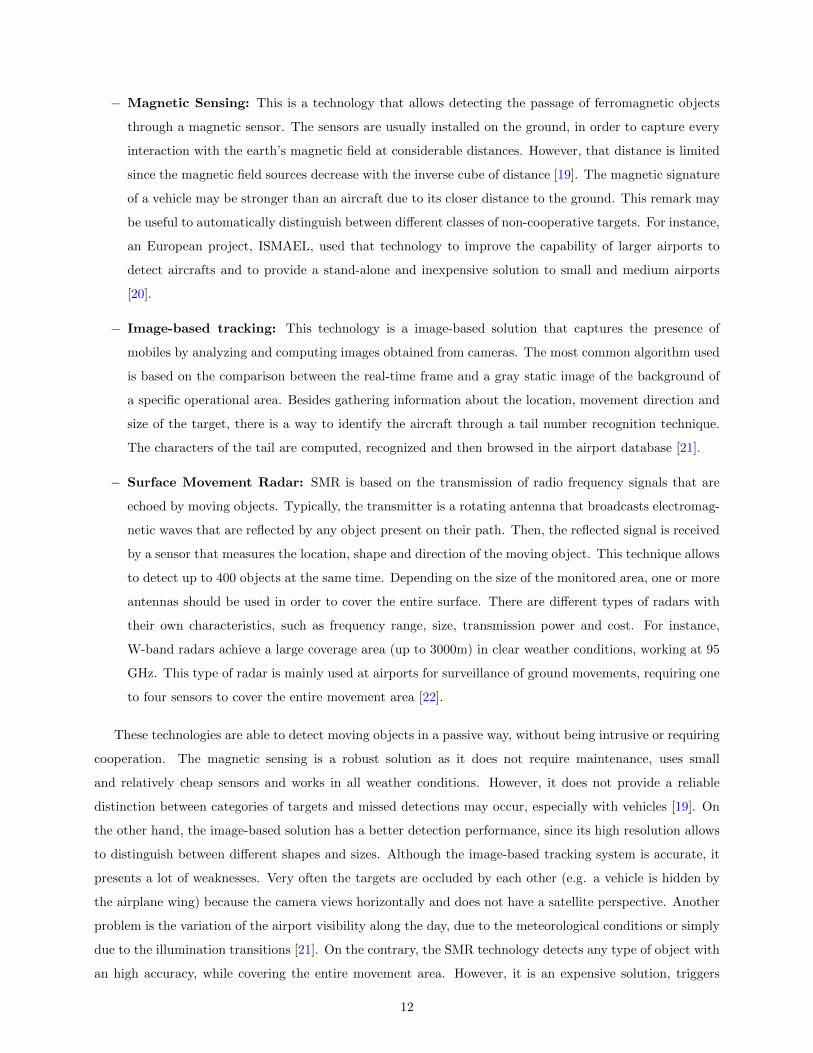
− Magnetic Sensing: This is a technology that allows detecting the passage of ferromagnetic objects
through a magnetic sensor. The sensors are usually installed on the ground, in order to capture every
interaction with the earth’s magnetic field at considerable distances. However, that distance is limited
since the magnetic field sources decrease with the inverse cube of distance [19]. The magnetic signature
of a vehicle may be stronger than an aircraft due to its closer distance to the ground. This remark may
be useful to automatically distinguish between different classes of non-cooperative targets. For instance,
an European project, ISMAEL, used that technology to improve the capability of larger airports to
detect aircrafts and to provide a stand-alone and inexpensive solution to small and medium airports
[20].
− Image-based tracking: This technology is a image-based solution that captures the presence of
mobiles by analyzing and computing images obtained from cameras. The most common algorithm used
is based on the comparison between the real-time frame and a gray static image of the background of
a specific operational area. Besides gathering information about the location, movement direction and
size of the target, there is a way to identify the aircraft through a tail number recognition technique.
The characters of the tail are computed, recognized and then browsed in the airport database [21].
− Surface Movement Radar: SMR is based on the transmission of radio frequency signals that are
echoed by moving objects. Typically, the transmitter is a rotating antenna that broadcasts electromag-
netic waves that are reflected by any object present on their path. Then, the reflected signal is received
by a sensor that measures the location, shape and direction of the moving object. This technique allows
to detect up to 400 objects at the same time. Depending on the size of the monitored area, one or more
antennas should be used in order to cover the entire surface. There are different types of radars with
their own characteristics, such as frequency range, size, transmission power and cost. For instance,
W-band radars achieve a large coverage area (up to 3000m) in clear weather conditions, working at 95
GHz. This type of radar is mainly used at airports for surveillance of ground movements, requiring one
to four sensors to cover the entire movement area [22].
These technologies are able to detect moving objects in a passive way, without being intrusive or requiring
cooperation. The magnetic sensing is a robust solution as it does not require maintenance, uses small
and relatively cheap sensors and works in all weather conditions. However, it does not provide a reliable
distinction between categories of targets and missed detections may occur, especially with vehicles [19]. On
the other hand, the image-based solution has a better detection performance, since its high resolution allows
to distinguish between different shapes and sizes. Although the image-based tracking system is accurate, it
presents a lot of weaknesses. Very often the targets are occluded by each other (e.g. a vehicle is hidden by
the airplane wing) because the camera views horizontally and does not have a satellite perspective. Another
problem is the variation of the airport visibility along the day, due to the meteorological conditions or simply
due to the illumination transitions [21]. On the contrary, the SMR technology detects any type of object with
an high accuracy, while covering the entire movement area. However, it is an expensive solution, triggers
12
false alarms and is affected by bad weather conditions [22]. Furthermore, a large object may be recognized
as several smaller ones or even two objects can be identified as only one (due to their proximity). Another
problem with SMR is the fact that it does not provide the mobiles identity [21].
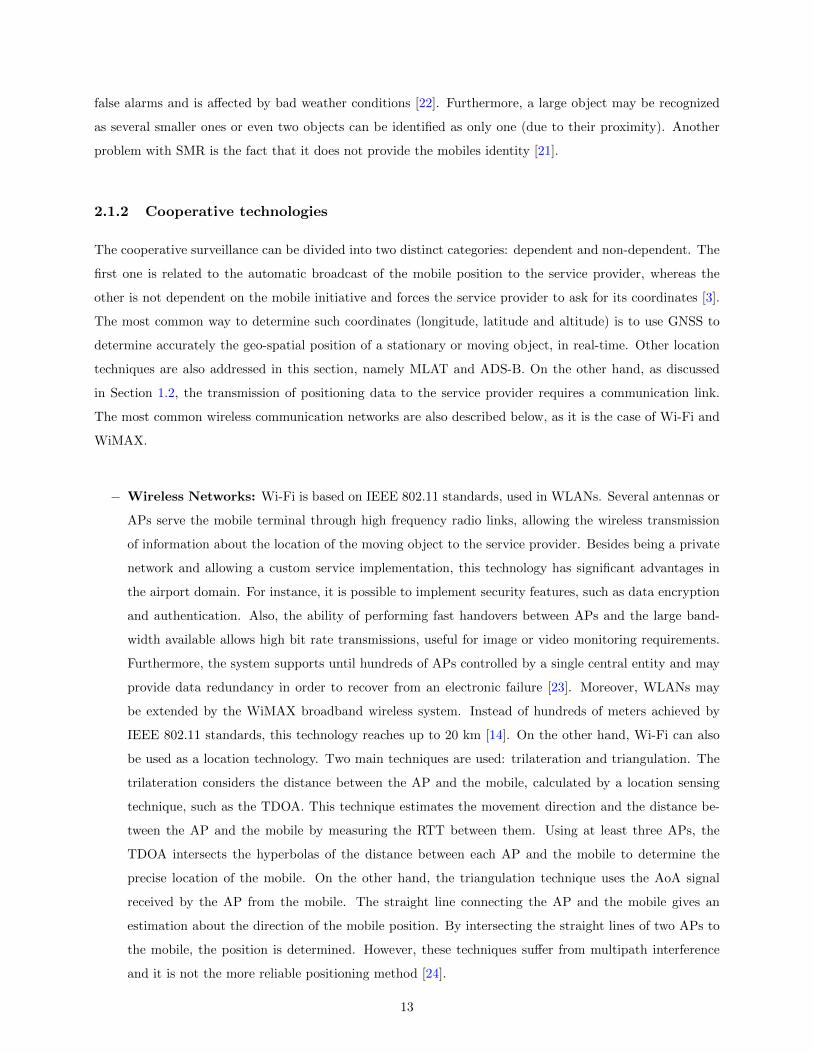
2.1.2 Cooperative technologies
The cooperative surveillance can be divided into two distinct categories: dependent and non-dependent. The
first one is related to the automatic broadcast of the mobile position to the service provider, whereas the
other is not dependent on the mobile initiative and forces the service provider to ask for its coordinates [3].
The most common way to determine such coordinates (longitude, latitude and altitude) is to use GNSS to
determine accurately the geo-spatial position of a stationary or moving object, in real-time. Other location
techniques are also addressed in this section, namely MLAT and ADS-B. On the other hand, as discussed
in Section 1.2, the transmission of positioning data to the service provider requires a communication link.
The most common wireless communication networks are also described below, as it is the case of Wi-Fi and
WiMAX.
− Wireless Networks: Wi-Fi is based on IEEE 802.11 standards, used in WLANs. Several antennas or
APs serve the mobile terminal through high frequency radio links, allowing the wireless transmission
of information about the location of the moving object to the service provider. Besides being a private
network and allowing a custom service implementation, this technology has significant advantages in
the airport domain. For instance, it is possible to implement security features, such as data encryption
and authentication. Also, the ability of performing fast handovers between APs and the large band-
width available allows high bit rate transmissions, useful for image or video monitoring requirements.
Furthermore, the system supports until hundreds of APs controlled by a single central entity and may
provide data redundancy in order to recover from an electronic failure [23]. Moreover, WLANs may
be extended by the WiMAX broadband wireless system. Instead of hundreds of meters achieved by
IEEE 802.11 standards, this technology reaches up to 20 km [14]. On the other hand, Wi-Fi can also
be used as a location technology. Two main techniques are used: trilateration and triangulation. The
trilateration considers the distance between the AP and the mobile, calculated by a location sensing
technique, such as the TDOA. This technique estimates the movement direction and the distance be-
tween the AP and the mobile by measuring the RTT between them. Using at least three APs, the
TDOA intersects the hyperbolas of the distance between each AP and the mobile to determine the
precise location of the mobile. On the other hand, the triangulation technique uses the AoA signal
received by the AP from the mobile. The straight line connecting the AP and the mobile gives an
estimation about the direction of the mobile position. By intersecting the straight lines of two APs to
the mobile, the position is determined. However, these techniques suffer from multipath interference
and it is not the more reliable positioning method [24].
13
− Radio Frequency Identification: Identification system composed by sensors and unique identifica-
tion tags. Each target is pre-equipped with an electronic device (tag) that exchanges beacons with the
sensor (reader unit). Passing close to a reader unit, the tag exchanges its data with the sensor, that will
deliver it to the server [15]. There are two major types of RFID tags: active and passive. Active tags
are often autonomous devices containing a battery and allowing higher communication ranges, while
passive tags are smaller, cheaper and do not require much maintenance [25]. Hence, the RFID may be
the most appropriate technology for automatic login validation procedures. For instance, the vehicle
drivers authentication when entering a restricted area can be accomplished by an RFID tag inside the
vehicle that informs the service provider about the location of that specific mobile.
− Global Positioning System: Within the GNSS domain, the GPS was the first system providing
positioning, later enhanced by several improved solutions. The NAVSTAR GPS was firstly deployed in
the United States, providing a worldwide system both to military and civilian users. Afterwards the
Russian GLONASS was developed as an alternative to the American system. Recently, the European
Civil Satellite Navigation Program (Galileo) appeared as an inter-operable solution together with the
GPS and the GLONASS [26]. Several GPS improvements are being investigated in order to reach a
more accurate and reliable positioning system. EGNOS is the most promising one, based on three
geostationary satellites and many ground stations. This system provides an accurate positioning signal
by gathering information about the GPS and GLONASS satellites, such as its position or clock. The
computed signal reaches an accuracy of two meters, in the worst case [14]. Moreover, D-GPS is an
inexpensive and simple system that broadcasts the corrected value of the absolute position. This value
corresponds to the difference between the real position and the position given by the satellite [27].
Finally, HSGPS is considered to be the most accurate GPS-based technology able to support indoor
LBS. The receiver is powerful enough to acquire weaker signals (until 10 dBHz), even without line-of-
sight to the satellite [28]. When the connection between the mobile and the satellite is lost, the above
GPS systems do not recover quickly and a significantly delay is introduced. In order to improve the
efficiency of that disconnection problem, the A-GPS is used to speed up the connection process in real-
time, by assisting the mobile with a BS unit. This unit is a server that maintains updated information
about the location of each known mobile. In few seconds, the mobile then receives its location through
a telephony link, such as the GSM [24].
− Automatic Dependent Surveillance Broadcast: ADS-B is an example of a dependent cooperative
technology, since aircrafts automatically broadcast their flight information for the other ADS-B capable
systems. That information includes the geographic coordinates (obtained from GNSS), the current
speed and the flight identification (or the aircraft address), sent twice per second. The permanent
sending of the updated location of the aircraft allows an accurate and continuous surveillance on the
target movements [29]. Such location parameters are organized in a state vector that will be delivered
to other ADS-B capable aircrafts and to the ADS-B ground station, called the SBSS. That vector
14
or ADS-B message is used by two different functions: ADS-B-out and ADS-B-in. The ADS-B-out
represents the transmitter installed on the aircraft that broadcasts the ADS-B message to the other
ADS-B receivers. On the other hand, ADS-B-in is the receiving function that enables the pilots to
receive on-board information about the other aircrafts [30]. Furthermore, two types of data links can
be used in the United States: the 1090 MHz Mode S Extended Squitter, primarily used to commercial
aircrafts; and the 978 MHz UAT, suitable to general aircrafts [31]. In Europe, the preferred data link
for ADS-B is the 1090 MHz Extended Squitter, since it uses the transponders already installed on the
aircrafts and is interoperable with the American system [32].
− Multilateration: MLAT consists of a set of antennas installed in the operational area that broadcasts
interrogation signals to the airspace. The targets equipped with SSR and ADS-B transponders, both
aircrafts and vehicles, will answer with a reply signal. The RTT between the antenna and the target is
then used by the TDOA technique that estimates the precise position of the target. Evaluation tests
performed at the Narita International Airport during 2009 revealed that the MLAT performance is
not affected by bad weather conditions, does not require additional equipment to be installed on the
aircrafts and also provides identification information about the target. However, multipath can degrade
the signal propagation, causing false or missing detections [33].
Other cooperative RTLS could be considered, such as Bluetooth or Infrared for indoor environments.
Although Bluetooth and Infrared technologies are inexpensive and do not require much power, they only
support short communication ranges (< 15 m) and are affected by multipath [34]. On the other hand, TETRA
and CDMA are two interesting wireless technologies for outdoor environments, but were not considered due
to their low bandwidth capacity [23].
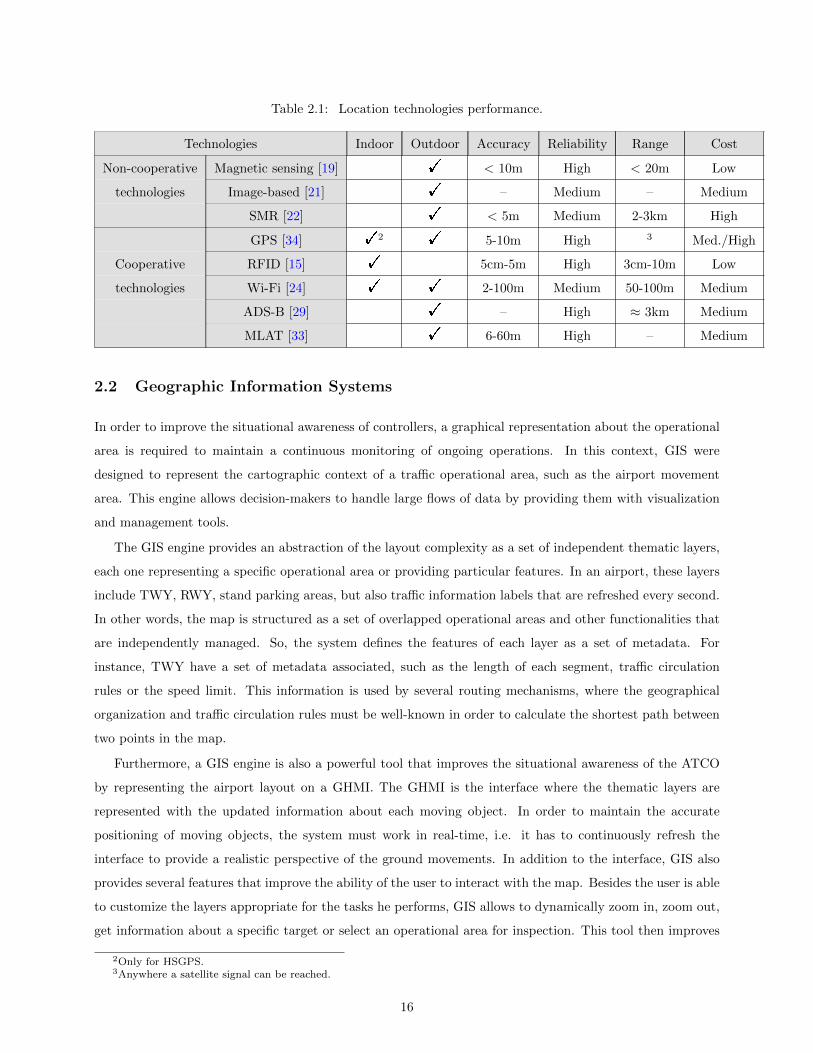
2.1.3 Performance assessment
Table 2.1 summarizes the location technologies characteristics, identifying the working environment (indoor
or outdoor) and evaluating several performance parameters (accuracy, reliability, range and cost).
Although RFID is the more accurate technology, it only provides a very short communication range.
However, it is the most promising one for indoor environments. On the other hand, ADS-B and GPS seems
to be the most suitable technologies for the detection of aircrafts and vehicles, respectively. Besides their
high reliability and large coverage range, these outdoor technologies achieve an accurate and cost-effective
positioning. Furthermore, SMR is an expensive solution that captures every moving object in a large coverage
area, with a medium level of reliability.
15
Table 2.1: Location technologies performance.
Technologies Indoor Outdoor Accuracy Reliability Range Cost
Non-cooperative Magnetic sensing [19] ! < 10m High < 20m Low
technologies Image-based [21] ! – Medium – Medium
SMR [22] ! < 5m Medium 2-3km High
GPS [34] !2 ! 5-10m High 3 Med./High
Cooperative RFID [15] ! 5cm-5m High 3cm-10m Low
technologies Wi-Fi [24] ! ! 2-100m Medium 50-100m Medium
ADS-B [29] ! – High ≈ 3km Medium
MLAT [33] ! 6-60m High – Medium
2.2 Geographic Information Systems
In order to improve the situational awareness of controllers, a graphical representation about the operational
area is required to maintain a continuous monitoring of ongoing operations. In this context, GIS were
designed to represent the cartographic context of a traffic operational area, such as the airport movement
area. This engine allows decision-makers to handle large flows of data by providing them with visualization
and management tools.
The GIS engine provides an abstraction of the layout complexity as a set of independent thematic layers,
each one representing a specific operational area or providing particular features. In an airport, these layers
include TWY, RWY, stand parking areas, but also traffic information labels that are refreshed every second.
In other words, the map is structured as a set of overlapped operational areas and other functionalities that
are independently managed. So, the system defines the features of each layer as a set of metadata. For
instance, TWY have a set of metadata associated, such as the length of each segment, traffic circulation
rules or the speed limit. This information is used by several routing mechanisms, where the geographical
organization and traffic circulation rules must be well-known in order to calculate the shortest path between
two points in the map.
Furthermore, a GIS engine is also a powerful tool that improves the situational awareness of the ATCO
by representing the airport layout on a GHMI. The GHMI is the interface where the thematic layers are
represented with the updated information about each moving object. In order to maintain the accurate
positioning of moving objects, the system must work in real-time, i.e. it has to continuously refresh the
interface to provide a realistic perspective of the ground movements. In addition to the interface, GIS also
provides several features that improve the ability of the user to interact with the map. Besides the user is able
to customize the layers appropriate for the tasks he performs, GIS allows to dynamically zoom in, zoom out,
get information about a specific target or select an operational area for inspection. This tool then improves
2Only for HSGPS.3Anywhere a satellite signal can be reached.
16
stakeholders capabilities with simple mouse clicks that are sufficient to perform main ground handling tasks,
without leaving the seat. Another important feature about GIS is its capability for detecting safety hazards
within the operational area. Whenever the safety performance is compromised, an alert is triggered out. For
instance, this feature is very useful to avoid collisions when guiding an aircraft along a route.
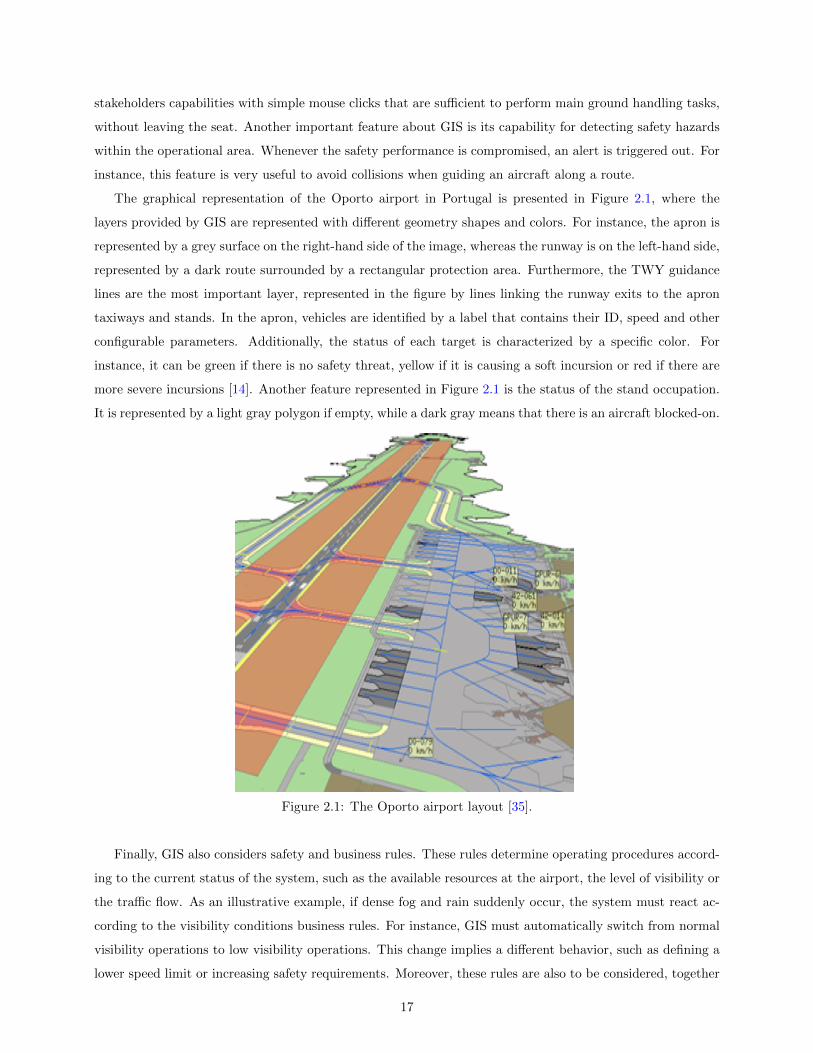
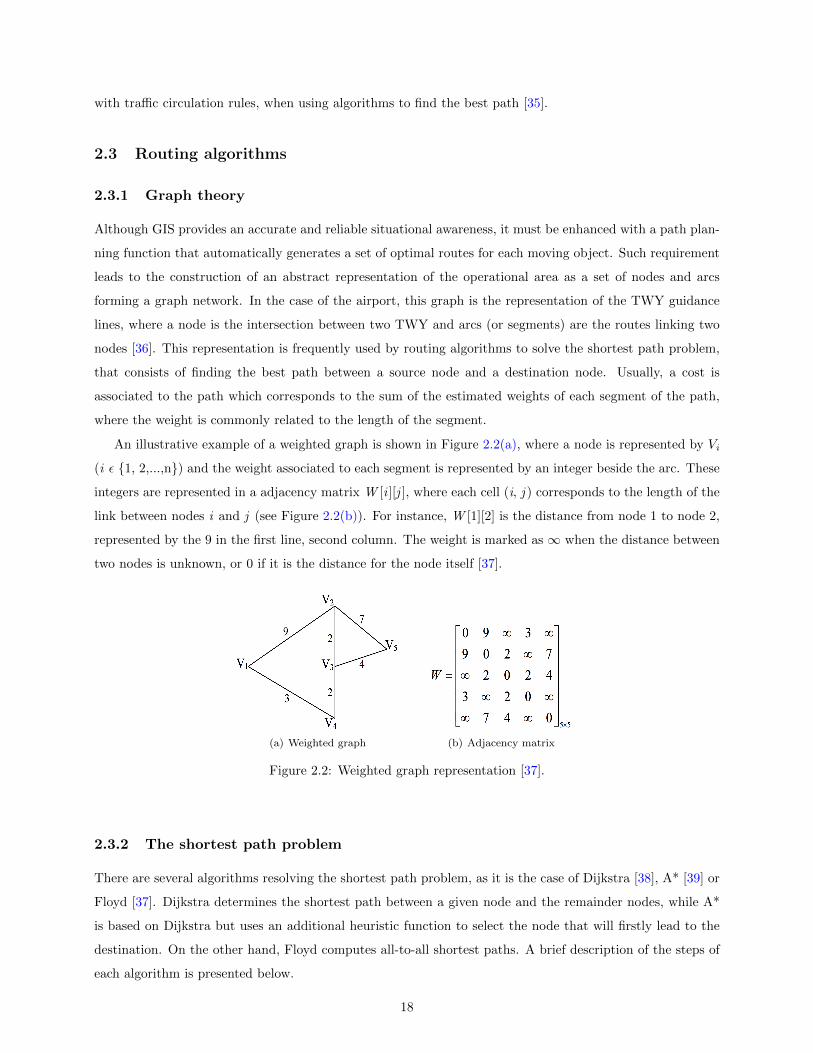
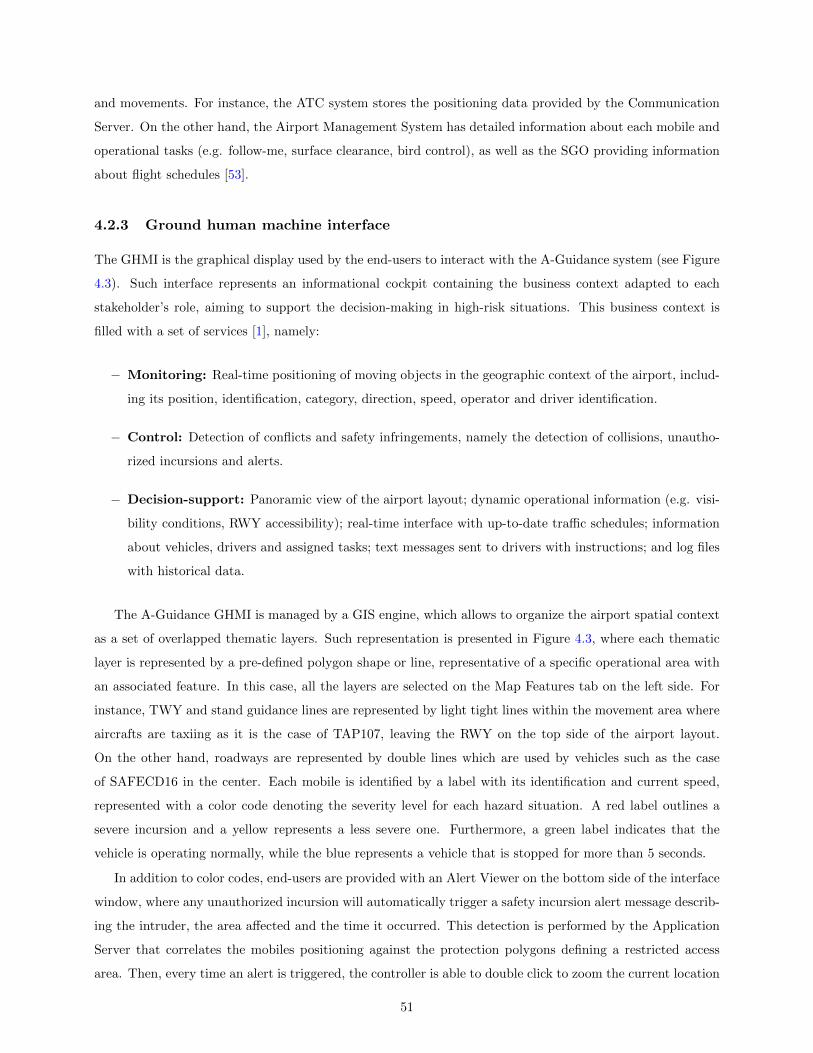
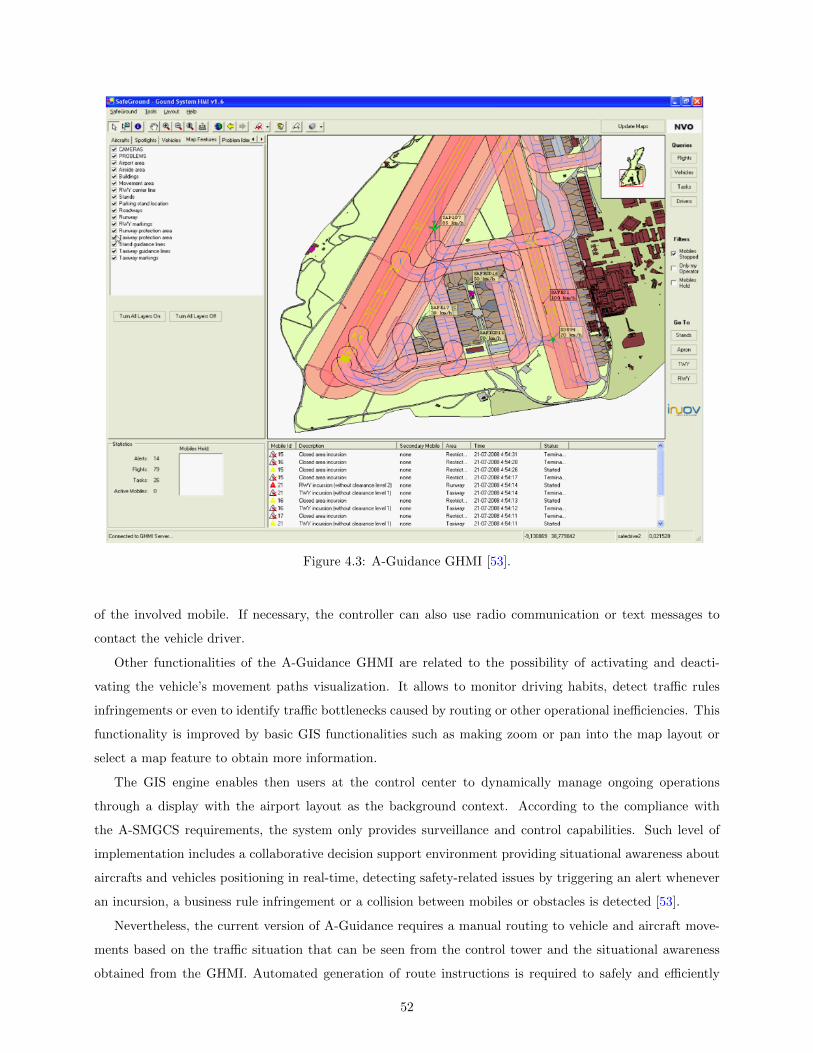
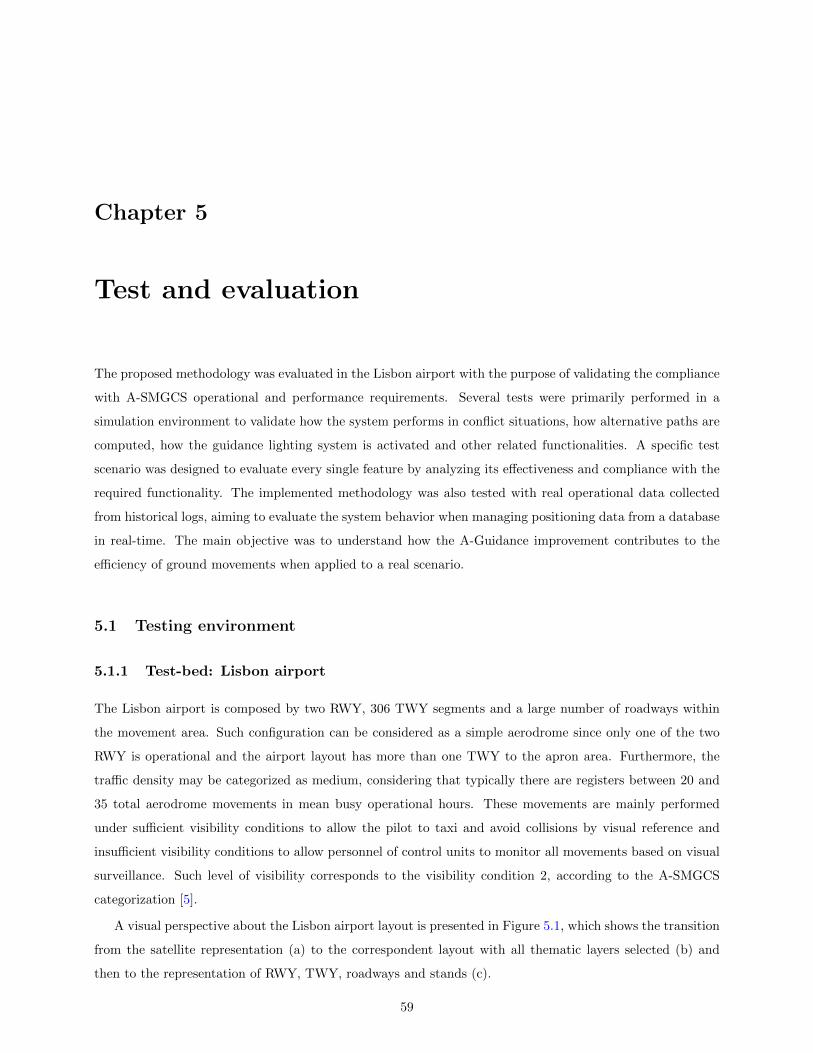
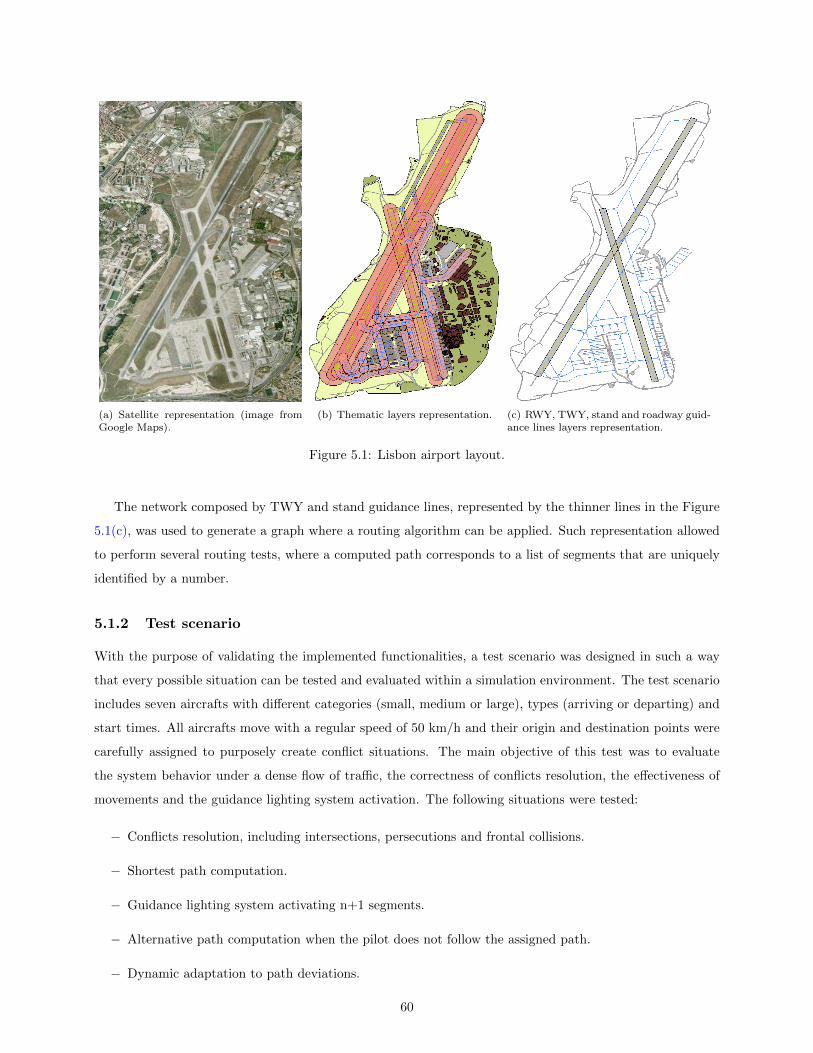
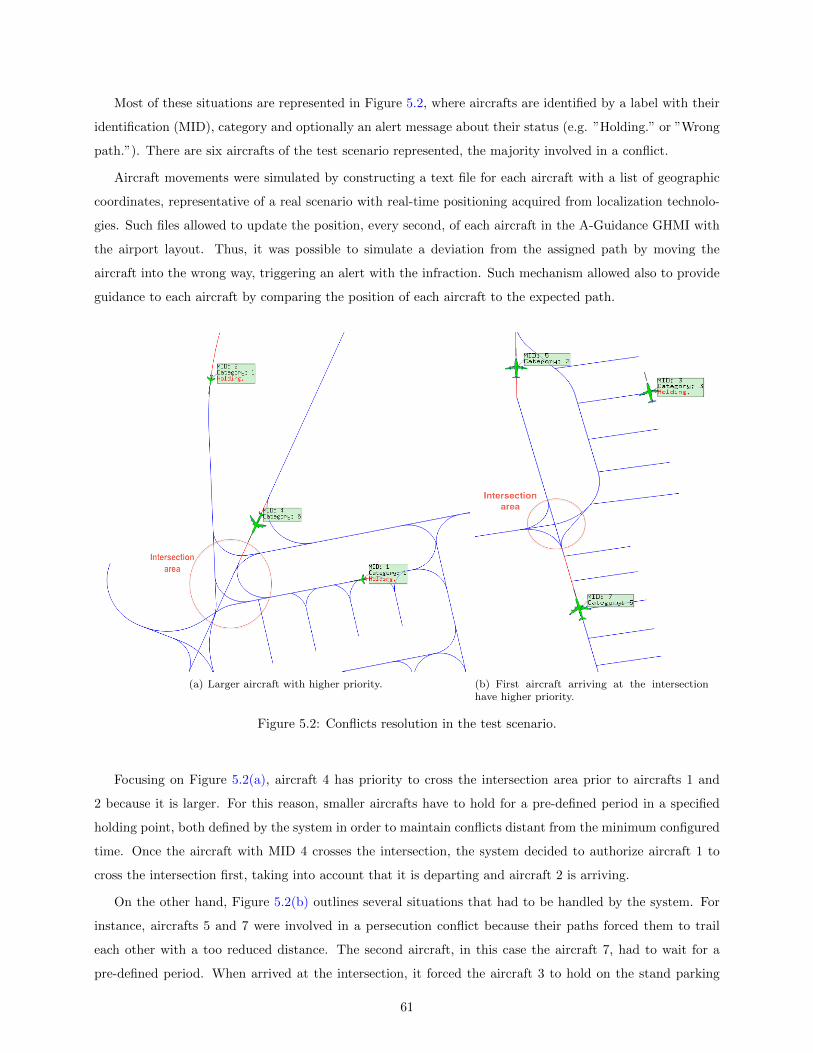
The graphical representation of the Oporto airport in Portugal is presented in Figure 2.1, where the
layers provided by GIS are represented with different geometry shapes and colors. For instance, the apron is
represented by a grey surface on the right-hand side of the image, whereas the runway is on the left-hand side,
represented by a dark route surrounded by a rectangular protection area. Furthermore, the TWY guidance
lines are the most important layer, represented in the figure by lines linking the runway exits to the apron
taxiways and stands. In the apron, vehicles are identified by a label that contains their ID, speed and other
configurable parameters. Additionally, the status of each target is characterized by a specific color. For
instance, it can be green if there is no safety threat, yellow if it is causing a soft incursion or red if there are
more severe incursions [14]. Another feature represented in Figure 2.1 is the status of the stand occupation.
It is represented by a light gray polygon if empty, while a dark gray means that there is an aircraft blocked-on.
Figure 2.1: The Oporto airport layout [35].
Finally, GIS also considers safety and business rules. These rules determine operating procedures accord-
ing to the current status of the system, such as the available resources at the airport, the level of visibility or
the traffic flow. As an illustrative example, if dense fog and rain suddenly occur, the system must react ac-
cording to the visibility conditions business rules. For instance, GIS must automatically switch from normal
visibility operations to low visibility operations. This change implies a different behavior, such as defining a
lower speed limit or increasing safety requirements. Moreover, these rules are also to be considered, together
17
with traffic circulation rules, when using algorithms to find the best path [35].
2.3 Routing algorithms
2.3.1 Graph theory
Although GIS provides an accurate and reliable situational awareness, it must be enhanced with a path plan-
ning function that automatically generates a set of optimal routes for each moving object. Such requirement
leads to the construction of an abstract representation of the operational area as a set of nodes and arcs
forming a graph network. In the case of the airport, this graph is the representation of the TWY guidance
lines, where a node is the intersection between two TWY and arcs (or segments) are the routes linking two
nodes [36]. This representation is frequently used by routing algorithms to solve the shortest path problem,
that consists of finding the best path between a source node and a destination node. Usually, a cost is
associated to the path which corresponds to the sum of the estimated weights of each segment of the path,
where the weight is commonly related to the length of the segment.
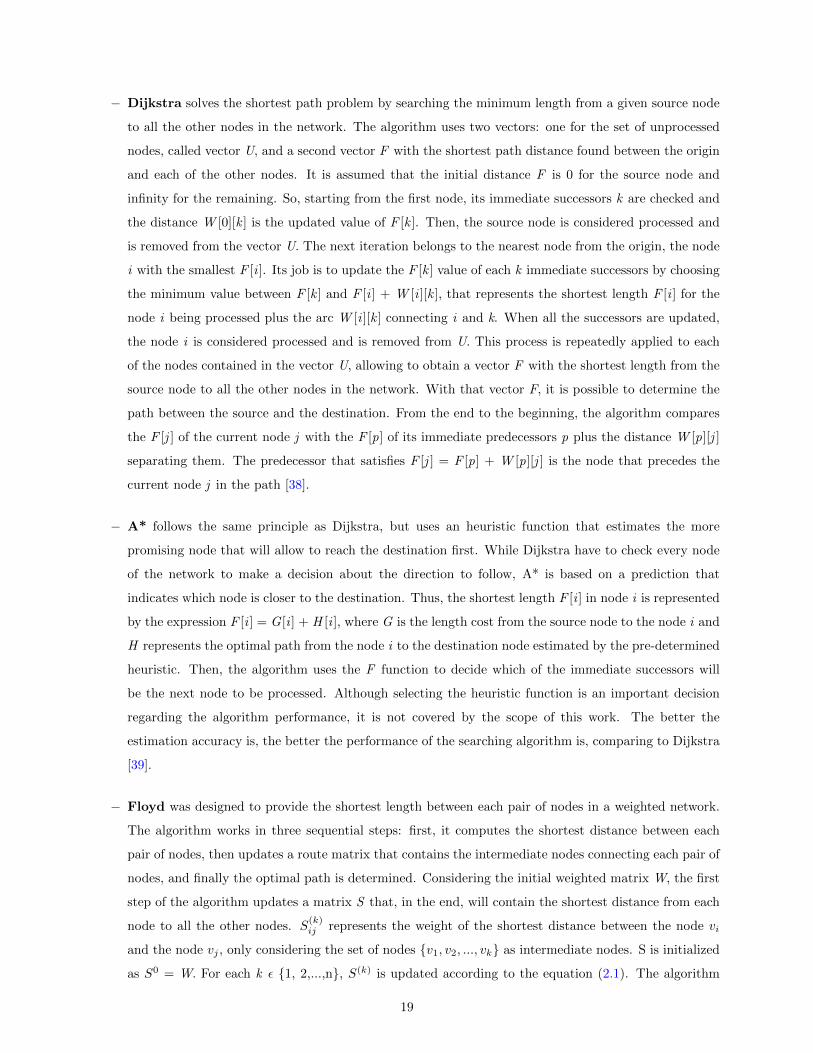
An illustrative example of a weighted graph is shown in Figure 2.2(a), where a node is represented by Vi
(i ε {1, 2,...,n}) and the weight associated to each segment is represented by an integer beside the arc. These
integers are represented in a adjacency matrix W [i ][j ], where each cell (i, j ) corresponds to the length of the
link between nodes i and j (see Figure 2.2(b)). For instance, W [1][2] is the distance from node 1 to node 2,
represented by the 9 in the first line, second column. The weight is marked as ∞ when the distance between
two nodes is unknown, or 0 if it is the distance for the node itself [37].
(a) Weighted graph (b) Adjacency matrix
Figure 2.2: Weighted graph representation [37].
2.3.2 The shortest path problem
There are several algorithms resolving the shortest path problem, as it is the case of Dijkstra [38], A* [39] or
Floyd [37]. Dijkstra determines the shortest path between a given node and the remainder nodes, while A*
is based on Dijkstra but uses an additional heuristic function to select the node that will firstly lead to the
destination. On the other hand, Floyd computes all-to-all shortest paths. A brief description of the steps of
each algorithm is presented below.
18
− Dijkstra solves the shortest path problem by searching the minimum length from a given source node
to all the other nodes in the network. The algorithm uses two vectors: one for the set of unprocessed
nodes, called vector U, and a second vector F with the shortest path distance found between the origin
and each of the other nodes. It is assumed that the initial distance F is 0 for the source node and
infinity for the remaining. So, starting from the first node, its immediate successors k are checked and
the distance W [0][k ] is the updated value of F [k ]. Then, the source node is considered processed and
is removed from the vector U. The next iteration belongs to the nearest node from the origin, the node
i with the smallest F [i ]. Its job is to update the F [k ] value of each k immediate successors by choosing
the minimum value between F [k ] and F [i ] + W [i ][k ], that represents the shortest length F [i ] for the
node i being processed plus the arc W [i ][k ] connecting i and k. When all the successors are updated,
the node i is considered processed and is removed from U. This process is repeatedly applied to each
of the nodes contained in the vector U, allowing to obtain a vector F with the shortest length from the
source node to all the other nodes in the network. With that vector F, it is possible to determine the
path between the source and the destination. From the end to the beginning, the algorithm compares
the F [j ] of the current node j with the F [p] of its immediate predecessors p plus the distance W [p][j ]
separating them. The predecessor that satisfies F [j ] = F [p] + W [p][j ] is the node that precedes the
current node j in the path [38].
− A* follows the same principle as Dijkstra, but uses an heuristic function that estimates the more
promising node that will allow to reach the destination first. While Dijkstra have to check every node
of the network to make a decision about the direction to follow, A* is based on a prediction that
indicates which node is closer to the destination. Thus, the shortest length F [i ] in node i is represented
by the expression F [i ] = G [i ] + H [i ], where G is the length cost from the source node to the node i and
H represents the optimal path from the node i to the destination node estimated by the pre-determined
heuristic. Then, the algorithm uses the F function to decide which of the immediate successors will
be the next node to be processed. Although selecting the heuristic function is an important decision
regarding the algorithm performance, it is not covered by the scope of this work. The better the
estimation accuracy is, the better the performance of the searching algorithm is, comparing to Dijkstra
[39].
− Floyd was designed to provide the shortest length between each pair of nodes in a weighted network.
The algorithm works in three sequential steps: first, it computes the shortest distance between each
pair of nodes, then updates a route matrix that contains the intermediate nodes connecting each pair of
nodes, and finally the optimal path is determined. Considering the initial weighted matrix W, the first
step of the algorithm updates a matrix S that, in the end, will contain the shortest distance from each
node to all the other nodes. S(k)ij represents the weight of the shortest distance between the node vi
and the node vj , only considering the set of nodes {v1, v2, ..., vk} as intermediate nodes. S is initialized
as S0 = W. For each k ε {1, 2,...,n}, S(k) is updated according to the equation (2.1). The algorithm
19
checks if there is a shorter path between vi and vj than the one already found in S(k−1)ij , considering
the node k that is being processed as intermediate node.
S(k)ij = min{S(k−1)
ij , S(k−1)ik + S
(k−1)kj } (2.1)
The second step of the algorithm consists in saving the best route found while checking the shortest
distance from node to node. Initialized with 0, R(k) is the matrix that keeps information about the k
node that provided the shortest distance from node i to node j. This means that, each time a shortest
path is found between node i and j, the respective R(k)ij is updated to the k index of the node that was
used as intermediate node in the path, according to the formula:
R(k)ij =
k if S
(k−1)ij > S
(k−1)ik + S
(k−1)kj
R(k−1)ij else
(2.2)
The last task in Floyd is to determine the shortest path from a given source i to a destination j. Based
on the S and R matrices, the algorithm first finds the intermediate node between nodes i and j, denoted
as t. It then verifies if there is another node between i and t. If not, it continues to the other piece of
the path, between t and j. This verification is recursively applied until there is no other intermediate
nodes. It must satisfy the condition R(n)pq = 0, representing there is no other intermediate node between
two nodes p and q during the path construction. The shortest path is therefore the set of intermediate
nodes between the source i and the target j [37].
2.3.3 The k shortest paths problem
Assigning routes to simultaneous movements at the same time requires the ability to find alternative paths
when there is a conflict. The computation of k shortest paths to the same destination is an efficient solution
that provides a list of k alternative routes, where k is an arbitrary natural number. These routes are sorted
in an ascendent order with respect to their lengths. The following of this section makes a survey about three
algorithms resolving the k shortest paths problem:
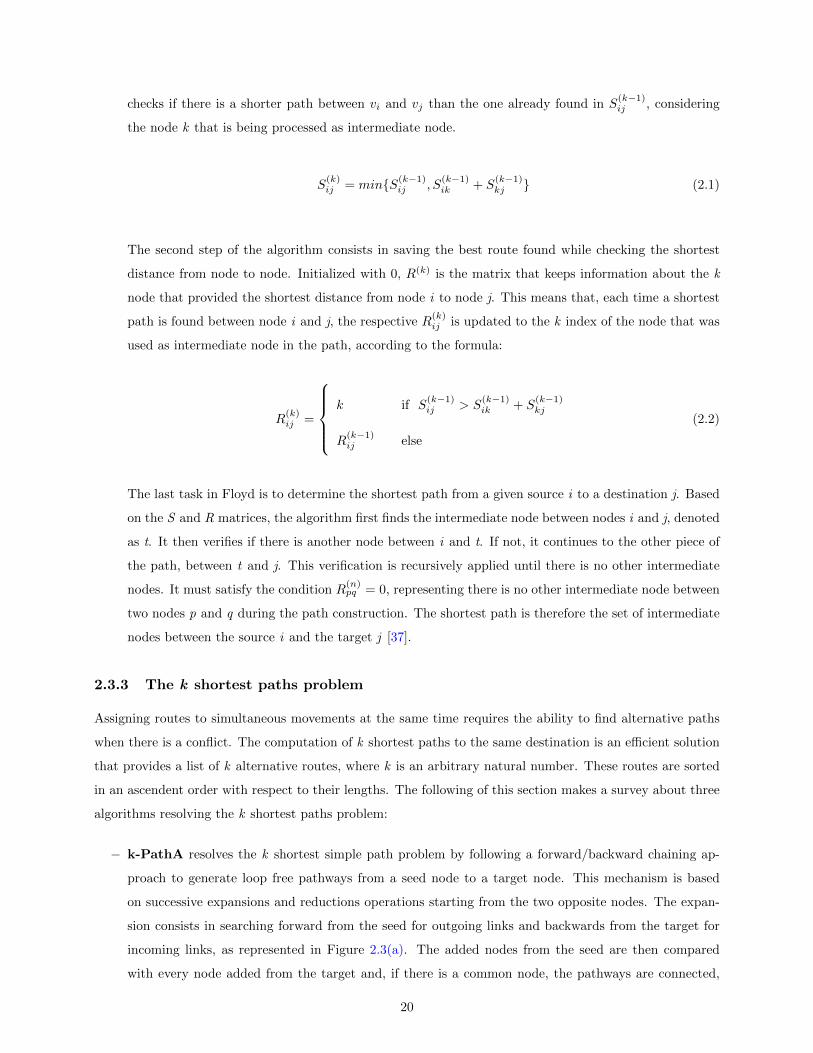
− k-PathA resolves the k shortest simple path problem by following a forward/backward chaining ap-
proach to generate loop free pathways from a seed node to a target node. This mechanism is based
on successive expansions and reductions operations starting from the two opposite nodes. The expan-
sion consists in searching forward from the seed for outgoing links and backwards from the target for
incoming links, as represented in Figure 2.3(a). The added nodes from the seed are then compared
with every node added from the target and, if there is a common node, the pathways are connected,
20
evaluated and stored (see green node in Figure 2.3(b)). This step is repeated until there are no new
nodes to add or the length of the paths reached a pre-defined threshold. For each iteration, the number
of added nodes is reduced to a user-defined value. As shown in Figure 2.3(b), the expanded nodes were
reduced to the 4 nodes with lower distance weights, followed by a new expansion cycle. Figure 2.3(c)
represents the stop condition, where no other new nodes can be added and common nodes were found.
(a) Expansion from seed andtarget nodes
(b) Reduction to k shortestpathways (k=4); expansion
(c) Reduction, no expansion (d) k shortest pathways
Figure 2.3: k shortest simple Path Algorithm. Dark Red = Seed Node. Dark Blue = Target Node. Red =Expanded Node (forward). Blue = Expanded Node (backward). Light Red = Added Nodes (forward). LightBlue = Added Nodes (backward). Green = Common Node [40].
Finally, all possible combinations between pathways from the seed to the common node are generated,
as well as from the common node to the target. Thus, if there are m pathways from the seed to
the common node and n pathways from the common node to the target, m ∗ n shortest paths are
produced. The length of pathways is computed and sorted by their cost, from which the k shortest
paths are selected (see Figure 2.3(d)) [40].
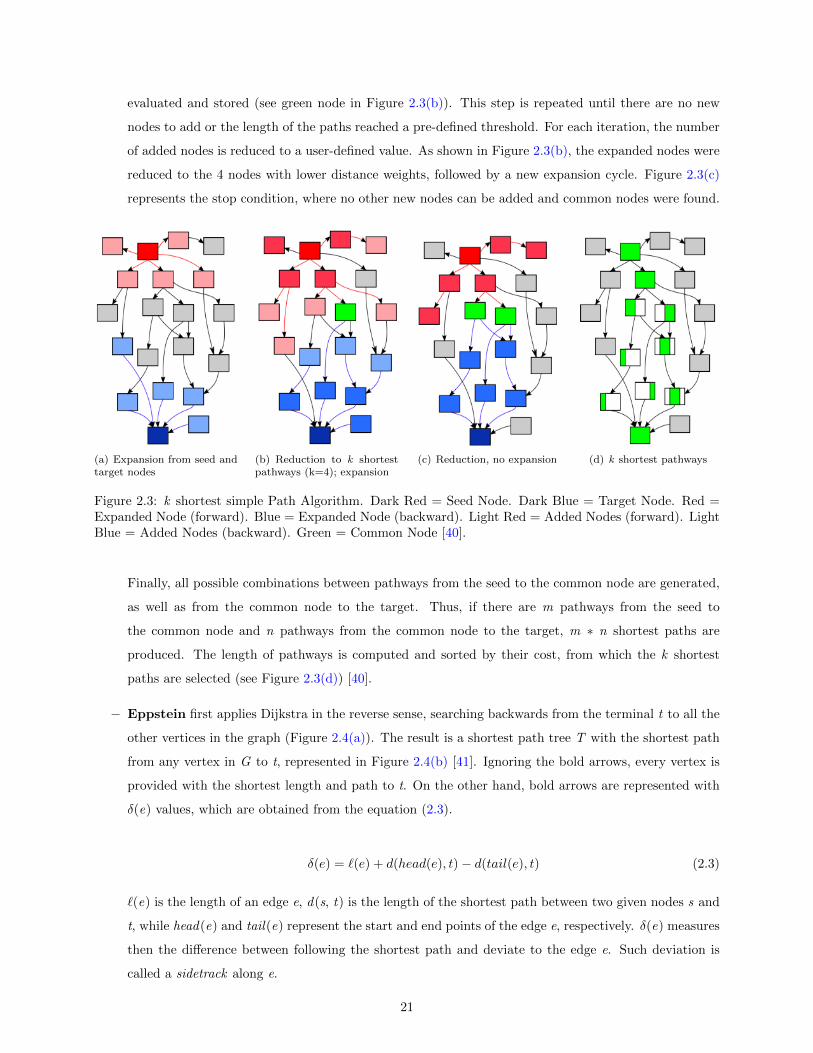
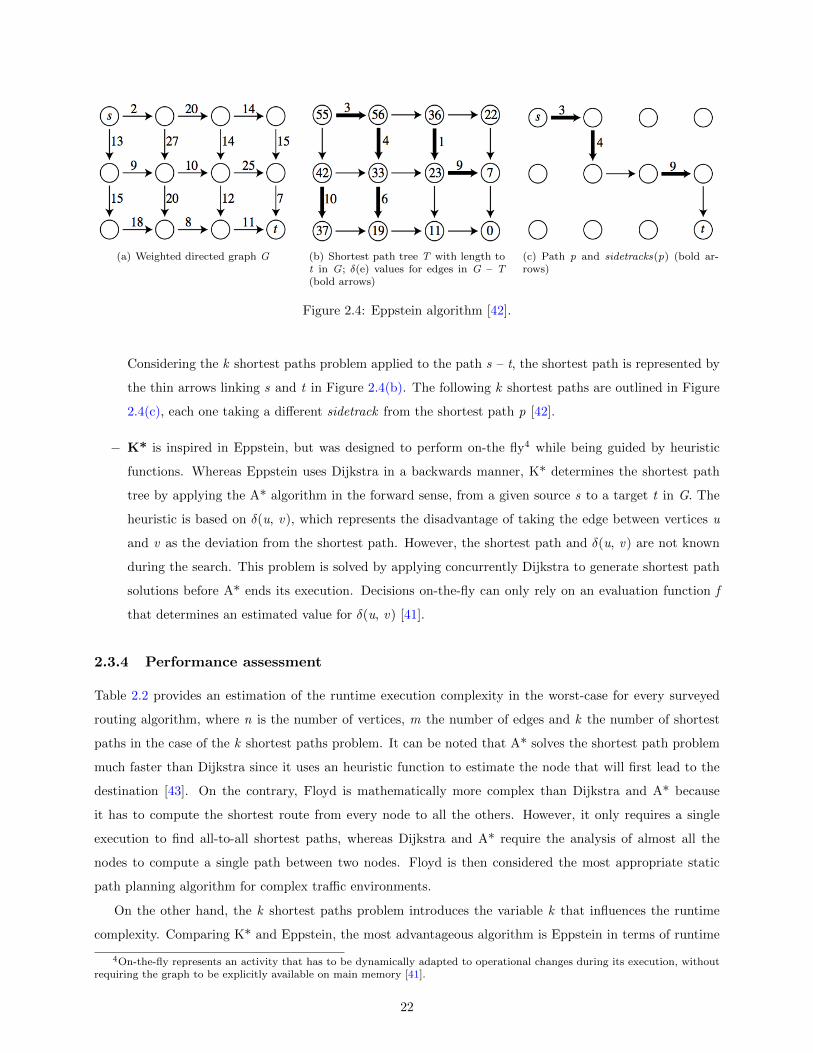
− Eppstein first applies Dijkstra in the reverse sense, searching backwards from the terminal t to all the
other vertices in the graph (Figure 2.4(a)). The result is a shortest path tree T with the shortest path
from any vertex in G to t, represented in Figure 2.4(b) [41]. Ignoring the bold arrows, every vertex is
provided with the shortest length and path to t. On the other hand, bold arrows are represented with
δ(e) values, which are obtained from the equation (2.3).
δ(e) = `(e) + d(head(e), t)− d(tail(e), t) (2.3)
`(e) is the length of an edge e, d(s, t) is the length of the shortest path between two given nodes s and
t, while head(e) and tail(e) represent the start and end points of the edge e, respectively. δ(e) measures
then the difference between following the shortest path and deviate to the edge e. Such deviation is
called a sidetrack along e.
21
(a) Weighted directed graph G (b) Shortest path tree T with length tot in G; δ(e) values for edges in G – T(bold arrows)
(c) Path p and sidetracks(p) (bold ar-rows)
Figure 2.4: Eppstein algorithm [42].
Considering the k shortest paths problem applied to the path s – t, the shortest path is represented by
the thin arrows linking s and t in Figure 2.4(b). The following k shortest paths are outlined in Figure
2.4(c), each one taking a different sidetrack from the shortest path p [42].
− K* is inspired in Eppstein, but was designed to perform on-the fly4 while being guided by heuristic
functions. Whereas Eppstein uses Dijkstra in a backwards manner, K* determines the shortest path
tree by applying the A* algorithm in the forward sense, from a given source s to a target t in G. The
heuristic is based on δ(u, v), which represents the disadvantage of taking the edge between vertices u
and v as the deviation from the shortest path. However, the shortest path and δ(u, v) are not known
during the search. This problem is solved by applying concurrently Dijkstra to generate shortest path
solutions before A* ends its execution. Decisions on-the-fly can only rely on an evaluation function f
that determines an estimated value for δ(u, v) [41].
2.3.4 Performance assessment
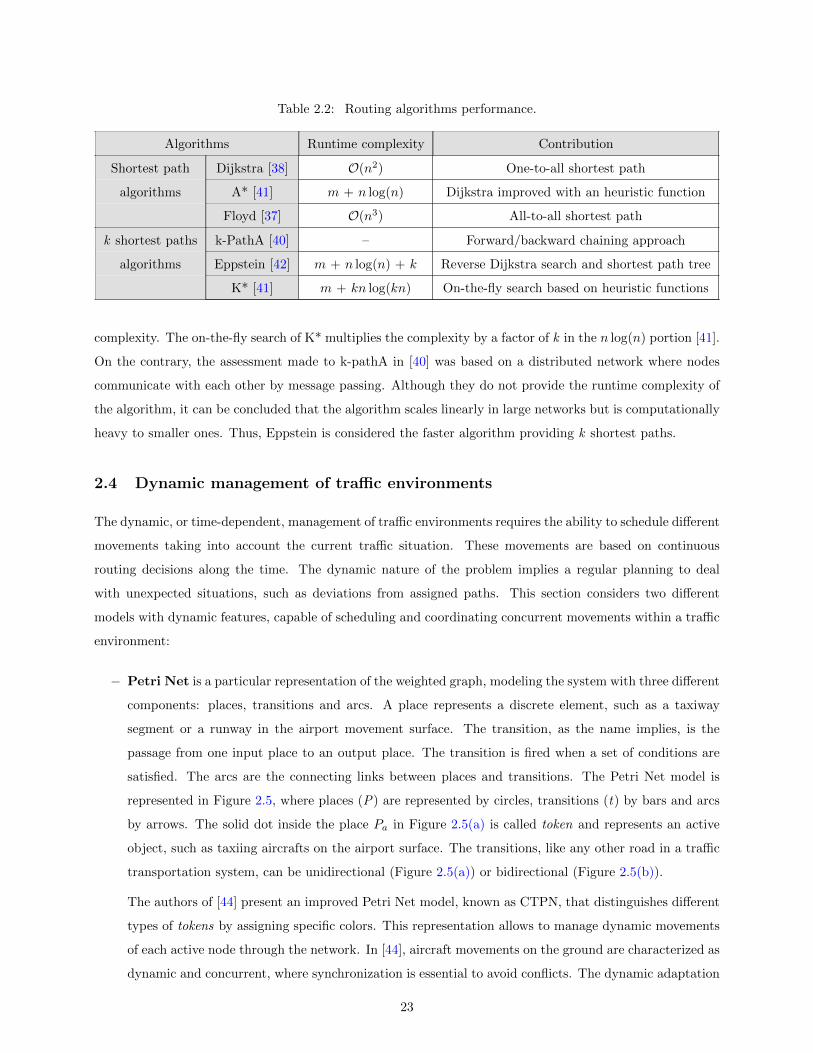
Table 2.2 provides an estimation of the runtime execution complexity in the worst-case for every surveyed
routing algorithm, where n is the number of vertices, m the number of edges and k the number of shortest
paths in the case of the k shortest paths problem. It can be noted that A* solves the shortest path problem
much faster than Dijkstra since it uses an heuristic function to estimate the node that will first lead to the
destination [43]. On the contrary, Floyd is mathematically more complex than Dijkstra and A* because
it has to compute the shortest route from every node to all the others. However, it only requires a single
execution to find all-to-all shortest paths, whereas Dijkstra and A* require the analysis of almost all the
nodes to compute a single path between two nodes. Floyd is then considered the most appropriate static
path planning algorithm for complex traffic environments.
On the other hand, the k shortest paths problem introduces the variable k that influences the runtime
complexity. Comparing K* and Eppstein, the most advantageous algorithm is Eppstein in terms of runtime
4On-the-fly represents an activity that has to be dynamically adapted to operational changes during its execution, withoutrequiring the graph to be explicitly available on main memory [41].
algorithms A* [41] m + n log(n) Dijkstra improved with an heuristic function
Floyd [37] O(n3) All-to-all shortest path
k shortest paths k-PathA [40] – Forward/backward chaining approach
algorithms Eppstein [42] m + n log(n) + k Reverse Dijkstra search and shortest path tree
K* [41] m + kn log(kn) On-the-fly search based on heuristic functions
complexity. The on-the-fly search of K* multiplies the complexity by a factor of k in the n log(n) portion [41].
On the contrary, the assessment made to k-pathA in [40] was based on a distributed network where nodes
communicate with each other by message passing. Although they do not provide the runtime complexity of
the algorithm, it can be concluded that the algorithm scales linearly in large networks but is computationally
heavy to smaller ones. Thus, Eppstein is considered the faster algorithm providing k shortest paths.
2.4 Dynamic management of traffic environments
The dynamic, or time-dependent, management of traffic environments requires the ability to schedule different
movements taking into account the current traffic situation. These movements are based on continuous
routing decisions along the time. The dynamic nature of the problem implies a regular planning to deal
with unexpected situations, such as deviations from assigned paths. This section considers two different
models with dynamic features, capable of scheduling and coordinating concurrent movements within a traffic
environment:
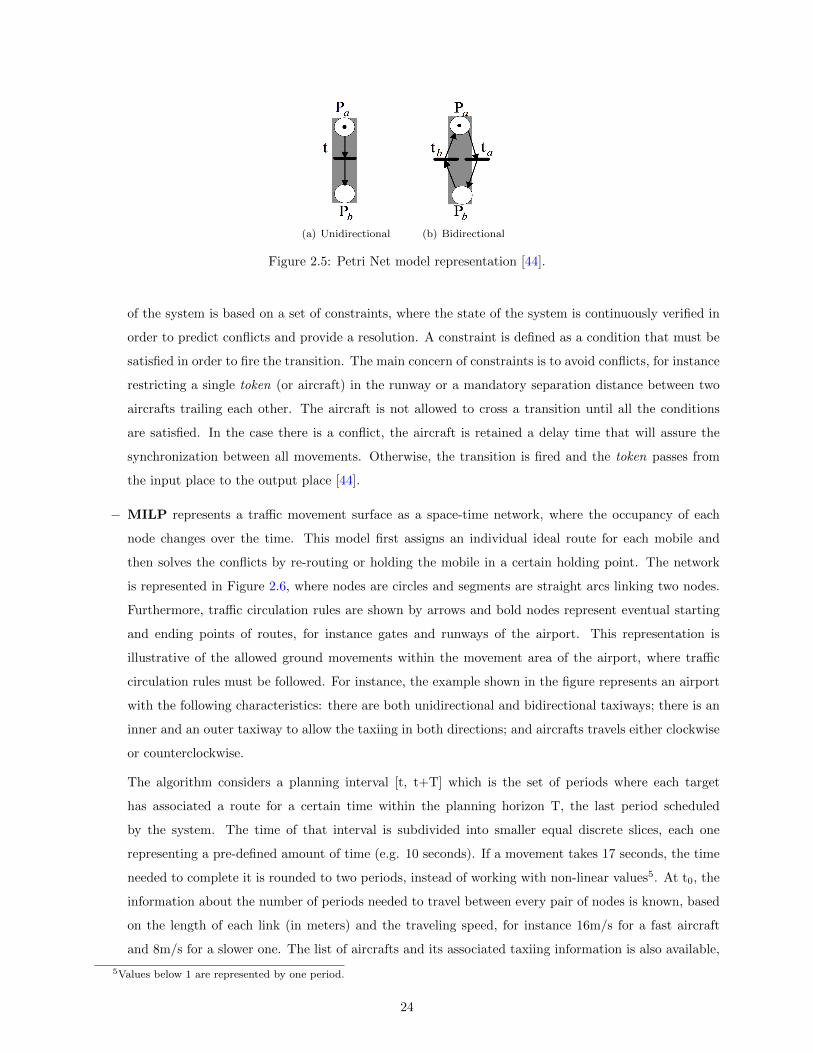
− Petri Net is a particular representation of the weighted graph, modeling the system with three different
components: places, transitions and arcs. A place represents a discrete element, such as a taxiway
segment or a runway in the airport movement surface. The transition, as the name implies, is the
passage from one input place to an output place. The transition is fired when a set of conditions are
satisfied. The arcs are the connecting links between places and transitions. The Petri Net model is
represented in Figure 2.5, where places (P) are represented by circles, transitions (t) by bars and arcs
by arrows. The solid dot inside the place Pa in Figure 2.5(a) is called token and represents an active
object, such as taxiing aircrafts on the airport surface. The transitions, like any other road in a traffic
transportation system, can be unidirectional (Figure 2.5(a)) or bidirectional (Figure 2.5(b)).
The authors of [44] present an improved Petri Net model, known as CTPN, that distinguishes different
types of tokens by assigning specific colors. This representation allows to manage dynamic movements
of each active node through the network. In [44], aircraft movements on the ground are characterized as
dynamic and concurrent, where synchronization is essential to avoid conflicts. The dynamic adaptation
23
(a) Unidirectional (b) Bidirectional
Figure 2.5: Petri Net model representation [44].
of the system is based on a set of constraints, where the state of the system is continuously verified in
order to predict conflicts and provide a resolution. A constraint is defined as a condition that must be
satisfied in order to fire the transition. The main concern of constraints is to avoid conflicts, for instance
restricting a single token (or aircraft) in the runway or a mandatory separation distance between two
aircrafts trailing each other. The aircraft is not allowed to cross a transition until all the conditions
are satisfied. In the case there is a conflict, the aircraft is retained a delay time that will assure the
synchronization between all movements. Otherwise, the transition is fired and the token passes from
the input place to the output place [44].
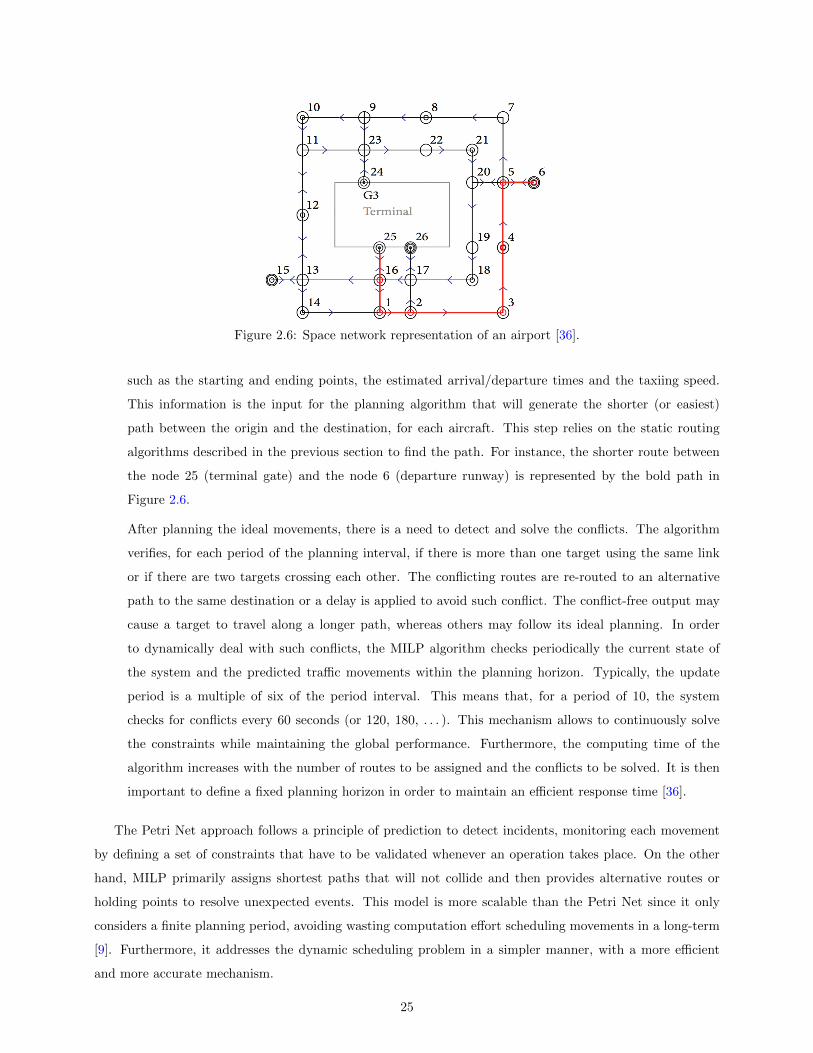
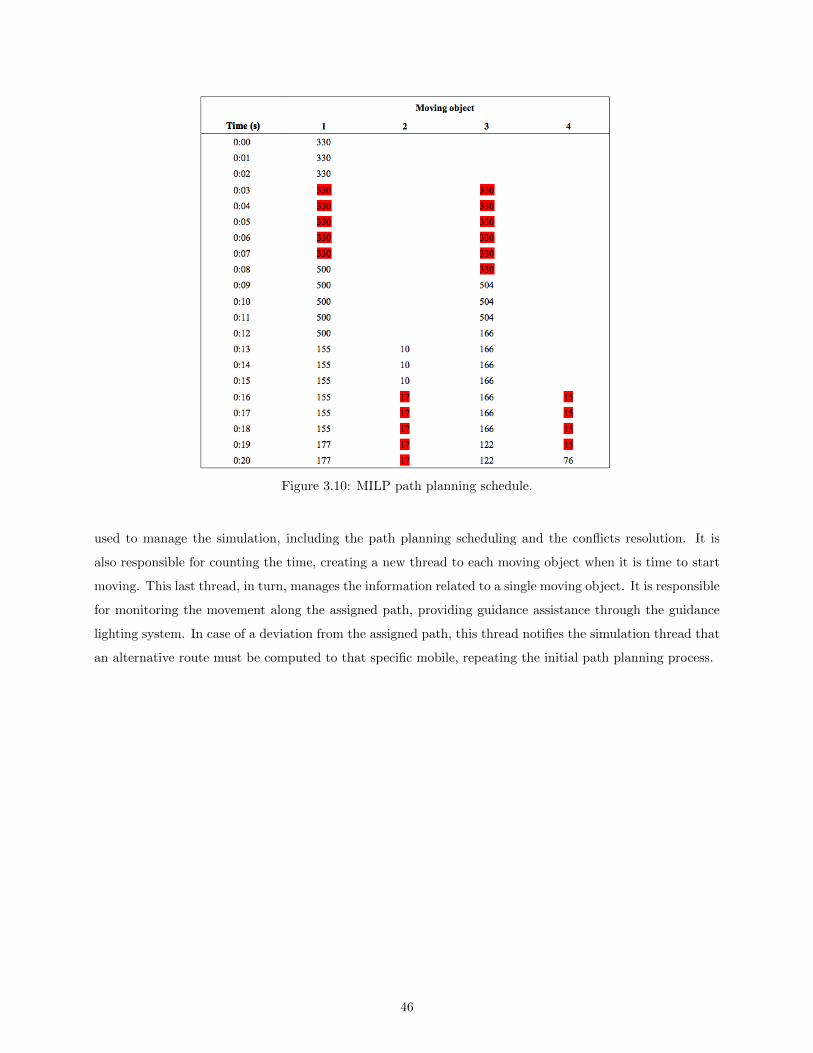
− MILP represents a traffic movement surface as a space-time network, where the occupancy of each
node changes over the time. This model first assigns an individual ideal route for each mobile and
then solves the conflicts by re-routing or holding the mobile in a certain holding point. The network
is represented in Figure 2.6, where nodes are circles and segments are straight arcs linking two nodes.
Furthermore, traffic circulation rules are shown by arrows and bold nodes represent eventual starting
and ending points of routes, for instance gates and runways of the airport. This representation is
illustrative of the allowed ground movements within the movement area of the airport, where traffic
circulation rules must be followed. For instance, the example shown in the figure represents an airport
with the following characteristics: there are both unidirectional and bidirectional taxiways; there is an
inner and an outer taxiway to allow the taxiing in both directions; and aircrafts travels either clockwise
or counterclockwise.
The algorithm considers a planning interval [t, t+T] which is the set of periods where each target
has associated a route for a certain time within the planning horizon T, the last period scheduled
by the system. The time of that interval is subdivided into smaller equal discrete slices, each one
representing a pre-defined amount of time (e.g. 10 seconds). If a movement takes 17 seconds, the time
needed to complete it is rounded to two periods, instead of working with non-linear values5. At t0, the
information about the number of periods needed to travel between every pair of nodes is known, based
on the length of each link (in meters) and the traveling speed, for instance 16m/s for a fast aircraft
and 8m/s for a slower one. The list of aircrafts and its associated taxiing information is also available,
5Values below 1 are represented by one period.
24
Figure 2.6: Space network representation of an airport [36].
such as the starting and ending points, the estimated arrival/departure times and the taxiing speed.
This information is the input for the planning algorithm that will generate the shorter (or easiest)
path between the origin and the destination, for each aircraft. This step relies on the static routing
algorithms described in the previous section to find the path. For instance, the shorter route between
the node 25 (terminal gate) and the node 6 (departure runway) is represented by the bold path in
Figure 2.6.
After planning the ideal movements, there is a need to detect and solve the conflicts. The algorithm
verifies, for each period of the planning interval, if there is more than one target using the same link
or if there are two targets crossing each other. The conflicting routes are re-routed to an alternative
path to the same destination or a delay is applied to avoid such conflict. The conflict-free output may
cause a target to travel along a longer path, whereas others may follow its ideal planning. In order
to dynamically deal with such conflicts, the MILP algorithm checks periodically the current state of
the system and the predicted traffic movements within the planning horizon. Typically, the update
period is a multiple of six of the period interval. This means that, for a period of 10, the system
checks for conflicts every 60 seconds (or 120, 180, . . . ). This mechanism allows to continuously solve
the constraints while maintaining the global performance. Furthermore, the computing time of the
algorithm increases with the number of routes to be assigned and the conflicts to be solved. It is then
important to define a fixed planning horizon in order to maintain an efficient response time [36].
The Petri Net approach follows a principle of prediction to detect incidents, monitoring each movement
by defining a set of constraints that have to be validated whenever an operation takes place. On the other
hand, MILP primarily assigns shortest paths that will not collide and then provides alternative routes or
holding points to resolve unexpected events. This model is more scalable than the Petri Net since it only
considers a finite planning period, avoiding wasting computation effort scheduling movements in a long-term
[9]. Furthermore, it addresses the dynamic scheduling problem in a simpler manner, with a more efficient
and more accurate mechanism.
25
2.5 Research projects
2.5.1 Programmes and implementations
This section presents the main conclusions derived from the survey about existing projects related to the
study of A-SMGCS recommendations and how it may improve airport safety. In this context, the following
programmes and implementations describe the major A-SMGCS operational concepts as part of the state-
of-the-art research from EMMA in Europe, where were identified the main European airports: Heathrow
(London), Frankfurt Main (Frankfurt), Charles De Gaulle (CDG, Paris) and Schiphol (Amsterdam) [15].
EMMA is the project aiming to achieve an harmonized implementation of A-SMGCS in Europe by imple-
menting, testing and evaluating current A-SMGCS solutions. It is divided in two implementation phases:
the first aims to validate and consolidate levels I and II, while the second is the preparation and definition
of levels III and IV [2].
− Linking Existing ON ground, ARrival and Departure Operations: LEONARDO was a project
awarded by the European Commission in the 5th R&D Framework, beginning in December 2001 with
a duration of two years. The main concern of this project was the operating cost resulting from
uncoordinated and inefficient ground movements in the airport surface. LEONARDO aimed to define
a planning tool for managing arrival, departure and ground operations. The system was tested under
real conditions, at Madrid-Barajas and Paris-CDG airports. The efficiency, safety and capacity of the
airport operations were improved and the workload of the controllers was reduced [15].
− Integrated Airport Apron Safety Fleet Management: The AAS was a project co-funded by
DG TREN in the Aeronautics and Air Transport Research 7th Framework Programme, that aimed to
improve and increase the efficiency of vehicles movements within the movement area of the airport.
This project is under development since 2008 for a duration of three years, which tests have been
conducted in two airports, namely Berlin Tegel (TXL) in Germany and Oporto (OPO) in Portugal.
One of the major components in AAS is the A-Guidance, a software that enables controllers to manage
ground movements in real-time by providing accurate and updated positioning data about aircrafts and
vehicles. The A-Guidance is basically a graphical application that displays the airport spatial context
with the current traffic situation, providing a set of functionalities (e.g. triggering alerts when a safety
infringement occurs) that allow a dynamic interaction with the system [35].
− A-SMGCS at Milan-Malpensa and Stockholm-Arlanda airports: The Italian Milan-Malpensa
(MXP) airport provides levels I and II of A-SMGCS, initially supported by the ASR and SMR surveil-
lance technologies and then enhanced with an MLAT solution and a conflict detection tool [2]. On the
other hand, the Swedish Stockholm-Arlanda airport is more or less at the same A-SMGCS level, but
provides both SMR and ADS-B capabilities [15].
− A-SMGCS at Paris-CDG and London-Heathrow airports: CDG and Heathrow airports are also
equipped with the first two levels of A-SMGCS, providing surveillance and control functions. Both have
26
installed an SMR system for detecting unidentified targets, more than one ASR to identify air targets, a
RIMCAS as an incursion alerting function and a Multilateration Mode-S for tracking identified ground
targets. Whereas Heathrow provides a very reliable surveillance service, CDG has the problem of false
detections that affects the controllers performance [15].
In the American context, the NAS programme in the United States aims at improving the operational
performance under all weather conditions, enhancing the ground movements coordination and providing a
better situational awareness for either controllers and drivers. NAS purposes that ADS-B should be extended
to a non-cooperative surveillance service, allowing the reliable detection of intruders and the surveillance of
targets without an ADS-B transponder [15]. Furthermore, the FAA has designed the ATGS prototype, as
described below.
Advanced Taxiway Guidance System: Automated taxiway lighting system that helps guiding air-
crafts along their route on the airport surface. It was evaluated at the Atlantic City International Airport
(ACY, New Jersey, United States) with twelve microwave detectors installed on the ground and four RFID
antennas and reader units, each aircraft equipped with an identification tag. These relatively cheap sen-
sors allow to first detect the passage of an aircraft over a specific segment of the taxiway and then gather
information about its identification.
The system is composed by a host computer, a light control system and the sensors. The host computer is
the master controller of the system. It receives information from the sensors (aircraft identification, position
and direction) and decides which lights must be turned on. The light control system receives instructions
from the host computer to turn on the lights that will guide the aircraft and to turn off those behind the
aircraft that are no longer necessary. The system also detects conflicts between aircrafts and provides a
warning function to alert the controllers. Through a HMI, the controller is able to hold the aircraft at certain
microwave barriers by voice communication or turning off the lights ahead.
ATGS allows the coordination between aircrafts, each one following its assigned route by voice instructions
from the controller and by visual support of the lights on the ground. Ground movements are then safer and
easier operations, since runway incursions are avoided and pilots are guided to follow the right path without
mistakes. This is particularly true when operating under LVO conditions [45].
The A-SMGCS concept proposed by ICAO is being promoted by global entities, such as EUROCONTROL
and FAA, which aim at maturing levels I and II of A-SMGCS in order to prepare the next step: extend
current implementations with routing and guidance functions. The main goal is to support and improve
existing projects in order to achieve a robust and stable A-SMGCS system in almost all airports in the world,
from 2020 onwards [15].
2.5.2 The surveillance strategy adopted in Europe
In Europe, much effort is being performed in order to achieve the requirements addressed by A-SMGCS.
However, only surveillance and control functionalities are provided in major airports and have not achieved
27
the required level of reliability yet. For that reason, EUROCONTROL planned the surveillance strategy for
the next decade, aiming at defining the technological path that will provide safer, interoperable and cost-
effective solutions, leading to routing and guidance functions. Such path refers to the passage from levels I
and II to levels III and IV of A-SMGCS, by continuously maturing the surveillance technologies. The strategy
is divided into several periods, as described below [16]:
− From 2008 to 2010: SMR and MLAT Mode-S are the main technologies used to detect both aircrafts
and vehicles location. Furthermore, MLAT, combined with ADS-B, allows ground controllers to have
information about the identification of the aircraft.
− From 2010 to 2015: It is intended to continue the implementation of levels I and II of A-SMGCS,
extending the airport traffic situational awareness to both pilots and drivers. It is also required that
aircrafts are widely equipped with ADS-B-out transmitters and the airport with ADS-B sensor infras-
tructures in order to support applications such as ADS-B-APT. Another challenge that will be studied
is the ADS-B-in that will provide an accurate and reliable guidance to pilots.
− From 2015 to 2020: In this phase, the main effort will focus on the implementation of levels III
and IV of A-SMGCS. By 2020, MLAT methods will be replaced by innovative surveillance techniques
that will provide more reliable and more accurate positioning of all moving objects. Investigators are
already thinking about passive surveillance technologies and Multi Static Radars.
The surveillance evolutionary path is represented in Figure 2.7, where it is possible to notice the transition
from SMR and MLAT solutions to a more sophisticated ADS-B system (on the top of the figure) that also
provides a more reliable picture to pilots and vehicles drivers. At the bottom of Figure 2.7, the surveil-
lance data processing and distribution refers to the continuous improvement of methods used to process the
surveillance data and respective sharing between the infrastructure components.
Figure 2.7: The EUROCONTROL surveillance strategy [16].
On the other hand, the transition between levels I and II and levels III and IV of A-SMGCS is explicitly
shown in Figure 2.7, where levels III and IV are only predicted from 2015 onwards. This fact is due to the
A-SMGCS operational needs, requiring to primarily focus on the surveillance and control services in order
to provide reliable and accurate information to routing and guidance functionalities.
28
Chapter 3
Methodology
This chapter describes how the problem stated in Chapter 1 was solved, based on the existing solutions
discussed in the previous chapter. The first section starts by presenting the main A-SMGCS requirements
when developing a system providing routing and guidance functionalities. The proposed methodology is then
presented, specifying which decisions were made and how the overall system works. Afterwards, a detailed
description of the implementation is provided, focusing separately on each feature of the system.
3.1 A-SMGCS requirements
3.1.1 Operational requirements
ICAO established a set of requirements related to the development and implementation of an A-SMGCS
[5], aiming to enhance the capacity and safety of surface movement operations in any aerodrome. The
main objective of this section is to outline which requirements should be considered while implementing the
proposed solution. Later on Chapter 5, the solution will be evaluated according to the requirements defined
here.
Table 3.1 presents the basic functional requirements, defined by ICAO, that must be taken into account
while implementing an A-SMGCS, with a special emphasis on routing and guidance functions. As shown,
each requirement is identified by an unique numbered label (e.g. S2), classified according to the respective
function. The outlined requirements are the strictly necessary to be considered within the scope of this
thesis, regarding the proposed objectives. For this reason, the surveillance function should provide accurate
and continuous positioning about every moving object within the movement area, while the control function
mainly handles the aerodrome capacity and detects the conflicts and provides a resolution. If these functions
are correctly implemented, the routing and guidance goals will certainly be successfully accomplished. On
the one hand, the routing function should designate routes for each moving object within the movement area,
allowing for a change of a route or destination at any time. Some of the main concerns are related to the
path length and to avoid the conflicts between each movement. On the other hand, the guidance function
should improve the compliance of each assigned route by providing clear instructions to the pilot. The system
29
should be prepared to deal with a change of a route at any time, while adapting the traffic flow in order to
avoid any conflict or safety hazard.
Table 3.1: A-SMGCS operational requirements [5].
Function Requirements
• S1: Provide accurate positioning about all moving objects within the monitored area.
Surveillance • S2: Cope either with moving and static objects.
• S3: Update moving objects’ position along the time.
• C1: Have the capacity for planning the requested movements within a period of up to
one hour (static capacity).
Control • C2: Have the capacity for supporting the maximum authorized movement rate at any
time (dynamic capacity).
• C3: Detect conflicts and provide resolutions.
• R1: Be able to compute a route for each authorized moving object.
• R2: Allow for a change of destination at any time.
• R3: Allow for a change of a route to the same destination at any time.
• R4: Cope with large flows of traffic at complex aerodromes.
Routing • R6: Minimize the length of computed paths.
• R7: Minimize the conflicts.
• R8: Ease of adaptation to operational changes (e.g. routes closed for maintenance,
temporary hazards or obstacles).
• R9: Use standard terms and symbols.
• R10: Be capable of validating routes.
• G1: Provide guidance for every authorized moving object, for any assigned route.
• G2: Provide clear instructions to pilots to help them following their path.
Guidance • G3: All pilots should be continuously aware about their position on their assigned routes.
• G4: Allow for a change of a route at any time.
• G5: The system should detect routes and areas that are restricted or not available for use.
• G6: Allow monitoring the operational status of all guidance aids.
3.1.2 Performance requirements
In Table 3.2 are represented the performance requirements to be considered in the implementation of the
proposed solution. These parameters were specifically defined by ICAO to be applied in an airport movement
area. The first specification is that the surveillance function should provide the position and identification of
every moving object in real-time, by refreshing the information at least once per second. This information
must be as accurate as possible, within a radius of 7.5 m. Moreover, the control function must remain
30
extremely reliable, as it should detect above 99.9% of the conflicts and the probability of triggering a false
alert is almost 0%. The precision and reliability of these two last functions are crucial to allow a good
performance expected from the routing and guidance functions. This is due to the close relationship between
the accurate detection of the position of the moving object, the detection of a conflict and consequently the
route computation efficiency and the dynamic re-routing and adaptation to tactical changes. Therefore, the
routing function should compute the optimal path in less than 10 seconds and recompute an alternative path
within 1 second. For the guidance function, it is required that its overall initialization takes less than 2
seconds and that the reversion time spends a maximum of 0.5 seconds.
Table 3.2: A-SMGCS performance requirements [5].
Function Requirements
• S1: Be capable of detecting an aircraft within a radius of 7.5 m.
Surveillance • S2: The position and identification of a moving object should be updated at least once
per second.
• C1: The probability of detection of an alert should be greater than 99.9%, whereas a false
Control alert should be triggered with a probability less than 10−3.
• C2: Be capable of responding within 0.5 seconds.
• R1: The initial route should be computed in less than 10 seconds.
• R2: Recompute the path for a moving object should not exceed 1 second.
Routing • R3: The optimal routes should be processed with a taxi distance resolution better than
10 m and a timing better than 1 second.
Guidance • G1: The guidance function should initialize within a maximum of 2 seconds.
• G2: The reversion time should not exceed 0.5 second.
3.2 Methodological proposal
3.2.1 Architecture
This section provides a first overview of the proposed methodology, designed to meet the requirements
outlined in Section 3.1 and to resolve the problem stated in Chapter 1. Following a top-down approach,
the main components of the methodological architecture are primarily described and then each step of the
implementation process is explained. The architecture is presented in Figure 3.1, where there are four main
components: Surveillance, Routing, Guidance and Application Server. As shown, the first three components
interact actively with the Application Server, which manages the real-time incoming data to provide a spatio-
temporal context to the controllers and other end-users. Such context includes the positioning of the moving
objects in real-time within a specific cartographic representation. Over that representation, it is intended to
31
provide routing and guidance functionalities in order to improve the controllers ability to manage the traffic
flow. For this purpose, the Routing and Guidance functionalities will be described in detail.
Figure 3.1: Architecture diagram.
The Routing component is responsible for providing static route planning for a set of operational data.
As represented in Figure 3.1, the Routing component receives as input data a XML with the cartographic
metadata, operational data and a set of business rules. The XML is obtained through a GIS engine that is
able to get the guidance line segments of the polygons represented in the traffic area. These line segments
are converted to a structured document that is easily readable by any programming language (see Section
3.4.1). Such conversion allows to generate the correspondent graph of the movement area layout, described
in more detail in Section 3.4.2. On the other hand, the operational data corresponds to the traffic schedule
stored in a database that maintains information about each moving object, for instance its origin, destination,
category and type. This information is required to compute a route to each moving object from its current
position to its assigned destination, in order to improve the controllers’ decision-making. Finally, the business
rules include a set of circulation rules and several unauthorized operations, configured by the decision-makers
(see Section 3.4.3). These rules must be strictly accomplished in order to avoid incidents incoming from
unauthorized movements. For this reason, the route planning function computes routes taking into account
these rules, for instance avoiding a route with tight turns or unavailable segments. The Routing component
is then responsible for computing static routes to be assigned to each moving object, taking into account the
business rules defined for that specific traffic network (see Section 3.4.4). Its interaction with the Application
Server allows to inform the controllers about the assigned routes.
32
Floyd was adopted to compute optimal routes, further to the survey about existing routing algorithms
resolving the shortest path problem in the previous chapter. As argued in Section 2.1.3, Floyd only requires
a single execution to determine the shortest path between any origin and any destination, although it has
the higher runtime complexity comparing to Dijkstra and A*. Thus, a path can be generated whenever it is
required and extremely fast. On the other hand, the k shortest paths problem was overcome by computing
alternative paths based on the K* algorithm, which will be described in detail later.
The Guidance component is responsible for providing dynamic guidance to each moving object on the
traffic movement area. This function requires the Surveillance positioning data in real-time, in order to have
geographic knowledge about each moving object every second. The accuracy achieved by the Surveillance
component can then compromise the efficiency of the guidance function, which relies on the location of each
object to detect deviations from the assigned paths. The main concern of this component is to correlate
the static route planning with the current traffic situation, while resolving the conflicts resulting from the
uncoordinated movements. So, the Routing component provide the assigned path to each moving object and
the Guidance component resolves the conflicts with the other movements by re-routing the object through an
alternative path or by applying a waiting time in a pre-defined holding point. The scheduled movements are
then monitored to enable the detection of deviations from the assigned paths, for instance when a pilot misses
a runway exit. A deviation implies the computation of an alternative path, which will be evaluated with
respect to the conflicts with the other movements. The Guidance and Surveillance components also interact
with the Application Server, providing real-time information about the location of each moving object and
the guidance indications to the drivers (see Section 3.4.5).
The dynamic management of traffic movements was based on the MILP model, previously discussed in
Section 2.4. This method firstly determines the shortest path to be assigned based on discrete decisions about
predetermined pathways, then monitors the scheduled movements with continuous decisions. Such approach
allows a continuous and accurate scheduling of movements based on the allocation of resources (e.g. TWY
segments) as time goes by. Furthermore, this model is scalable because it only considers one ”window” at
the same time, instead of wasting effort planning for a distant future [9]. The implementation is described
in detail in Section 3.4.5.
3.2.2 Implementation flowchart
The flowchart represented in Figure 3.2 highlights the main steps of the implementation of the proposed
methodology. Prior to explain each step of the flowchart, let us consider a generic description of the schema
to understand the basic mechanism. The metadata provided by the GIS engine allows to generate a weighted
graph and its corresponding adjacency matrix. This information is used by Floyd to compute the optimal
path between every pair of nodes in the graph. Then, as shown in Figure 3.2, the routing and guidance
functionalities are repeatedly applied along the time. The first main dashed block represents the routing
mechanism, where the optimal path is assigned to every moving object that will pull out during the next
window interval. If a conflict is detected, this path is recomputed. When all moving aircrafts are processed,
33
the guidance mechanism begins. This second dashed block processes every active (i.e. processed) moving
object individually, in order to verify if the moving object is following its assigned path correctly. When a
deviation is detected, the routing function is called over again to compute an alternative path and to re-insert
the mobile in the system. Furthermore, it should be noted that the guidance function is processed for each
time interval, that corresponds to the pace of the simulation, explained in detail later in this chapter. Still,
the window interval represents the periodic scheduling time, when the next active mobiles are processed.
The proposed solution is composed by 8 main steps, as follows:
− Step 1: The cartographic information provided by the GIS engine serve as an input to the generation
of the weighted graph. This metadata contains information about the shapes’ geometry of the airport
surface configuration, such as the length and identification of each segment, the geographical coordinates
of every sub-point in the segment and even the maximum speed allowed for each specific segment.
− Step 2: The Floyd algorithm is initialized based on the adjacency matrix, created from the weighted
graph. The algorithm computes two additional matrices, containing information about the optimal
paths between every pair of nodes, for the current network configuration. Whenever the network
changes its configuration, for instance due to a closed route or temporary hazard, this step is repeated.
− Step 3: This step corresponds to the acquisition of the moving objects that will start taxiing within
the next window interval. This information is stored in the flights’ database, containing each object
identification, category, flight type and the coordinates of the origin and destination points for that
specific object.
− Step 4: Based on the information mentioned in step 3, the optimal path is assigned to each moving
object, without considering the other movements.
− Step 5: The system verifies if the path assigned in step 4 is conflicted with the other movements. If
a conflict is detected, the less priority of the two involved mobiles is re-routed or is ordered to wait in
an hold point. This reorganization can cause another conflicts, forcing the detection of conflicts over
again. Furthermore, this step guarantees that all movements are coordinated and there is no possibility
of an hazard, if and only if every mobile strictly follows its assigned path.
− Step 6: When all moving objects have a path assigned and there is a time schedule to each movement,
the guidance function will monitor each active object movement. This step allows to get the first active
object currently moving on the ground.
− Step 7: The moving object deviated from the assigned path, meaning that it followed a different
segment than the expected. In order to avoid conflicts, an alternative path to the same destination is
computed and the moving object is re-inserted in the system, returning to step 5.
− Step 8: The moving object reached its destination and is removed from the system.
34
Figure 3.2: Proposed solution flowchart.
35
3.3 Domain model
The first approach to implement the proposed methodology passed by designing a domain model, describing
how the classes of objects are correlated. The model was developed in UML and consists of four main compo-
nents/objects: RouteGuidance, Floyd, MILP and MovingObject (see Appendix A.3). These components will
be described in detail below, but let’s consider the sub-components first: Point, Segment, Path and Matrix.
A Point represents a point in space in the coordinate system, while a Segment corresponds to a line with a
start and an end point, with a length associated. A Segment is decomposed in sub-segments, marked by a
list of points. Both the Point and Segment classes are identified by an unique integer. Furthermore, a Path
contains the information about a route, but not the route itself. This means that a Path provides the origin
and destination points of a route, but does not have knowledge about the route segments. When a Path is
assigned to a MovingObject, a callSign6 is generated, the startTime is marked and the expected endTime is
calculated. Finally, a Matrix is a two-dimensional vector of integers with a specified size.
The main components of the model are:
− RouteGuidance: This is the main class of the project. It is responsible for managing the metadata
provided by GIS, by reading the XML and generating the respective graph and adjacency matrix. First,
the XML is read and the segments are saved in the segments Dictionary (see Section 3.4.1). Then,
the graph is generated and the coordinates of each node are saved in the graphPoints variable. With
the segments and the graphPoints, the adjacency matrix is created (see Section 3.4.2). Then, after
searching for endSegments and wrongTurns (see business rules in Section 3.4.3), the RouteGuidance
instantiates the Floyd and MILP algorithms.
− Floyd: This class manages the data related to the Floyd algorithm. Taking the adjacencyMatrix
as the input, it generates the sMatrix and the rMatrix matrices (see Section 3.4.4). These matrices
contains the information about the shortest path between every pair of nodes. For instance, the method
ComputePath() returns a list of integers, each integer corresponding to the ID of a segment. When
a valid path is computed, the boolean pathFound becomes true and the pathCost is marked with the
length of the route.
− MILP: The MILP is the heart of the project, since it is where the paths are assigned to each Movin-
gObject, the movements are coordinated and the conflicts are detected and resolved (see Section 3.4.5).
This class maintains information about each mobile and periodically assigns a path to the next active
moving objects (obtained from the DB). The SortedDictionary pathsSchedule represents the table of the
assigned paths, continuously updated to maintain the information about all movements in real-time.
− MovingObject: This class holds the information about each moving object, for instance its ID,
category, type and speed. The Category can be either Small, Medium or Large, while the Type is
6A callSign is a string that uniquely identifies a movement of a MovingObject (e.g. TP315).
36
Arriving or Departing. Furthermore, the moving object receives a non-conflicted path when entering
the system. This path must be followed by the driver/pilot in order to respect the movements schedule.
This domain model was based on an object-oriented paradigm, where each object maintains information
about itself individually. However, these objects are directly related. For instance, the RouteGuidance stores
a list of Points and a Matrix that corresponds to the graph information, a list of Segments with the line
segments metadata, and a reference to the Floyd and MILP objects. Furthermore, the Floyd object has two
Matrices used to the path computation, in addition to the adjacency Matrix that was previously created
by the RouteGuidance. On the other hand, the MILP object is composed by two main lists, namely the
Moving Objects that are stored on the database and the active objects that are currently moving. Finally,
the MovingObject has a Path associated, with a origin and destination Points. This domain model was
designed to cope with each functionality individually, structured to allow the RouteGuidance to manage the
global variables (e.g. graphPoints, segments, matrix and wrongTurns) to be accessible from the Floyd and
MILP, which has a specific task to perform.
3.4 Implementation framework
3.4.1 Metadata extraction from the segments layer
This section pretends to describe in detail the implementation process of the proposed methodology. The first
step consists in collecting the geographic information of the movement area, in order to construct a graph
corresponding to its spatial context. This context is managed by a GIS engine that extracts the metadata
from the geographic representation. The GIS software used was the ArcGIS 9 from ESRI, which provides
the possibility to export a geodatabase feature class to a XML document. A geodatabase is composed by
a set of thematic layers, each one described in a feature class. A feature class organizes a set of geographic
features with the same characteristics in a shapefile, where each feature has the same geometry type (e.g.
point, polygon, line), the same attributes and the same spatial reference. Then, the feature class can be
exported to a XML, considered to be the most powerful language to represent the data due to its simplicity
and universality structuring information. The XML organizes the metadata by attributes, with a specific
geographic coordinate system associated. ArcGIS uses WGS 1984 (or WGS84) as the default coordinate
system, in a two-dimensional spatial reference with a resolution of approximately 8.983 x 10⁻¹⁰ decimal
degrees [46].
The structure of the XML is a RecordSet Object, defined by ESRI (see Figure 3.3). The document is
composed by a set of fields and a set of records. Each record is composed by a set of values, one for each field
in the record set. The number and order of values for a record must correspond to the set of fields. Each
value, in turn, consists of a set of attributes which are the parameters of the current field.
As an illustrative example, a sample of the XML used in the implementation is presented in Appendix
A.1. This XML was generated by ArcCatalog - Arc Editor, the component of ArcGIS responsible for storing
and managing the databases and other ArcGIS related data. The document follows the structure presented in
37
Figure 3.3: ESRI RecordSet Object [47].
Figure 3.3, where each record contains the metadata correspondent to a line (or segment) in the transportation
network. The Appendix A.1 shows one of the records, where some of the values were omitted because they
are not required for the current analysis. The record is composed by four main values: record ID, path array,
shape length and stand specification. The record ID is an integer that uniquely identifies the shape. The path
array is a specific type of ESRI, for instance PolylineN, that defines the shape configuration: the minimum
and maximum x and y values, and the array of points of the shape. Each point is a (x,y) pair with a 14
decimal cases precision, georeferenced in the WGS 1984 coordinate system. Furthermore, the shape length
is represented by a double (in decimal degrees). The last value is a string that indicates if the segment is a
stand or not.
Moreover, part of the code for accessing the XML file is presented in Appendix A.2, which corresponds to
the read of the path array value. Using the C# XML library, the XmlTextReader type allows to read each
node of the stream at a time. Then, for the example shown, the coordinates of each point are collected and
added to a list of points belonging to that specific record (or segment).
3.4.2 Graph and adjacency matrix generation
The metadata provided by GIS allows to generate the graph correspondent to the transportation network,
where each record is represented by an arc and the nodes represent the intersections between different
segments. These nodes are basically the extremity of a segment touching the extremity of another segment,
or even the end of a route. In order to apply a path planning algorithm to the graph, the nodes should be
numbered. For this purpose, a graph point is generated for each extremity of every segment. This feature
was implemented by computing the distance from a given point to all the other graph points, according to
the formula (3.1) [48].
38
d =√
(x2 − x1)2 + (y2 − y1)2 (3.1)
Since the coordinates of each point are in decimal degrees, the result was converted into meters7. Two
distinct points were considered the same point if the distance between them was less than 10 cm (configurable
value). Then, for each new segment, both extremities were compared to the graph points generated so far.
If an existing graph point was close enough to the extremity, this last one was registered with the same ID.
Otherwise, a new sequential ID was generated. The graph conception is shown in Figure 3.4, where the
segments represented by GIS (Figure 3.4(a)) are converted to a graph with arcs and nodes (Figure 3.4(b)).
As shown in Figure 3.4(b), every intersection between two or more segments is represented by a numbered
node. For instance, segments 4, 5 and 6 converge to a common point, which has the number 3.
(a) Map segments (b) Graph representation
Figure 3.4: Segments representation in a graph.
The passage from the spatial layout representation to a graph is illustrated in Figure 3.5, where the Lisbon
airport is represented on the left hand side as a set of overlapped layers. The layer of the TWY guidance
lines is highlighted on the right side screen, where the nodes corresponding to TWY segments have been
added as well as arrows representing traffic circulation rules.
Furthermore, the adjacency matrix was also generated. This matrix has information about the length
between every pair of nodes belonging to the graph. Thus, the matrix was created by assigning the length
of each segment to the respective position in the matrix. For instance, if a given segment is 15 m long and
has the start point 8 and the end point 23, then the cell (7, 22)8 and the cell (22, 7) will be filled with the
number 15 (assuming the segment is bidirectional).
7A decimal degree represents 111319.9 meters at the equator on the WGS84 coordinate system [49].8This numeration is due to the vector’s structure: [0, n-1].
39
Figure 3.5: Graph representation of the TWY guidance lines in an airport.
3.4.3 Business rules
Although the graph representation allows to compute optimal paths by applying a routing algorithm, there
are a set of business rules that should be considered in the implementation process. A business rule is a
”statement that defines or constrains some aspect of the business. It is intended to assert business structure
or to control or influence the behavior of the business” [50]. In other words, a business rule defines how a
specific feature of the business should be performed. This section presents which business rules were consid-
ered and how they were implemented.
Circulation rules: In a traffic environment, the authorized moving objects must fulfill a set of circula-
tion rules that allows to uniform each driver behavior. For instance, each segment has a speed limit allowed
that is defined according to the type of road or even to the visibility constraints. Furthermore, the circulation
senses and signaling are used to improve the drivers awareness about the circulation rules. Another important
circulation rule is the priority given to each moving object. There are a set of rules defining which moving
objects have more priority, with respect to their type, size and other specific characteristics (see Section
4.3.2). Finally, it was also considered, in the case of the airport, that the aircrafts are not allowed to reverse,
forcing to go around and find another path when the route can not be crossed. Another remark is that all
segments were considered bidirectional.
40
Unauthorized turns: A moving object should not make a tight turn. For this reason, turns making an
angle between 0◦ and 100◦ were disabled9. The angle of a turn is the angle between two linked segments,
where each segment represents a vector. As represented in Figure 3.6, A and B are segments and p3 is the
vertice for AB_
. We are interested on the calculation method of the angle θ from the three vertices.
Figure 3.6: Angle between three points [51].
The first formula of the equation (3.2) defines the dot product between A and B, from which was math-
ematically deduced the angle θ (the third formula of equation (3.2)). The |A| represents the length of the
segment A, previously defined in equation (3.1). Then, to convert from radians to degrees, θ is multiplied by
180/π.
A.B = |A||B|cos(θ)
θ = arccosA.B
|A||B|
θ =
[(x2 − x3)(x1 − x3) + (y2 − y3)(y1 − y3)
|A||B|
] (3.2)
An illustrative example of the types of turns is represented in Figure 3.7, where the turn A represents a
tight turn with an angle of 22◦ and the turn B represents a normal turn with an angle of 152◦. As shown, the
turn A is extremely tight to be performed by an aircraft, for instance. On the other hand, turn B is much
smoother and does not require an abrupt change to the trajectory.
9Turns that are directly linked with stand parking areas were not disabled because they are represented with an angle of90◦ to make the routing easier.
41
Figure 3.7: Types of turns: tight (A) and normal (B).
Intersections: An intersection between two line segments is not detected when their extremities are
coincident. So, segments having an intersection point that is not an endpoint of the line can cause a conflict
between two moving objects because the system did not detect that the routes cross each other. In order to
avoid such conflict, intersections were detected through a method that considers the endpoints of each line
segment. Let us consider a segment A with the endpoints p1 and p2 and a segment B with the endpoints
p3 and p4. Each point is represented with two-dimensional coordinates, for instance (x1, y1) for p1. The
segments A and B have an intersection point if and only if 0 ≤ Ua ≤ 1 and 0 ≤ Ub ≤ 1 (see equation (3.3)).
These equalities guarantee that the lines end on their extremity, instead of considering infinitely long lines.
If so, the lines have always an intersection point in the infinite if they are not parallel [52].
Ua =(x4 − x3)(y1 − y3)− (y4 − y3)(x1 − x3)
(y4 − y3)(x2 − x1)− (x4 − x3)(y2 − y1)
Ub =(x2 − x1)(y1 − y3)− (y2 − y1)(x1 − x3)
(y4 − y3)(x2 − x1)− (x4 − x3)(y2 − y1)
(3.3)
Guidance lighting system: Aiming to provide guidance instructions to the drivers, an automated
lighting system was implemented based on the American ATGS [45]. The system follows a n+1 policy,
meaning that only the current segment and the segment immediately ahead are considered. This feature
allows to provide visual information to the driver in real-time, improving his/her capacity to decide which
road to take. As represented in Figure 3.8, the n+1 segments are highlighted to allow the driver to follow
the correct path.
This system implements an inexpensive solution, which only considers the strictly necessary lights, instead
of turning on the whole set of lights belonging to the path to be followed. In Figure 3.8(a), the moving object
is guided to make the turn, since the current segment and the next segment (turn) are switched on. As soon
42
(a) Guidance to follow the turn. (b) Guidance to go straight.
Figure 3.8: Guidance lighting system.
as the mobile passes from one segment to another, the lights concerning the previous segment are turned off
and the lights of the next segment in the path are turned on. This transition is represented by the passage
from the Figure 3.8(a) to the Figure 3.8(b), where the previous segment is turned off and the next one is
turned on.
3.4.4 Routing algorithm
Floyd uses the adjacency matrix generated from the XML to create the S and R matrices. Initialized with
S0 = W (W is the adjacency matrix), the S matrix is consecutively updated with the minimum length
between every pair of nodes. Nevertheless, the unauthorized turns business rule introduces an obstacle to
the default mechanism of the algorithm because it does not distinguish between a tight and a normal turn,
since it only works with nodes that are linked over a network. So, this problem was solved by implementing
an alternative mechanism to compute a path containing tight turns.
On the one hand, the default path computation of the Floyd’s algorithm is based on the Figure 3.9.
Figure 3.9(a) represents the final matrix of the algorithm execution, containing the routing information
between every pair of nodes. For instance, there is a direct link between nodes 3 and 4 with a length of 2 and
there is a non-direct path between nodes 3 and 5 with a length of 5, with the intermediate node 4. Using
this information, the path between nodes 1 and 4 was then computed and the intermediary steps are shown
in Figure 3.9(b). The path between 1 and 4 has an intermediary node 6, according to the cell (1,4) of the
matrix. The next step is to find the path between 1 and 6 and between 6 and 4. This process is repeated until
there is no other intermediate nodes, verified by the equality R[origin, destination] = 0. In this example, the
path is 1 - 6 - 3 - 4. Another example is presented in Appendix A.4, where the shortest path between two
points A and B is illustrated.
43
(a) S and R matrices (in parenthesis are the R values). (b) Path computation between nodes 1 and 4.
Figure 3.9: Floyd path computation.
This routing mechanism allows to determine a path extremely fast because the Floyd matrices are always
the same, unless there is a change on the network configuration. So, the time spent at the beginning to create
the matrices is insignificant, comparing to the real-time requirement of computing a path. Nevertheless, a
mechanism was implemented to speed up the initial creation of the matrices. These matrices are only com-
puted once, storing the routing information on a file on the computer’s disk. The following executions use
this information from the file, without computing anything. If the graph network suffers a modification, the
initial computation must be redone.
On the other hand, the alternative mechanism to compute paths without unauthorized turns aims to
solve the problem presented in Appendix A.5. The shortest path between A and B contains a tight turn
(represented with a circle), so the system should find an alternative path that avoids such turn. The solution
passes by ignoring paths with unauthorized turns, meaning that the value contained in the S and R matrices
for a specific path between two nodes remains unchanged if there is no other route. If some of the conditions
presented in equation 3.4 is satisfied, there is some tight turn between the nodes i and j. The k represents
the intermediary node being executed, while the expression R[i, j ] represents the value on the cell (i, j ) of
the R matrix. UT(i, k, j ) represents an unauthorized turn starting from i and ending with j, passing by k.
UT (i, k, j)
UT (R[i, k], k, j)
UT (i, k, R[k, j])
UT (R[R[i, k], k], k, j)
UT (i, k, R[R[k, j]])
(3.4)
These conditions guarantee that paths with unauthorized turns are ignored by the routing algorithm,
keeping the cell (i, j ) without a value. These cells are treated in another way, which route is computed from
the destination to the origin. This process determines the alternative shortest path between nodes i and j.
44
It was inspired in K*, but uses the A* algorithm in the backward sense by applying an heuristic decision in
each iteration. The decision consists in selecting the closest node to the destination (in this case, the origin
i). This means that, among the linked nodes, the node that is less distant to i is chosen and belongs to the
path. So, starting from the destination j, each linked node is inspected. This last node repeats the process,
and will eventually reach the origin i. The result is the reverse path between i and j.
In the case there is a conflict between two moving objects and an alternative path is required, Floyd is not
able to compute an alternative route different than the initial one because it only considers the shortest path.
Considering that the mobile requiring an alternative path has already started moving, it needs a different
route than the initial one computed by Floyd. So, the same mechanism as in the case of unauthorized turns
is applied, computing the k shortest paths on-the-fly while being guided by an heuristic function, where k
refers to the number of the nodes that are directly linked with the destination node. The resulting k shortest
paths are sorted by their length, where the routing function selects the shorter to be assigned as the shortest
path.
3.4.5 Guidance programming model
MILP allows to assign static routes for each moving object, coordinate the movements in order to avoid
conflicts and then dynamically adapt them to cope with deviations from assigned paths. As previously
explained in Section 2.4, the path planning procedure is executed every window interval (configurable value).
This interval represents the amount of time in which the targets that will start moving receive a path. So, the
paths are assigned to each moving object every 5 minutes, for example. On the other hand, the simulation
has also a time interval associated, defining the pace of the simulation (configurable value). This means that
the simulation is executed every second, for instance. As an illustrative example, Figure 3.10 presents the
time scheduling for 4 different moving objects. Each moving object has a segment ID associated for every
time interval (1 second), allowing to compare to other movements in order to detect conflicts.
As shown in Figure 3.10, there are two conflicts where the segments are highlighted. The first conflict
is between mobiles 1 and 3 because they are using the same segment at the same time, which can cause a
persecution or a frontal collision. The second conflict is between mobiles 2 and 4 because they are using
segments that belong to the same intersection. In order to avoid such conflicts, MILP determines which
moving object has more priority and re-routes the other through an alternative path or holds it for an
amount of time. The choice between re-routing and the holding point is made based on the time spent by
each one, meaning that the re-routing is preferable if the difference to the original path spends less time than
the holding time. For instance, if the moving object 3 has more priority than the first one, then the moving
object 1 start time is delayed for a conflict interval period, if and only if the alternative path takes too long.
This conflict interval is configurable and allows to separate the two movements for 20 seconds, for instance.
This guarantees that the moving objects involved will use the same segment at different times. In this case,
the moving object 1 would be delayed 20 seconds.
Once the movements are scheduled and coordinated, a simulation thread is launched. This thread is
45
Figure 3.10: MILP path planning schedule.
used to manage the simulation, including the path planning scheduling and the conflicts resolution. It is
also responsible for counting the time, creating a new thread to each moving object when it is time to start
moving. This last thread, in turn, manages the information related to a single moving object. It is responsible
for monitoring the movement along the assigned path, providing guidance assistance through the guidance
lighting system. In case of a deviation from the assigned path, this thread notifies the simulation thread that
an alternative route must be computed to that specific mobile, repeating the initial path planning process.
46
Chapter 4
Case study
The case study focuses on the airport domain, more precisely on the ground movements of the aircrafts on
the airside of the airport. This chapter first gives an overview of the airport context, providing technical in-
formation about the performed business procedures within the movement area. Then, the historical evolution
of the A-Guidance system is presented, which has been extended with routing and guidance functionalities.
Such extension faced a set of implementation issues related to the cartographic precision, the business rules
compliance and other performance constraints, that are representative of the required adaptation of the
proposed methodology to this particular case study.
4.1 Airport contextualization
Airports are considered as very large, dynamic and complex systems that involve aircrafts, support trucks,
maintenance vehicles, baggage-handling equipment and many other systems that simultaneously operate
in the same surface movement area [35]. The required interoperability between these systems forces the
stakeholders (e.g. ATCOs, airport managers, handling supervisors, pilots and vehicle drivers) to spend a huge
effort synchronizing ongoing ground operations. Although each stakeholder group operates in different fields
and with different goals, they act proactively and collaboratively towards a collaborative monitoring system
that improves the situation awareness about safety breaches. However, incidents happen and stakeholders
are not always able to efficiently react to business services demands when working under time pressure.
Nowadays, the usual procedure to manage airport ground operations is based on the manual positioning
of vehicles and aircrafts in predefined locations. Therefore, decision-makers are not prepared to deal with
unexpected schedule changes, operating without being informed about current operational needs. The trig-
gering of non-planned events must then be enhanced with dynamic mechanisms to allow decision-makers to
accurately respond to task changes, instead of relying on voice communications to synchronize each target
movement [8]. These mechanisms include being continuously aware about every situation that may de-
lay turnarounds. Situation awareness must then be improved through location-based services to accurately
provide a real-time picture of aircraft and vehicle movements [53].
47
In fact, the A-SMGCS strategy aims to improve the traffic flow and the capacity management in any
aerodrome, while reducing the operational incidents. The A-SMGCS should be implemented according to
the level of complexity of the aerodrome, namely the layout complexity, traffic density and visibility conditions
[3]. The aerodrome layout complexity is based on the routing network defined by the TWY and RWY, used
respectively by the aircrafts and the vehicles. This network is obtained from the guidance lines, which are
represented in the center of each route. The Appendix A.6 illustrates the TWY guidance lines, including
the intersection points between TWY, the RWY exits to the TWY and even the holding points where the
aircrafts have to wait to avoid conflicts.
Moreover, the movement area of an airport is composed by a manoeuvring area and a restricted area
called apron, which are represented in Figure 4.1. The manoeuvring area is used by aircrafts to take-off, land
or travel along their path. The RWY is the track where the aircraft takes-off and lands, surrounded by a
protection area for safety purposes. On the other hand, the apron is the part of the airport that enables the
loading of passengers, the maintenance and parking of aircrafts or other ground handling activities. Aircrafts
have to follow a route from the RWY to the gate (or vice versa), while vehicles are mostly used to provide
support to the aircraft (e.g. push-back) [6].
Figure 4.1: Airport layout [6].
The methodology presented in the previous chapter will be applied to the TWY guidance lines network,
aiming to provide routing and guidance assistance to the aircrafts. The network is represented by the light
lines in Figure 4.1, where the taxiing aircrafts must comply with a set of business rules. These rules are
extremely sensitive in such a critical environment, considering that a single failure may compromise the
operational safety. The most relevant business rules, previously presented in Section 3.4.3, are the circulation
rules, the unauthorized turns and the conflicts resolution priorities. In particular, the conflicts are solved
considering the category and type of the aircraft. The largest aircrafts have priority since they carry more
passengers, as well as the departing aircrafts which are releasing airport resources.
48
Furthermore, the methodology mainly focus on taxiing aircrafts, from landing to take-off. However, only
taxi-in and taxi-out processes are considered as part of the whole turnaround process. The taxi-in is the
period between the exit of the RWY and the arrival at the gate, while the taxi-out corresponds to the reverse
travel from the gate to the departure assigned RWY [17].
4.2 A-Guidance
4.2.1 Project scope
The A-Guidance is an implementation of the A-SMGCS concept, being developed by the INESC-Inovacao
research team in collaboration with the ANA-Aeroportos, the main airport management authority in Portu-
gal. This platform complies with levels I and II of A-SMGCS and is experimentally deployed in Lisbon and
Oporto, the major airports in Portugal [53]. This thesis aims to extend its functionalities to support levels
III and IV by implementing the proposed methodology applied to the Lisbon airport as the test-bed. Such
implementation required a set of information such as the cartographic metadata, the positioning of moving
objects in real-time and a set of business rules. The following sections make an overview of the A-Guidance
architecture and main components, describing how the routing and guidance functions were implemented
based on the technologies and data already embedded in the existing platform. However, several issues
affecting the implementation were detected, the resolution of which is presented in detail in Section 4.3.
On the one hand, A-Guidance is recognized as an integrated GNSS/EGNOS low-cost portuguese solution
that provides a set of services for the airport management in low-visibility and emergency situations. These
services include monitoring, control, support to decision-making and interoperability within the airside of the
airport, which will be discussed in Section 4.2.3. This project is being progressively deployed at the national
airports managed by ANA, being altogether a modular and interoperable solution that complies with the
ICAO requirements and recommendations [1].
On the other hand, this solution was based on the know-how acquired from several European I&D projects,
namely AIRNET (2004-2006) [6], LocON (2008-2010) and AAS (2008-2011). These projects are related to
the efficiency and safety of ground movements within the airside of the airport, which have been improved
with innovative wireless communication systems, GNSS real-time positioning devices and cartographic GIS
engines along the last decade. Within the AAS system, the A-Guidance represents one of the major software
components that is responsible for detecting safety hazards between moving vehicles. Such detection includes
a continuous processing and validation of location-based data, correlated with other GIS techniques such as
geographic localization, to determine either an alert should be triggered or not [7].
4.2.2 Architecture
The A-Guidance system is based on a modular solution providing location-based services that integrate
the positioning data collected from moving objects with external systems containing information about
flights, vehicles and worker tasks. The system was designed to collect real-time data from cooperative (e.g.
49
vehicles) and non-cooperative (e.g. aircrafts) mobiles, namely their geographic location, ID, category and
current speed. Such information is acquired from the interaction between the components of the A-Guidance
infrastructure, represented in Figure 4.2.
Figure 4.2: A-Guidance system global architecture [53].
The Onboard System represents the positioning equipment embedded on cooperative mobiles used to ex-
change data with the Communication Server. Each cooperative mobile is equipped with a PC board with a
GPS/EGNOS receiver and a wireless network transponder. As represented in Figure 4.2, the Onboard Equip-
ment can support different wireless technologies for transmitting the data obtained from the GPS/EGNOS
receiver. For instance, WiFi and WiMax are the wireless network technologies offering a better quality of
service with higher bit rate transmissions. On the contrary, public networks available on the airport such
as CDMA and TETRA are only used as alternative communication technologies. On the other hand, non-
cooperative mobiles are mainly detected with SMR and MLAT technologies. However, it is intended to
improve them with ADS-B capabilities to detect non-cooperative objects.
The Communication Server within the Network System is responsible for performing the data fusion of
the data transmitted from the the Onboard System. In fact, these two systems are connected through a
bidirectional link that enables a continuous update of operational information. Such information is presented
to the Application Server in a common interface with homogeneous data about every mobile positioning in
real-time. The Control Centre System is then responsible for managing the data contained in the Application
Server, providing each end-user (e.g. operationals, ATCO, handlers) with the appropriate monitoring and
control tools.
External Systems gather data from several sources to be stored in the appropriate databases, which are
accessible within the airport network to improve the situation awareness about ongoing tasks, flight schedules
50
and movements. For instance, the ATC system stores the positioning data provided by the Communication
Server. On the other hand, the Airport Management System has detailed information about each mobile and
operational tasks (e.g. follow-me, surface clearance, bird control), as well as the SGO providing information
about flight schedules [53].
4.2.3 Ground human machine interface
The GHMI is the graphical display used by the end-users to interact with the A-Guidance system (see Figure
4.3). Such interface represents an informational cockpit containing the business context adapted to each
stakeholder’s role, aiming to support the decision-making in high-risk situations. This business context is
filled with a set of services [1], namely:
− Monitoring: Real-time positioning of moving objects in the geographic context of the airport, includ-
ing its position, identification, category, direction, speed, operator and driver identification.
− Control: Detection of conflicts and safety infringements, namely the detection of collisions, unautho-
rized incursions and alerts.
− Decision-support: Panoramic view of the airport layout; dynamic operational information (e.g. visi-
bility conditions, RWY accessibility); real-time interface with up-to-date traffic schedules; information
about vehicles, drivers and assigned tasks; text messages sent to drivers with instructions; and log files
with historical data.
The A-Guidance GHMI is managed by a GIS engine, which allows to organize the airport spatial context
as a set of overlapped thematic layers. Such representation is presented in Figure 4.3, where each thematic
layer is represented by a pre-defined polygon shape or line, representative of a specific operational area with
an associated feature. In this case, all the layers are selected on the Map Features tab on the left side. For
instance, TWY and stand guidance lines are represented by light tight lines within the movement area where
aircrafts are taxiing as it is the case of TAP107, leaving the RWY on the top side of the airport layout.
On the other hand, roadways are represented by double lines which are used by vehicles such as the case
of SAFECD16 in the center. Each mobile is identified by a label with its identification and current speed,
represented with a color code denoting the severity level for each hazard situation. A red label outlines a
severe incursion and a yellow represents a less severe one. Furthermore, a green label indicates that the
vehicle is operating normally, while the blue represents a vehicle that is stopped for more than 5 seconds.
In addition to color codes, end-users are provided with an Alert Viewer on the bottom side of the interface
window, where any unauthorized incursion will automatically trigger a safety incursion alert message describ-
ing the intruder, the area affected and the time it occurred. This detection is performed by the Application
Server that correlates the mobiles positioning against the protection polygons defining a restricted access
area. Then, every time an alert is triggered, the controller is able to double click to zoom the current location
51
Figure 4.3: A-Guidance GHMI [53].
of the involved mobile. If necessary, the controller can also use radio communication or text messages to
contact the vehicle driver.
Other functionalities of the A-Guidance GHMI are related to the possibility of activating and deacti-
vating the vehicle’s movement paths visualization. It allows to monitor driving habits, detect traffic rules
infringements or even to identify traffic bottlenecks caused by routing or other operational inefficiencies. This
functionality is improved by basic GIS functionalities such as making zoom or pan into the map layout or
select a map feature to obtain more information.
The GIS engine enables then users at the control center to dynamically manage ongoing operations
through a display with the airport layout as the background context. According to the compliance with
the A-SMGCS requirements, the system only provides surveillance and control capabilities. Such level of
implementation includes a collaborative decision support environment providing situational awareness about
aircrafts and vehicles positioning in real-time, detecting safety-related issues by triggering an alert whenever
an incursion, a business rule infringement or a collision between mobiles or obstacles is detected [53].
Nevertheless, the current version of A-Guidance requires a manual routing to vehicle and aircraft move-
ments based on the traffic situation that can be seen from the control tower and the situational awareness
obtained from the GHMI. Automated generation of route instructions is required to safely and efficiently
52
coordinate every movement. This mechanism can be implemented based on the knowledge acquired from the
airport spatial context and the operational information about flights schedule. Furthermore, the A-Guidance
system allows to provide guidance support to vehicle drivers through the onboard embedded system installed
on the vehicle. However, the lack of availability is a restraint that leads to the need of improved surface
visual aids for automated guidance along assigned routes. Such guidance enables the detection of conflicts by
continuously monitoring the compliance to the assigned route. In the case of a conflict, a resolution should
be provided based on the traffic situation.
4.3 Implementation issues
4.3.1 Metadata imperfections
The required extension of the A-Guidance system to levels III and IV of the A-SMGCS concept passes by
implementing the proposed methodology described in the previous chapter. Theoretically, the spatial context
together with real-time positioning of moving objects and operational business rules are enough to implement
routing and guidance functionalities. In computation means, the knowledge about the airport cartographic
representation requires the GIS capabilities to provide adequate and accurate geographic metadata. However,
the computational representation of the real world usually contains a set of gaps that have to be adjusted
according to the implementation requirements. In the case of the airport, such adjustments were mainly
related to a set of cartographic imperfections (e.g. segments not linked), the business rules compliance (e.g.
detection of tight turns) and other constraints such as the ability to detect which segment corresponds to a
given pair of coordinates.
The XML file containing the metadata from the Lisbon airport cartography provided by the INESC
development team had a set of imperfections that directly affect the default routing computation and con-
sequently the expected behavior of the guidance model. The XML metadata was then modified using a GIS
software called ArcGIS, version 9.3, from ESRI. The correspondent geodatabase feature class was loaded into
the ArcCatalog, which is an application allowing the management of geodatabases data files. Such data files
are represented on a map viewer included in the ArcMap, the sub-component of ArcGIS allowing the editing
and drawing of shapes and features on a map layer (see Appendix A.7). The user is then able to manipulate
the geospatial context, for instance by extending a line or modifying a shape.
The need to improve the cartographic accuracy of the geospatial data relates to the fact that the graph
generation is not possible when the segments are not linked or an intersection is not detected. As a node
in a graph represents an intersection between two arcs, every intersection must have at least two segments
linked. Otherwise, these segments are considered independent and the intersection is not detected. The
modifications made with the ArcMap software were then performed with the objective of obtaining a graph
without errors. Such modifications are crucial to the routing algorithm performance since a non-detected
intersection may force the algorithm to compute a longer route due to the absence of the required node.
Figure 4.4(a) outlines the most common imperfections detected in the XML metadata, namely two seg-
53
ments splitted without any link between them (1) and a too extensive segment that goes beyond the inter-
section (2). This lack of precision in the cartographic representation leads to the generation of unnecessary
nodes in the routing graph. For instance, two splitted segments generate two independent nodes that are
extremities instead of a single node linking two segments. These imperfections were rectified by joining the
two segments (1) and by deleting the extra segment (2) (see Figure 4.4(b)).
(a) Splitted segments (1) and useless extra segments (2). (b) Extension (1) and deletion (2) of segments.