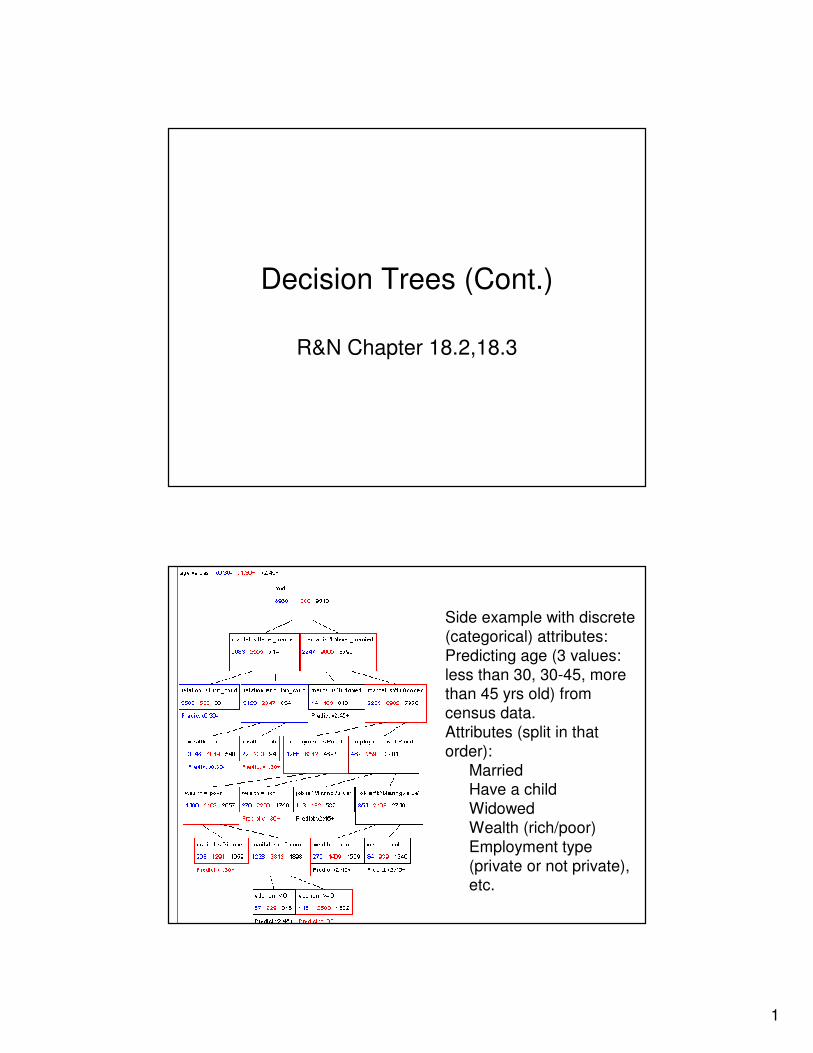
1 Decision Trees (Cont.) R&N Chapter 18.2,18.3 Side example with discrete (categorical) attributes: Predicting age (3 values: less than 30, 30-45, more than 45 yrs old) from census data. Attributes (split in that order): Married Have a child Widowed Wealth (rich/poor) Employment type (private or not private), etc.
Transcript
1
Decision Trees (Cont.)
R&N Chapter 18.2,18.3
Side example with discrete
(categorical) attributes:
Predicting age (3 values:
less than 30, 30-45, more than 45 yrs old) from
census data.
Attributes (split in that
order):
MarriedHave a child
Widowed
Wealth (rich/poor)
Employment type
(private or not private), etc.
2
Side example with
both discrete and
continuous
attributes: Predicting MPG
(‘GOOD’ or ‘BAD’)
from attributes:
Cylinders
HorsepowerAcceleration
Maker (discrete)
Displacement
The Overfitting Problem: Example
• Suppose that, in an ideal world, class B is everything such that X2 >= 0.5 and class A is everything with X2 < 0.5
• Note that attribute X1 is irrelevant
• Seems like generating a decision tree would be trivial
Class B
Class A
3
The Overfitting Problem: Example
• However, we collect training examples from the
perfect world through some imperfect observation device
• As a result, the training data is corrupted by noise.
The Overfitting Problem: Example
• Because of the noise, the resulting decision tree is far more complicated than it should be
• This is because the learning algorithm tries to classify all of the training set perfectly � This is a fundamental problem in learning: overfitting
4
The Overfitting Problem: Example
• The effect of overfitting is that the tree is guaranteed to classify the training data perfectly, but it may do a terrible job at classifying new test data.
• Example: (0.6,0.9) is classified as ‘A’
A
The Overfitting Problem: Example
• The effect of overfitting is that the tree is guaranteed to classify the training data perfectly, but it may do a terrible job at classifying new test data.
• Example: (0.6,0.9) is classified as ‘A’
A
It would be nice to identify automatically that splitting
this node is stupid.
Possible criterion: figure
out that splitting this node
will lead to a “complicated”tree suggesting noisy data
5
The Overfitting Problem: Example
• The effect of overfitting is that the tree is guaranteed to classify the training data perfectly, but it may do a terrible job at classifying new test data.
• Example: (0.6,0.9) is classified as ‘A’
A
Note that, even though the attribute X1 is completely
irrelevant in the original
distribution, it is used to
make the decision at that
node
Possible Overfitting Solutions
• Grow tree based on training data
(unpruned tree)
• Prune the tree by removing useless nodes
based on:
– Additional test data (not used for training)
– Statistical significance tests
6
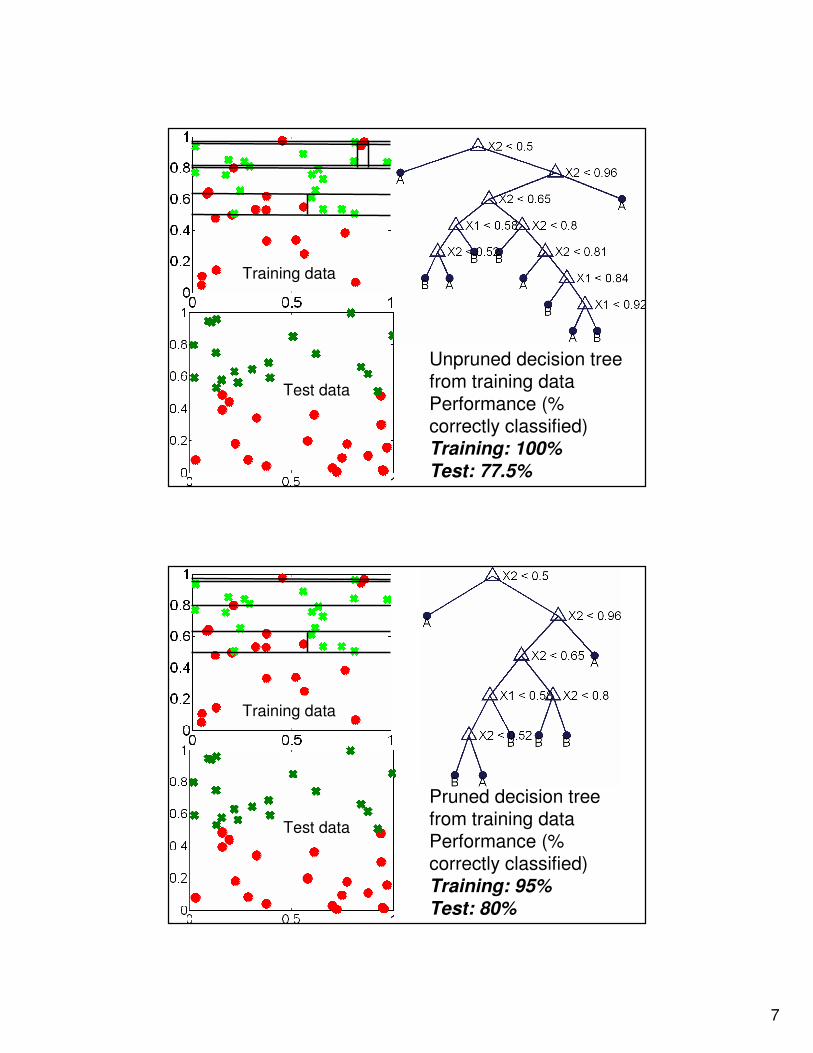
Training Data
Unpruned decision tree from training data
Training datawith the partitions induced by the decision tree
(Notice the tiny regions at the top necessary to correctly classify the ‘A’outliers!)
Unpruned decision tree from training data
7
Unpruned decision tree from training dataPerformance (% correctly classified)Training: 100%
Test: 77.5%
Training data
Test data
Pruned decision tree from training dataPerformance (% correctly classified)Training: 95%
Test: 80%
Training data
Test data
8
Pruned decision tree from training dataPerformance (% correctly classified)Training: 80%
Test: 97.5%
Training data
Test data
Size of decision tree% o
f d
ata
co
rre
ctly c
lassifie
d
Performance on
training set
Performance on
test set
Tre
e w
ith
be
st
pe
rfo
rman
ce
on
te
st
se
t
9
Using Test Data
• General principle: As the complexity of the classifier increases (depth of the decision tree), the performance on the training data increases and the performance on the test data decreases when the classifier overfits the training data.
Classification rate on training data
Classification rate on test data
In this region, the tree overfits the
training data (including the noise!) and
start doing poorly on the test data
% C
orr
ect
cla
ssific
ation
Size of tree
Decision Tree Pruning
• Construct the entire tree as before
• Starting at the leaves, recursively eliminate splits:– Evaluate performance of the tree on test data
(also called validation data, or hold out data set)
– Prune the tree if the classification performance increases by removing the split
Prune node if
classification
performance
on test set is
greater for (2)
than for (1)(1) (2)
10
Possible Overfitting Solutions
• Grow tree based on training data
(unpruned tree)
• Prune the tree by removing useless nodes
based on:
– Additional test data (not used for training)
– Statistical significance tests
A Criterion to Detect Useless Splits• The problem is that we split whenever the
IG increases, but we never check if the change in entropy is statistically significant
• Reasoning:
• The proportion of the data going to the left node is pL = (NAL + NBL)/(NA+NB) = 5/9
• Suppose now that the data is completely randomly distributed (i.e., it does not make sense to split):
• The expected number of class A in the left node would be N’AL = NA x pL = 10/9
• The expected number of class B in the left node would be N’ BL = NB x pL = 35/9
• Question:
• Are NA and NB sufficiently different from N’A and N’B. If not, it means that the split is not statistically significant and we should not split the root � The resulting children are not significantly different from what we would get by splitting a random distribution at the root node.
• The number of class A in the root node is NA = 2
• The number of class B in the root node is NB = 7
• The number of class A in the left node is NAL = 1
• The number of class B in the left node is NBL = 4
11
A Criterion to Detect Useless Splits• Measure of statistically significance:
• K = (N’AL- NAL)2/N’AL + (N’BL- NBL)
2/N’BL +(N’AR- NAR)2/N’AR + (N’BR- NBR)2/N’BR
K measures how much the split deviates from what we
would get if the data where randomK small � The increase in IG of the split is not
• N’ij = Number of points from class i in child jassuming a random selection
• N’ij = Ni x Pj
N data points
NL data points NR data points
∑−
=
ji ij
ijij
N
NNK
childrenclassesall
'
2')(
PL PR
12
χ2 Criterion: General Case
N data points
NL data points NR data points
PL PR
∑−
=
ji ij
ijij
N
NNK
childrenclassesall
'
2')(
Difference between the
distribution of class i from the
proposed split and the
distribution from randomly
drawing data points in the same proportions as the proposed split
Small (Chi-square) values
indicate low statistical
significance � Remove the
splits that are lower than a
threshold Κ < t. Lower t � bigger trees (more overfitting). Larger t � smaller trees (less overfitting, but worse classification error).
Decision Tree Pruning
• Construct the entire tree as before
• Starting at the leaves, recursively
eliminate splits:– At a leaf NNNN:
• Compute the K value for NNNN and its parent PPPP.
• If the K values is lower than the threshold t:– Eliminate all of the children of PPPP
– PPPP becomes a leaf
– Repeat until no more splits can be eliminated
13
K = 10.58
K = 0.0321
K = 0.83 The gains
obtained by
these splits are
not significant
• By thresholding K we end up with the decision tree that we would expect (i.e., one that does not overfit the data)
• Note: The approach is presented with continuous attributes in this example but it works just as well with discrete attributes
14
χ2 Pruning
• The test on K is a version of a standard statistical test, the χ2 (‘chi-square’) test.
• The value of t is retrieved from statistical tables. For example, K > t means that, with confidence 95%, the information gain due to the split is significant.
• If K < t, with high confidence, the information gain will be 0 over very large training samples – Reduces overfitting
– Eliminates irrelevant attributes
Example
1.65.837.2Virginica
2.15.62.86.4Virginica
142.26Versicolor
13.525Versicolor
1.43.92.75.2Versicolor
0.41.73.95.4Setosa
0.21.434.9Setosa
0.21.43.55.1Setosa
Petal Width (PW)
Petal Length
(PL)
Sepal Width (SW)
Sepal Length
(SL)
Class
50 examples from each class
15
Full Decision Tree
1 2 3 4 5 6 70
0.5
1
1.5
2
2.5
Petal length (PL)
Petal w
idth (PW
)
16
Pruning One Level
17
Pruning Two Levels
1 2 3 4 5 6 70
0.5
1
1.5
2
2.5
Petal length (PL)
Petal w
idth (PW
)
18
Unpruned
Unpruned27% probability that this is a “chance” node
according to χ2
test.
Node should be pruned.
19
Pruned
Pruned
20
Note: Inductive Learning• The decision tree approach is one example of
an inductive learning technique:• Suppose that data x is related to output y by a
unknown function y = f(x)• Suppose that we have observed training
examples {(x1,y1),..,(xn,yn)}• Inductive learning problem: Recover a function h
(the “hypothesis”) such that h(x) ≈ f(x)• y = h(x) predicts y from the input data x• The challenge: The hypothesis space (the space
of all hypothesis h of a given form; for example the space of all of the possible decision trees for a set of M attributes) is huge + many different hypotheses may agree with the training data.
Inductive Learning
• What property should h have?
• It should agree with the training data…
y
x
y
xx1 x2 xn
Training data Hypothesis h(x)
21
Inductive Learning
• What property should h have?• It should agree with the training data…• But that can lead to arbitrarily complex hypotheses
and there are many of them; which one should we choose?…
y
x
y
x
Two stupid hypotheses that fit the training data perfectly
Inductive Learning
• What property should h have?
• It should agree with the training data…
• But that can lead to arbitrarily complex hypotheses…
• Which leads to completely wrong prediction on new test data…
• The model does not generalize beyond the training data…it overfits the training data
y
x
f(xo) is here
Predicted y by hypothesis
h, h(xo) is here
xo
22
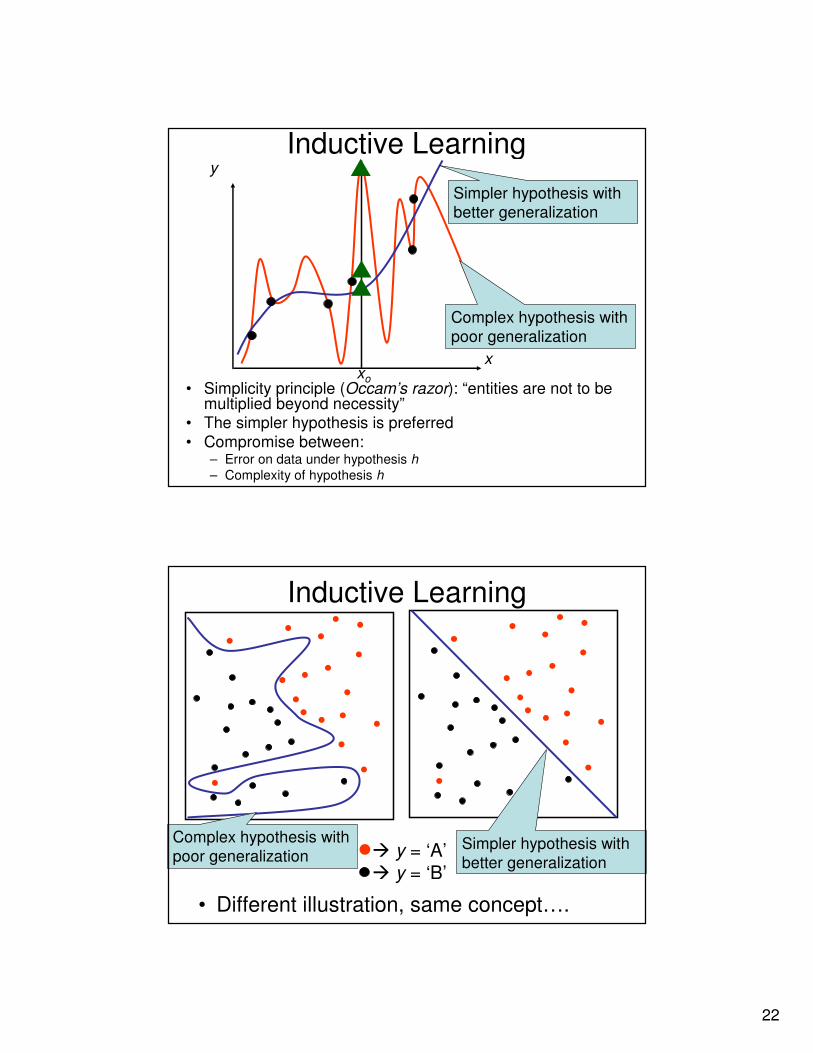
Inductive Learning
• Simplicity principle (Occam’s razor): “entities are not to be multiplied beyond necessity”
• The simpler hypothesis is preferred
• Compromise between: – Error on data under hypothesis h
– Complexity of hypothesis h
y
xxo
Complex hypothesis with
poor generalization
Simpler hypothesis with better generalization
Inductive Learning
• Different illustration, same concept….
� y = ‘A’� y = ‘B’
Complex hypothesis with
poor generalizationSimpler hypothesis with
better generalization
23
Inductive Learning
• Decision tree is one example of inductive
learning
• To be covered next:
– Instance-based learning and clustering
– Neural networks
• In all cases, minimize:
Error on data + complexity of model
Decision Trees
• Information Gain (IG) criterion for choosing splitting criteria at each level of the tree.
• Versions with continuous attributes and with discrete (categorical) attributes
• Basic tree learning algorithm leads to overfitting of the training data
• Pruning with: – Additional test data (not used for training)