Journal of Behavioral Studies in Business Volume 8 – February, 2015 Decline in church giving, page 1 Decline in church giving in the United States during the recession: A spatial application of Choice Waves Rutherford Cd. Johnson Pontifical Georgian College ABSTRACT Charitable contributions fell in the United States during the recession that begun in 2007/2008. Churches also experienced this decline. When the economy recovered, non-religious charities recovered much faster than churches. Other factors, such as doctrine, changes in religious belief, and societal secularization may influence the decision to donate to churches. This study applies economic choice waves to investigate regional effects and derives a “force of influence” function to account mathematically for the various factors that may influence church giving. The results suggest that there are both regional effects and influence from church and societal factors. Keywords: Charitable giving, choice model, GIS, regional economics, societal influence Copyright statement: Authors retain the copyright to the manuscripts published in AABRI journals. Please see the AABRI Copyright Policy at http://www.aabri.com/copyright.html.
Transcript
Journal of Behavioral Studies in Business Volume 8 – February, 2015
Decline in church giving, page 1
Decline in church giving in the United States during the recession:
A spatial application of Choice Waves
Rutherford Cd. Johnson Pontifical Georgian College
ABSTRACT
Charitable contributions fell in the United States during the recession that begun in
2007/2008. Churches also experienced this decline. When the economy recovered, non-religious charities recovered much faster than churches. Other factors, such as doctrine, changes in religious belief, and societal secularization may influence the decision to donate to churches. This study applies economic choice waves to investigate regional effects and derives a “force of influence” function to account mathematically for the various factors that may influence church giving. The results suggest that there are both regional effects and influence from church and societal factors. Keywords: Charitable giving, choice model, GIS, regional economics, societal influence
Copyright statement: Authors retain the copyright to the manuscripts published in AABRI journals. Please see the AABRI Copyright Policy at http://www.aabri.com/copyright.html.
Journal of Behavioral Studies in Business Volume 8 – February, 2015
Decline in church giving, page 2
INTRODUCTION
Charitable giving in the United States declined significantly during the economic crisis, which is generally considered to have begun in 2007/2008. Charitable donations fall into two broad categories: churches and non-profits. Both were affected by the decline in disposable income and overall worsening of economic conditions (Kahn 2008; Canon 2011). In 2010, churches and non-profits continued to suffer a decline in contribution receipts, despite the general improvement of the economy. After 2010, giving to non-profits increased1. By 2012, however, giving to churches was still depressed (Bolding 2012). Nevertheless, in 2013, thirty-one percent of American charitable contributions were to religious organizations.2 The fact that giving to churches does not parallel overall giving to non-profit organizations suggests that there are particular determining factors for parochial and faith-based contributions. In the specific case of churches, various religious factors tend to influence individual giving. They include tithing, which is considered mandatory in some Christian traditions and a pious custom in some others; and a general sense of duty to contribute to the work of the church, the care of the poor, etc. In addition, shocks to the economy may increase or decrease an individual’s religious participation, of which financial contribution can be a part (Levy and Razin 2012). This study seeks to determine whether the decline in church giving in 2010, as reported by the 2010 “State of the Plate” report (Kluth 2010), was due primarily to decline in income from 2000-2010 or to religious affiliation. This information can be used in statistical analysis and as an economic measuring tool of spatial and temporal distribution of religious belief. BACKGROUND AND OVERVIEW
Religion is known to play a role in overall financial giving. Contributions to charities (not just churches) are notably greater in areas that tend to be more religious (Lindsay 2012). Thus it is not unreasonable to expect that religious strongholds in the United States are characterized by greater levels of contribution to churches. However, as Christian denominations differ in their doctrine and views on contributions, there may be variations in giving observed across these contributions. Furthermore, the seriousness of devotion of individuals relates to their adherence to the doctrine of their religious community and hence to their financial contributions to the church. For example, some Christian communities mandate Biblical tithing (giving at least 10% of pre-tax income to the church), while others consider this less of a requirement and more of a suggestion. The “faith factor” cannot be ignored when observing financial giving. Where a man’s heart is, his treasure is located as well.3 On one hand, a demand-side approach suggests religious participation by an individual and income are overall inversely correlated and are also highly correlated to the participation levels of others around the individual. In a supply-side approach, religious participation declines as the state acts against religion, either directly through legislation or persecution, or indirectly through means such as the encouragement and promotion of secularization (Gaskins et al. 2013). With respect to overall charitable giving, higher income does not necessarily translate into higher percentages of income contributed to non-profits or churches. In the United States, a higher percentage of income given to charity is associated with the middle income bracket.
1 The Center on Philanthropy at Indiana University and Giving USA 2012. 2 Giving USA 2012. 3 Luke 12.34.
Journal of Behavioral Studies in Business Volume 8 – February, 2015
Decline in church giving, page 3
Additionally, those households with more than $200,000 annual income, when living in neighborhoods with at least forty percent of the residents in the same income bracket, give approximately half the percentage of their income than those in the same income bracket living in more economically diverse neighborhoods (Gipple and Gose 2012). Additionally, this is an interesting finding, since the religious poor have been found to be more associated with economic conservatism, while the religious rich are less economically conservative than their secular counterparts in the same wealth category. This further aids in demonstrating the interplay between religious participation, the participation of others, and income (Gaskins et al. 2013).
Secularization is also a force at play today in America. As various factions seek to remove religion as much as possible from the public and private sector, approximately half of the population identifies itself as non-religious (Kluth 2010). Those regions that are less religious tend to favor higher taxes and more government programs to replace the parochial and church-wide programs favored by the more religious (Gipple and Gose 2012). As seen particularly in socialist and communist countries, secularization leads to “God and Church” being replaced with “State.” The people are always left with some sort of religion, even if that “religion” is the state.
Furthermore, a “critical mass” of affluence has also been shown to be a contributing factor to moral decline and avoidance of moral responsibility in society and government (Harper and Jones 2008). Moral atrophy is certainly contagious and can spread through a market or a society (Hawtrey and Johnson 2010). Thus the affluence bubble of the 1990s and early 2000s may have contributed greatly to gradual secularization of the United States over the last decade (Johnson 2013). The number of “unaffiliated” adults has risen drastically, with the number of adults who say they are unaffiliated with any religion being approximately double the number who declare that they were unaffiliated as children.4 Also, a decided majority of those who self-identify as religious do not agree with their primary religious organization on several key doctrinal and dogmatic issues of the faith.5 With churches competing for members and resources and the resulting commercialization of religion, there is a general feeling today of self-determination of “what religion means to me.” This is carried in some cases almost to the point of each individual determining a personal doctrine. It is ultimate consumerism in religion, and it is a form of secularization that exists within the walls of the church. This general trend is not new, however. It has just been carried to new extremes. In 1899, for example, Pope Leo XIII admonished the Catholics of America that the doctrine of the faith is universal and does not change with national borders.6 Different denominations may certainly experience different prevailing philosophies among their members regarding giving to the church. As the number of people in society whose personal philosophy is secular, whether they are religiously-affiliated or not, reaches a critical mass, it is possible to change the prevailing group philosophy of both society and religious organizations (Johnson 2013).
Because prevailing philosophies at odds with theology exist both within and without the church, the number of non-religious people in society is but one factor. “Excessive affluence” can lead to the loss of religious values, even for those who retain at least some form of affiliation with a church (Johnson 2009). Individuals may become less stringent with their observation of doctrine, discipline, and practice. Their belief in the creeds of their church may weaken. Creeds may be perceived more as historical than as current guides for life and true statements of belief. Parishioners may also attend services less and participate more infrequently in the life and works
4 Pew Research Religion and Public Life Project. 5 Idem. 6 Testem Benevolentiae Nostrae. Encyclical of Leo XIII. 22 January 1899.
Journal of Behavioral Studies in Business Volume 8 – February, 2015
Decline in church giving, page 4
of the parish. The last several decades, for example, have seen a significant decline in the numbers of parishes per capita, clergy and religious, and active congregants (by population) in the parishes of the U.S. Conference of Catholic Bishops7. In response to the overall situation, different denominations may adopt different “business strategies.” Some may hold to doctrine, even if it leads to shrinking membership and diminishing financial contributions. In what could be termed a consumeristic approach, others may modify, suppress, or even simply “hide” or “disguise” doctrine in an attempt to fill pews and coffers. These changing dynamics can reasonably be expected to establish an environment in which giving varies across denominations and depends on the strength of religious belief of the individual, not simply a result of purely economic conditions. Giving can further vary spatially according to the prevailing philosophy and the concentration of individuals in different geographic regions holding specific points of view.
Considering churches according to a business model approach, they not only typically provide humanitarian and community services like many non-profit organizations, they also offer spiritual “services.” This naturally varies by denomination. An evangelical church, for example, might provide its adherents with preaching as a primary “commodity.” A Catholic church, on the other hand, might provide its members with the sacraments as the primary “commodity.” Since the focus of any Christian church or community is tied directly to its doctrine, willingness to contribute, then, can also be conceptualized by economic measurements in terms of what the potential contributor might “get.” That is, in a consumerist church environment, the parishioner is a form of consumer. If he does not consider the return for his financial donation and investment of time to be worth the expenditure, he might very well seek to change the operations of the church, modify his investment of time and/or money, or “vote with his feet” and go to another church or exit of religion altogether. This, of course, violates the Christian premise that contributions to the church should be out of love (which is the very origin of the word “charity”), devotion, and duty rather than selfish interest. Yet, particularly where money is concerned, one cannot ignore the potential for human selfishness. Indeed, sacramental theology specifically states that the fallen state of mankind is the very reason the sacraments exist. That is, the sacraments are a means of sanctification, a medicine of sorts for the soul (McGrath 2001; VanMeveren 2013). Christian doctrine says that commercialism in the church is an attempt to commercialize something that is inherently non-commercial. This makes the internal presence of consumeristic approaches somewhat perplexing, almost as if the organization were at odds with itself. Yet, this issue cannot be ignored from an analytical standpoint.
As society becomes more secular and religion becomes more commercialized and individualistic, it is entirely plausible that individuals might view their contributions to the church in the same way as they view a purchase decision. That is, the question might be along the lines of the following: “If I allocate a certain portion of my monetary resources to this church, what benefit do I receive, and does that benefit justify the cost?” Competition in religion is nothing new. The early Christian Church was at odds with the Jewish establishment and, until Constantine the Great, with the pagan religion of Rome. The early Church was also plagued by heretical sects all competing for membership. It was during these early centuries that the term “Catholic” was first used to refer to the portion of the Church that held to the universal Christian faith, as opposed to the various heresies. While the several Church Councils helped to ease the internal competition greatly, when the Protestant Reformation took place, Christendom was thereafter divided into two strongly-competing (and often warring) groups. The
Journal of Behavioral Studies in Business Volume 8 – February, 2015
Decline in church giving, page 5
establishment of Islam, which derived from the Christian Church, also created another front of conflict and competition, with warfare and tension still ongoing today as much if not more so than in the times of the Crusades. Even before the period of secularization and change in church institutions beginning largely in 1960s and continuing to the present, Western religious organizations competed for membership both on an emotional level and through rational explanation (Mol 1972). As secularization has continued and doctrines have been eroded, churches find themselves competing even more with secular organizations (Gruber and Hungerman 2006). This provides even more reason to suspect that more than mere economic factors are at play when considering an individual’s decision regarding financial contribution to churches.
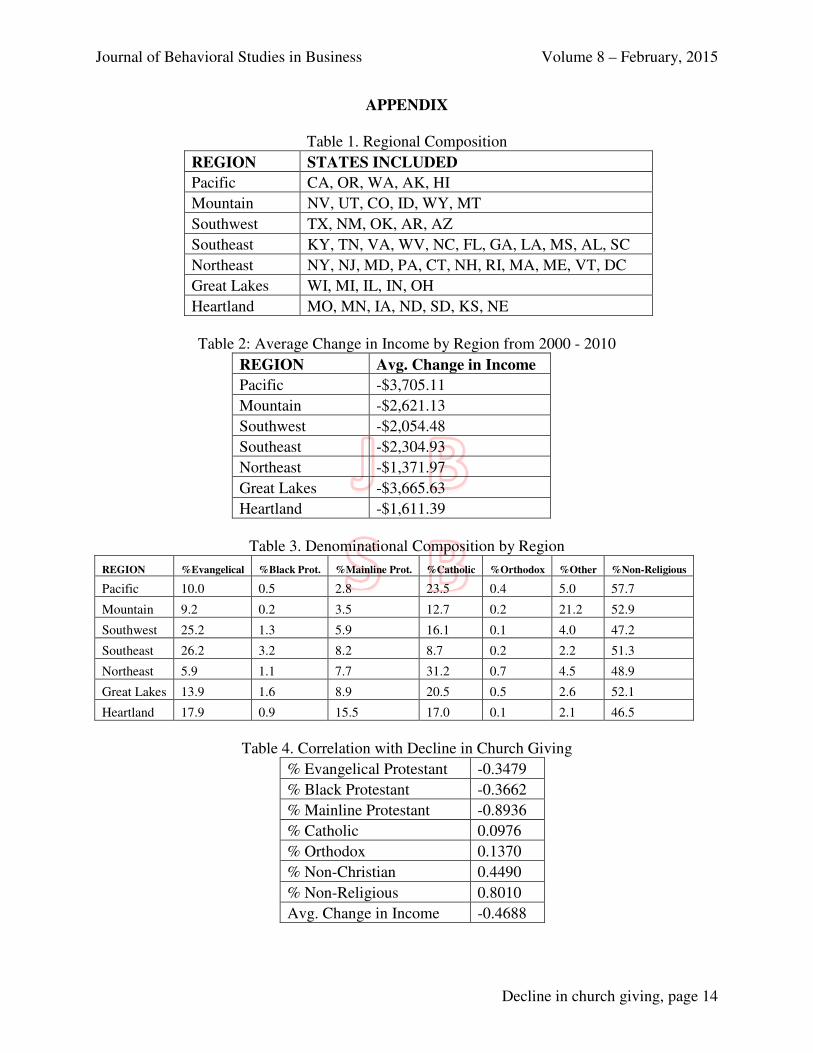
DATA OVERVIEW
The ecclesiastical data for this study were extracted from the 2010 “Review from the Pew Survey” conducted by the Maximum Generosity organization in Colorado, USA. The survey data were classified by region8 and included denominational data and decline in giving reported in 2010. The states included in each region are given in Table 1 (Appendix). Delaware was not included in the study.9 Average change in income was obtained for the same regions from the 2010 and 2000 US Census reports. (See Table 2 (Appendix).) All monetary values are given in 2010 US$. The information pertaining to religious makeup was grouped by the State of the Plate report into the following categories: Evangelical Protestant, Black Protestant, Mainline Protestant, Catholic, Orthodox, Non-Christian Religion, and Non-Religious. The Evangelical Protestants are typically those in certain Baptist organizations, Brethren in Christ, Church of God, Primitive Baptists, the Salvation Army, Pentecostal churches, and many other denominations that consider themselves part of the Evangelical faith tradition. Also included in the evangelical tradition are some denominations that stem from some mainline denominations, such as Evangelical Methodists (distinct from United Methodists). Black Protestants are those predominately comprised of African Americans and stemming from the African American religious experience in the United States. Mainline Protestants are denominations such as Methodists, Presbyterians, Episcopalians, other Protestant Anglicans, and Lutherans. Catholics include those under the U.S. Conference of Catholic Bishops, Old Roman Catholics, Old Catholics, Catholic Anglicans (such as those in the Anglican Ordinariate), and others in the Independent Sacramental Movement. Orthodox comprises membership in any of the Eastern Christian traditions, but not the Eastern Catholic Rites. Non-Christian religions include Islam, Judaism, Buddhism, and other pagan faiths. Non-Religious individuals are those who do not self-identify with any faith group and do not consider themselves to be religious.
Table 3 (Appendix) provides the percentages of each denomination by region. Although there was variation by region, approximately half of the United States population self-identified as religious, the other half as secular or non-religious. The greatest number of non-religious were in the Pacific region. Of the religious, approximately 6% were of a non-Christian religion, but this proportion varied greatly by region. The Mountain region by far had the highest
8 These classifications by region were made by the 2010 State of the Plate report. Because of this, the same regional classifications had to be maintained in this study. 9 Likewise, Delaware was not part of the available data set from the 2010 State of the Plate report and thus was not able to be included in this study.
Journal of Behavioral Studies in Business Volume 8 – February, 2015
Decline in church giving, page 6
concentration, with 21% being of a non-Christian religion. The Pacific, Great Lakes, and Northeast regions had the highest percentages of Catholics, which is not surprising given the large population of Catholics that immigrated to those areas in the 19th century. Evangelicals were the predominant denomination in the Southwest and the Southeast. Both Orthodox and Black Protestant groups were small in number. METHODOLOGY
Church giving is a sub-set of the broad category of religious participation. Overall, the choice of religious participation may, in economic terms, be conceptualized as a bundle of goods, denoted as �. An individual maximizes utility at a given point by making a choice of �, given a utility-maximizing choice of all other goods. Because of the factors influencing the choice of religious participation, utility is also necessarily a function of those factors. This is given in Eqn. 1 (holding all other factors constant), where � denotes income, N denotes the influence of others, and G represents the influence of government.
[1] ���� = ���, , �� The variable N, the influence of others, deals with a potentially complex set of human
interactions. As person A influences person B, so person B influences person A. Both are being influenced by person C and vice versa; and so on. This network of interaction has a theoretical boundary of the total population. However, different people influence others with different degrees of strength and effect. Likewise, different people respond to influences differently. For each individual in society, each person with whom they interact may have no impact, a small impact, or a large impact on them. Interaction must be defined not only as direct, personal contact, but also contact through media. For example, a person might be influenced through the internet or television more by someone else on the other side of the world than by their own neighbor. In such a case, the person on the other side of the world might effectively be “closer” than the neighbor. Thus effective influence can be thought of as “effective distance” (not necessarily physical distance) from the other person. The “closer” one is to someone in terms of effective distance, the more influence they have. The combination of effective distance and relative strength of influence between two individuals within a system of individuals can be thought of as a “force of influence.” This is expressed in Eqn. 2.10
[2] � � = ��������� ����
In Eqn. 2, � � is the force of influence of the ith individual on the jth individual. A is a
constant. The variables � and �� are the relative levels (or strengths) of influence of the ith and jth
individuals respectively. In the denominator, r is the effective distance between the two
individuals, and f(r) is some function of r such that the relationship between � � and r remains
inverse. The force of influence � � is a vector along the direction of the unitary vector ���� , i.e., in
the vector direction from j towards i. Conceptually, this means that if i influences j, then j is being “pulled” towards i in terms of belief or philosophy.
Given Eqn. 2, then:
[3] � � = −��
10 Eqn. 2 is derived from Newton’s Law of Gravity, in which various objects, each with a mass and a distance from all other objects, exert gravitational force on each other and influence their motion.
Journal of Behavioral Studies in Business Volume 8 – February, 2015
Decline in church giving, page 7
Eqn. 3 asserts that the net force of influence between the two individuals must sum to zero. Note that this does not mean that the effect of the influence of i on j will necessary equal that of j on i. Over the entire set of the population Eqn. 2 exists for each pair of individuals. If the effective distance is ∞, then the equation tends towards 0, i.e., there is no force of influence between those individuals. If � or �� = 0, then this likewise indicates mathematically that their
influence is zero. Now, consider again that an individual influenced by another individual will “move”
towards that other individual in terms of belief or philosophy. Prior to the interaction, the “movement” of j towards i, holding the influence of all other individuals constant, must be zero. If there has been no influence, then there can be no effect. At the very moment an interaction takes place, if a movement begins, this is a change in movement. So, as with physical motion, the resulting effect on j due to the influence of i can be thought of as an acceleration and is denoted ��.11 This term is, of course, a vector, and it is in the same direction as the force of influence, i.e.,
along the direction of the unitary vector ���� .
This so-called acceleration, i.e., the effect of the influence of j on i, is directly related to that very force of influence. It is also logical that an individual that has a stronger level of influence (n) relative to another individual will “move” or change or tend less towards that other
individual with the lower level of n, and vice versa. A reasonable equation for �� is given in Eqn.
(4).
[4] �� = ������ ���� ����
In Eqn. 4, q and p are some functions such that the direct relationship of e and F and the indirect relationship of e and n are maintained. Thus more “influential” individuals, as determined both by their higher levels of n relative to the n-level of others and/or their lower levels of effective distance (r) tend less towards others, while the less influential individuals, as determined both by their lower levels of n relative to the n-level of others and/or their higher levels of effective distance (r) experience a greater effect towards those influencing them. In this closed system of two individuals, for example, an individual with a level of n sufficiently large relative to the other individual may experience a negligible effect from the other individual.
Thus far the model has dealt with the relative influence of two individuals on each other and the effects thereof, holding the influence of all other individuals constant. Since societies are collections of individuals, Eqns. 2 and 4 get repeated over the entire population (or subset thereof). This results in a net force of influence experienced by an individual due to the relative influence of all other persons in the population. This is expressed in Eqn. 5 for the jth individual in a population of m individuals.
[5] ��!"� = �#� $ ≠ &'∑ � �) *+ ���� , Eqn. 5 simply states that individual j is potentially influenced in some way by all other
individuals in the population. If the ith individual does not influence individual j, then the term for the ith individual in the summation is clearly 0. Note that the direction of the resulting net force of influence is not necessarily towards any one individual because of the vector summation
of the ���� terms. Using a population size of three individuals for purposes of conceptual example,
11 There is no subscript i here because this is a specific system between two individuals holding all other interactions
constant. The term �� refers specifically to the “movement,” or change of individual j, and that change is due
necessarily to the influence of i due to the closed nature of the system, i.e., there are only two individuals.
Journal of Behavioral Studies in Business Volume 8 – February, 2015
Decline in church giving, page 8
this means that individual 1 may be pulled partly towards individual 2 and partly towards individual 3, and thus tends towards somewhere in the middle. The effect of the net force of influence on an individual, then, may be termed net effect
and denoted ��!"� for the jth individual. It is defined as the vector summation in Eqn. 6.
[6] ��!" = �#� $ ≠ & -∑ � ) *+ .�
In Eqn. 6, all terms have the common term of �� , and so the equation may be re-written
as Eqn. 7.
[7] ��!" = �/01����
Returning to the specific case of church giving, recall that an individual maximizes utility by selecting a certain bundle of religious participation, x, holding all other choices at their utility-maximizing levels. Recall from Eqn. 1 that utility is a function of income, influence of others, and government action, holding all other factors constant. The utility maximization problem the consumer faces is to maximize utility from the choice of the religious bundle, where the utility is some function of the actual choice of that bundle subject to the constraint function of income, influence, and government action. This is expressed in Eqn. 8.
[8] 23� ���� = 4��� 5. 6. ℎ��, , �� Because Eqn. 7 in the net effect of the influence of others on a given individual, the term
N in the constraint function is simply Eqn. 7. The actual effect of the constraint function on the utility maximization problem depends on the relative influence of the three terms at any given moment in time. Specifically, the most relevant moment in time is the actual moment at which the individual makes the choice of the specific religious bundle.
Within this religious bundle x, church giving is a subset. Representing church giving as d and substituting in Eqn. 7 for N, the utility maximizing problem for the jth individual for choice of church giving may be represented as in Eqn. 9.
[9] 23� ��8|�� = :�8|�� 5. 6. ;��, �/01��� , ��
That is, the individual maximizes utility based on the level of church giving, given a utility-maximizing level of all other components of the religious bundle, based on the choice of d subject to the constraint. At different decision points, an individual may allocate choice across the entire religious bundle differently. By extension, the precise level of church giving (d) may vary at different decision points. This is not known, of course, until the consumer makes the utility-maximizing decision and reveals choice at a specific time. So, there is a probability that each possible level of d will maximize utility at any given point in time. This probability may be expressed according to a choice wave of the individual (Johnson 2012). This is given in Eqn. 10.
In Eqn. 10, the probability of the utility maximizing choice is 1 at the decision point. At times other than the decision point, there is a probability associated with each possible level of d that the individual can choose that the individual will choose that level of church giving (d) to maximize utility. This is represented by the choice wave.
Journal of Behavioral Studies in Business Volume 8 – February, 2015
Decline in church giving, page 9
As the choice wave in this context is a probabilistic representation of utility-maximizing choices of levels of church giving over time, the most likely level of church giving is the expectation value of d associated with the wave function. For a choice wave of arbitrary functional form, the expectation value may be expressed as some function z of the choice wave, given a utility maximizing level of all other contents of the religious bundle x (Eqn. 11) (Johnson 2007).
[11] ⟨8⟩|I = J�ψ�8�"�
Since the choice of d is necessarily a function of Y, �/01��� , and G, so too must the
expectation value ⟨8⟩ be a function of these terms. Aggregating Eqn. 11 to a specific geographical region yields an aggregate expectation value of church giving, ⟨K⟩|L, which is a linear combination of the expectation values for each individual (Johnson 2007). If the aggregate demand for a region is statistically different from that of another region, then these two regions may be said to be different regional types (Johnson 2012). Note that typically in the choice wave approach, behavior is first observed at the decision points and then it is determined if individuals can be aggregated into statistically separate types that each behave statistically similarly to a type representative consumer following a specific choice wave, as each choice wave is orthogonal to all other choice waves. However, it is equally valid to create arbitrary geographical separations and observe whether the aggregate choices for each area constitute statistically separate entities, i.e., choose according to different choice waves. EMPIRICAL ANALYSIS AND RESULTS
Recall that the wave function (see Eqn. 10 above) and the expectation value (see Eqn. 11 above) are functions of income, net effect of influence of others, and government action. For empirical analysis, government action (G) is held constant. Denominational affiliation is used as a measurement of influence of others, holding all other influence constant. Average change in income is used for the regional income variable. The empirical equation being observed is Eqn. 12, where z and w are arbitrary functions.
[12] ⟨∆8⟩|I = J�ψ�∆8�"� = F�∆�, KB�#N�|O,P
In Eqn. 12, the observable expectation value of change in church giving is a function of the change in income and the denominational affiliation, holding government action and all other influence constant. Spatial distribution of these factors were first observed. Then the statistical correlation between decline in giving and each of the denominational percentages and the average change in income were calculated. If regions are observed to behave statistically differently from other regions, it can suggest the potential presence of different regional types making choices according to different choice waves. The spatial distribution of denominations, decline in the percentage of church giving, and average change in income in 2010 are shown in Fig. 1. The region most affected by decline in giving is the Pacific area. That region had the highest percentage of non-religious, was in the highest category of income decline from 2000-2010, and was the region that saw the biggest decline in church giving. The Heartland experienced the lowest decline in church giving, had fewer non-religious and more Catholics, Evangelicals, and Mainline Protestants in fairly even percentages. The Heartland belonged to the lowest category of decline in income. The Northeast also was in the category of smallest decline in income, but was in the middle category of decline
Journal of Behavioral Studies in Business Volume 8 – February, 2015
Decline in church giving, page 10
in church giving. That region has smaller numbers of Mainline Protestants and Evangelicals, and higher numbers of Catholics. The Great Lakes region experienced the second smallest decline in income and experienced the second smallest decline in church giving. The numbers of Catholics and Evangelicals were relatively even, with a smaller number of Mainline Protestants. A little more than half of the population in that region was Non-Religious. The Mountain region had the highest percentage of non-Christian religious and ranked in between the Pacific and Great Lakes regions in terms of percentage of Non-Religious. That region was in the middle in decline in income and had the second highest decline in church giving. The Southeast and Southwest were in the second-smallest category of income decline and in the middle category of decline in church giving. The Southeast had more Non-Religious individuals than the Southwest and fairly similar numbers of Evangelicals and Mainline Protestants. The Southwest had more Catholics and non-Christian religions.
The spatial results suggest that there is some correlation between decline in church giving and the other variables of denominational composition and change in income. There was not, however, a simple pattern. For example, the Heartland and the Northeast experienced the same low decrease in income, but different categories of decline in church giving. The Southwest, Southeast, and Northeast all were in the same moderate category of decline in church giving, but different categories of decline in income. To investigate further, the direct statistical correlation was obtained for each explanatory variable.
Table 4 (Appendix) lists the correlation coefficients between decline in giving and the various variables in the X matrix. Since the dependent variable, decline in church giving, is given as an absolute value, negative correlation coefficients imply that an increase in that variable results in a decrease in the decline in giving, i.e., the decline in giving is smaller. Positive correlation coefficients imply that an increase in that variable results in an increase in the decline in church giving, i.e., the decline becomes more pronounced. The strongest correlations were associated with % Mainline Protestant and % Non-Religious. The variable % Mainline Protestant was correlated at -0.89, while % Non-Religious was correlated at 0.80. The more Mainline Protestants there are in a given region, the smaller the decline in church giving by, other things being equal, a factor of 0.89 times the increase in percentage of Mainline Protestants. Conversely, an increase in the percentage of Non-Religious results in, other things being equal, a greater decline in church giving in a particular region by a factor of 0.8 times the increase in percentage of Non-Religious. Evangelical Protestants and Black Protestants also result in a decrease in the decline in church giving, but are much less correlated than Mainline Protestants. Not surprisingly, a higher percentage of non-Christian religious individuals results in a greater decline in church giving, but at about half the level of Non-Religious. The average change in income was also correlated with the decline in giving. As the change in income becomes less negative or becomes more positive, the decline in giving decreases. However, this effect is much less pronounced than that of % Non-Religious and % Mainline Protestant. What was surprising was that both % Catholic and % Orthodox were weakly positively correlated with decline in church giving. A t-test for difference in decline in church giving levels across the seven regions revealed that the Pacific region is statistically different from the other regions (Southwest, Southeast, and Northeast at the 80% level; Great Lakes and Heartland at the 95% level) except for the Mountain region. At the 80% level or better, the regions of the Southwest, Southeast, Northeast, Great
Journal of Behavioral Studies in Business Volume 8 – February, 2015
Decline in church giving, page 11
Lakes, and Heartland are not statistically different from each other. At first this might suggest the presence of two regional types. However, the Mountain region is only statistically different from the Heartland (80% level) and the Great Lakes (90% level). This implies two choice waves, one representing the Pacific Region and the other representing the other regions except for the Mountain region. The Mountain region, then, is represented by a choice wave that is a linear combination of the two other choice waves, meaning that the Mountain region exists within the choice space of the other regions. It does not constitute its own regional type, since that would violate the requirement of orthogonality of choice waves. Therefore, because of the strict imposition of geographical regions, this specific economic system cannot be sub-divided into more than one statistically-independent regional type and is best treated as represented by a single representative consumer for the entire nation following a specific choice wave. This then leads to the question of what causes the variation in choice. In fact, that question is valid even if the system is divided into two regional types by excluding the Mountain region. Since there was not a clear pattern of relationship between the income variable and decline in church giving, this leaves the effect of influence. In the empirical example, this is denominational make-up. So, assuming a single choice wave for the entire nation, the variation in expectation value across regions as revealed through choices at the decision point comes not
only from differences in ∆�, but also from variation in the influence term, �/01��� , in each region.
This allows for probabilistic explanation of differences across the regions in the system without violating the orthogonality requirement. DISCUSSION
The spatial and correlation results suggest that church giving is primarily a matter of religious affiliation and, within the Christian church, denominational affiliation. This is consistent with prior research. Depending on the denomination, religion can be more or less dominant than income. The more non-religious a region is, the more likely it is to experience a decline in church giving, essentially independent of any income effects. The more Mainline Protestants there are in a region, the more likely it is that a decline in church giving will be smaller, independent of any income effects. More Evangelical Protestants and Black Protestants also reduce the level of decline, though to a lesser extent. The percentage of Catholics and Orthodox are only minimally correlated with decline in church giving. Although the results suggest that there may be distinctly different groups of regions, each with their own choice wave, the Mountain region existed in the spaces of the other two groups of regions. This did not permit the system to be modeled as multiple distinct, statistically-independent groups of regions that behave similarly in expectation value when making their probabilistic choice of church donation. Variation across the regions in the system was best explained, then, according to the net effects of influence, which was denominational make-up in the empirical example. The results suggest a system of regions that have both similarities and differences. On one hand, a single choice wave suggests a unified probabilistic function of choice in church giving. On the other hand, issues of the effects of force of influence suggest and are demonstrated by regional differences in outcome. However, this comes with a caution. This system was built on rigidly-defined geographical boundaries. With different boundaries, it may be possible to observe statistically-independent groups of regions, each with its own choice wave. Alternatively, observation of more detailed data, such as at the state, county, or local level,
Journal of Behavioral Studies in Business Volume 8 – February, 2015
Decline in church giving, page 12
may result in observation of different consumer types regarding church giving in a much more meaningful way than arbitrarily-defined geographical regions. REFERENCES
Bolding, Joshua. “Church donations growing at less than half the rate of overall charitable
giving.” Deseret News. 20 January 2012. Canon, Gabrielle. “Economic Recession Continues to Hit Non-Profits Hard.” Huffington Post.
25 May 2011. Gaskins, Ben; Matt Golder; and David A. Siegel. “Religious Participation and Economic
Conservitism.” American Journal of Political Science. 2013. Gipple, Emily; and Ben Gose. “America’s Generosity Divide.” The Chronicle of Philanthropy.
19 August 2012. Gruber, Jonathan; and Daniel M. Hungerman. “The Church vs. the Mall: What Happens When
Religion Faces Increased Secular Competition?” National Bureau of Economic Research Working Paper No. 12410. 2006.
Harper, Ian; and Eric Jones, “Treating ‘Affluenza’: The Moral Challenge of Affluence,” in
Christian Theology and Market Economics, ed. I. Harper and E. Jones (Cheltenham: Edward Elgar, 2008)
Hawtrey, Kim; and Rutherford Johnson. “On the Atrophy of Moral Reasoning.” Journal of
Religion and Business Ethics. 2010. Johnson, Rutherford. “Excessive Affluence and the Economic Crisis.” Review of Religion,
Economics, and Culture. 2013. Johnson, Rutherford. “The Loss of Religious Values Following ‘Excessive Affluence’ and its
Potential Contribution to an Economic Crisis.” Proceedings of the China Taiwan Trans-
Sea Economics and Finance Conference. 2009. Johnson, Rutherford. “The choice wave: An alternative description of consumer behavior.”
Research in Business and Economics Journal. 2012. Kahn, Huma. “Non-Profits Challenged by Financial Crisis.” ABC News. 28 October 2008. Kluth, Brian. 2010 State of the Plate Research Surveys. Maximum Generosity. 2010. Levy, Gilat; and Ronny Razin. “Religious Beliefs, Religious Participation, and
Cooperation.” American Economic Journal: Mircroeconomics. 2012. Lindsay, Jay. “Religion and Giving: More Religious States Give More to Charity.” Huffington
Post. 20 August 2012.
Journal of Behavioral Studies in Business Volume 8 – February, 2015
Decline in church giving, page 13
McGrath, Alister E. Christian Theology: An Introduction. Oxford. 2001. Mol, Hans. “Religion and Competition.” Sociological Analysis. 1972. VanMeveren, Shane. “Reformation and Restoration in Hugh Saint Victor’s De Sacramentis
Christianae Fidei.” Review of Religion, Economics, and Culture. 2013. Special Thanks
The author would like to thank Dr. Roy Ryder and Sam Stutsman of the geography faculty, Department of Earth Science, University of South Alabama, for their assistance and support for this project.
Journal of Behavioral Studies in Business Volume 8 – February, 2015