51
Decoding Digital Week Four: Evaluation & Continuous Improvement 1 www.symphony3.com
| Date post: | 14-Jul-2015 |
| Category: |
Data & Analytics |
| Upload: | symphony3 |
| View: | 112 times |
| Download: | 1 times |
Decoding Digital
Week Four: Evaluation & Continuous Improvement
1www.symphony3.com

How to engage with us by webinar
We want you to get the most out of the program by asking questions, giving your feedback, telling us your stories and participating in opinion polls.
• Chat box
• Polls
– We will be answering questions during the session on Twitter. Contact us directly at
@Symphony3Think and/or use the hashtag #DigitalVic
• LinkedIn Group
www.symphony3.com 2

Thanks to the following councils
• Banyule City Council
• Campaspe Shire Council
• Casey City Council
• Greater Dandenong City Council
• Greater Geelong City Council
• Hobson's Bay City Council
• Indigo Shire Council
• Kingston City Council
• Manningham City Council
• Mansfield Shire Council
• Moonee Valley City Council
• Murrindindi Shire Council
• Nillumbik Shire Council
• Strathbogie Shire Council
• Towong Shire Council
• Warrnambool City Council
• Whitehorse City Council
• Wyndham City Council
• Yarra City Council
• Benalla Rural City Council
• Central Goldfields Shire Council
www.symphony3.com 3

Webinar Schedule
Week 1: Developing a digital strategy (Tuesday 3rd February)
Week 2: Design & implementation (Tuesday 10th February)
Week 3: Launching and marketing the business (Tuesday 17th February)
Week 4: Evaluation and continuous improvement (Tuesday 24th February)
www.symphony3.com 4

What we’ve covered
• Developing a business model
• Creating a digital strategy
• Choosing a CMS and building an eCommerce website
• Launching the online business
• Marketing OzCrafters online
• Developing an SEO & Content Strategy
• Leveraging social media for OzCrafters
www.symphony3.com 5

This Week
• This week we look at how we can measure these efforts and use the insights for continuous improvement
• We need to continuously assess our digital strategy and refine it to get the best results
• Google Analytics to assess your
– Website usability
– Effectiveness of website and blog content
– Most effective inbound channels (including social)
• Taking processes online and using the cloud
• Digital trends to watch out for in the next 1-3 years
www.symphony3.com 6

Revisiting the diagnostic
Digital Diagnostic: http://decodingdigital.symphony3.com/
• Revisit the diagnostic
• Compare to your original results
• See how far you’ve come!
• You cannot make all of your improvements in four weeks – keep working away after Decoding Digital.
www.symphony3.com 7
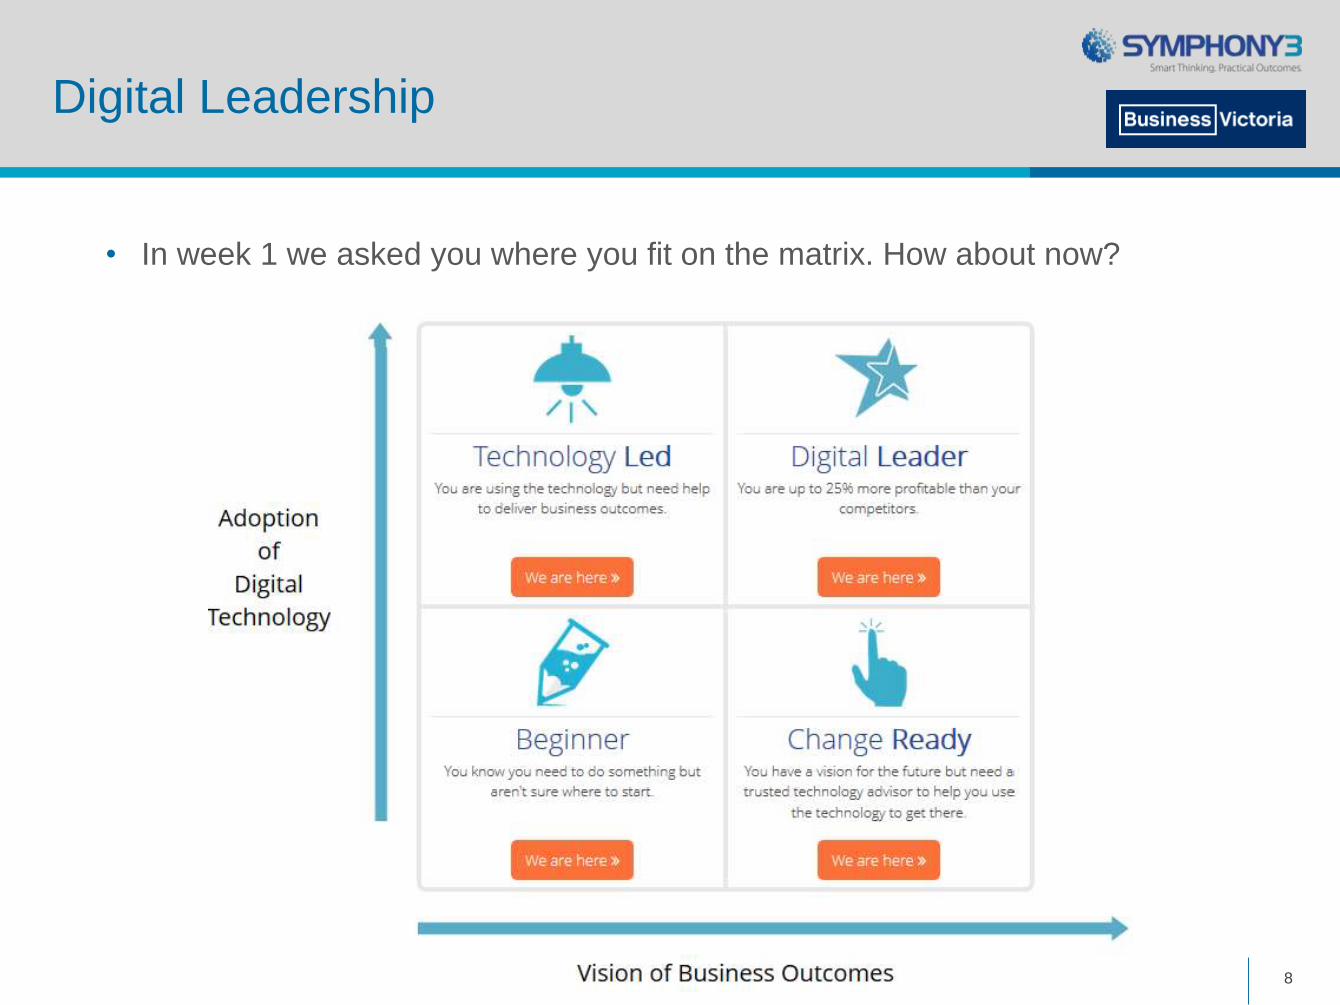
Digital Leadership
• In week 1 we asked you where you fit on the matrix. How about now?
www.symphony3.com 8

Google Analytics
• Google Analytics is a free tool that tracks how users arrive, engage and interact with your website
• The tools is implemented by adding a piece of JavaScript code to the back-end of your website
• All data collected is anonymous and compliant with privacy laws
• The data is presented in an online interface that can be used to produce reports and insights into how your website is performing
www.symphony3.com 9

How Does Google Analytics Work? (A basic overview)
1. A Google Analytics JavaScript Tracking code is added to your website
script
2. A visitor comes to your website, sending a request to the web server to
show a page
3. This executes the tracking code on the website
4. Google Analytics reads/writes first party cookies
5. Google Analytics packages all the data from the website visit into a .gif
request and sends it to a secure reporting server
6. Google Analytics processes the data and feeds it into reports (this may
take up to 24 hours)
www.symphony3.com 10

How Does Google Analytics Work? (A basic overview)
What are the implications for us?
• Data is created, captured and stored at the time of the visit
• Therefore we cannot go back in time and change data that has already occurred!
• We need to strategically configure and set-up Google Analytics in advance to capture data that will help achieve your objectives. – we’ll come back to this later.
www.symphony3.com 11

The Analytics Cycle
1) Review objectives of online channel
2) Configure analytics to measure
achievement of objectives
3) Data is captured and stored
4) Data organised and structured into
reports
5) Analyse data to create useful insights
6) Based on insights, implement change for improvement
7) Measure results of implemented change
www.symphony3.com 12
Limitations
• While Google Analytics provides lots of useful data, it’s not 100% perfect
• We cannot always collect all data, and need to keep this in mind when analysing data
Cases where data may not be collected or inaccurate:
• First party cookies disabled by the user
• When a user deletes their cookies, their next visit will always be classified as a ‘new visitor’
• JavaScript errors can occur occasionally preventing data capture
Implications:
Focus on trends and data with substantial samples. Over time these will provide you with the best insights.
www.symphony3.com 13
What are we trying to measure?
Macro Goals
A Macro goal is the end objective we would like a website visitor to complete. This will vary depending on the objectives on your site.
e.g. Purchase an item from online store
Complete an enquiry form
Click on an advertising banner
Book an appointment
Micro Goals
These are the goals that signal a user is taking steps toward completing a macro objective.
e.g. Sign up for an email newsletter
Download a file
View a blog for more than 5 minutes
Watch a video on our ‘About’ page
www.symphony3.com 14

Analytics Reports
The default analytics reports are split into four broad categories
• Audience
– Information about the visitors who have visited your site
– Use this data to assess the accuracy of your customer personas, understand your online
customers (from week 1)
• Acquisition
– Information about how visitors arrive at your website
– Use this to analyse the effectiveness of your inbound marketing efforts (from week 3)
• Behaviour
– Information about what visitors consume and how your site performs once visitors have
arrived
– Use this to analyse the performance of your website (week 2) and your content strategy (week
3)
• Conversions
– Measures the conversion of our pre-determined goals (micro and macro)
www.symphony3.com 15
Functionality – Dimensions & Metrics
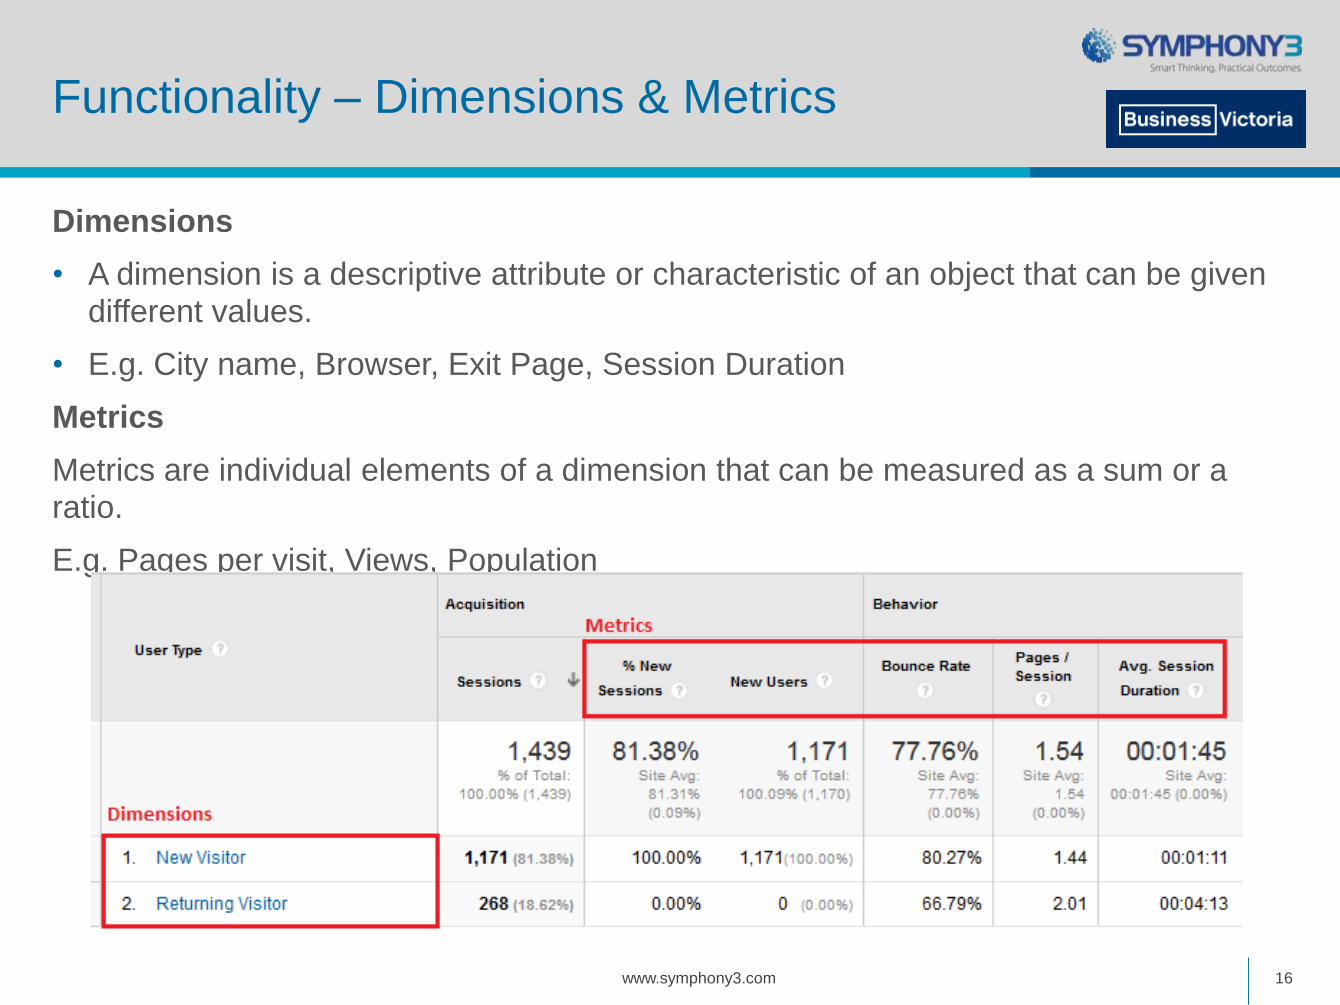
Dimensions
• A dimension is a descriptive attribute or characteristic of an object that can be given different values.
• E.g. City name, Browser, Exit Page, Session Duration
Metrics
Metrics are individual elements of a dimension that can be measured as a sum or a ratio.
E.g. Pages per visit, Views, Population
www.symphony3.com 16

Audience: Demographics & Interests
• You can choose to retrieve information about the demographics and interests of your website visitors
• This information is extrapolated from data that Google has collected elsewhere on the internet
• Do not that this data is not 100% accurate of the users visiting your website
• However, it may provide some insights into the audience you are attracting to your site
www.symphony3.com 17
Audience: Geo
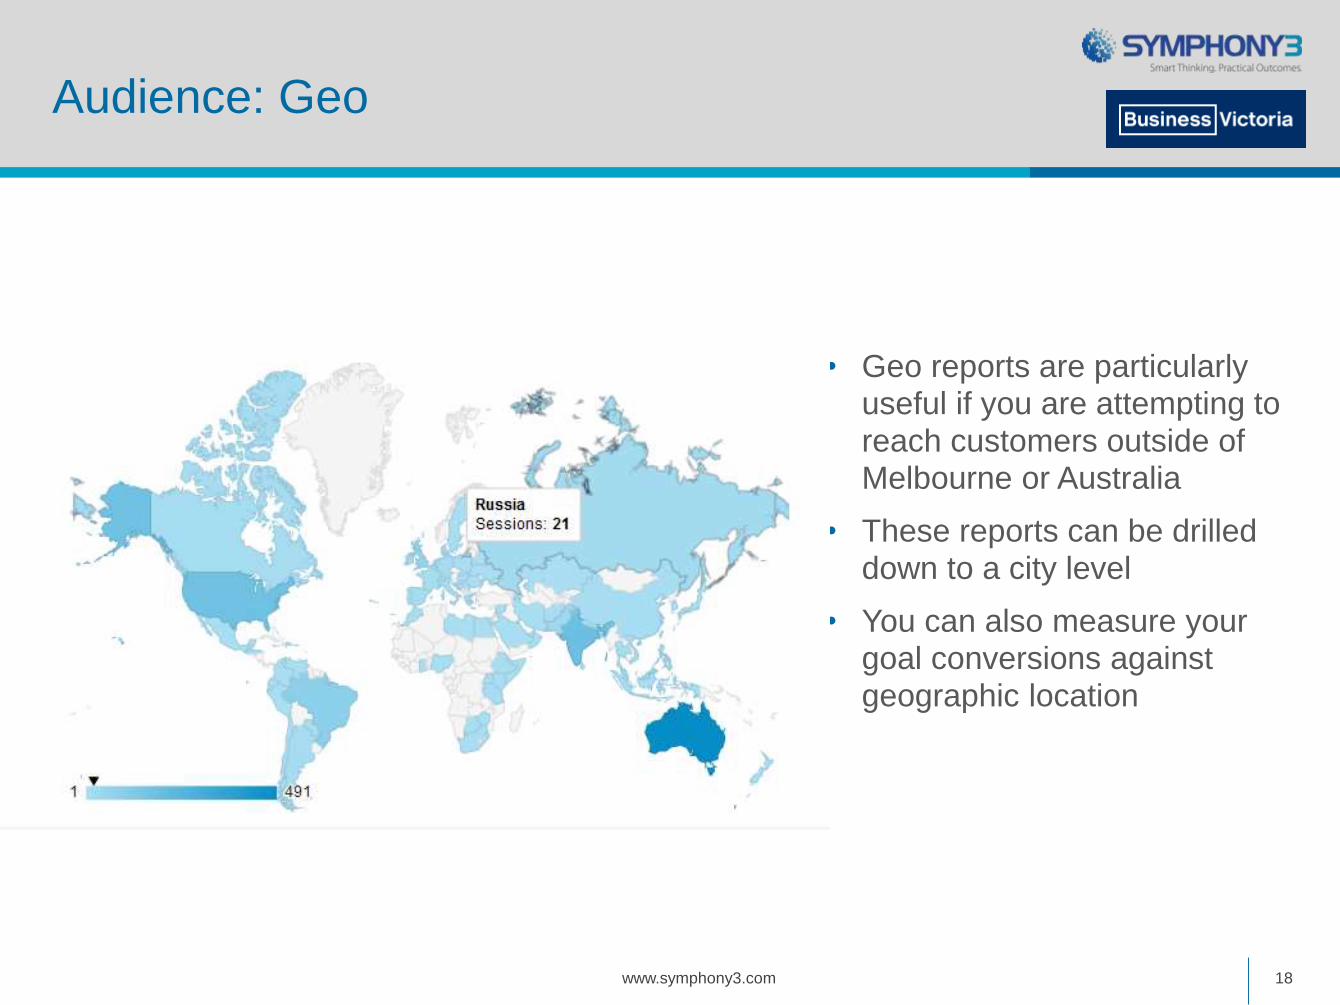
• Geo reports are particularly useful if you are attempting to reach customers outside of Melbourne or Australia
• These reports can be drilled down to a city level
• You can also measure your goal conversions against geographic location
www.symphony3.com 18

Audience: New vs. Returning
• Just like you would want to see return customers coming into your physical store, you will want to see how many visitors coming to your site have visited before
• How can we encourage customers to return to our site regularly?
www.symphony3.com 19

Audience: Engagement
• Session: Is one users visit to the site, including all page views and interactions
• Pageview: Is each individual page a visitors views in a given session
• How can we improve engagement? Do we have the right call to actions?
www.symphony3.com 20

Audience: Mobile
• Vital to understand whether you are catering for your mobile customers
• This percentage will only grow – already close to 50% in many industries
www.symphony3.com 21

Acquisition: Channels
• Your channels will give you a good high level indicator of how your online marketing channels are performing: Organic (SEO), Direct, Referral, Social, Paid, Email etc.
www.symphony3.com 22

Acquisition: Source
• Source sits a level below Channel
• E.g. A report within the ‘Social’ channel that splits up the individual social media
• Different social networks will work for different businesses –be paying attention to which networks work for your business
www.symphony3.com 23
Acquisition: Search Engine Optimization
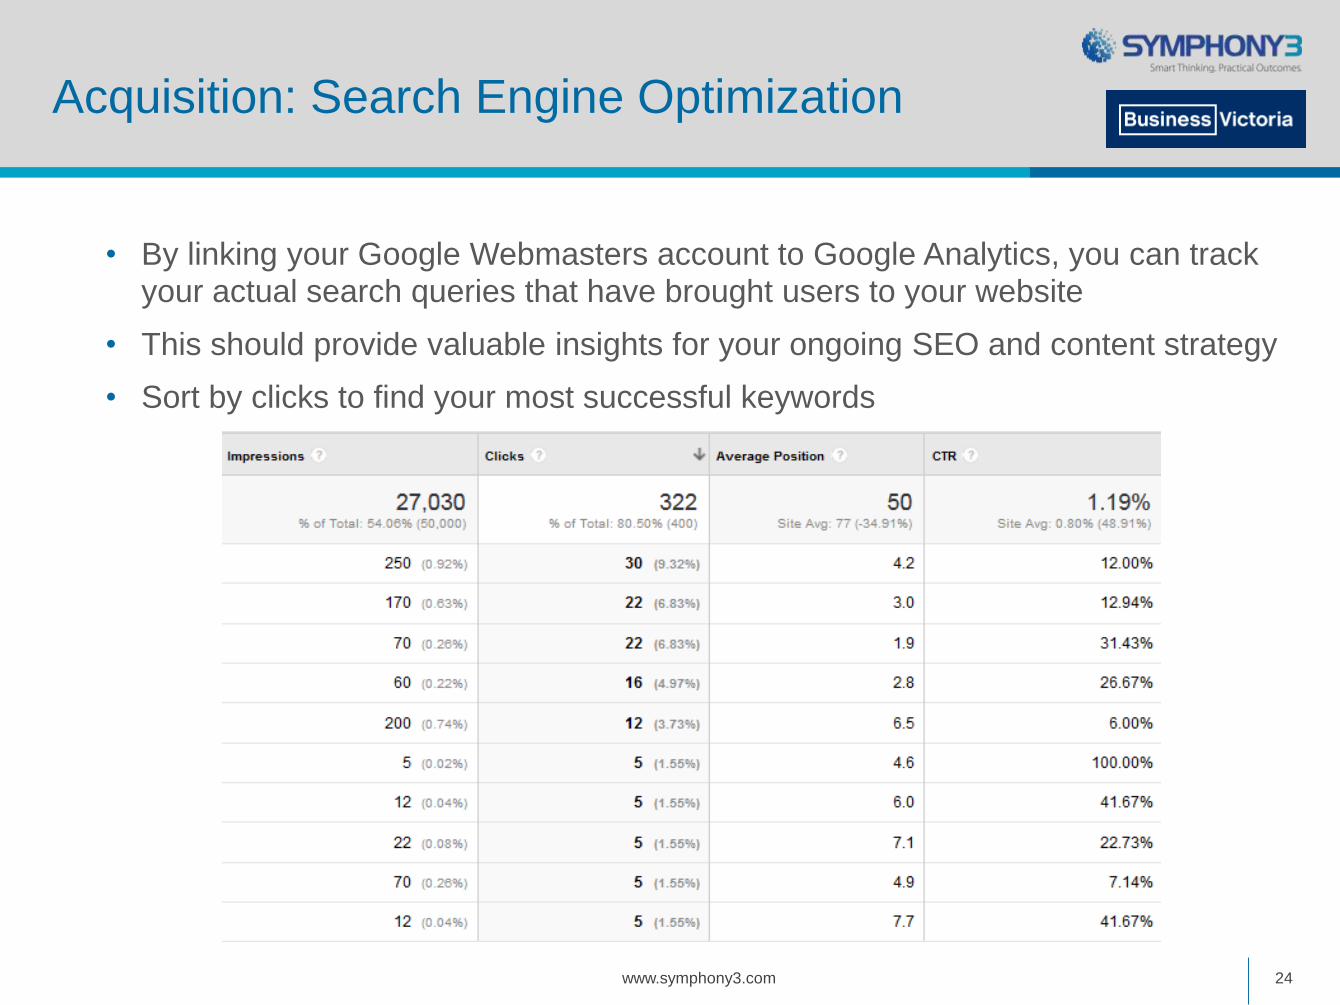
• By linking your Google Webmasters account to Google Analytics, you can track your actual search queries that have brought users to your website
• This should provide valuable insights for your ongoing SEO and content strategy
• Sort by clicks to find your most successful keywords
www.symphony3.com 24

Behaviour: All Pages
• You should regularly check which content on your site is most viewed, as well as least viewed
• Ensure that old content that still receives high traffic is regularly refreshed
www.symphony3.com 25

Behaviour: Landing Pages
• A landing page is the first page a visitor sees when they enter your site
• It’s important to optimise pages on your site to bring in traffic
• Your blog and resources should perform as landing pages for your website
www.symphony3.com 26

Behaviour: Site Search
• Site search allows you to track terms that users search within your site
• This should highlight content that is too hard to find, or may not exist yet on your website
www.symphony3.com 27
Behaviour: Event Tracking
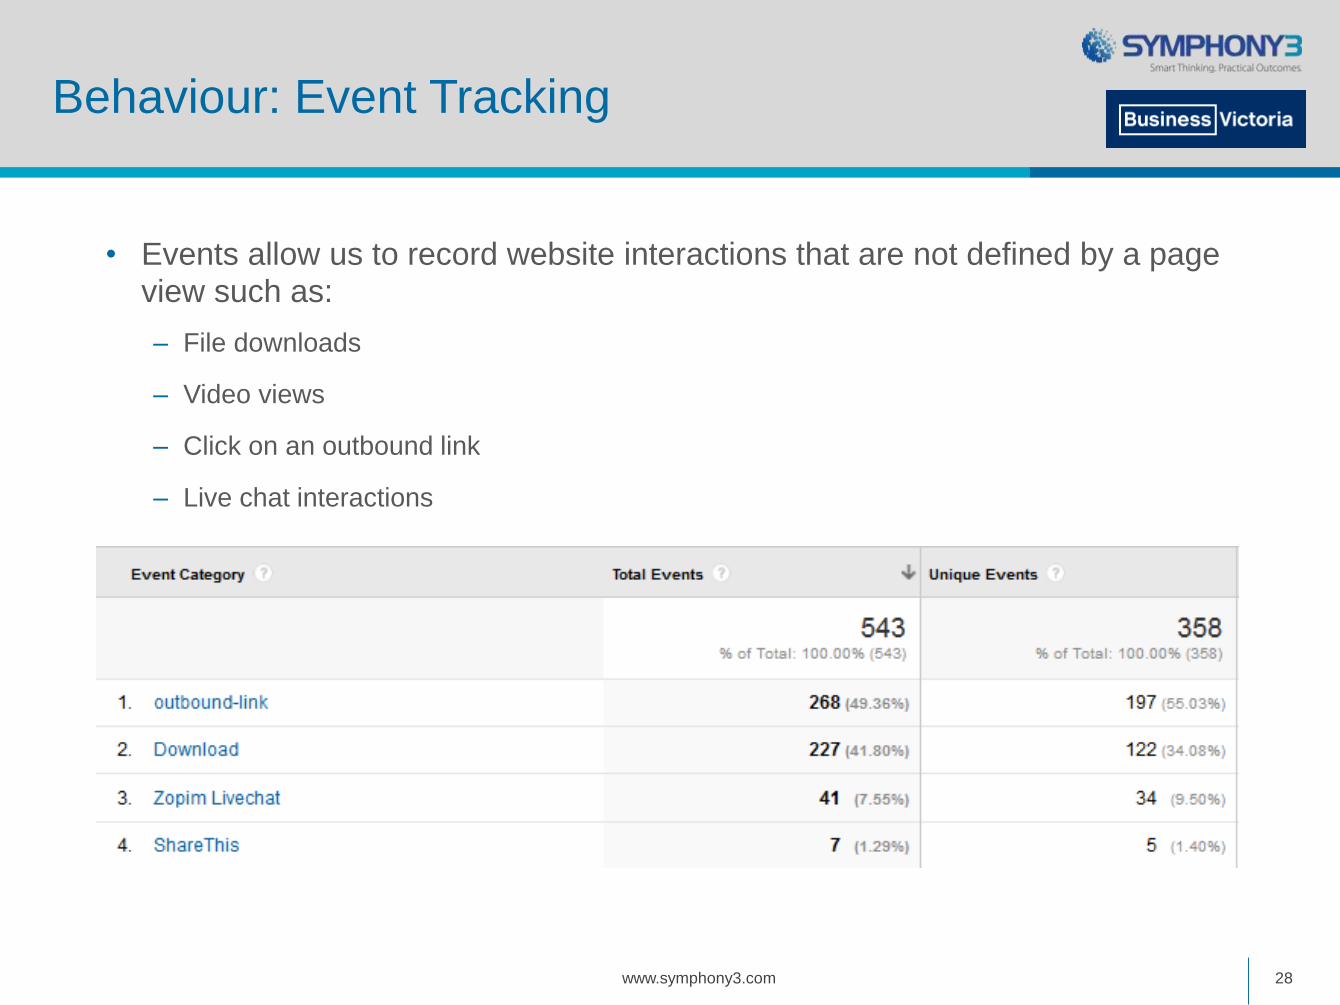
• Events allow us to record website interactions that are not defined by a page view such as:
– File downloads
– Video views
– Click on an outbound link
– Live chat interactions
www.symphony3.com 28

Other Analytics Sources
• Facebook Insights
• Twitter Analytics
• Sprout Social
• HotJar
www.symphony3.com 29

Online Business Processes
• Where can we improve the customer experience?
• Where can we streamline processes (eliminate manual processes)?
• Be mindful of your customer – they may need handholding in early days
– iPads
– Online video
– Telephone support
– Online and offline available
www.symphony3.com 30

Think of the Seven Wastes
• Overproduction
• Inventory
• Waiting
• Motion
• Transportation
• Rework
• Over-processing
www.symphony3.com 31
http://leanmanufacturingtools.org/77/the-seven-wastes-7-mudas/

Taking processes online
www.symphony3.com 32

Does it have to be complicated?
www.symphony3.com 33
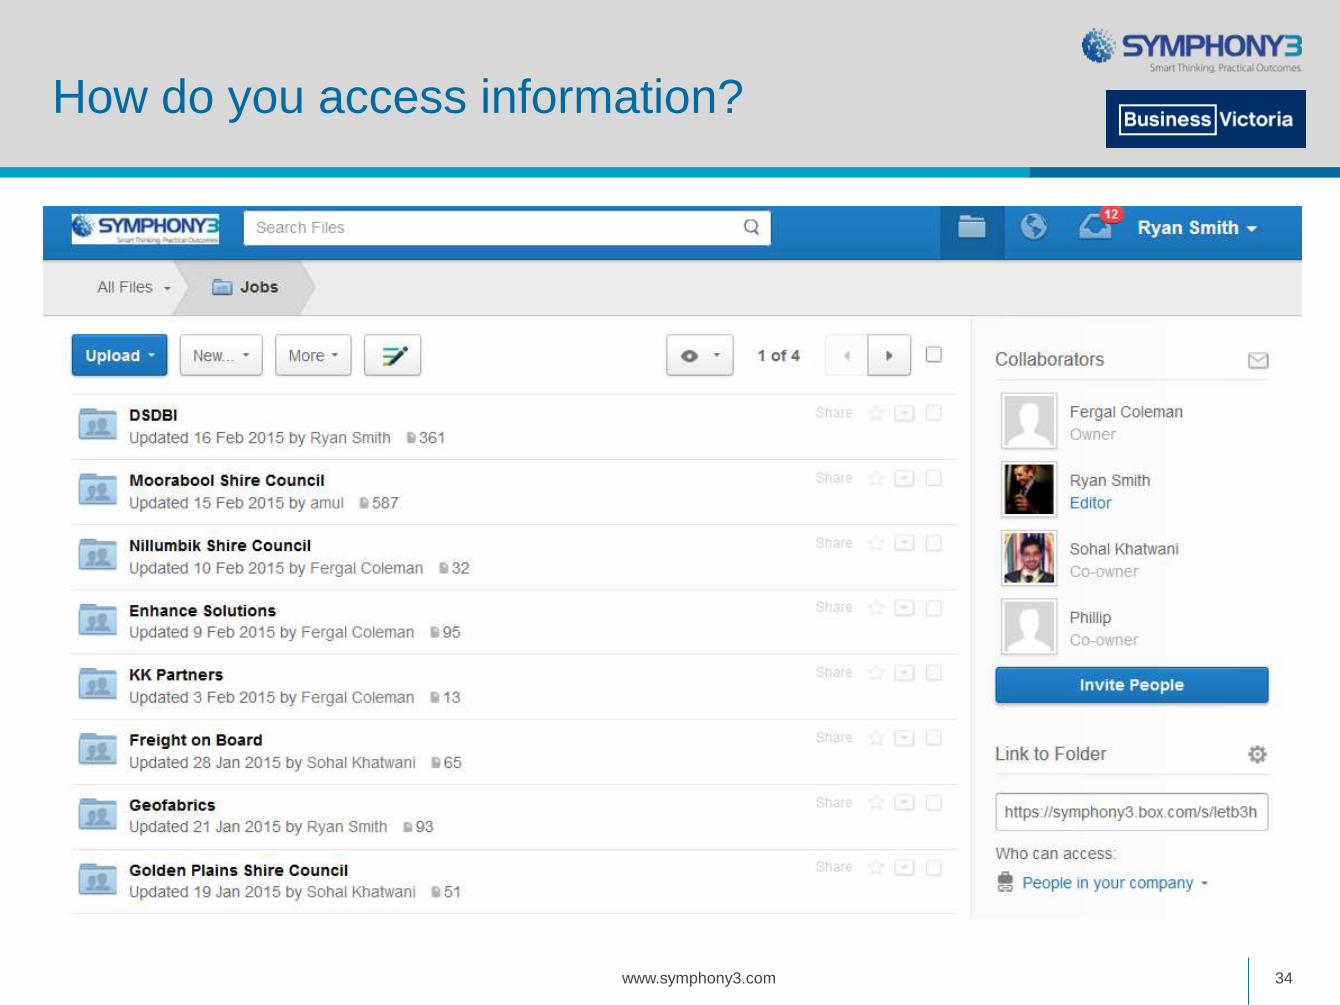
How do you access information?
www.symphony3.com 34

Are your processes mobile?
www.symphony3.com 35
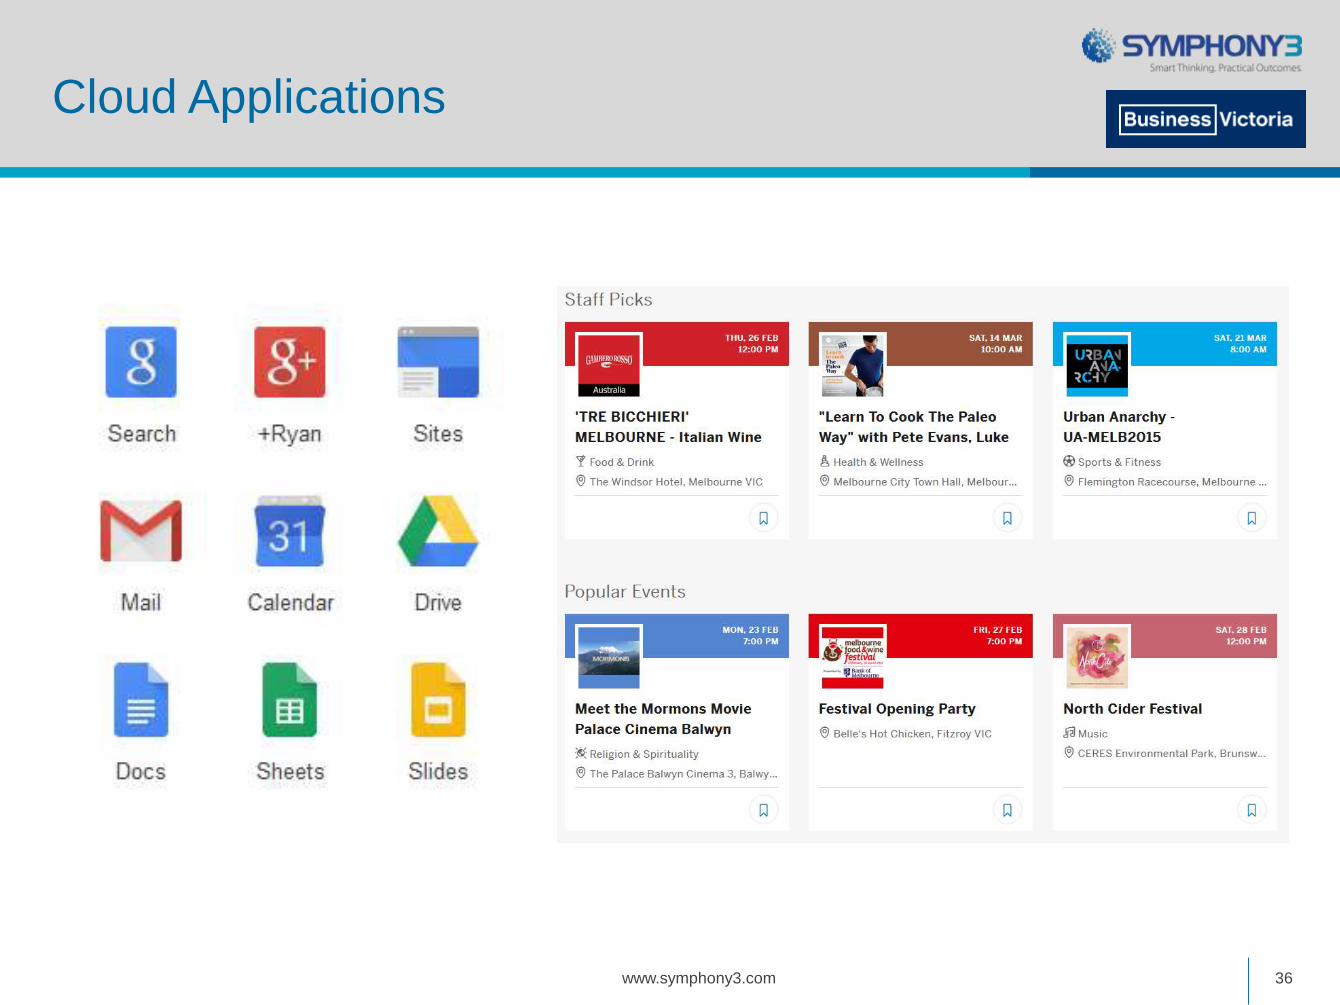
Cloud Applications
www.symphony3.com 36

Online Bookings
www.symphony3.com 37

Training and Meetings
• GoToMeeting & GoToWebinar
• Google Hangouts
• Skype
• Screencast-o-matic
• YouTube
• WhatsApp / Viber
www.symphony3.com 38

Trends: Hype Cycle
www.symphony3.com 39

www.symphony3.com 40
https://frankdiana.wordpress.com/2015/01/14/an-interview-with-futurist-gerd-leonhard/
Digital Trends = New Business Models

Digital Trends
1. Mobile
2. Social
3. Collaborative Consumption (the sharing economy)
4. The Maker Movement
5. Data
6. Internet of things
7. API Industry
www.symphony3.com 41

Mobile – multi-screen/multi-channel customers
www.symphony3.com 42
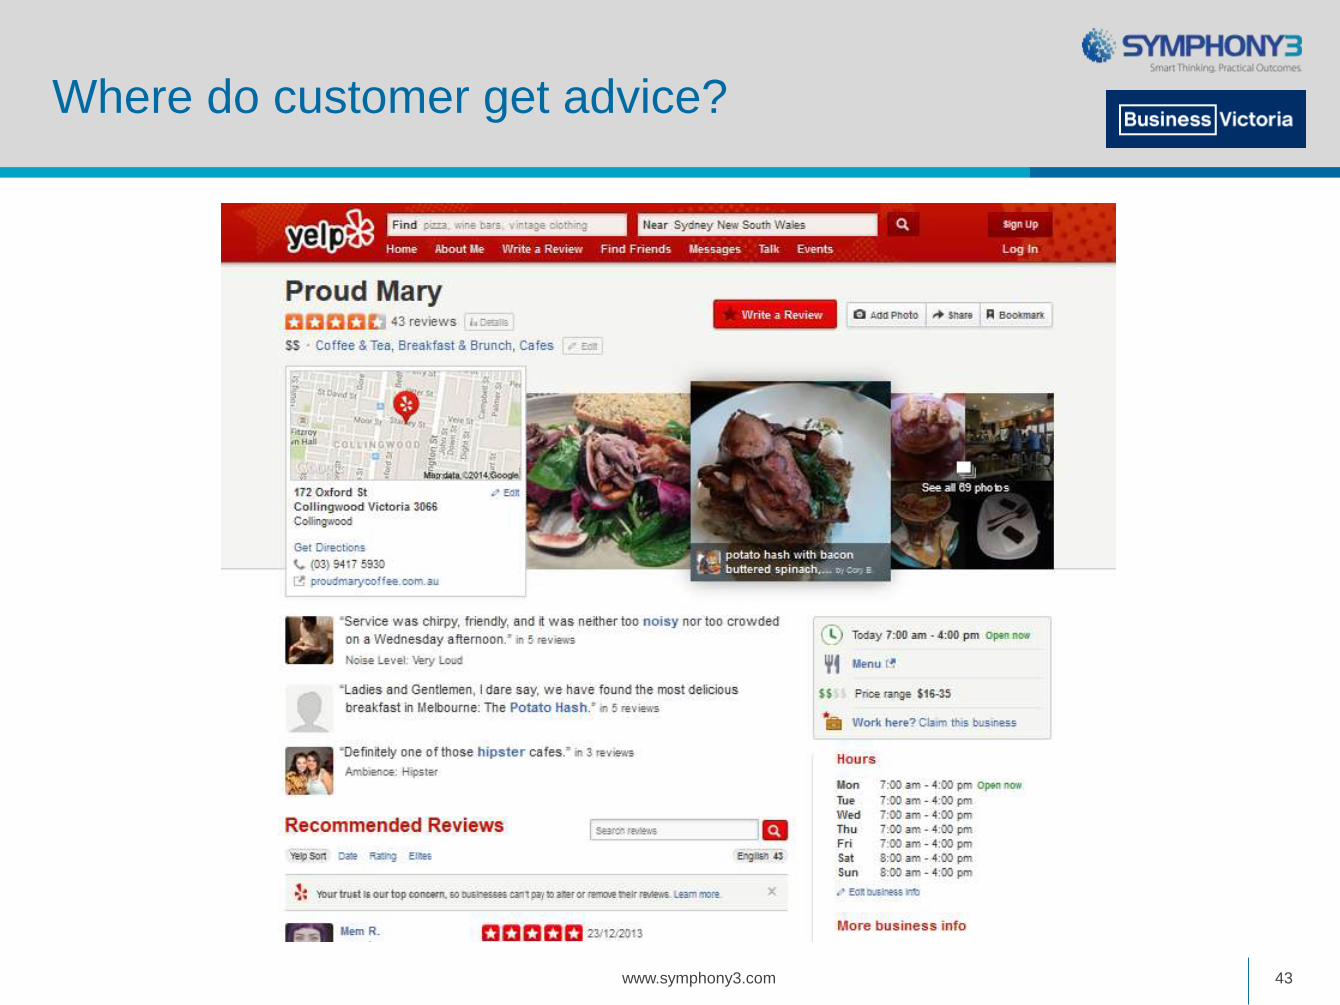
Where do customer get advice?
www.symphony3.com 43

The Sharing Economy
www.symphony3.com 44

The Maker Movement
www.symphony3.com 45
“Our core markets are education, small business and consumers.”
“3D printing can economically make objects that would otherwise require an expensive assembly line to produce”
“Experts predict that 3D printerswill one day be as commonplace as computers, with one in almost every home.”
Read more: http://www.smh.com.au/business/a-
new-dimension-in-print-making-20140425-
379mg.html#ixzz308yAPBRb

Open Data/Big Data
www.symphony3.com 46

API Industry/Open Standards
www.symphony3.com 47

Week four summary
• Taking business processes online can create efficiencies and save costs – it doesn’t have to be complicated!
• Change is set to continue in the foreseeable future – will it affect your business model?
• Web analytics should be part of a continuous process that helps decision making
• Start measuring your online efforts, derive insights and take action
www.symphony3.com 48

Conclusion
• If you attended the four webinars you should now have the basic tools, understanding and skills to:
– Develop a digital strategy
– Design & develop a website and social media with a chosen developer
– Start marketing and running your business in the digital world
– Measure and analyse your online business and make continuous improvement
• Review the webinars and resources
• Review or complete your digital strategy (use OPP template)
• Get started on implementation!
www.symphony3.com 49

What are your next steps?
• Tell us three actions you are going to commit to as a result of attending the decoding digital program.
• Write them in the questions area.
• You must complete those actions!
www.symphony3.com 50

Have your say
Discussion will continue in the Decoding Digital LinkedIn group!!!
Tweet your questions with the hashtag: #DigitalVic
Tweet us at @Symphony3Think
www.symphony3.com 51


