energies Article Decomposition Characteristics of SF 6 and Partial Discharge Recognition under Negative DC Conditions Ju Tang 1 , Xu Yang 1 , Gaoxiang Ye 1 , Qiang Yao 2 , Yulong Miao 2 and Fuping Zeng 1, * 1 School of Electrical Engineering, Wuhan University, Wuhan 430072, China; [email protected] (J.T.); [email protected] (X.Y.); [email protected] (G.Y.) 2 Chongqing Electric Power Research Institute, Chongqing Power Company, Chongqing 401123, China; [email protected] (Q.Y.); ygxfl[email protected] (Y.M.) * Correspondence: [email protected]; Tel.: +86-027-6877-2323 Academic Editor: Issouf Fofana Received: 17 March 2017; Accepted: 17 April 2017; Published: 18 April 2017 Abstract: Four typical types of artificial defects are designed in conducting the decomposition experiments of SF 6 gas to obtain and understand the decomposition characteristics of SF 6 gas-insulated medium under different types of negative DC partial discharge (DC-PD), and use the obtained decomposition characteristics of SF 6 in diagnosing the type and severity of insulation fault in DC SF 6 gas-insulated equipment. Experimental results show that the negative DC partial discharges caused by the four defects decompose the SF 6 gas and generate five stable decomposed components, namely, CF 4 , CO 2 , SO 2 F 2 , SOF 2 , and SO 2 . The concentration, effective formation rate, and concentration ratio of SF 6 decomposed components can be associated with the PD types. Furthermore, back propagation neural network algorithm is used to recognize the PD types. The recognition results show that compared with the concentrations of SF 6 decomposed components, their concentration ratios are more suitable as the characteristic quantities for PD recognition, and using those concentration ratios in recognizing the PD types can obtain a good effect. Keywords: SF 6 ; negative DC-PD; decomposed components; concentration ratio; back propagation neural network; PD recognition 1. Introduction Given the connection of new large-scale energy and the rapid development of HVDC transmission technology and flexible HVDC technology, DC gas-insulated equipment (DC-GIE) has attracted significant attention because of its technological advantages in improving system reliability and reducing space occupation [1–6]. Pure SF 6 gas has stable chemical properties and is not easily decomposed. However, under the effect of the partial discharge (PD), spark discharge, arc discharge, overheating, and other factors, SF 6 gas is decomposed into various low-fluoride sulfides (such as SF 5 , SF 4 , SF 3 , SF 2 , and SF). These low-fluoride sulfides then react with the trace air and moisture that inevitably exist in the DC-GIE to produce stable decomposition products, such as sulfuryl fluoride (SO 2 F 2 ), thionyl fluoride (SOF 2 ), thionyl tetrafluoride (SOF 4 ), sulfur dioxide (SO 2 ), carbon tetrafluoride (CF 4 ), carbon dioxide (CO 2 ), hydrogen fluoride (HF), and hydrogen sulfide (H 2 S) [7–12]. Some of these products, particularly SO 2 , HF, and H 2 S, can corrode metal parts and solid insulation in equipment, thereby accelerating insulation aging and reducing the overall insulation performance of the equipment. Eventually, the safe and reliable operation of the equipment and the entire power grid is compromised. SF 6 gas component analysis (GCA) is a non-electrical detection method, which can effectively avoid the complex electromagnetic interference of substations and has become a popular research Energies 2017, 10, 556; doi:10.3390/en10040556 www.mdpi.com/journal/energies
Transcript
energies
Article
Decomposition Characteristics of SF6 and PartialDischarge Recognition under NegativeDC Conditions
Ju Tang 1, Xu Yang 1, Gaoxiang Ye 1, Qiang Yao 2, Yulong Miao 2 and Fuping Zeng 1,*1 School of Electrical Engineering, Wuhan University, Wuhan 430072, China; [email protected] (J.T.);
[email protected] (X.Y.); [email protected] (G.Y.)2 Chongqing Electric Power Research Institute, Chongqing Power Company, Chongqing 401123, China;
Academic Editor: Issouf FofanaReceived: 17 March 2017; Accepted: 17 April 2017; Published: 18 April 2017
Abstract: Four typical types of artificial defects are designed in conducting the decompositionexperiments of SF6 gas to obtain and understand the decomposition characteristics of SF6
gas-insulated medium under different types of negative DC partial discharge (DC-PD), and usethe obtained decomposition characteristics of SF6 in diagnosing the type and severity of insulationfault in DC SF6 gas-insulated equipment. Experimental results show that the negative DC partialdischarges caused by the four defects decompose the SF6 gas and generate five stable decomposedcomponents, namely, CF4, CO2, SO2F2, SOF2, and SO2. The concentration, effective formationrate, and concentration ratio of SF6 decomposed components can be associated with the PDtypes. Furthermore, back propagation neural network algorithm is used to recognize the PD types.The recognition results show that compared with the concentrations of SF6 decomposed components,their concentration ratios are more suitable as the characteristic quantities for PD recognition,and using those concentration ratios in recognizing the PD types can obtain a good effect.
Given the connection of new large-scale energy and the rapid development of HVDC transmissiontechnology and flexible HVDC technology, DC gas-insulated equipment (DC-GIE) has attractedsignificant attention because of its technological advantages in improving system reliability andreducing space occupation [1–6]. Pure SF6 gas has stable chemical properties and is not easilydecomposed. However, under the effect of the partial discharge (PD), spark discharge, arc discharge,overheating, and other factors, SF6 gas is decomposed into various low-fluoride sulfides (such asSF5, SF4, SF3, SF2, and SF). These low-fluoride sulfides then react with the trace air and moisture thatinevitably exist in the DC-GIE to produce stable decomposition products, such as sulfuryl fluoride(SO2F2), thionyl fluoride (SOF2), thionyl tetrafluoride (SOF4), sulfur dioxide (SO2), carbon tetrafluoride(CF4), carbon dioxide (CO2), hydrogen fluoride (HF), and hydrogen sulfide (H2S) [7–12]. Some of theseproducts, particularly SO2, HF, and H2S, can corrode metal parts and solid insulation in equipment,thereby accelerating insulation aging and reducing the overall insulation performance of the equipment.Eventually, the safe and reliable operation of the equipment and the entire power grid is compromised.
SF6 gas component analysis (GCA) is a non-electrical detection method, which can effectivelyavoid the complex electromagnetic interference of substations and has become a popular research
topic in recent years [13–16]. In [17–19], the SF6 decomposed products under arc, spark, and coronadischarges were studied. Tang et al. compared and analyzed the decomposition characteristics of SF6
under two types of common PDs [20], and recognized four typical PD types [21,22]. A large number ofstudies have shown that the type, concentration, and formation law of SF6 decomposed componentsare closely related to the type and severity of insulation faults in GIE. However, the recent studies havemainly focused on monitoring the insulation status of AC-GIE using the decomposition characteristicsof SF6 under PD [23–28]. The research focus has not extended to the DC field yet.
Therefore, four artificial models are designed in this study to simulate the common insulationdefects in DC-GIE. These four defect models are placed in the built decomposition device of SF6
under negative DC conditions, respectively, and PD initial voltage is applied 1.2 times on the defect.As a result, SF6 decomposes differently under the four defects, and the decomposed components arequantitatively detected by the gas chromatography/mass spectrometry (GC/MS) detection method.The decomposition characteristics of SF6 under four types of negative DC partial discharge (DC-PD)are obtained. The relationship between the decomposition characteristics of SF6 and the PD typeswas further studied. Moreover, back propagation (BP) neural network algorithm [29–38] is used torecognize the PD types. Then, the best characteristic quantity for PD recognition is extracted. Thisstudy lays a solid foundation of using GCA method to diagnose the insulation faults in DC-GIE andassess its insulation status.
2. Experiment
2.1. Experimental Wiring
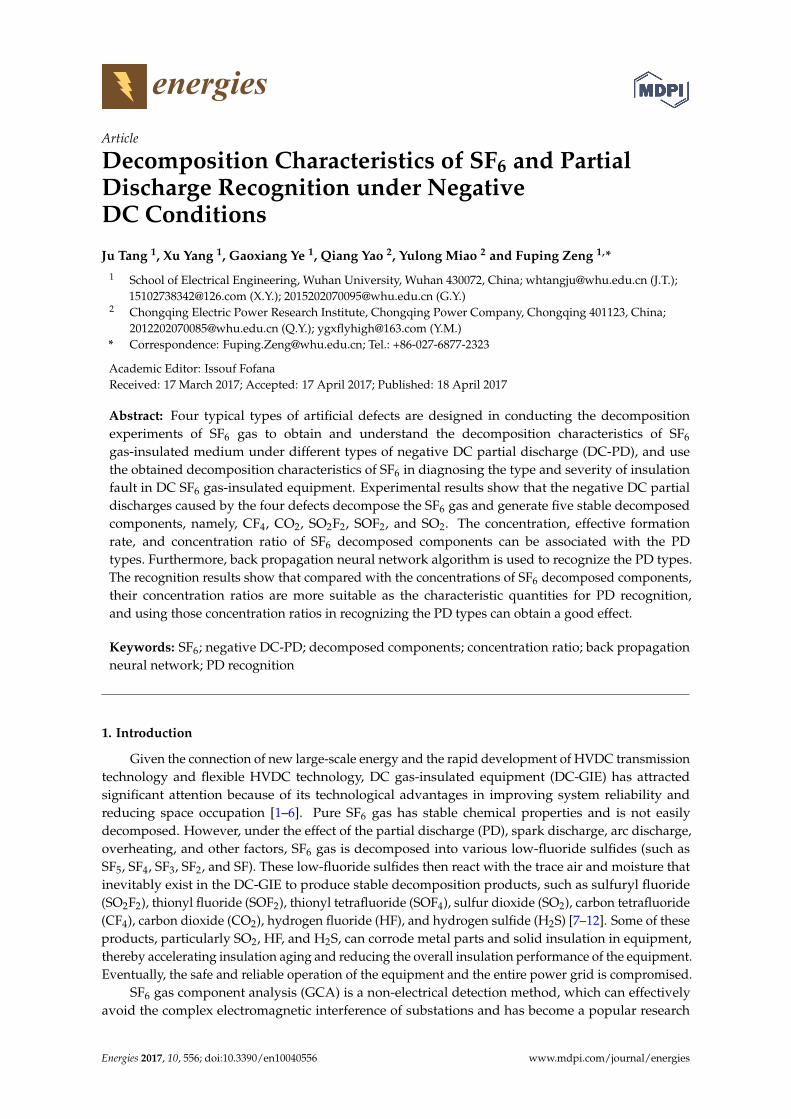
The experimental wiring of SF6 decomposition under negative DC-PD is illustrated in Figure 1.A voltage regulator (T1: 0–380 V) and a testing transformer (T2: 50 kVA/100 kV) provide the AC highvoltage (AC-HV). The AC-HV is converted into DC testing voltage by using a half-wave rectifier circuit,which comprises a HV silicon stack (Ds: 100 kV/5 A) and a filter capacitor (Cf: 0.2 µF). Two protectiveresistors (R1: 20 kΩ, R2: 20 kΩ) are used to protect the system. A capacitive voltage divider (Cv) isused to measure the value of AC output voltage of the transformer, and a resistive voltage divider(Rv) is employed to measure the value of DC testing voltage applied across the defect. A couplingcapacitor (Ck: 500 pF/100 kV) is used to extract the pulse voltage. A non-inductive detection impedance(Zm: 50 Ω) is used to send the pulse current signal to the digital storage oscilloscope (DSO). The DSO(WavePro 7100XL, New York, USA, analogue band: 1 GHz, sampling rate: 20 GHz, memory depth:48 MB) is used to monitor the PD magnitude. The structure of the gas chamber is shown in Figure 2,and its volume is 60 L. A GC/MS (Shimadzu QP-2010Ultra, Kyoto, Japan, precision: 0.01 ppm,accuracy: ±10%) is used to measure the sample gas components quantitatively. The GC/MS uses He(purity: 99.9995%) as the carrier gas and deploys the special capillary column CP-Sil5CB (Shimadzu,Kyoto, Japan) to separate different components.
Energies 2017, 10, 556 2 of 16
topic in recent years [13–16]. In [17–19], the SF6 decomposed products under arc, spark, and corona discharges were studied. Tang et al. compared and analyzed the decomposition characteristics of SF6 under two types of common PDs [20], and recognized four typical PD types [21,22]. A large number of studies have shown that the type, concentration, and formation law of SF6 decomposed components are closely related to the type and severity of insulation faults in GIE. However, the recent studies have mainly focused on monitoring the insulation status of AC-GIE using the decomposition characteristics of SF6 under PD [23–28]. The research focus has not extended to the DC field yet.
Therefore, four artificial models are designed in this study to simulate the common insulation defects in DC-GIE. These four defect models are placed in the built decomposition device of SF6 under negative DC conditions, respectively, and PD initial voltage is applied 1.2 times on the defect. As a result, SF6 decomposes differently under the four defects, and the decomposed components are quantitatively detected by the gas chromatography/mass spectrometry (GC/MS) detection method. The decomposition characteristics of SF6 under four types of negative DC partial discharge (DC-PD) are obtained. The relationship between the decomposition characteristics of SF6 and the PD types was further studied. Moreover, back propagation (BP) neural network algorithm [29–38] is used to recognize the PD types. Then, the best characteristic quantity for PD recognition is extracted. This study lays a solid foundation of using GCA method to diagnose the insulation faults in DC-GIE and assess its insulation status.
2. Experiment
2.1. Experimental Wiring
The experimental wiring of SF6 decomposition under negative DC-PD is illustrated in Figure 1. A voltage regulator (T1: 0–380 V) and a testing transformer (T2: 50 kVA/100 kV) provide the AC high voltage (AC-HV). The AC-HV is converted into DC testing voltage by using a half-wave rectifier circuit, which comprises a HV silicon stack (Ds: 100 kV/5 A) and a filter capacitor (Cf: 0.2 μF). Two protective resistors (R1: 20 kΩ, R2: 20 kΩ) are used to protect the system. A capacitive voltage divider (Cv) is used to measure the value of AC output voltage of the transformer, and a resistive voltage divider (Rv) is employed to measure the value of DC testing voltage applied across the defect. A coupling capacitor (Ck: 500 pF/100 kV) is used to extract the pulse voltage. A non-inductive detection impedance (Zm: 50 Ω) is used to send the pulse current signal to the digital storage oscilloscope (DSO). The DSO (WavePro 7100XL, New York, USA, analogue band: 1 GHz, sampling rate: 20 GHz, memory depth: 48 MB) is used to monitor the PD magnitude. The structure of the gas chamber is shown in Figure 2, and its volume is 60 L. A GC/MS (Shimadzu QP-2010Ultra, Kyoto, Japan, precision: 0.01 ppm, accuracy: ±10%) is used to measure the sample gas components quantitatively. The GC/MS uses He (purity: 99.9995%) as the carrier gas and deploys the special capillary column CP-Sil5CB (Shimadzu, Kyoto, Japan) to separate different components.
V 650 700 750 800 850
0
20
40
60
80
100
Vol
tage
Sample PointT1 VT2
CV
R1 R2Ds
Cf
RV
GC/MS
Zm
DSOGas chamber
Defect model
Ck
Figure 1. Experimental wiring of SF6 decomposition under negative DC-PD. Figure 1. Experimental wiring of SF6 decomposition under negative DC-PD.
Energies 2017, 10, 556 3 of 16Energies 2017, 10, 556 3 of 16
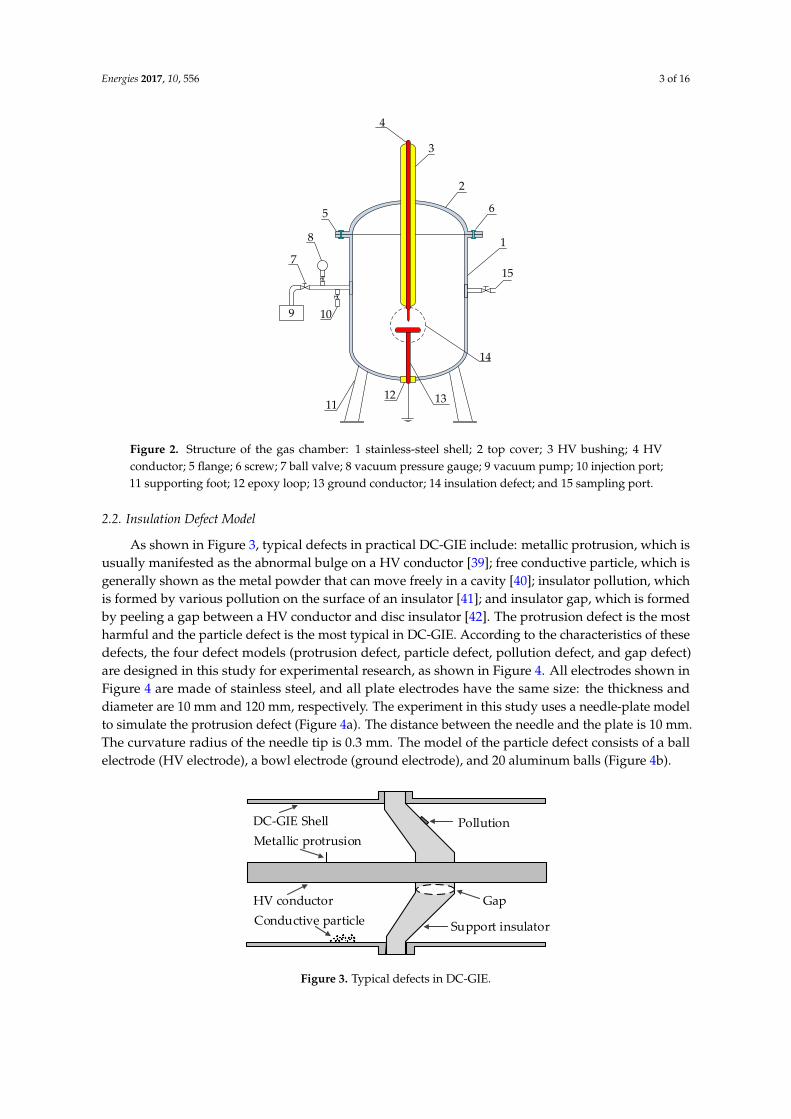
As shown in Figure 3, typical defects in practical DC-GIE include: metallic protrusion, which is usually manifested as the abnormal bulge on a HV conductor [39]; free conductive particle, which is generally shown as the metal powder that can move freely in a cavity [40]; insulator pollution, which is formed by various pollution on the surface of an insulator [41]; and insulator gap, which is formed by peeling a gap between a HV conductor and disc insulator [42]. The protrusion defect is the most harmful and the particle defect is the most typical in DC-GIE. According to the characteristics of these defects, the four defect models (protrusion defect, particle defect, pollution defect, and gap defect) are designed in this study for experimental research, as shown in Figure 4. All electrodes shown in Figure 4 are made of stainless steel, and all plate electrodes have the same size: the thickness and diameter are 10 mm and 120 mm, respectively. The experiment in this study uses a needle-plate model to simulate the protrusion defect (Figure 4a). The distance between the needle and the plate is 10 mm. The curvature radius of the needle tip is 0.3 mm. The model of the particle defect consists of a ball electrode (HV electrode), a bowl electrode (ground electrode), and 20 aluminum balls (Figure 4b).
DC-GIE Shell PollutionMetallic protrusion
HV conductorConductive particle
Gap
Support insulator
Figure 3. Typical defects in DC-GIE.
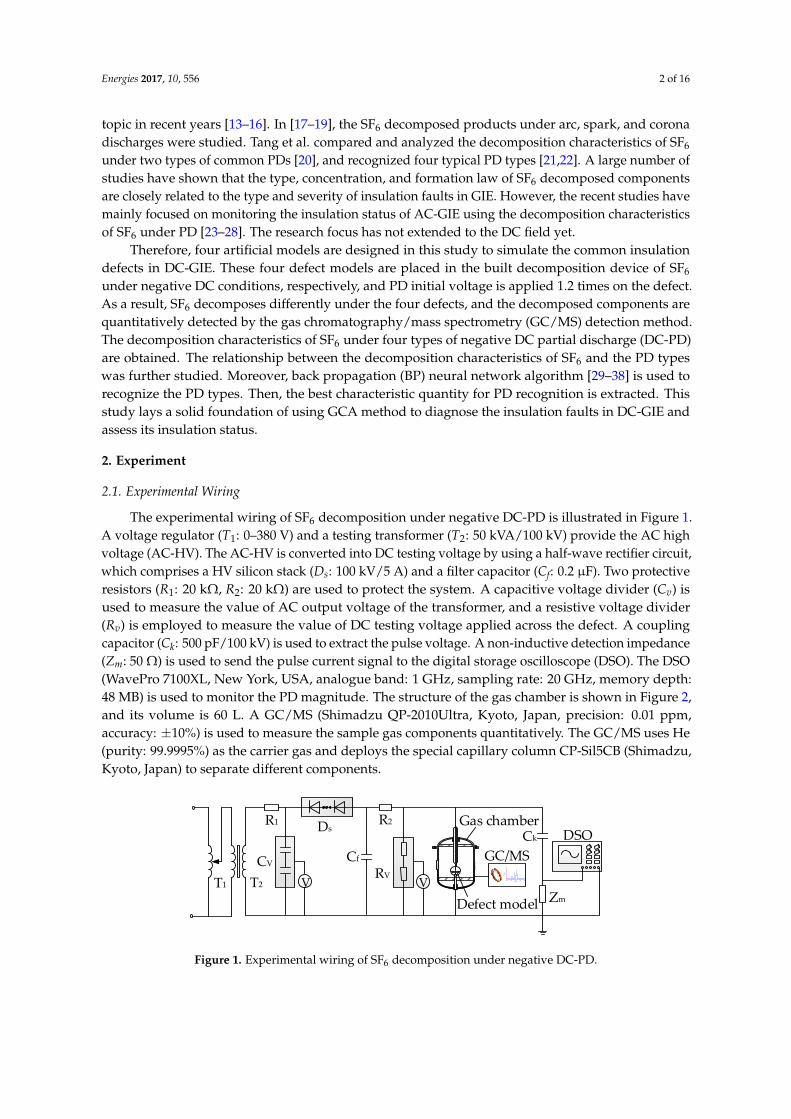
Figure 2. Structure of the gas chamber: 1 stainless-steel shell; 2 top cover; 3 HV bushing; 4 HVconductor; 5 flange; 6 screw; 7 ball valve; 8 vacuum pressure gauge; 9 vacuum pump; 10 injection port;11 supporting foot; 12 epoxy loop; 13 ground conductor; 14 insulation defect; and 15 sampling port.
2.2. Insulation Defect Model
As shown in Figure 3, typical defects in practical DC-GIE include: metallic protrusion, which isusually manifested as the abnormal bulge on a HV conductor [39]; free conductive particle, which isgenerally shown as the metal powder that can move freely in a cavity [40]; insulator pollution, whichis formed by various pollution on the surface of an insulator [41]; and insulator gap, which is formedby peeling a gap between a HV conductor and disc insulator [42]. The protrusion defect is the mostharmful and the particle defect is the most typical in DC-GIE. According to the characteristics of thesedefects, the four defect models (protrusion defect, particle defect, pollution defect, and gap defect)are designed in this study for experimental research, as shown in Figure 4. All electrodes shown inFigure 4 are made of stainless steel, and all plate electrodes have the same size: the thickness anddiameter are 10 mm and 120 mm, respectively. The experiment in this study uses a needle-plate modelto simulate the protrusion defect (Figure 4a). The distance between the needle and the plate is 10 mm.The curvature radius of the needle tip is 0.3 mm. The model of the particle defect consists of a ballelectrode (HV electrode), a bowl electrode (ground electrode), and 20 aluminum balls (Figure 4b).
As shown in Figure 3, typical defects in practical DC-GIE include: metallic protrusion, which is usually manifested as the abnormal bulge on a HV conductor [39]; free conductive particle, which is generally shown as the metal powder that can move freely in a cavity [40]; insulator pollution, which is formed by various pollution on the surface of an insulator [41]; and insulator gap, which is formed by peeling a gap between a HV conductor and disc insulator [42]. The protrusion defect is the most harmful and the particle defect is the most typical in DC-GIE. According to the characteristics of these defects, the four defect models (protrusion defect, particle defect, pollution defect, and gap defect) are designed in this study for experimental research, as shown in Figure 4. All electrodes shown in Figure 4 are made of stainless steel, and all plate electrodes have the same size: the thickness and diameter are 10 mm and 120 mm, respectively. The experiment in this study uses a needle-plate model to simulate the protrusion defect (Figure 4a). The distance between the needle and the plate is 10 mm. The curvature radius of the needle tip is 0.3 mm. The model of the particle defect consists of a ball electrode (HV electrode), a bowl electrode (ground electrode), and 20 aluminum balls (Figure 4b).
DC-GIE Shell PollutionMetallic protrusion
HV conductorConductive particle
Gap
Support insulator
Figure 3. Typical defects in DC-GIE. Figure 3. Typical defects in DC-GIE.
Energies 2017, 10, 556 4 of 16Energies 2017, 10, 556 4 of 16
10
Φ120
HV electrode
Ground electrode
Radius of curvature
0.3mm52010
30
10
Φ10
Φ4
Φ90
HV electrode
Ground electrode
Aluminium ball
Φ50
25
Diameter 100mm,
thickness 1.5mm
(a) (b)
Φ120
HV electrode
Ground electrode
Copper cuttings
20
Φ80
Epoxy
25
10
42
Φ120
2
50
Ground electrode
HV electrode
Φ80 Epoxy Gap
10
(c) (d)
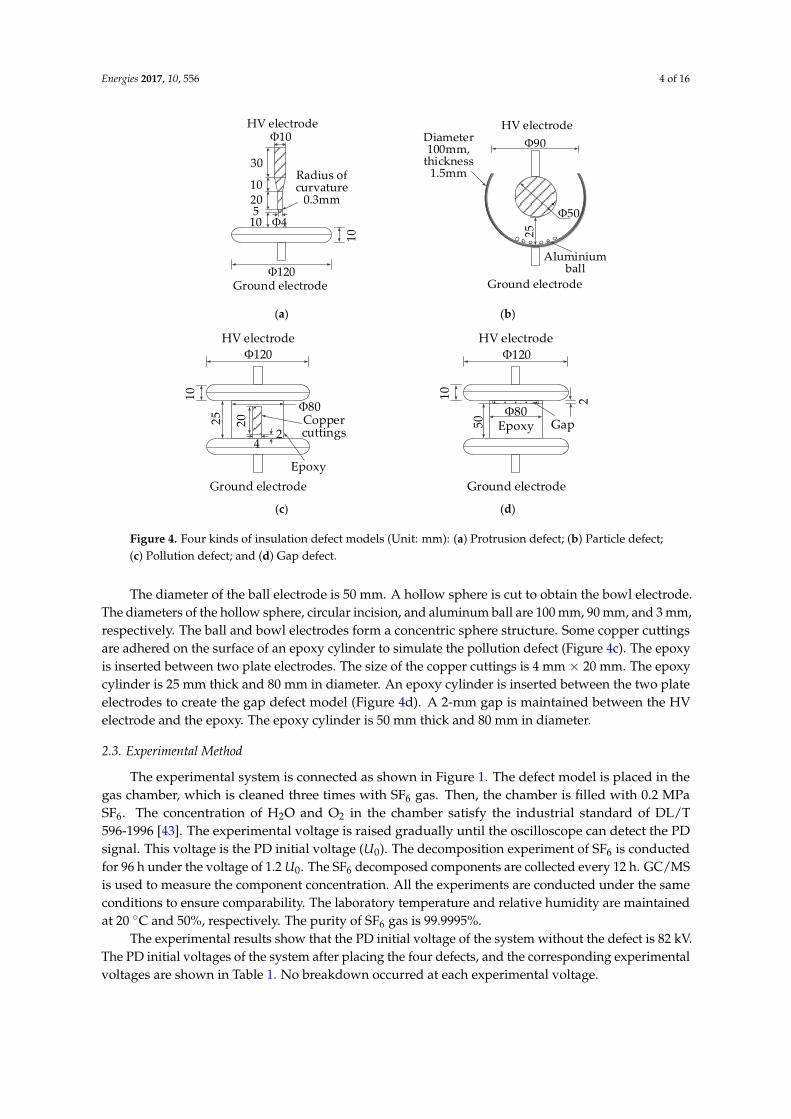
Figure 4. Four kinds of insulation defect models (Unit: mm): (a) Protrusion defect; (b) Particle defect;
(c) Pollution defect; and (d) Gap defect.
The diameter of the ball electrode is 50 mm. A hollow sphere is cut to obtain the bowl electrode.
The diameters of the hollow sphere, circular incision, and aluminum ball are 100 mm, 90 mm, and 3
mm, respectively. The ball and bowl electrodes form a concentric sphere structure. Some copper
cuttings are adhered on the surface of an epoxy cylinder to simulate the pollution defect (Figure 4c).
The epoxy is inserted between two plate electrodes. The size of the copper cuttings is 4 mm × 20 mm.
The epoxy cylinder is 25 mm thick and 80 mm in diameter. An epoxy cylinder is inserted between
the two plate electrodes to create the gap defect model (Figure 4d). A 2-mm gap is maintained
between the HV electrode and the epoxy. The epoxy cylinder is 50 mm thick and 80 mm in diameter.
2.3. Experimental Method
The experimental system is connected as shown in Figure 1. The defect model is placed in the
gas chamber, which is cleaned three times with SF6 gas. Then, the chamber is filled with 0.2 MPa SF6.
The concentration of H2O and O2 in the chamber satisfy the industrial standard of DL/T 596-1996 [43].
The experimental voltage is raised gradually until the oscilloscope can detect the PD signal. This
voltage is the PD initial voltage (U0). The decomposition experiment of SF6 is conducted for 96 h
under the voltage of 1.2 U0. The SF6 decomposed components are collected every 12 h. GC/MS is used
to measure the component concentration. All the experiments are conducted under the same
conditions to ensure comparability. The laboratory temperature and relative humidity are
maintained at 20 °C and 50%, respectively. The purity of SF6 gas is 99.9995%.
The experimental results show that the PD initial voltage of the system without the defect is
82 kV. The PD initial voltages of the system after placing the four defects, and the corresponding
experimental voltages are shown in Table 1. No breakdown occurred at each experimental voltage.
Figure 4. Four kinds of insulation defect models (Unit: mm): (a) Protrusion defect; (b) Particle defect;(c) Pollution defect; and (d) Gap defect.
The diameter of the ball electrode is 50 mm. A hollow sphere is cut to obtain the bowl electrode.The diameters of the hollow sphere, circular incision, and aluminum ball are 100 mm, 90 mm, and 3 mm,respectively. The ball and bowl electrodes form a concentric sphere structure. Some copper cuttingsare adhered on the surface of an epoxy cylinder to simulate the pollution defect (Figure 4c). The epoxyis inserted between two plate electrodes. The size of the copper cuttings is 4 mm × 20 mm. The epoxycylinder is 25 mm thick and 80 mm in diameter. An epoxy cylinder is inserted between the two plateelectrodes to create the gap defect model (Figure 4d). A 2-mm gap is maintained between the HVelectrode and the epoxy. The epoxy cylinder is 50 mm thick and 80 mm in diameter.
2.3. Experimental Method
The experimental system is connected as shown in Figure 1. The defect model is placed in thegas chamber, which is cleaned three times with SF6 gas. Then, the chamber is filled with 0.2 MPaSF6. The concentration of H2O and O2 in the chamber satisfy the industrial standard of DL/T596-1996 [43]. The experimental voltage is raised gradually until the oscilloscope can detect the PDsignal. This voltage is the PD initial voltage (U0). The decomposition experiment of SF6 is conductedfor 96 h under the voltage of 1.2 U0. The SF6 decomposed components are collected every 12 h. GC/MSis used to measure the component concentration. All the experiments are conducted under the sameconditions to ensure comparability. The laboratory temperature and relative humidity are maintainedat 20 C and 50%, respectively. The purity of SF6 gas is 99.9995%.
The experimental results show that the PD initial voltage of the system without the defect is 82 kV.The PD initial voltages of the system after placing the four defects, and the corresponding experimentalvoltages are shown in Table 1. No breakdown occurred at each experimental voltage.
Energies 2017, 10, 556 5 of 16
Table 1. Experimental voltages under four kinds of defects.
PD has a cumulative effect on SF6 decomposition. That is, PD repetition rate (N, unit: pulse/s),the average discharge magnitude of a single pulse (Qavg, unit: pC/pulse), and the average dischargemagnitude in a second (Qsec, unit: pC/s) affect the SF6 decomposition. A certain relationship existsamong these three parameters (N, Qavg, and Qsec), as shown in Equation (1). The measurements of N,Qavg, and Qsec under the four defects are shown in Table 2. This experiment uses a 50 Ω non-inductiveresistor pulse detection unit to monitor the PD waveforms. A PD calibration circuit is used to calibratethe PD magnitude, as recommended by IEC 60270:2000 [44]:
Qsec = Qavg × N (1)
Table 2. N, Qavg, and Qsec of PD caused by four kinds of defects.
Defect Type N (pulse/s) Qavg (pC/pulse) Qsec (pC/s)
Table 2 shows that the PD characteristics under the four defects are significantly different. Underthe protrusion defect, Qavg is the smallest, N and Qsec are the largest, and discharge is the most stable.In this study, the aluminum balls are selected as the metal particles that can move freely. The aluminumballs easily jump under the influence of an electric field. After the aluminum balls fall, they slide to thebottom of the bowl electrode. These balls have a concentrated distribution while moving. Therefore,the PD under the particle defect is stable. Moreover, the PD has the second largest N, Qavg, and Qsec
under the particle defect compared with those under the other three defects. Under the pollutiondefect, Qavg and Qsec are small, and N is slightly smaller than that under the particle defect. Under thesame experimental conditions, the gap defect has the most difficulty in producing PD, under this defect,Qavg is the largest, N and Qsec are the smallest, and discharge has a large dispersion. In summary,the N, Qavg, and Qsec under the four defects are significantly different, which is the basic reason forthe difference in the SF6 decomposition. This result provides a possibility to study and establish thecorresponding relationship between the decomposition characteristics of SF6 and the defect types.
3.2. Concentrations of SF6 Decomposed Components
Experimental results show that the negative DC partial discharges caused by the four defectsdecompose SF6 gas and generate five stable decomposed components, namely, CF4, CO2, SO2F2,SOF2, and SO2. The relationship between these five decomposed components and the defect types isinvestigated in this study.
Energies 2017, 10, 556 6 of 16
3.2.1. Concentrations of CF4 and CO2
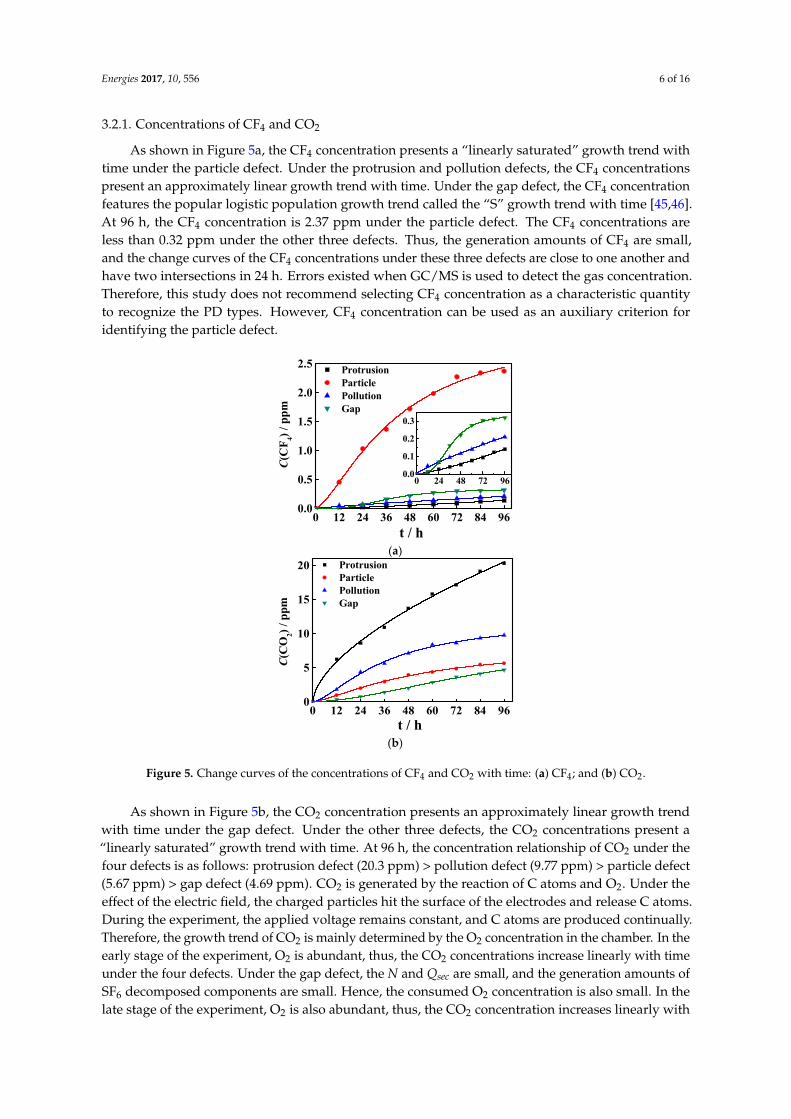
As shown in Figure 5a, the CF4 concentration presents a “linearly saturated” growth trend withtime under the particle defect. Under the protrusion and pollution defects, the CF4 concentrationspresent an approximately linear growth trend with time. Under the gap defect, the CF4 concentrationfeatures the popular logistic population growth trend called the “S” growth trend with time [45,46].At 96 h, the CF4 concentration is 2.37 ppm under the particle defect. The CF4 concentrations areless than 0.32 ppm under the other three defects. Thus, the generation amounts of CF4 are small,and the change curves of the CF4 concentrations under these three defects are close to one another andhave two intersections in 24 h. Errors existed when GC/MS is used to detect the gas concentration.Therefore, this study does not recommend selecting CF4 concentration as a characteristic quantityto recognize the PD types. However, CF4 concentration can be used as an auxiliary criterion foridentifying the particle defect.
Energies 2017, 10, 556 6 of 16
features the popular logistic population growth trend called the “S” growth trend with time [45,46]. At 96 h, the CF4 concentration is 2.37 ppm under the particle defect. The CF4 concentrations are less than 0.32 ppm under the other three defects. Thus, the generation amounts of CF4 are small, and the change curves of the CF4 concentrations under these three defects are close to one another and have two intersections in 24 h. Errors existed when GC/MS is used to detect the gas concentration. Therefore, this study does not recommend selecting CF4 concentration as a characteristic quantity to recognize the PD types. However, CF4 concentration can be used as an auxiliary criterion for identifying the particle defect.
0 12 24 36 48 60 72 84 960.0
0.5
1.0
1.5
2.0
2.5
0 24 48 72 960.0
0.1
0.2
0.3
Protrusion Particle Pollution Gap
C(C
F 4) / p
pm
t / h
(a)
0 12 24 36 48 60 72 84 960
5
10
15
20 Protrusion Particle Pollution Gap
C(C
O2) /
ppm
t / h(b)
Figure 5. Change curves of the concentrations of CF4 and CO2 with time: (a) CF4; and (b) CO2.
As shown in Figure 5b, the CO2 concentration presents an approximately linear growth trend with time under the gap defect. Under the other three defects, the CO2 concentrations present a “linearly saturated” growth trend with time. At 96 h, the concentration relationship of CO2 under the four defects is as follows: protrusion defect (20.3 ppm) > pollution defect (9.77 ppm) > particle defect (5.67 ppm) > gap defect (4.69 ppm). CO2 is generated by the reaction of C atoms and O2. Under the effect of the electric field, the charged particles hit the surface of the electrodes and release C atoms. During the experiment, the applied voltage remains constant, and C atoms are produced continually. Therefore, the growth trend of CO2 is mainly determined by the O2 concentration in the chamber. In the early stage of the experiment, O2 is abundant, thus, the CO2 concentrations increase linearly with time under the four defects. Under the gap defect, the N and Qsec are small, and the generation amounts of SF6 decomposed components are small. Hence, the consumed O2 concentration is also small. In the late stage of the experiment, O2 is also abundant, thus, the CO2 concentration increases linearly with time under the gap defect. Compared with those under the gap defect, the generation amounts of SF6 decomposed components under the other three defects are significantly larger, thus, the consumed O2 concentrations are also remarkably larger. In the late stage of the experiment, the remaining small amount of O2 inhibits the CO2 formation to some extent, thus, the CO2 concentrations present a saturated growth trend with time under the other three defects. According to the growth
Figure 5. Change curves of the concentrations of CF4 and CO2 with time: (a) CF4; and (b) CO2.
As shown in Figure 5b, the CO2 concentration presents an approximately linear growth trendwith time under the gap defect. Under the other three defects, the CO2 concentrations present a“linearly saturated” growth trend with time. At 96 h, the concentration relationship of CO2 under thefour defects is as follows: protrusion defect (20.3 ppm) > pollution defect (9.77 ppm) > particle defect(5.67 ppm) > gap defect (4.69 ppm). CO2 is generated by the reaction of C atoms and O2. Under theeffect of the electric field, the charged particles hit the surface of the electrodes and release C atoms.During the experiment, the applied voltage remains constant, and C atoms are produced continually.Therefore, the growth trend of CO2 is mainly determined by the O2 concentration in the chamber. In theearly stage of the experiment, O2 is abundant, thus, the CO2 concentrations increase linearly with timeunder the four defects. Under the gap defect, the N and Qsec are small, and the generation amounts ofSF6 decomposed components are small. Hence, the consumed O2 concentration is also small. In thelate stage of the experiment, O2 is also abundant, thus, the CO2 concentration increases linearly with
Energies 2017, 10, 556 7 of 16
time under the gap defect. Compared with those under the gap defect, the generation amounts of SF6
decomposed components under the other three defects are significantly larger, thus, the consumedO2 concentrations are also remarkably larger. In the late stage of the experiment, the remaining smallamount of O2 inhibits the CO2 formation to some extent, thus, the CO2 concentrations present asaturated growth trend with time under the other three defects. According to the growth trend and thevalue of CO2 concentration, the four defects can be distinguished from one another. Therefore, CO2
concentration can be selected as a characteristic quantity to recognize the PD types.
3.2.2. Concentrations of SO2F2, SOF2, and SO2
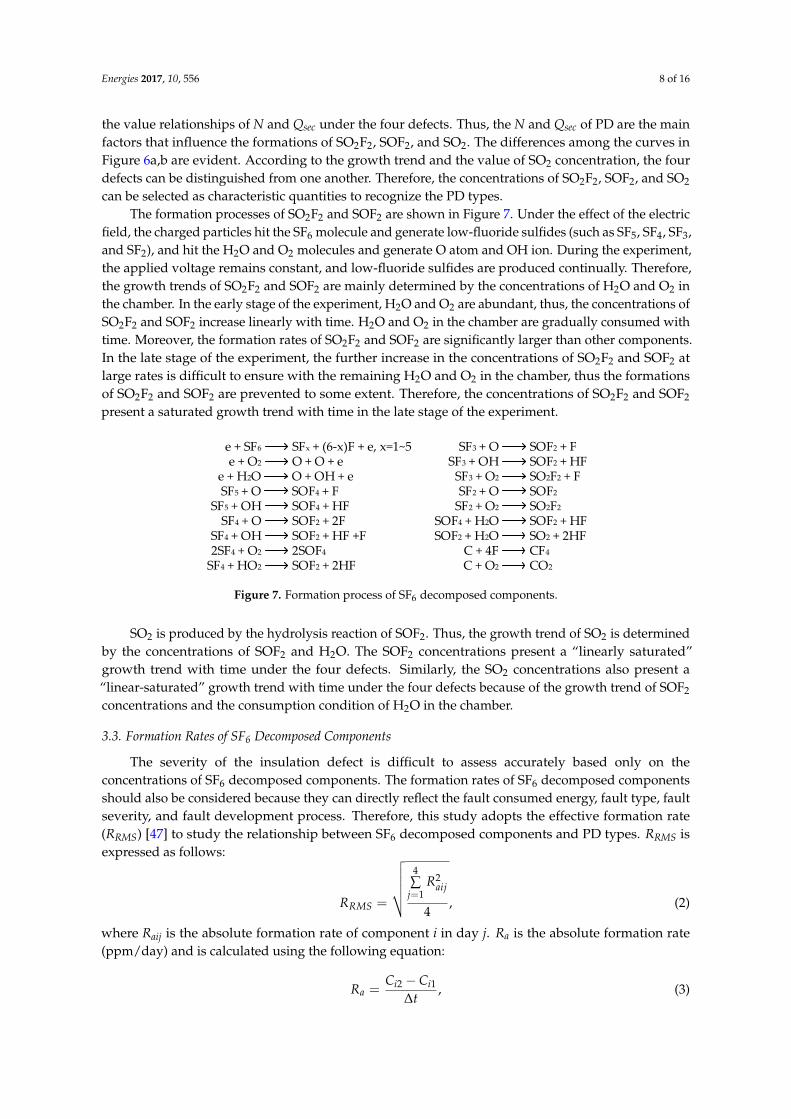
Under the four defects, the concentrations of SO2F2, SOF2, and SO2 approximately present a“linearly saturated” growth trend with time (Figure 6).
Energies 2017, 10, 556 7 of 16
trend and the value of CO2 concentration, the four defects can be distinguished from one another. Therefore, CO2 concentration can be selected as a characteristic quantity to recognize the PD types.
3.2.2. Concentrations of SO2F2, SOF2, and SO2
Under the four defects, the concentrations of SO2F2, SOF2, and SO2 approximately present a “linearly saturated” growth trend with time (Figure 6).
0 12 24 36 48 60 72 84 960
15
30
45
60
75
0 24 48 72 960
2
4
6
Protrusion Particle Pollution Gap
C(SO
2F 2) / p
pm
t / h
(a)
0 12 24 36 48 60 72 84 960
50
100
150
200
250
300
0 24 48 72 960
102030
Protrusion Particle Pollution Gap
C(SO
F 2) / p
pm
t / h
(b)
0 12 24 36 48 60 72 84 960
1
2
3
4
5
6 Protrusion Particle Pollution Gap
C(SO
2) / p
pm
t / h(c)
Figure 6. Change curves of the concentrations of SO2F2, SOF2, and SO2 with time: (a) SO2F2; (b) SO2F2; and (c) SO2.
The concentration relationships of SO2F2, SOF2, and SO2 under the four defects are the same, namely, protrusion defect > particle defect > pollution defect > gap defect, which are consistent with the value relationships of N and Qsec under the four defects. Thus, the N and Qsec of PD are the main factors that influence the formations of SO2F2, SOF2, and SO2. The differences among the curves in Figure 6a,b are evident. According to the growth trend and the value of SO2 concentration, the four
Figure 6. Change curves of the concentrations of SO2F2, SOF2, and SO2 with time: (a) SO2F2; (b) SO2F2;and (c) SO2.
The concentration relationships of SO2F2, SOF2, and SO2 under the four defects are the same,namely, protrusion defect > particle defect > pollution defect > gap defect, which are consistent with
Energies 2017, 10, 556 8 of 16
the value relationships of N and Qsec under the four defects. Thus, the N and Qsec of PD are the mainfactors that influence the formations of SO2F2, SOF2, and SO2. The differences among the curves inFigure 6a,b are evident. According to the growth trend and the value of SO2 concentration, the fourdefects can be distinguished from one another. Therefore, the concentrations of SO2F2, SOF2, and SO2
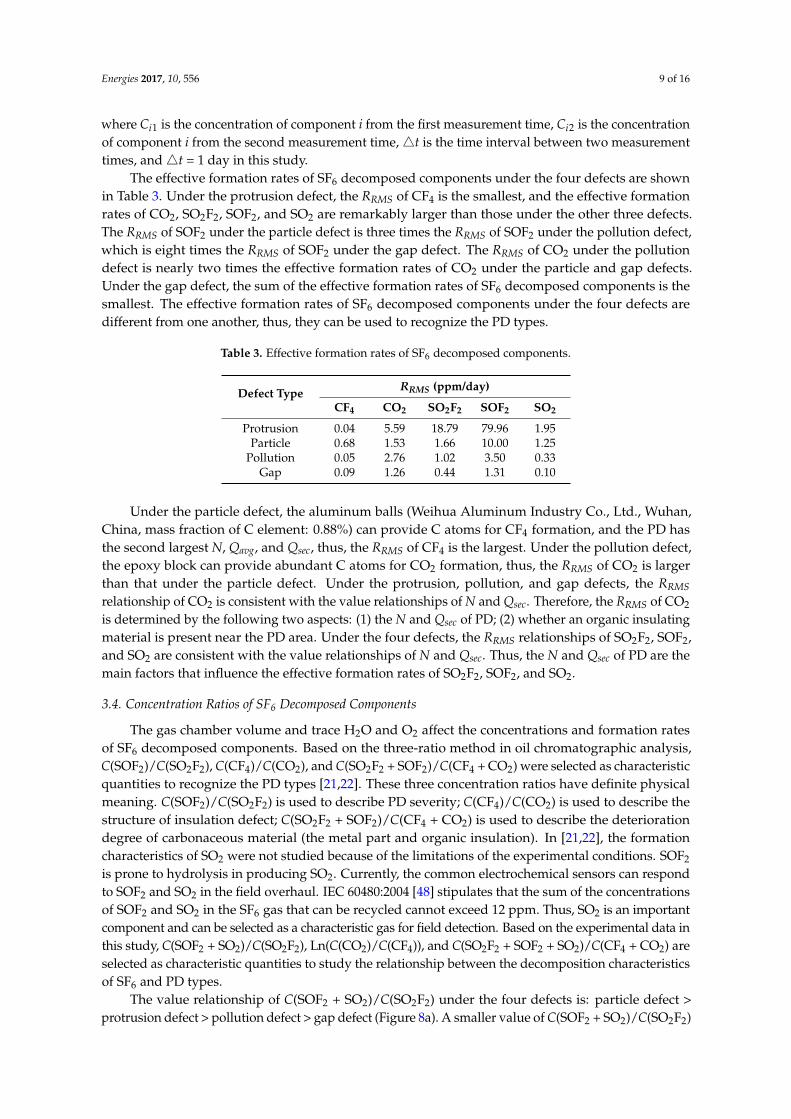
can be selected as characteristic quantities to recognize the PD types.The formation processes of SO2F2 and SOF2 are shown in Figure 7. Under the effect of the electric
field, the charged particles hit the SF6 molecule and generate low-fluoride sulfides (such as SF5, SF4, SF3,and SF2), and hit the H2O and O2 molecules and generate O atom and OH ion. During the experiment,the applied voltage remains constant, and low-fluoride sulfides are produced continually. Therefore,the growth trends of SO2F2 and SOF2 are mainly determined by the concentrations of H2O and O2 inthe chamber. In the early stage of the experiment, H2O and O2 are abundant, thus, the concentrations ofSO2F2 and SOF2 increase linearly with time. H2O and O2 in the chamber are gradually consumed withtime. Moreover, the formation rates of SO2F2 and SOF2 are significantly larger than other components.In the late stage of the experiment, the further increase in the concentrations of SO2F2 and SOF2 atlarge rates is difficult to ensure with the remaining H2O and O2 in the chamber, thus the formationsof SO2F2 and SOF2 are prevented to some extent. Therefore, the concentrations of SO2F2 and SOF2
present a saturated growth trend with time in the late stage of the experiment.
Energies 2017, 10, 556 8 of 16
defects can be distinguished from one another. Therefore, the concentrations of SO2F2, SOF2, and SO2 can be selected as characteristic quantities to recognize the PD types.
The formation processes of SO2F2 and SOF2 are shown in Figure 7. Under the effect of the electric field, the charged particles hit the SF6 molecule and generate low-fluoride sulfides (such as SF5, SF4, SF3, and SF2), and hit the H2O and O2 molecules and generate O atom and OH ion. During the experiment, the applied voltage remains constant, and low-fluoride sulfides are produced continually. Therefore, the growth trends of SO2F2 and SOF2 are mainly determined by the concentrations of H2O and O2 in the chamber. In the early stage of the experiment, H2O and O2 are abundant, thus, the concentrations of SO2F2 and SOF2 increase linearly with time. H2O and O2 in the chamber are gradually consumed with time. Moreover, the formation rates of SO2F2 and SOF2 are significantly larger than other components. In the late stage of the experiment, the further increase in the concentrations of SO2F2 and SOF2 at large rates is difficult to ensure with the remaining H2O and O2 in the chamber, thus the formations of SO2F2 and SOF2 are prevented to some extent. Therefore, the concentrations of SO2F2 and SOF2 present a saturated growth trend with time in the late stage of the experiment.
Figure 7. Formation process of SF6 decomposed components.
SO2 is produced by the hydrolysis reaction of SOF2. Thus, the growth trend of SO2 is determined by the concentrations of SOF2 and H2O. The SOF2 concentrations present a “linearly saturated” growth trend with time under the four defects. Similarly, the SO2 concentrations also present a “linear-saturated” growth trend with time under the four defects because of the growth trend of SOF2 concentrations and the consumption condition of H2O in the chamber.
3.3. Formation Rates of SF6 Decomposed Components
The severity of the insulation defect is difficult to assess accurately based only on the concentrations of SF6 decomposed components. The formation rates of SF6 decomposed components should also be considered because they can directly reflect the fault consumed energy, fault type, fault severity, and fault development process. Therefore, this study adopts the effective formation rate (RRMS) [47] to study the relationship between SF6 decomposed components and PD types. RRMS is expressed as follows:
aij
RMSR
42
j=1R
=4
, (2)
where Raij is the absolute formation rate of component i in day j. Ra is the absolute formation rate (ppm/day) and is calculated using the following equation:
2 1
Δi i
aC C
R-=t
, (3)
where Ci1 is the concentration of component i from the first measurement time, Ci2 is the concentration of component i from the second measurement time, t is the time interval between two measurement times, and t = 1 day in this study.
Figure 7. Formation process of SF6 decomposed components.
SO2 is produced by the hydrolysis reaction of SOF2. Thus, the growth trend of SO2 is determinedby the concentrations of SOF2 and H2O. The SOF2 concentrations present a “linearly saturated”growth trend with time under the four defects. Similarly, the SO2 concentrations also present a“linear-saturated” growth trend with time under the four defects because of the growth trend of SOF2
concentrations and the consumption condition of H2O in the chamber.
3.3. Formation Rates of SF6 Decomposed Components
The severity of the insulation defect is difficult to assess accurately based only on theconcentrations of SF6 decomposed components. The formation rates of SF6 decomposed componentsshould also be considered because they can directly reflect the fault consumed energy, fault type, faultseverity, and fault development process. Therefore, this study adopts the effective formation rate(RRMS) [47] to study the relationship between SF6 decomposed components and PD types. RRMS isexpressed as follows:
RRMS =
√√√√√ 4∑
j=1R2
aij
4, (2)
where Raij is the absolute formation rate of component i in day j. Ra is the absolute formation rate(ppm/day) and is calculated using the following equation:
Ra =Ci2 − Ci1
∆t, (3)
Energies 2017, 10, 556 9 of 16
where Ci1 is the concentration of component i from the first measurement time, Ci2 is the concentrationof component i from the second measurement time,4t is the time interval between two measurementtimes, and4t = 1 day in this study.
The effective formation rates of SF6 decomposed components under the four defects are shownin Table 3. Under the protrusion defect, the RRMS of CF4 is the smallest, and the effective formationrates of CO2, SO2F2, SOF2, and SO2 are remarkably larger than those under the other three defects.The RRMS of SOF2 under the particle defect is three times the RRMS of SOF2 under the pollution defect,which is eight times the RRMS of SOF2 under the gap defect. The RRMS of CO2 under the pollutiondefect is nearly two times the effective formation rates of CO2 under the particle and gap defects.Under the gap defect, the sum of the effective formation rates of SF6 decomposed components is thesmallest. The effective formation rates of SF6 decomposed components under the four defects aredifferent from one another, thus, they can be used to recognize the PD types.
Table 3. Effective formation rates of SF6 decomposed components.
Under the particle defect, the aluminum balls (Weihua Aluminum Industry Co., Ltd., Wuhan,China, mass fraction of C element: 0.88%) can provide C atoms for CF4 formation, and the PD hasthe second largest N, Qavg, and Qsec, thus, the RRMS of CF4 is the largest. Under the pollution defect,the epoxy block can provide abundant C atoms for CO2 formation, thus, the RRMS of CO2 is largerthan that under the particle defect. Under the protrusion, pollution, and gap defects, the RRMSrelationship of CO2 is consistent with the value relationships of N and Qsec. Therefore, the RRMS of CO2
is determined by the following two aspects: (1) the N and Qsec of PD; (2) whether an organic insulatingmaterial is present near the PD area. Under the four defects, the RRMS relationships of SO2F2, SOF2,and SO2 are consistent with the value relationships of N and Qsec. Thus, the N and Qsec of PD are themain factors that influence the effective formation rates of SO2F2, SOF2, and SO2.
3.4. Concentration Ratios of SF6 Decomposed Components
The gas chamber volume and trace H2O and O2 affect the concentrations and formation ratesof SF6 decomposed components. Based on the three-ratio method in oil chromatographic analysis,C(SOF2)/C(SO2F2), C(CF4)/C(CO2), and C(SO2F2 + SOF2)/C(CF4 + CO2) were selected as characteristicquantities to recognize the PD types [21,22]. These three concentration ratios have definite physicalmeaning. C(SOF2)/C(SO2F2) is used to describe PD severity; C(CF4)/C(CO2) is used to describe thestructure of insulation defect; C(SO2F2 + SOF2)/C(CF4 + CO2) is used to describe the deteriorationdegree of carbonaceous material (the metal part and organic insulation). In [21,22], the formationcharacteristics of SO2 were not studied because of the limitations of the experimental conditions. SOF2
is prone to hydrolysis in producing SO2. Currently, the common electrochemical sensors can respondto SOF2 and SO2 in the field overhaul. IEC 60480:2004 [48] stipulates that the sum of the concentrationsof SOF2 and SO2 in the SF6 gas that can be recycled cannot exceed 12 ppm. Thus, SO2 is an importantcomponent and can be selected as a characteristic gas for field detection. Based on the experimental data inthis study, C(SOF2 + SO2)/C(SO2F2), Ln(C(CO2)/C(CF4)), and C(SO2F2 + SOF2 + SO2)/C(CF4 + CO2) areselected as characteristic quantities to study the relationship between the decomposition characteristicsof SF6 and PD types.
The value relationship of C(SOF2 + SO2)/C(SO2F2) under the four defects is: particle defect >protrusion defect > pollution defect > gap defect (Figure 8a). A smaller value of C(SOF2 + SO2)/C(SO2F2)
Energies 2017, 10, 556 10 of 16
indicates a larger PD energy and a more serious fault. Therefore, the PD energy under the particledefect is the smallest, and the PD energies under the other three defects are close to one another.The curves in Figure 8b can be easily distinguished from one another, the curves have no intersection,indicating significant differences among the structures of the four defects. Thus, Ln(C(CO2)/C(CF4))can be used to recognize the four defects in this study.Energies 2017, 10, 556 10 of 16
0 12 24 36 48 60 72 84 960
2
4
6
8
10
12 Protrusion Particle Pollution Gap
C(SO
F 2+SO
2)/C(S
O2F 2)
t/h(a)
0 12 24 36 48 60 72 84 960
2
4
6
8 Protrusion Particle Pollution Gap
Ln(C(
CO
2)/C(C
F 4))
t/h
(b)
0 12 24 36 48 60 72 84 960
5
10
15
20
25 Protrusion Particle Pollution Gap
C(SO
F 2+SO
2F 2+SO
2)/C(C
F 4+CO
2)
t/h(c)
Figure 8. Change curves of the concentration ratios of SF6 decomposed components with time: (a) C(SOF2)/C(SO2F2); (b) Ln(C(CO2)/C(CF4)); and (c) C(SOF2 + SO2F2 + SO2)/C(CF4 + CO2).
A smaller value of C(SO2F2 + SOF2 + SO2)/C(CF4 + CO2) indicates a more serious deterioration of the carbonaceous materials. Therefore, the deteriorations of the carbonaceous materials under the pollution and gap defects are the most serious, and that under the protrusion defect is the lightest.
If the concentration ratios of the SF6 decomposed components are to be used in recognizing the PD types in the field fault diagnosis, then the selected ratios cannot present significant fluctuations with time. Even if insulation defects exist in GIE, the concentrations of SF6 decomposed components have been basically stable after a long period of operation, thus, the concentration ratios are unlikely to appear as large fluctuations with time. As shown in Figure 8, the values of C(SOF2 + SO2)/C(SO2F2), Ln(C(CO2)/C(CF4)), and C(SO2F2 + SOF2 + SO2)/C(CF4 + CO2) are basically stable after 36 h. The change curves of C(SO2F2 + SOF2 + SO2)/C(CF4 + CO2) under the pollution and gap defects are close, whereas
Figure 8. Change curves of the concentration ratios of SF6 decomposed components with time:(a) C(SOF2)/C(SO2F2); (b) Ln(C(CO2)/C(CF4)); and (c) C(SOF2 + SO2F2 + SO2)/C(CF4 + CO2).
Energies 2017, 10, 556 11 of 16
A smaller value of C(SO2F2 + SOF2 + SO2)/C(CF4 + CO2) indicates a more serious deteriorationof the carbonaceous materials. Therefore, the deteriorations of the carbonaceous materials under thepollution and gap defects are the most serious, and that under the protrusion defect is the lightest.
If the concentration ratios of the SF6 decomposed components are to be used in recognizing thePD types in the field fault diagnosis, then the selected ratios cannot present significant fluctuationswith time. Even if insulation defects exist in GIE, the concentrations of SF6 decomposed componentshave been basically stable after a long period of operation, thus, the concentration ratios are unlikely toappear as large fluctuations with time. As shown in Figure 8, the values of C(SOF2 + SO2)/C(SO2F2),Ln(C(CO2)/C(CF4)), and C(SO2F2 + SOF2 + SO2)/C(CF4 + CO2) are basically stable after 36 h.The change curves of C(SO2F2 + SOF2 + SO2)/C(CF4 + CO2) under the pollution and gap defectsare close, whereas the other curves can be easily distinguished from one another. Therefore, C(SOF2
+ SO2)/C(SO2F2), Ln(C(CO2)/C(CF4)), and C(SO2F2 + SOF2 + SO2)/C(CF4 + CO2) can be used torecognize the PD types.
4. PD Recognition
This study uses the back propagation (BP) neural network algorithm [29–38] to recognize the PDtypes. The concentrations and concentration ratios of SF6 decomposed components are selected asthe input matrix of the network. Then the recognition results are analyzed, and the best characteristicquantity for PD recognition is extracted.
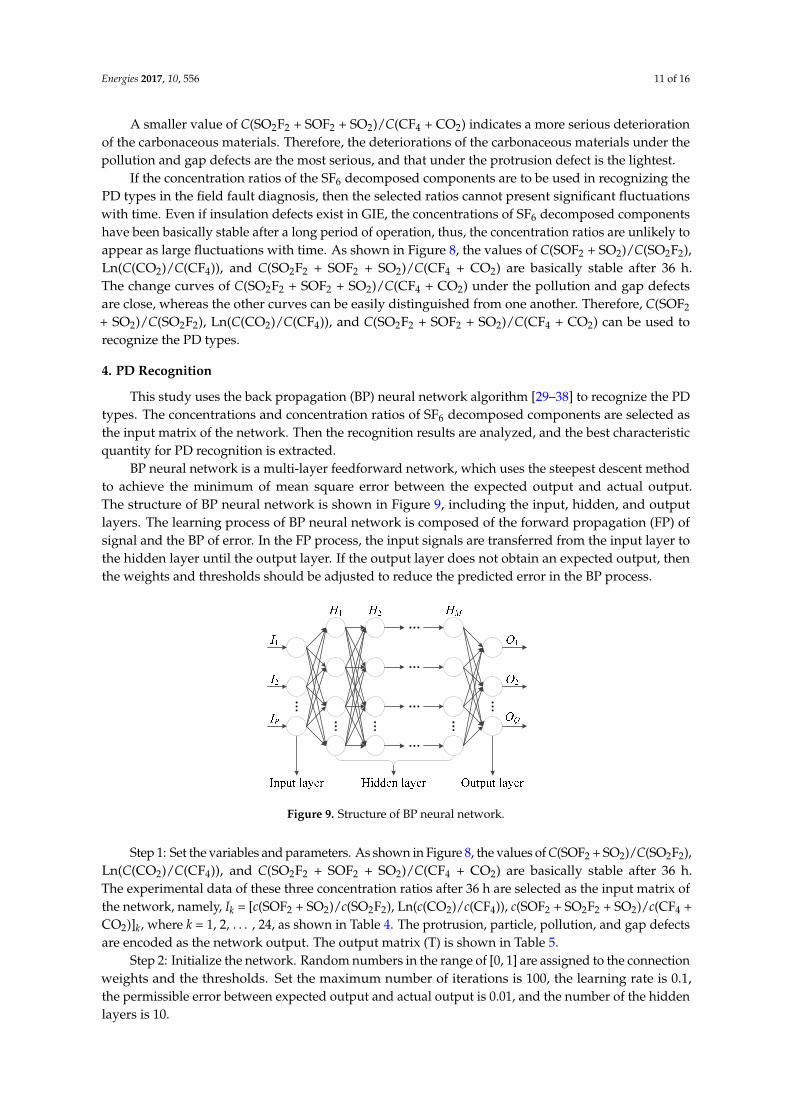
BP neural network is a multi-layer feedforward network, which uses the steepest descent methodto achieve the minimum of mean square error between the expected output and actual output.The structure of BP neural network is shown in Figure 9, including the input, hidden, and outputlayers. The learning process of BP neural network is composed of the forward propagation (FP) ofsignal and the BP of error. In the FP process, the input signals are transferred from the input layer tothe hidden layer until the output layer. If the output layer does not obtain an expected output, thenthe weights and thresholds should be adjusted to reduce the predicted error in the BP process.
Energies 2017, 10, 556 11 of 16
the other curves can be easily distinguished from one another. Therefore, C(SOF2 + SO2)/C(SO2F2), Ln(C(CO2)/C(CF4)), and C(SO2F2 + SOF2 + SO2)/C(CF4 + CO2) can be used to recognize the PD types.
4. PD Recognition
This study uses the back propagation (BP) neural network algorithm [29–38] to recognize the PD types. The concentrations and concentration ratios of SF6 decomposed components are selected as the input matrix of the network. Then the recognition results are analyzed, and the best characteristic quantity for PD recognition is extracted.
BP neural network is a multi-layer feedforward network, which uses the steepest descent method to achieve the minimum of mean square error between the expected output and actual output. The structure of BP neural network is shown in Figure 9, including the input, hidden, and output layers. The learning process of BP neural network is composed of the forward propagation (FP) of signal and the BP of error. In the FP process, the input signals are transferred from the input layer to the hidden layer until the output layer. If the output layer does not obtain an expected output, then the weights and thresholds should be adjusted to reduce the predicted error in the BP process.
Figure 9. Structure of BP neural network.
Step 1: Set the variables and parameters. As shown in Figure 8, the values of C(SOF2 + SO2)/C(SO2F2), Ln(C(CO2)/C(CF4)), and C(SO2F2 + SOF2 + SO2)/C(CF4 + CO2) are basically stable after 36 h. The experimental data of these three concentration ratios after 36 h are selected as the input matrix of the network, namely, Ik = [c(SOF2 + SO2)/c(SO2F2), Ln(c(CO2)/c(CF4)), c(SOF2 + SO2F2 + SO2)/c(CF4 + CO2)]k, where k = 1, 2, …, 24, as shown in Table 4. The protrusion, particle, pollution, and gap defects are encoded as the network output. The output matrix (T) is shown in Table 5.
Step 2: Initialize the network. Random numbers in the range of [0, 1] are assigned to the connection weights and the thresholds. Set the maximum number of iterations is 100, the learning rate is 0.1, the permissible error between expected output and actual output is 0.01, and the number of the hidden layers is 10.
Step 3: Input the training samples. The 75% (18 groups) of the above 24 groups of experimental data are randomly extracted as the training samples, and the remaining 25% data (6 groups) are used as the test samples. The training samples are used to train the BP neural network model. Then, the trained model is used to recognize the test samples.
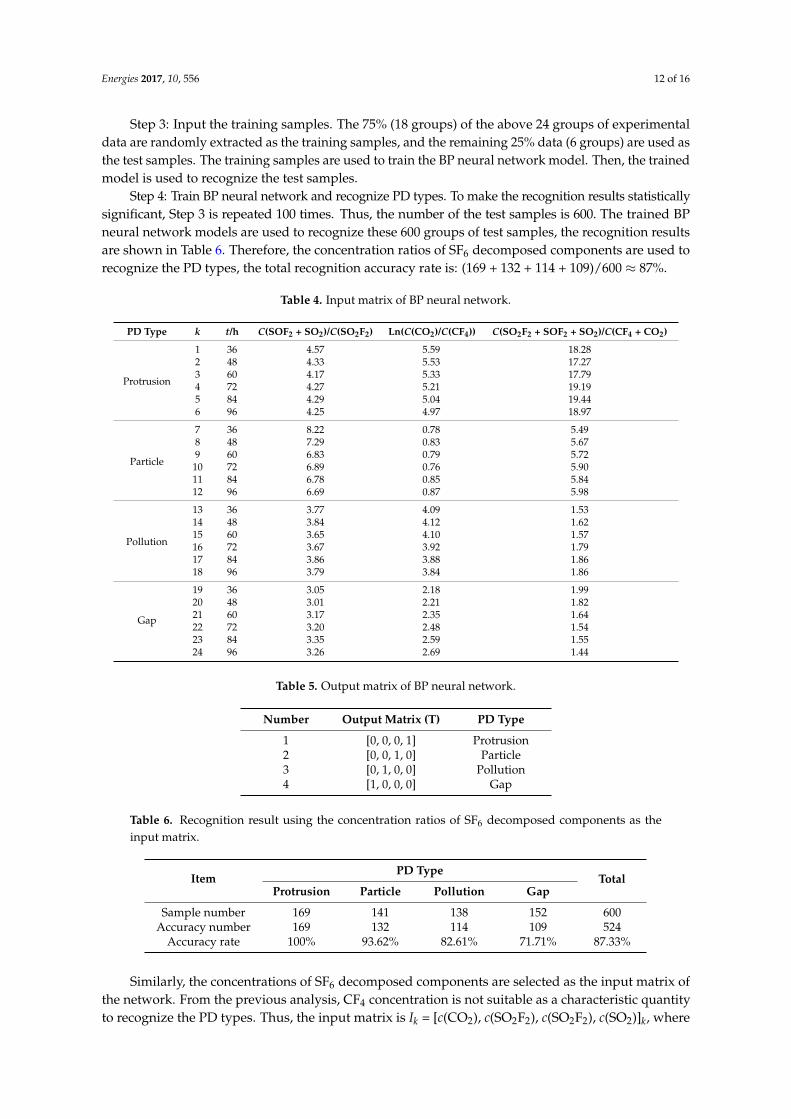
Step 4: Train BP neural network and recognize PD types. To make the recognition results statistically significant, Step 3 is repeated 100 times. Thus, the number of the test samples is 600. The trained BP neural network models are used to recognize these 600 groups of test samples, the recognition results are shown in Table 6. Therefore, the concentration ratios of SF6 decomposed components are used to recognize the PD types, the total recognition accuracy rate is: (169 + 132 + 114 + 109)/600 ≈ 87%.
Figure 9. Structure of BP neural network.
Step 1: Set the variables and parameters. As shown in Figure 8, the values of C(SOF2 + SO2)/C(SO2F2),Ln(C(CO2)/C(CF4)), and C(SO2F2 + SOF2 + SO2)/C(CF4 + CO2) are basically stable after 36 h.The experimental data of these three concentration ratios after 36 h are selected as the input matrix ofthe network, namely, Ik = [c(SOF2 + SO2)/c(SO2F2), Ln(c(CO2)/c(CF4)), c(SOF2 + SO2F2 + SO2)/c(CF4 +CO2)]k, where k = 1, 2, . . . , 24, as shown in Table 4. The protrusion, particle, pollution, and gap defectsare encoded as the network output. The output matrix (T) is shown in Table 5.
Step 2: Initialize the network. Random numbers in the range of [0, 1] are assigned to the connectionweights and the thresholds. Set the maximum number of iterations is 100, the learning rate is 0.1,the permissible error between expected output and actual output is 0.01, and the number of the hiddenlayers is 10.
Energies 2017, 10, 556 12 of 16
Step 3: Input the training samples. The 75% (18 groups) of the above 24 groups of experimentaldata are randomly extracted as the training samples, and the remaining 25% data (6 groups) are used asthe test samples. The training samples are used to train the BP neural network model. Then, the trainedmodel is used to recognize the test samples.
Step 4: Train BP neural network and recognize PD types. To make the recognition results statisticallysignificant, Step 3 is repeated 100 times. Thus, the number of the test samples is 600. The trained BPneural network models are used to recognize these 600 groups of test samples, the recognition resultsare shown in Table 6. Therefore, the concentration ratios of SF6 decomposed components are used torecognize the PD types, the total recognition accuracy rate is: (169 + 132 + 114 + 109)/600 ≈ 87%.
Table 4. Input matrix of BP neural network.
PD Type k t/h C(SOF2 + SO2)/C(SO2F2) Ln(C(CO2)/C(CF4)) C(SO2F2 + SOF2 + SO2)/C(CF4 + CO2)
Table 6. Recognition result using the concentration ratios of SF6 decomposed components as theinput matrix.
ItemPD Type
TotalProtrusion Particle Pollution Gap
Sample number 169 141 138 152 600Accuracy number 169 132 114 109 524
Accuracy rate 100% 93.62% 82.61% 71.71% 87.33%
Similarly, the concentrations of SF6 decomposed components are selected as the input matrix ofthe network. From the previous analysis, CF4 concentration is not suitable as a characteristic quantityto recognize the PD types. Thus, the input matrix is Ik = [c(CO2), c(SO2F2), c(SO2F2), c(SO2)]k, where
Energies 2017, 10, 556 13 of 16
k = 1, 2, . . . , 32. The output matrix remains unchanged (Table 5). Steps 2–4 are conducted, and therecognition results are shown in Table 7. Therefore, the concentrations of SF6 decomposed componentsare used to recognize PD types, the total recognition accuracy rate is: (167 + 165 + 105 + 104)/800 ≈ 68%.
Table 7. Recognition result using the concentrations of SF6 decomposed components as the input matrix.
ItemPD Type
TotalProtrusion Particle Pollution Gap
Sample number 176 216 187 221 800Accuracy number 167 165 105 104 541
Accuracy rate 94.89% 76.39% 56.15% 47.06% 67.63%
Evidently, the total accuracy rate of PD recognition by using the concentration ratios is nearly 20%higher than that by using the concentrations. Moreover, c(SOF2 + SO2)/c(SO2F2), Ln(c(CO2)/c(CF4)),and c(SOF2 + SO2F2 + SO2)/c(CF4 + CO2) have definite physical meaning. Therefore, these threeconcentration ratios are more suitable as the characteristic quantities for PD recognition than theconcentrations of SF6 decomposed components.
To test the recognition performance of BP neural network, the 24 groups of concentration ratiosdata in this study are selected to train the network model. Then, the trained model is used to recognizeanother 24 groups of concentration ratio data produced by the same experiment. These 24 groups ofdata are also basically stable. The deviations of the concentrations of SF6 decomposed componentsbetween these two experiments are less than 10%. The confusion matrix of the recognition result isshown in Table 8, the total recognition accuracy rate is 87.5%, and a good recognition effect is obtained.
Table 8. Confusion matrix of the recognition result.
Real PD Type Number of Samples in Each PD Type in the Recognition Result
Protrusion Particle Pollution Gap
Protrusion 6 0 0 0Particle 0 6 0 0
Pollution 0 0 5 1Gap 0 0 2 4
5. Discussion
This research studied the decomposition characteristics of SF6 under negative DC-PD, and usedBP neural network algorithm to recognize four typical insulation faults in DC-GIE. This study couldlay a solid foundation of using GCA method to diagnose the insulation faults in DC-GIE and assess itsinsulation status. However, the concentrations of SF6 decomposed components are not only relatedto PD type, they are also affected by PD strength [49], the H2O [50], O2 [51], and absorbent [52] inDC-GIE, and so on. This study did not consider these impact factors. To achieve better performancein using GCA method for PD recognition, the influence of these factors on the concentrations of SF6
decomposed components must be studied. Moreover, this study used the decomposition characteristicsof SF6 to recognize the four common PD types in DC-GIE, and obtained a good recognition effectin the laboratory. We should focus on the research of the field application in the future, and usethe engineering data to verify the validity of the method in this study and make correspondingimprovements to this method.
6. Conclusions
The decomposition characteristics of SF6 under four types of negative DC partial discharges areobtained in this study. The relationship between the decomposition characteristics of SF6 and the PD
Energies 2017, 10, 556 14 of 16
types was further studied. Moreover, BP neural network algorithm is used to recognize the PD types.The following conclusions can be drawn from this study:
• The negative DC partial discharges caused by the four defects decompose the SF6 gas andgenerate five stable decomposed components, namely, CF4, CO2, SO2F2, SOF2, and SO2. A closerelationship exists between the decomposition characteristics of SF6 and the types of insulationdefects. The decomposition characteristics of SF6 can be used to diagnose the type and severity ofinsulation fault in DC-GIE.
• BP neural network algorithm is used to recognize the PD types. The recognition results showthat the total recognition accuracy rate is 67.63% and 87.33% when the concentrations andconcentration ratios of SF6 decomposed components are selected as the input matrix of thenetwork, respectively. Therefore, the concentration ratios of SF6 decomposed components aremore suitable as the characteristic quantities for PD recognition than the concentrations of those.
• C(SOF2 + SO2)/C(SO2F2), Ln(C(CO2)/C(CF4)), and C(SO2F2 + SOF2 + SO2)/C(CF4 + CO2) areused to recognize the PD types. The 24 groups of concentration ratio data in this study areselected to train the BP neural network model. Then, the trained model is used to recognizeanother 24 groups of concentration ratio data produced by the same experiment. The totalrecognition accuracy rate is 87.5%, and a good recognition effect is obtained.
Acknowledgments: All the research work has been funded by the National Natural Science Foundation ofChina (Grant No. 51537009 and 51607127) and China Postdoctoral Science Foundation (Grant No. 2016T90723).We sincerely express our thankfulness here.
Author Contributions: Ju Tang and Fuping Zeng conceived and designed the experiments; Xu Yang, Gaoxiang Ye,Qiang Yao, and Yulong Miao performed the experiments; Xu Yang and Fuping Zeng analyzed the data; Ju Tangand Xu Yang wrote the paper.
Conflicts of Interest: The authors declare no conflict of interest.
References
1. Ohki, Y. Thyristor valves and GIS in Kii channel HVDC link. IEEE Electr. Insul. Mag. 2001, 17, 78–79. [CrossRef]2. Hasegawa, T.; Yamaji, K.; Hatano, M. Development of insulation structure and enhancement of insulation
reliability of 500 kV DC GIS. IEEE Trans. Power Deliv. 1997, 12, 192–202. [CrossRef]3. Hasegawa, T.; Yamaji, K.; Hatano, M. DC dielectric characteristics and conception of insulation design for
DC GIS. IEEE Trans. Power Deliv. 1996, 11, 1776–1782. [CrossRef]4. Menju, S.; Takahashi, K. DC dielectric strength of a SF6 gas insulated system. IEEE Trans. Power Deliv. 1978,
97, 217–224. [CrossRef]5. Evgeni, K.V. HVDC gas insulated apparatus: Electric field specificity and insulation design concept.
IEEE Electr. Insul. Mag. 2002, 18, 7–14.6. Mendik, M.; Lowder, S.M.; Elliott, F. Long term performance verification of high voltage DC GIS. In Proceedings
of the 1999 IEEE Transmission and Distribution Conference, New Orleans, LA, USA, 11–16 April 1999;pp. 484–488.
7. Beyer, C.; Jenett, H.; Kfockow, D. Influence of reactive SFx gases on electrode surfaces after electricaldischarges under SF6 atmosphere. IEEE Trans. Dielectr. Electr. Insul. 2000, 7, 234–240. [CrossRef]
9. Van Brunt, R.J.; Herron, J.T. Fundamental processes of SF6 decomposition and oxidation in glow and coronadischarges. IEEE Trans. Dielectr. Electr. Insul. 1990, 25, 75–94. [CrossRef]
10. Chang, C.; Chang, C.S.; Jin, J.; Hoshino, T.; Hanai, M.; Kobayashi, N. Source classification of partial dischargefor gas insulated substation using wave shape pattern recognition. IEEE Trans. Dielectr. Electr. Insul. 2005, 12,374–386. [CrossRef]
11. Dreisbusch, K.; Kranz, H.G.; Schnettler, A. Determination of a failure probability prognosis based onPD-diagnostics in GIS. IEEE Trans. Dielectr. Electr. Insul. 2008, 15, 1707–1714. [CrossRef]
12. Istad, M.; Runde, M. Thirty-six years of service experience with a national population of gas-insulatedsubstations. IEEE Trans. Power Deliv. 2010, 25, 2448–2454. [CrossRef]
13. Van Brunt, R.J. Production rates for oxy-fluorides SOF2, SO2F2 and SOF4 in SF6 corona discharges. J. Res.Natl. Bur. Stand. 1985, 90, 229–253. [CrossRef]
14. Piemontesi, M.; Niemeyer, L. Sorption of SF6 and SF6 decomposition products by activated alumina andmolecular sieve 13X. In Proceedings of the 1996 IEEE International Symposium on Electrical Insulation,Montreal, QC, Canada, 16–19 June 1996; pp. 828–838.
15. Van Brunt, R.J.; Herron, J.T. Plasma chemical model for decomposition of SF6 in a negative glow coronadischarge. Phys. Scr. 1994, 53, 9–29. [CrossRef]
16. Prakash, K.S.; Srivastava, K.D.; Morcos, M.M. Movement of particles in compressed SF6 GIS with dielectriccoated enclosure. IEEE Trans. Dielectr. Electr. Insul. 1997, 4, 344–347. [CrossRef]
17. Casanovas, A.M.; Casanovas, J.; Lagarde, F. Study of the decomposition of SF6 under dc negative polarity coronadischarges (point-to-plane geometry): Influence of the metal constituting the plane electrode. J. Appl. Phys. 1992,72, 3344–3354. [CrossRef]
18. Belmadani, B.; Casanovas, B.; Casanovas, A.M. SF6 decomposition under power arcs: Chemical aspects.IEEE Trans. Dielectr. Electr. Insul. 1992, 26, 1177–1182. [CrossRef]
20. Tang, J.; Li, T.; Hu, Z.; Xiao, B.; Zhang, X.X. Analysis of SF6 gaseous decomposition components under twokinds of PD defects. High Volt. Eng. 2009, 35, 487–492.
21. Tang, J.; Liu, F.; Zhang, X.X.; Meng, Q.H.; Zhou, J.B. Partial discharge recognition through an analysis of SF6
decomposition products part 1: Decomposition characteristics of SF6 under four different partial discharges.IEEE Trans. Dielectr. Electr. Insul. 2012, 19, 29–36. [CrossRef]
22. Tang, J.; Liu, F.; Meng, Q.H.; Zhang, X.X.; Tao, J.G. Partial discharge recognition through an analysis of SF6
decomposition products part 2: Feature extraction and decision tree-based pattern recognition. IEEE Trans.Dielectr. Electr. Insul. 2012, 19, 37–44. [CrossRef]
23. Derdouri, A. Study of the decomposition of wet SF6, subjected to 50-Hz ac corona discharges. J. Appl. Phys.1989, 65, 1852–1857. [CrossRef]
24. Belarbi, A.; Pradayrol, C.; Casanovas, J.; Casanovas, A.M. Influence of discharge production conditions, gaspressure, current intensity and voltage type on SF6 dissociation under point-plane corona discharges. J. Appl. Phys.1995, 77, 1398–1406. [CrossRef]
25. Chen, C.L.; Chantry, P.J. Photo-enhanced dissociative electron attachment in SF6 and its isotopic selectivity.J. Chem. Phys. 1979, 71, 38–97. [CrossRef]
26. Dincer, M.S.; Raju, G.R. Monte Carlo simulation of the motion of electrons in SF6 in uniform electric field.J. Appl. Phys. 1983, 54, 6311–6316. [CrossRef]
27. Sauers, I.; Adcock, J.L.; Christophorou, L.G. Gas phase hydrolysis of sulfur tetrafluoride. J. Chem. Phys. 1985,83, 2618–2619. [CrossRef]
28. Boggs, S.A.; Stone, C. Fundamental limitations in the measurement of corona and partial discharge.IEEE Trans. Dielectr. Electr. Insul. 1982, 17, 143–150. [CrossRef]
29. Fanni, A.; Giua, A.; Sandoli, E. Neural networks for multiple fault diagnosis in analog circuits. In Proceedingsof the 1993 IEEE International Workshop on Defect and Fault Tolerance in VLSI systems, Venice, Italy,27–29 October 1993; pp. 303–310.
30. Kirkland, L.V.; Wright, R.G. Using neural networks to solve testing problems. IEEE Aerosp. Electron. Syst. Mag.1996, 12, 36–40. [CrossRef]
31. Aminian, M.; Aminian, F. Neural-network based analog-circuit fault diagnosis using wavelet transform aspreprocessor. IEEE Trans. Circuits Syst. II Analog Digit. Signal Process. 2000, 47, 151–156. [CrossRef]
32. Karnin, E.D. A simple procedure for punning back-propagation trained neural networks. IEEE Trans.Neural Netw. 1990, 1, 239–242. [CrossRef] [PubMed]
34. Khan, Y. Partial discharge pattern analysis using PCA and back-propagation artificial neural network for theestimation of size and position of metallic particle adhering to spacer in GIS. Electr. Eng. 2016, 98, 29–42.[CrossRef]
35. Majidi, M.; Fadali, M.S.; Etezadi-Amoli, M.; Oskuoee, M. Partial discharge pattern recognition via sparserepresentation and ANN. IEEE Trans. Dielectr. Electr. Insul. 2015, 22, 1061–1070. [CrossRef]
36. Gulski, E.; Krivda, A. Neural networks as a tool for recognition of partial discharges. IEEE Trans. Dielectr.Electr. Insul. 1993, 28, 984–1001. [CrossRef]
40. Okabe, S.; Yamagiwa, T.; Okubo, H. Detection of harmful metallic particles inside gas insulated switchgearusing UHF sensor. IEEE Trans. Dielectr. Electr. Insul. 2008, 15, 701–709. [CrossRef]
41. Ren, M.; Zhang, C.X.; Dong, M. Partial discharges triggered by metal-particle on insulator surface understandard oscillating impulses in SF6 gas. IEEE Trans. Dielectr. Electr. Insul. 2015, 22, 3007–3018. [CrossRef]
42. Tang, J.; Ren, X.L.; Zhang, X.X.; Liu, F. Decomposition characteristics of SF6 under different partial dischargestrengths caused by defected insulation in air gap. Power Syst. Technol. 2012, 36, 40–45.
43. DL/T 596–1996 Preventive Test Code for Electric Power Equipment. Available online: http://www.doc88.com/p-9763610841190.html (accessed on 12 April 2017).
44. IEC 60270:2000 High-voltage Test Techniques—Partial Discharge Measurements. Available online: http://www.doc88.com/p-868119919771.html (accessed on 12 April 2017).
45. Auger, P.; Poggiale, J.C. Emergence of population growth models: Fast migration and slow growth. J. Theor. Biol.1996, 182, 99–108. [CrossRef] [PubMed]
46. Sibly, R.M.; Barker, D.; Denham, M.C.; Home, J.; Pagel, M. On the regulation of populations of mammals,birds, fish and insects. Ecol. Lett. 2005, 309, 607–610. [CrossRef] [PubMed]
47. Tang, J.; Zeng, F.P.; Pan, J.Y.; Zhang, X.X.; Yao, Q. Correlation analysis between formation process of SF6
48. IEC 60480:2004 Guidelines for the Checking and Treatment of Sulfur Hexafluoride (SF6) Taken from ElectricalEquipment and Specification for Its Re-Use. Available online: http://pan.baidu.com/share/link?shareid=3125702881&uk=3894130273 (accessed on 12 April 2017).
49. Tang, J.; Pan, J.Y.; Zhang, X.X.; Zeng, F.P.; Yao, Q.; Hou, X.Z. Correlation analysis between SF6 decomposedcomponents and charge magnitude of partial discharges initiated by free metal particles. IET Sci. Meas. Technol.2014, 8, 170–177. [CrossRef]
50. Zeng, F.P.; Tang, J.; Zhang, X.X.; Pan, J.Y. Influence regularity of trace H2O on SF6 decompositioncharacteristics under partial discharge of needle-plate electrode. IEEE Trans. Dielectr. Electr. Insul. 2015, 22,287–295. [CrossRef]
51. Tang, J.; Zeng, F.P.; Zhang, X.X.; Pan, J.Y.; Qiu, Y.J. Influence regularity of trace O2 on SF6 decompositioncharacteristics and its mathematical amendment under partial discharge. IEEE Trans. Dielectr. Electr. Insul.2014, 21, 105–115. [CrossRef]
52. Tang, J.; Zeng, F.P.; Liang, X. Study on the influence of adsorbent on SF6 decomposition characteristics underpartial discharge. Proc. Chin. Soc. Electr. Eng. 2014, 34, 486–494.