52 Decomposition of EVA Equity to the Sub-operational Plans of a Company Zuzana Rowland University of Žilina Abstract The world is beginning to recognize the need, accuracy and persuasiveness of measuring business performance. Economists are continuously searching for the appropriate tool with which companies can plan, manage and control their business processes and which takes into account current market expectations and requirements. Economic Value Added (EVA) is one of the most important evaluation indicators. This contribution describes the basic characteristics of this indicator and puts forward several options for the calculation of EVA. The options are based on either the accounting (or operative) approach or the financial (or current value) approach, and specifically concerns the calculations of EVA Equity and EVA Entity. The source of the data for the calculations are the annual reports of a transport company for the years 2003-2009. To fulfil the aim of this article, the calculation of EVA Equity is based on the process identified by Neumaierova and Neumaier, and the decomposition of EVA Equity is determined according to the methodology prescribed by the Ministry of Industry and Trade of the Czech Republic. This contribution seeks to decompose EVA Equity, which is viewed as the strategical goal of a company, into partial indicators that can be incorporated into a company´s tactical plan in the form of operative plan indicators. Keywords: EVA Equity, decomposition, business success, strategic goal, sub- operational plans Introduction As societies and economies have developed, more people have begun to realize the importance of the accurate and cogent measurement of business performance.
Transcript
52
Decomposition of EVA Equity to the Sub-operational Plans
of a Company
Zuzana Rowland
University of Žilina
Abstract
The world is beginning to recognize the need, accuracy and persuasiveness of
measuring business performance. Economists are continuously searching for the
appropriate tool with which companies can plan, manage and control their business
processes and which takes into account current market expectations and
requirements. Economic Value Added (EVA) is one of the most important evaluation
indicators. This contribution describes the basic characteristics of this indicator and
puts forward several options for the calculation of EVA. The options are based on
either the accounting (or operative) approach or the financial (or current value)
approach, and specifically concerns the calculations of EVA Equity and EVA Entity.
The source of the data for the calculations are the annual reports of a transport
company for the years 2003-2009. To fulfil the aim of this article, the calculation of
EVA Equity is based on the process identified by Neumaierova and Neumaier, and
the decomposition of EVA Equity is determined according to the methodology
prescribed by the Ministry of Industry and Trade of the Czech Republic. This
contribution seeks to decompose EVA Equity, which is viewed as the strategical goal
of a company, into partial indicators that can be incorporated into a company´s
tactical plan in the form of operative plan indicators.
Keywords: EVA Equity, decomposition, business success, strategic goal, sub-
operational plans
Introduction
As societies and economies have developed, more people have begun to realize the
importance of the accurate and cogent measurement of business performance.
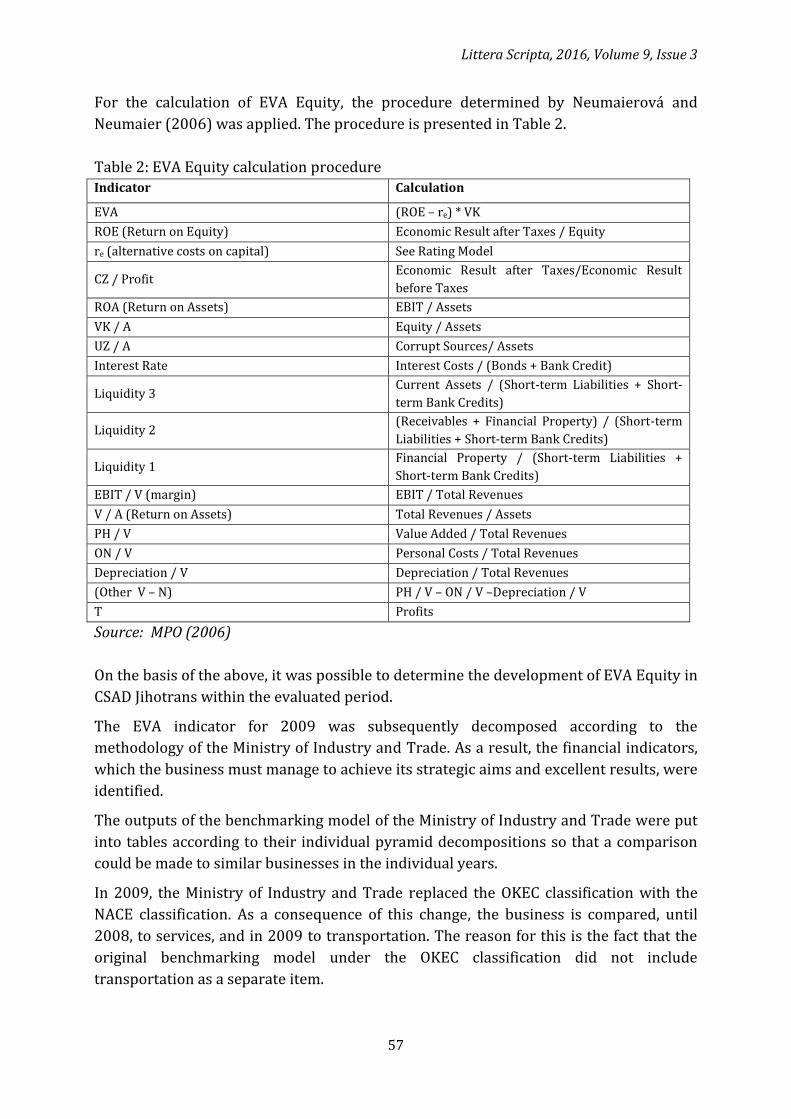
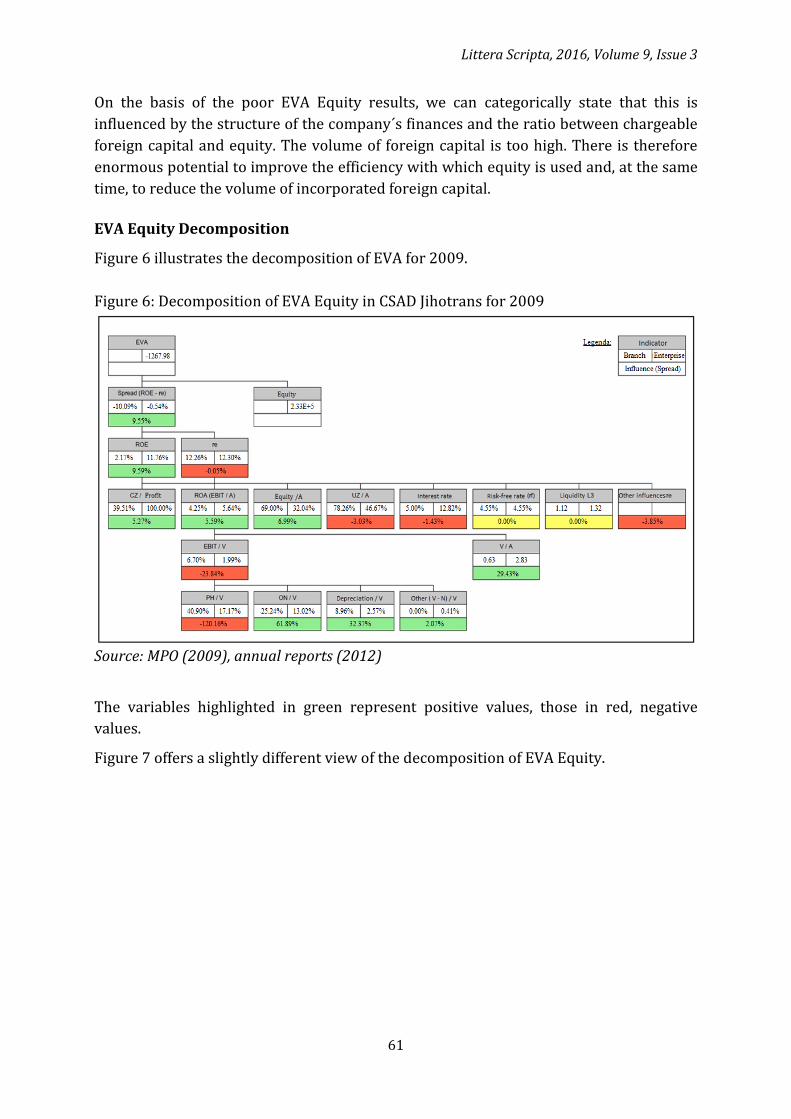
Littera Scripta, 2016, Volume 9, Issue 3
53
According to Jarina and Bodorová (2013), the evaluation of a company is one of the most
important financial decisions the management of a company can make. Each company
aims to maximize its value which leads to growth in shareholder wealth (Majerčíková
and Bartošová 2012). It is therefore necessary to find a tool which enables companies to
plan, manage and control their business processes. The accuracy of the input data is very
important within this context. Dvořáková and Vochozka (2014) point out the need to
adapt the tools of measurement according to current market expectations and demands.
Existing methods for evaluating the performance of a company do not fully satisfy the
increasing demands placed on businesses. They do not allow the evaluation to be made
for the long term (Kvach and Il’ina 2013). To properly assess the performance of a
company, the concept of profit maximization as the main objective of a company needs
to be replaced by the concept of maximizing value (Vochozka and Rowland 2015). At
present, Economic Value Added (EVA), which was developed by two Americans –
Steward and Stern – in 1990, is perceived to be an accurate measure of financial
performance (Chmelíková 2008).
The aim of this contribution is to calculate EVA Equity for a specific company and to put
forward proposals for its decomposition into the operative plans of the business.
Literature review
EVA is one of the most important business performance evaluation indicators. It
provides a basis for the analysis of the inputs for the calculation of a business´ value, as
well as for the inputs for calculating cost of equity (Horváthová, Mokrišová and
Suhányiová 2014). Stewart (1991) interpreted EVA as being the residual income that
accrues to both a company´s debtholders and its equity holders.
In order to establish whether a company has pursued a strategy focused on EVA growth,
it is necessary to identify those factors that affect the size of EVA (Bluszcz and Kijewska
2016). According to Aggarwal and Sharma (2011), the key financial factors that
determine EVA are the return on investment, return on equity, capital employed, etc.
EVA allows managers to evaluate a company´s economic value, assess funds and
efficiently allocate resources, thereby using adjustment items to reflect the true
economic value of the company (Huang and Liu 2010).
The concept of EVA is quite simple; it maximizes the spread between the return on
capital used to generate profits and the costs of using that capital (Musa 2008). By
adopting the concept of EVA, business executives hope to increase the efficiency with
which assets and resources are allocated, thereby increasing shareholder wealth
(Chmelíková 2008). Adimando, Butler and Malley (1994) claim that EVA is almost 50%
better than its closest accounting-based competitor in explaining changes in shareholder
wealth.
Vochozka (2009) claims that EVA describes the ability of a company to generate
economic profit (economic profit = accounting profit – cost of equity). In contrast to
traditional performance metrics, EVA better reflects the real costs of a company because
it includes equity costs (Chmelíková 2008).
Littera Scripta, 2016, Volume 9, Issue 3
54
According to Abate, Grant and Stewart (2004), there are two ways to define EVA – the
accounting (or operational) approach and the financial (or present value) approach.
Under the accounting approach, EVA is (known as EVA Entity) is described by the
following equation:
EVA = NOPAT - C * WACC (1)
where NOPAT stands for Net Operating Profit After Taxes, C stands for Capital Employed
to Generate Operating Profit, and WACC stands for Weighted Average Cost of Capital.
NOPAT can be expressed in simple terms as tax-adjusted EBIT (Abate, Grant and
Stewart, 2004, pp. 62):
NOPAT = EBIT(1-t) (2)
where t stands for income tax rate and EBIT stands for Earnings Before Interest and
Taxes.
WACC can be expressed as (Bluszcz, Kijewska and Sojda, 2015):
WACC = 𝑘𝑒 ∗
𝐸
𝐶+ 𝑘𝑑 ∗ (1 − 𝑡) ∗
𝐷
𝐶
(3)
where ke stands for Cost of Equity, E stands for Equity, D stands for Debt, t stands for
income tax rate, kd stands for Cost of Debt and C stands for enterprise value; it is equal to
the sum of equity and debt.
EVA can also be expressed in terms of the return on capital after tax and the cost of
capital (de Wet and du Toit, 2007):
EVA = (ROIC - WACC) * C (4)
where ROIC stands for the Return On Invested Capital (ROIC = NOPLAT/IC → NOPLAT
stands for the net profit (or loss) from the main business minus the tax on the profit),
WACC stands for Weighted Average Cost of Capital and C stands for Invested Capital (at
the beginning of the year).
EVA can also be determined by subtracting the cost of equity from the earnings (de Wet
and du Toit, 2007). Under this method, EVA is often referred to as EVA Equity:
EVA = Earnings - (𝑘𝑒 ∗ 𝑒𝑞𝑢𝑖𝑡𝑦) (5)
where ke is the Cost of Equity.
EVA Equity can also be expressed in the form of the following equation:
EVA = (ROE - 𝑘𝑒) ∗ 𝑒𝑞𝑢𝑖𝑡𝑦 (6)
where ROE stands for the Return on Equity and ke stands for the Cost of Equity.
Littera Scripta, 2016, Volume 9, Issue 3
55
The calculation of the ke indicator (Cost of Equity) is as follows (Stehel and Vochozka,
2016):
𝑘𝑒 = 𝑊𝐴𝐶𝐶 ∗
𝐷𝐴 −
𝐸𝐴𝑇𝐸𝐵𝑇 ∗ 𝐶 ∗ (
𝐶𝐴 ∗
𝐸𝐴)
𝐸𝐴
(7)
where A stands for Assets, E stands for Equity, D stands for Debts, EAT stands for
Earnings After Taxes and EBT stands for Earnings Before Taxes.
WACC is hereby defined as the sum of interests that reflect certain risks connected with
running a business:
WACC = 𝑟𝑓 + 𝑟𝐿𝐴 + 𝑟𝑒 + 𝑟𝐹𝑖𝑛𝑆𝑡𝑎𝑏 (8)
where rf stands for the Risk Free rate, rLA stands for the function of the indicators
characterizing the size of the enterprise, re stands for rentrepreneurial – the function of the
indicators characterizing the creation of ROA (Return On Assets) and rFinStab is the
function of the indicators characterizing the relationships between the assets and
liabilities.
In business practice, there are other ways of calculating the top indicators of business
success.
According to Abate, Grant and Stewart (2004) the financial interpretation of EVA is
especially appealing to security analysts and portfolio managers. In principle, EVA is
directly related to wealth creation via Net Present Value (NPV). In this context, NPV (or
MVA, for market value added) can be expressed as the present value of expected future
EVA (NPV = MVA = Present Value of Expected EVA).
Sedláček (2007) claims that macroeconomic policy has a substantial impact on the
creation of EVA within a company.
Economic Value Added provides a general analysis of business performance. However,
the use of EVA Entity, provides a better indicator of business performance for investors
i.e. the owners and creditors, whereas EVA Equity is purely relevant to the business
owners.
The EVA indicator, due to the way it is constructed, is a base variable for the business
performance calculation. The total current value of future EVA is therefore equal to the
enterprise value. It can therefore be deduced that a positive development in the
indicator can acquire strategic meaning for a company, its owners, or its managers.
Company managers observe the interests of the owners. The EVA indicator and its value
is therefore the most important strategic aim of a company.
Littera Scripta, 2016, Volume 9, Issue 3
56
Materials and Methods
The basic data sources for this study were the annual reports (2012) of CSAD Jihotrans,
as posted on their website http://spolecnost.jihotrans.cz/ke-stazeni/ za roky 2003-
20091.
The information held in the Financial Statements of the annual reports, as well as other
facts relevant to the financial analysis, were of significance.
The sources of the data used for the calculation are presented in Table 1.
Table 1: Data sources based on the Financial Statements Name Statement Statement Item
Working Capital Balance Sheet (C.I+C.III+C.IV+D.I.2) -