On Election Day, Kura Yangu Sauti Yangu, a coalition of civil society organisations in Kenya, deployed over 500 monitors in all the 290 constituencies to monitor and observe the election. KYSY has also received observations from the public in pictorial, video and written form. KYSY has revealed important contradictions and major anomalies in the data released by the Independent Electoral and Boundaries Commission (IEBC) – particularly differences between the chairman’s formal announcement of final presidential results, and what is displayed on the website portal. This important new update show that final results verbally announced by IEBC Chair, Wafula Chebukati, 11 August, are dramatically contradicted by the data displayed on the website portal. Every region (or former province) has major differences of valid votes. Totals in Nyanza, Western, Nairobi, Northeastern and Eastern show differences through totals of decreased valid votes; Central, Rift Valley, and Coast show differences through increased valid votes. For example, in Kisumu, the IEBC’s verbal announcement was 60,520 votes less than what is in the portal. Example 1. Differences in Valid Votes in Nyanza Here is the breakdown:
Transcript
On Election Day, Kura Yangu Sauti Yangu, a coalition of civil society organisations in Kenya, deployed over 500 monitors in all the 290 constituencies to monitor and observe the election. KYSY has also received observations from the public in pictorial, video and written form. KYSY has revealed important contradictions and major anomalies in the data released by the Independent Electoral and Boundaries Commission (IEBC) – particularly differences between the chairman’s formal announcement of final presidential results, and what is displayed on the website portal. This important new update show that final results verbally announced by IEBC Chair, Wafula Chebukati, 11 August, are dramatically contradicted by the data displayed on the website portal. Every region (or former province) has major differences of valid votes. Totals in Nyanza, Western, Nairobi, Northeastern and Eastern show differences through totals of decreased valid votes; Central, Rift Valley, and Coast show differences through increased valid votes. For example, in Kisumu, the IEBC’s verbal announcement was 60,520 votes less than what is in the portal. Example 1. Differences in Valid Votes in Nyanza
Here is the breakdown:
Overall, this is a sum total difference of -‐63,368 (less) valid votes in Nyanza
Valid Votes Aug 11 Valid Votes Portal Aug 18 DifferenceSiaya 379,080 380,020 -‐940Kisumu 378,903 439,423 -‐60,520Homa Bay 403,006 402,836 170Migori 322,261 322,127 134Kisii 403,665 405,872 -‐2,207Nyamira 204,833 204,838 -‐5
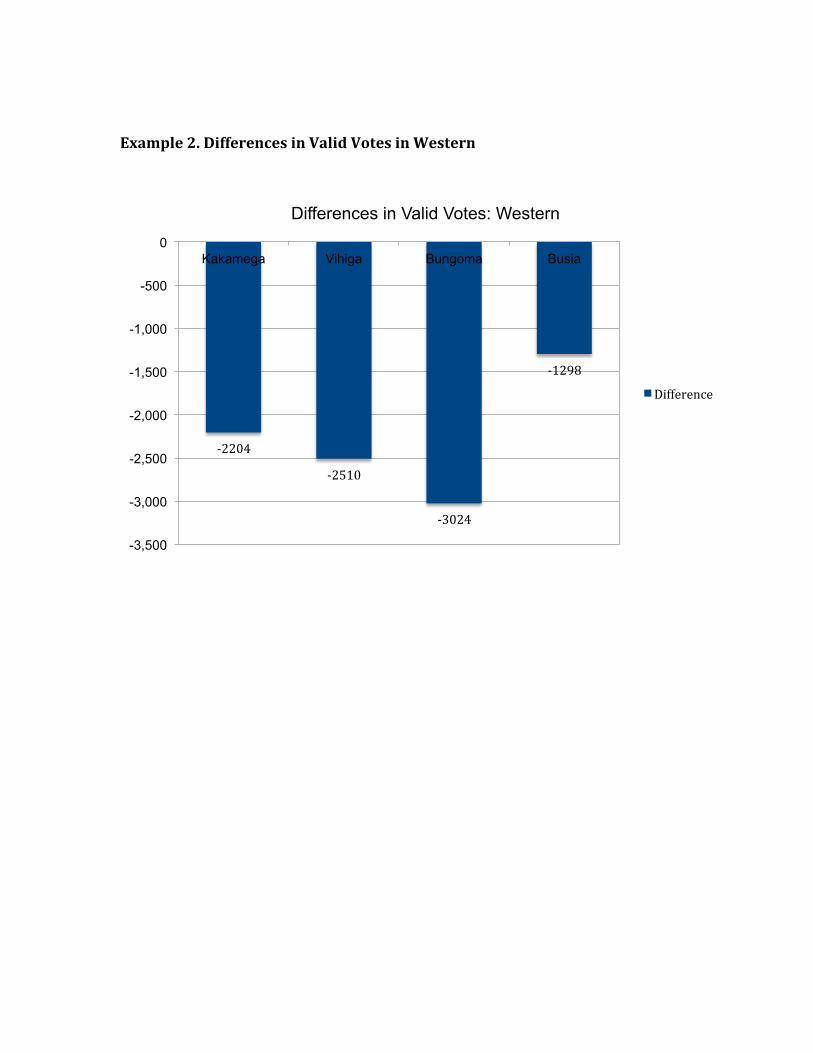
Example 2. Differences in Valid Votes in Western
-‐2204
-‐2510
-‐3024
-‐1298
-3,500
-3,000
-2,500
-2,000
-1,500
-1,000
-500
0 Kakamega Vihiga Bungoma Busia
Differences in Valid Votes: Western
Difference
In the case of Bungoma, the results announced by Chebukati put the number of valid votes 3,024 less than the portal total. Here is the breakdown:
Overall this is a sum total difference of -‐9,036 (less) valid votes in Western.
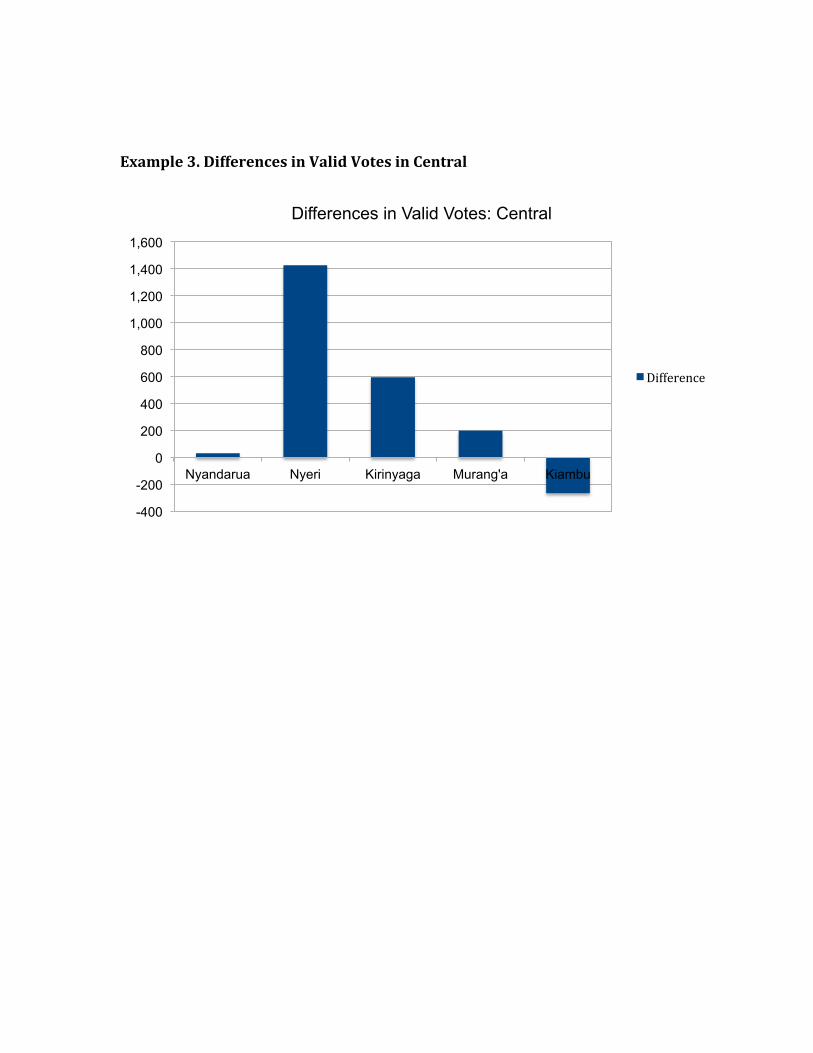
In the case of Central, Chebukati’s announced results on August 11th increased the number of valid votes compared to those displayed in the portal. Central Province Breakdown:
Overall, this is a sum total difference of +1,985 (plus) valid votes in Central
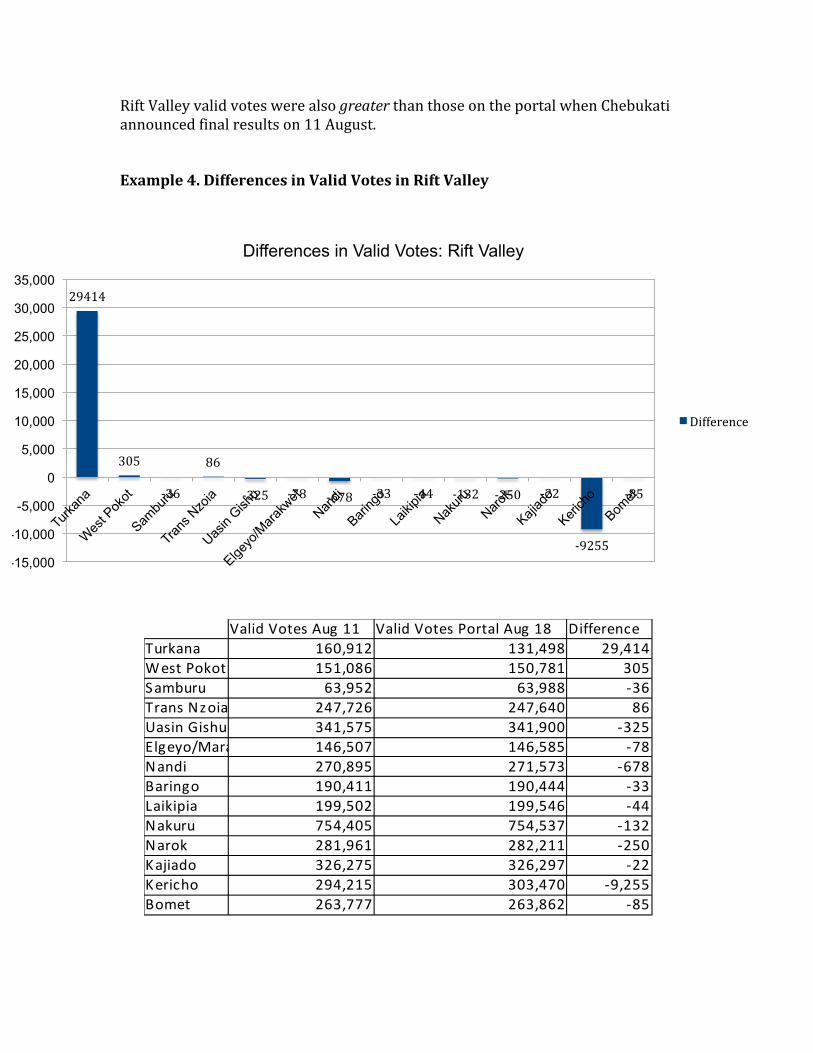
Rift Valley valid votes were also greater than those on the portal when Chebukati announced final results on 11 August. Example 4. Differences in Valid Votes in Rift Valley
Overall, this is a sum total difference of + 18,867 (plus) valid votes in Rift Valley There were significant discrepancies in all eight regions, or former provinces, when Chebukati made the announcement on 11 August: Coast totals of valid votes increased Coast: +143 (plus) sum total difference of valid votes Eastern, Nairobi and Northeastern totals of valid votes decreased Eastern: -‐2,787 (less) sum total difference of valid votes Nairobi: -‐5,522 (less) sum total difference of valid votes Northeastern: -‐1,634 (less) sum total difference of valid votes Section 2 UPDATED: revised KYSY Press Statement of 17th August Revisions reflect changes of data on IEBC website Turnout
1. After examining the number of votes cast in the presidential election, we found that there is a gap between what the IEBC verbally announced on August 11, what was being shown on the television screen at the time of the announcement, and what was in the portal the following day.
Table 1: Discrepancies in Turnout1 Voter Turnout as Announced by IEBC on August 11
15,073,662
Voter Turnout as Projected on National Television (from IEBC)
15,518,971
Voter Turnout as Recorded on the IEBC’s Website
15,586,401
Since the IEBC’s announced turnout is less than what its own portal was showing at the time of the announcement of presidential results, the validity and reliability of the IEBC’s announced figures is questionable.
1 . These figures were taken from two sources: the live broadcast of the IEBC’s final declaration of presidential results on August 11, 2017 and the IEBC’s portal as it stood on August 12, 2017.
The IEBC’s portal shows varying levels of votes cast for the different elective offices. For instance, in Stream 2 of Kithare Primary School in Meru County (Njia Ward), there were 448 votes cast for president2 but only 3543 votes cast for Member of County Assembly. Given that the IEBC’s regulations stipulate that every voter must receive and must cast six ballots, there is no reason for differing numbers of votes cast. There is also evidence of turnout in excess of 100 percent:
I. In Garissa Main Prison, there are 25 registered voters.4 The portal shows that there were 18 valid votes and 25 rejected votes, totaling to 43 cast ballots.5 This amounts to 172 percent turnout.
II. In Kitale Medium Prison, there are 7 registered voters6 but 9 total votes cast.7 This is 129 percent turnout.
III. In Manyani Prison, there are 157 registered voters.8 There were 2899 votes cast, which amounts to a turnout rate of 184 percent.
IV. In Moyale Prison, there are 6 registered voters10, but there were 10 votes cast.11 This is 167 percent turnout.
2 . IEBC. August 18, 2017. “Elections in Kenya 2017. 012052025908502 info.” Available at <https://public.rts.iebc.or.ke/enr/index.html#/Kenya_Elections_Presidential/1/1012/1012052/10120520259/10120520259085/1012052025908502>. 3 . IEBC. August 18, 2017. “Elections in Kenya 2017. 012052025908502 info.” Available at <https://public.rts.iebc.or.ke/enr/index.html#/Kenya_Elections_Caw/1/1012/1012052/10120520259/10120520259085/1012052025908502> 4 . IEBC. August 18, 2017. “Statistics per Polling Station.” Available at <https://www.iebc.or.ke/iebcreports/>. 5 . IEBC. August 18, 2017. “Elections in Kenya. 049292145101801 info.” Available at <https://public.rts.iebc.or.ke/enr/index.html#/Kenya_Elections_Presidential/1/1049/1049292/10492921451/10492921451018/1049292145101801>. 6 . IEBC. August 18, 2017. “Statistics per Polling Station.” Available at <https://www.iebc.or.ke/iebcreports/>. 7 . IEBC. August 18, 2017. “Elections in Kenya. 049292145105801 info.” Available at <https://public.rts.iebc.or.ke/enr/index.html#/Kenya_Elections_Presidential/1/1049/1049292/10492921451/10492921451058/1049292145105801>. 8 . IEBC. August 18, 2017. “Statistics per Polling Station.” Available at <https://www.iebc.or.ke/iebcreports/>. 9 . IEBC. August 18, 2017. “Elections in Kenya. 049292145101701 info.” Available at <https://public.rts.iebc.or.ke/enr/index.html#/Kenya_Elections_Presidential/1/1049/1049292/10492921451/10492921451017/1049292145101701>. 10 . IEBC. August 18, 2017. “Statistics per Polling Station.” Available at <https://www.iebc.or.ke/iebcreports/>. 11 . IEBC. August 18, 2017. “Elections in Kenya. 049292145102201 info.”Available at <https://public.rts.iebc.or.ke/enr/index.html#/Kenya_Elections_Presidential/1/1049/1049292/10492921451/10492921451022/1049292145102201>.
Table 2: Turnout over 100% Name of Prison No. of
registered voters
Valid votes Cast in the portal
Rejected Votes
Total Votes Cast
Percentage turnout
Garissa Main Prison
25 18 25 43 172
Kitale Medium Prison
7 2 7 9 129
Manyani Prison 157 130 157 287 182
Moyale Prison 6 4 6 10 167
Register of Voters 2. The total number of registered voters has changed over time. At the end of the
mass voter registration exercises, the total number of registered voters stood at 19,646,673. After KPMG’s audit and the IEBC’s subsequent clean-up of the Register, the certified total number of registered voters was 19,611,423. When the IEBC published the list of the number of presidential ballots allocated to each polling station, the number of registered voters totaled 19,613,846. When the IEBC announced the number of registered voters per county at the time of the declaration of presidential results on August 11, the total number of registered voters amounted to 19,637,061. There were differences between the certified Register and the IEBC’s figures in at least 47 out of 49 counties (including prisoners and diaspora).
Table 3: Changes in the Register of Voters Total
Registered Voters
Change
Pre-Audited Register 19,646,67312 Certified Register 19,611,42313 -35,250 Number of Registered Voters as shown in the Presidential Ballot Packing List
19,613,84614 +2,423
Number of Registered Voters as Reflected in IEBC’s Verbal Declaration of Results
19,637,06115 +23,215
Overall Change (Certified vs Announced on Augusy 11)
+25,638
It bears repeating that the register already carries more than one million dead voters, hundreds of thousands of shared identity cards and illegitimate entries as well as errors.
Overall, the total number of registered voters announced by the IEBC on August 11 is 25,638 voters larger than the certified total. Rejected Votes 3. When the IEBC verbally declared the presidential results, it did not announce the number of rejected votes. At the time of the declaration of presidential results, the television showed a total of 401,093 rejected votes. The IEBC’s website currently shows that there were 403,49516 total rejected votes cast in the presidential election.
12 . KPMG. May 31, 2017. “Independent Audit of the Register of Voters,” page 114. Available at <https://www.iebc.or.ke/iebcreports/wp-‐content/uploads/2017/07/6.-‐Analysis-‐of-‐the-‐Register-‐of-‐Voters_Audit-‐of-‐the-‐register-‐of-‐voters_1.pdf>. 13 . IEBC. June 27, 2017. “Press Statement on the Certification of the Register of Voters.” Available at <https://www.iebc.or.ke/uploads/resources/XaOdS3fXgF.pdf>. 14 . This total was calculated based on the number of polling stations and number of voters per polling station, as recorded in the General Election Presidential Pallet List 2017. This list is available at <https://www.iebc.or.ke/resources/?General_Election_Presidential_Pallet_List_2017>. 15 . This is a summation of each county’s registered voters, as announced by the IEBC on live television on August 11, 2017. 16 . This figure was listed on the IEBC’s portal as of August 18, 2017 at 11:20. Available at <https://public.rts.iebc.or.ke/results/results.html>.
Presidential Results 4. The number of valid votes as announced by the IEBC on August 11 is different from what is in the portal in every single county, with the exception of the diaspora. Some of these differences are due to the fact that the portal showed incomplete transmission from 5 counties as of August 16, 2017. Even in places where transmission is complete, however, the totals are different.
5. There are also differences between what the IEBC announced at the county level and what is reflected within the portal for the constituencies within the counties. For example, in Kisumu, the IEBC announced that the total valid votes in Kisumu totaled 378,903. When totaling the valid votes from each constituency within Kisumu in the portal, the total valid votes is shown as 439,423.17 The IEBC’s announced result, then, is 60,520 votes smaller than what is shown in the portal.
6. In Kericho, the IEBC announced total valid votes to be 294,215. The constituency totals within the portal show 303,470.18 This is a difference of 9,255 votes.
17 . IEBC. August 18, 2017. “Elections in Kenya 2017. Kisumu.” Available at <https://public.rts.iebc.or.ke/enr/index.html#/Kenya_Elections_Presidential/1/1042>. 18 . IEBC. August 18, 2017. “Elections in Kenya 2017. Kericho.” Available at <https://public.rts.iebc.or.ke/enr/index.html#/Kenya_Elections_Presidential/1/1035>.
Comparison of Forms 34A and Forms 34B A preliminary comparison of Forms 34A and Forms 34B demonstrates worrying inconsistencies. Table 4: Sample of Discrepancies in the Form 34A and Constituency Results Form 34B19
Name of Polling Station & County Form 34 A Form 34 B Stream 2 -Emkwen Youth Polytechnic - Bomet
Total rejected votes 12/212 (unclear)
Total rejected votes 2
Stream 2 - Kambi Garba Polling Station - Isiolo
Total rejected votes 10 Total rejected votes 8
Stream 2 - St. Kizito Polling Station – Isiolo North
2 0
Stream 1 -Ramadhan Primary School Polling Station – Isiolo
0 Votes for Kenyatta 150 votes for Wainaina 1 rejected vote
150 votes for Kenyatta 0 votes for Wainaina 0 rejected votes
253 votes for Kenyatta 0 votes for Wainana 4 rejected votes
0 votes for Kenyatta 253 votes for Wainana 0 rejected votes
Table 5: Differences in Kisii Primary School, Stream 3 in Nyaribari Chache, Kisii Candidate Form 34A Form 34B JA 0 2 MD 0 3 SJ 0 1 JK 0 0 UK 176 200 MW 0 0 JN 2 3 RO 297 176
Rejected Votes 3 0
19 . These figures are taken from the Forms 34A submitted by KYSY observers and Forms 34B, as posted on the IEBC’s website at <https://forms.iebc.or.ke/form34b>.
These differences are not only huge, but they point to serious problems with the election outcome as announced. At face value, they suggest the need for a full audit of the results the IEBC has released and reconciliation of announced results with the authentic documents from the polling stations. The amount of missing data, a full week after the election, calls into question whether the declaration of results could be made legitimately. IEBC’s opaque and unaccountable management of election results has already produced deadly consequences. In the aftermath of the announcement of the election results, violence in various parts of the country resulted in several deaths, 13 of which Kura Yangu attributes to police violence. Police Violence Furthermore, Kura Yangu Sauti Yangu has received reports of the violent police dispersal of peaceful protests and gatherings through the use of excessive force in areas including Kondele, Mathare and Kibra (Olympic, Gatikwira and Bombululu). Live bullets, brutal beatings and teargas have been the police forces’ weapons of choice. Three incidents of rape have been reported in Mathare after police broke into people’s houses and forced the men out. We have also received reports of damage to property. The overall picture is one of grievous violations of the right to life, freedom of assembly and security of person and property. Unlike what we have witnessed, the use of force, and in particular lethal force, should not be the default position for police in crowd control and management. In any case, the objective for use of force should be to subdue with the objective of effecting an arrest and not to perform execution-style killings. The use and deployment of all weapons, lethal and non-lethal, should be accounted for after every security operation to enhance individual and command responsibility.