Page 1
2011 Chamber Large Employer Round Table
"dedicated to representing private enterprise, promoting business and enhancing the quality of life
in our greater Charlottesville communities."
Thursday, September 1, 2011
Page 2
Report and Analysis:Employment in Greater Charlottesville
2000-2010
Presented by: Timothy Hulbert, IOM
Underwritten by:
The Chamber Jobs Report - 2011
Page 3
2000: 100,708 Total JobsGreater Charlottesville
2000
0 2,000 4,000 6,000 8,000 10,000 12,000 14,000 16,000 18,000
16
1,241
1,824
3,719
4,031
6,773
8,524
9,715
9,986
10,006
10,006
15,824
16,174Trade, Transportation & Util-ities
Government - State
Government - Local
Manufacturing
Leisure & Hospitality
Professional & Business Services
Education & Health Services
Construction
Other Services
Financial Activities
Information
Government - Federal
Natural Resources & Mining
Unclassified
Page 4
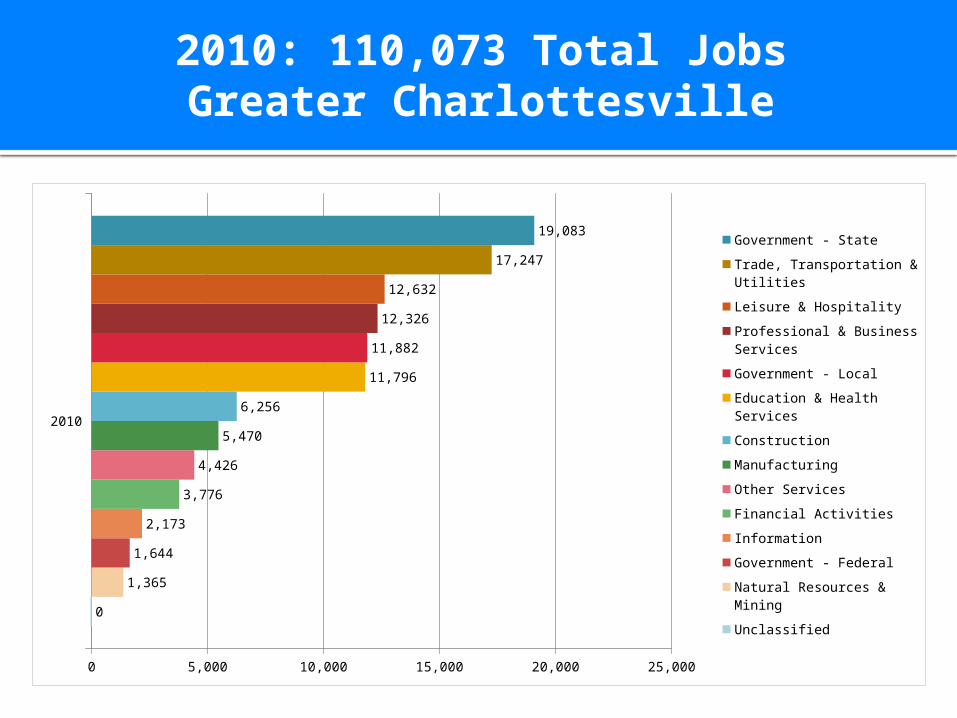
2010: 110,073 Total JobsGreater Charlottesville
2010
0 5,000 10,000 15,000 20,000 25,000
0
1,365
1,644
2,173
3,776
4,426
5,470
6,256
11,796
11,882
12,326
12,632
17,247
19,083Government - State
Trade, Transportation & Util-ities
Leisure & Hospitality
Professional & Business Services
Government - Local
Education & Health Services
Construction
Manufacturing
Other Services
Financial Activities
Information
Government - Federal
Natural Resources & Mining
Unclassified
Page 5
Top Five Sectors Private Enterprise Employment Comparison
Greater Charlottesville
Construction
Education & Health Services
Professional & Business Services
Leisure & Hospitality
Trade, Transportation & Utilities
0 2,000 4,000 6,000 8,000 10,000 12,000 14,000 16,000 18,000 20,000
6,773
8,524
9,715
9,986
16,174
6,256
11,796
12,326
12,632
17,247
20102000
Page 6
Government Sector Employment Comparison
Greater Charlottesville
Federal Government
Local Government
State Government
0 5,000 10,000 15,000 20,000 25,000
1,824
10,006
15,824
1,644
11,882
19,083
20102000
Page 7
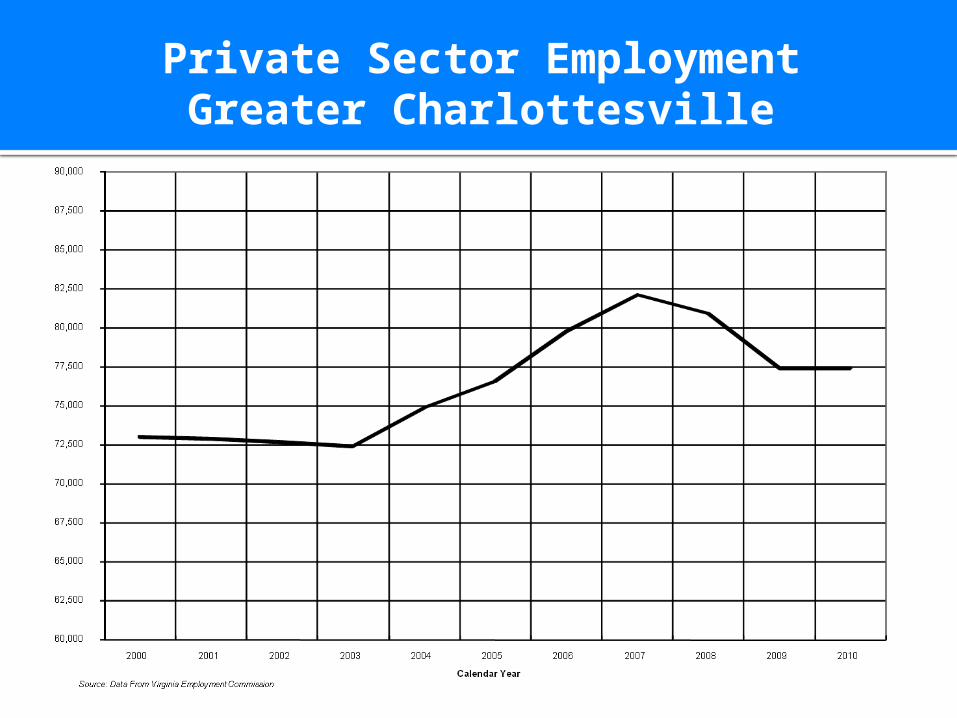
Private Sector EmploymentGreater Charlottesville
Page 8
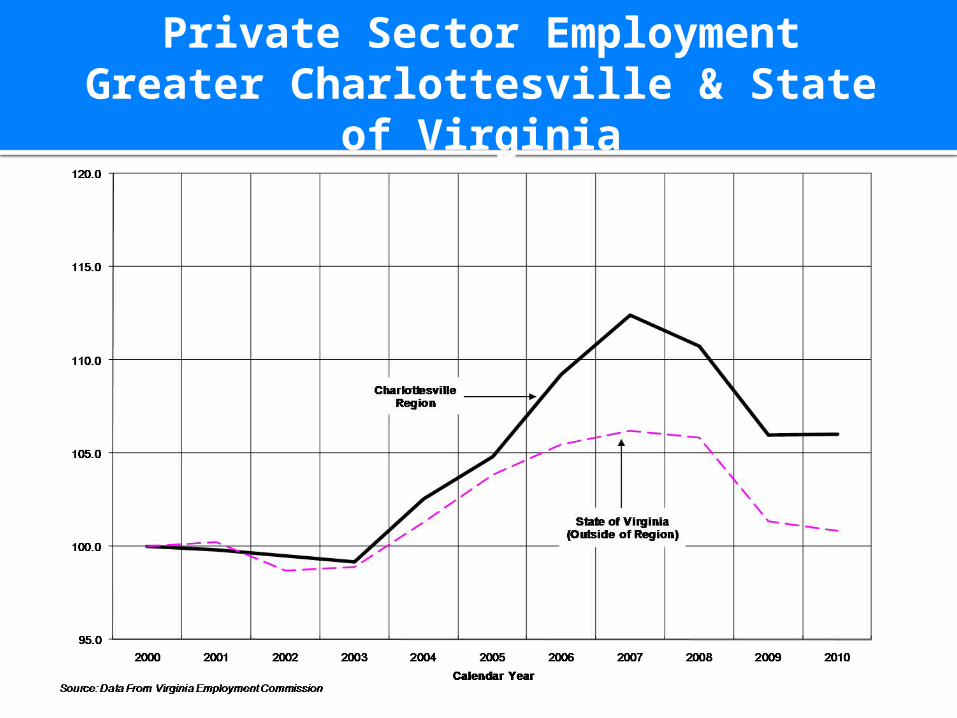
Private Sector EmploymentGreater Charlottesville & State of Virginia
Page 9
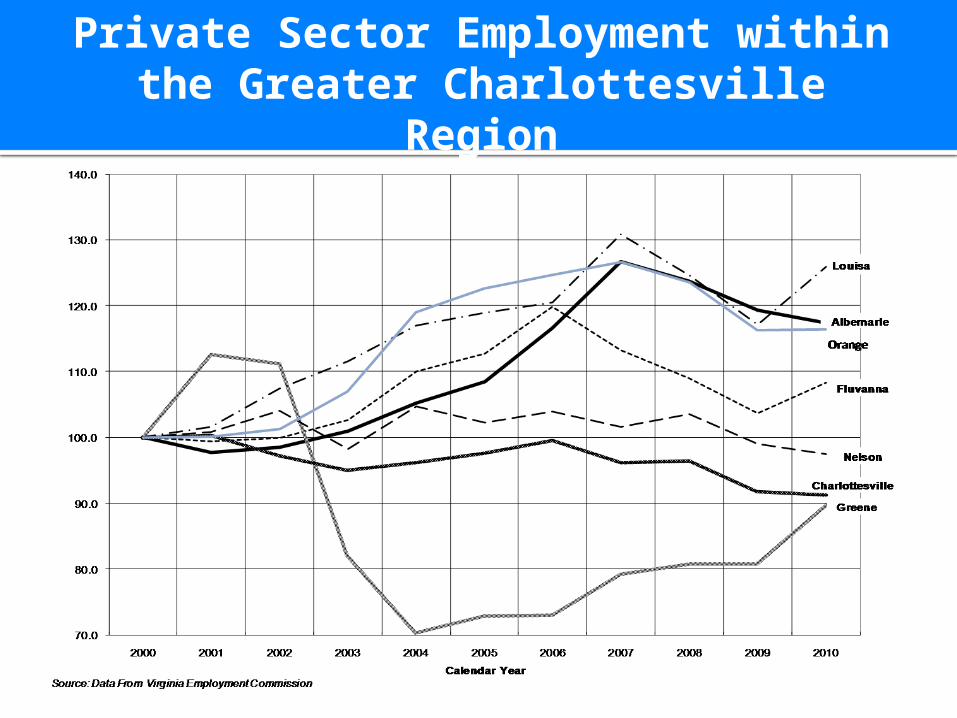
Private Sector Employment within the Greater Charlottesville Region
Page 10
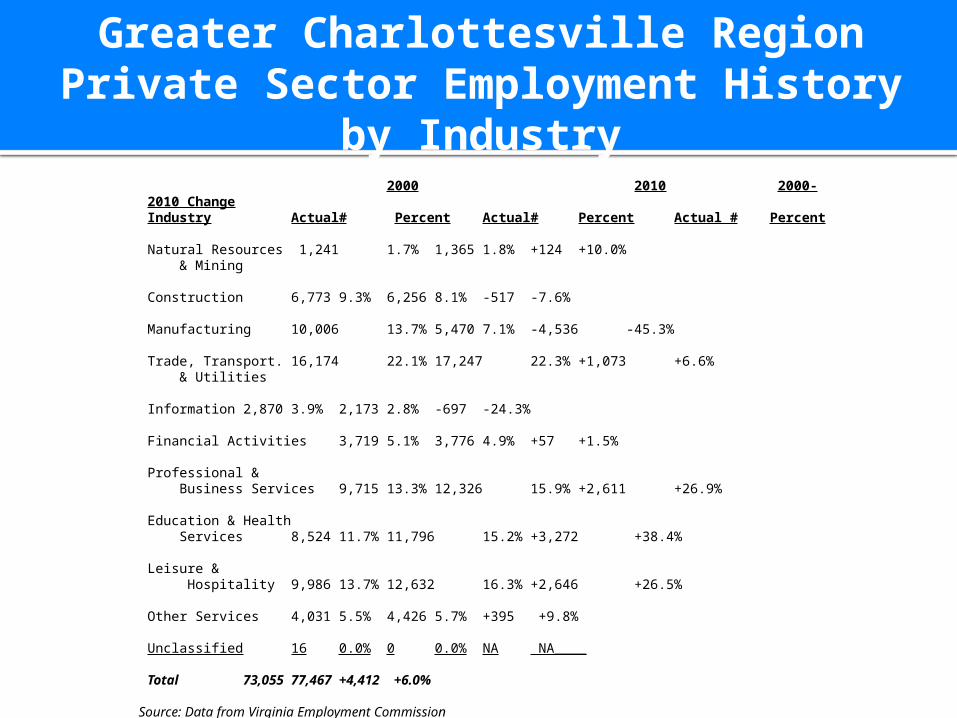
Greater Charlottesville Region Private Sector Employment History by Industry
2000 2010 2000-2010 Change
Industry Actual# Percent Actual# Percent Actual #Percent
Natural Resources 1,241 1.7% 1,365 1.8% +124+10.0% & Mining
Construction 6,773 9.3% 6,256 8.1% -517 -7.6%
Manufacturing 10,006 13.7% 5,470 7.1% -4,536 -45.3%
Trade, Transport. 16,174 22.1% 17,247 22.3% +1,073+6.6% & Utilities
Information 2,870 3.9% 2,173 2.8% -697 -24.3%
Financial Activities 3,719 5.1% 3,776 4.9% +57+1.5%
Professional & Business Services 9,715 13.3% 12,326 15.9% +2,611+26.9%
Education & Health Services 8,524 11.7% 11,796 15.2% +3,272 +38.4%
Leisure & Hospitality 9,986 13.7% 12,632 16.3% +2,646 +26.5%
Other Services 4,031 5.5% 4,426 5.7% +395 +9.8%
Unclassified 16 0.0% 0 0.0% NA NA____
Total 73,055 77,467 +4,412 +6.0%
Source: Data from Virginia Employment Commission
Page 11
Changes in Private Sector Employement by Industry Greater Charlottesville Region & State of Virginia
2000-2010 Percent Change Industry Region State
Natural Resources & Mining +10.0% -13.6%
Construction -7.6% -12.8%
Manufacturing -45.3% -36.0%
Trade, Transport. & Utilities +6.6% -4.3%
Information -24.3% -35.4%
Financial Activities +1.5% -2.5%
Professional & Business Serv. +26.9% +14.8%
Education & Health Services +38.4% +40.2%
Leisure & Hospitality +26.5% +14.8%
Other Services +9.8% +5.2%
Unclassified NA NA____
Total +6.0% +0.8%
Data for Virginia is for the State outside of the Greater Charlottesville Region Source: Data from Virginia Employment Commission
Page 12
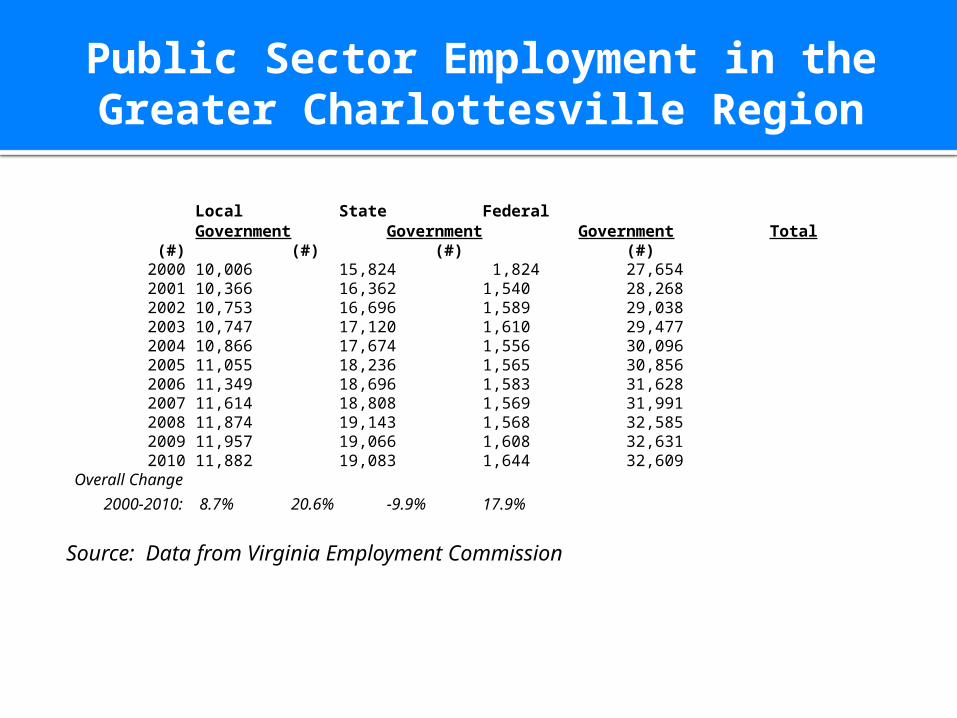
Public Sector Employment in the Greater Charlottesville Region
Local State Federal Government Government Government
Total (#) (#) (#) (#)
2000 10,006 15,824 1,82427,654
2001 10,366 16,362 1,54028,268
2002 10,753 16,696 1,58929,038
2003 10,747 17,120 1,61029,477
2004 10,866 17,674 1,55630,096
2005 11,055 18,236 1,56530,856
2006 11,349 18,696 1,58331,628
2007 11,614 18,808 1,56931,991
2008 11,874 19,143 1,56832,585
2009 11,957 19,066 1,60832,631
2010 11,882 19,083 1,64432,609
Overall Change
2000-2010: 8.7% 20.6% -9.9% 17.9%
Source: Data from Virginia Employment Commission
Page 13
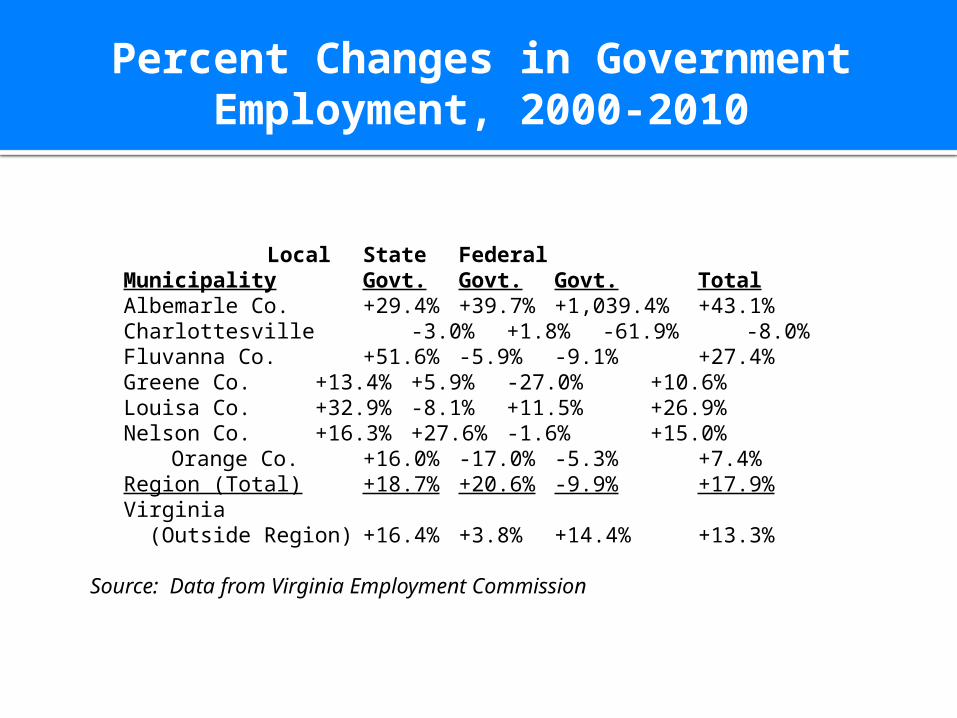
Percent Changes in Government Employment, 2000-2010
Local State Federal Municipality Govt. Govt. Govt. TotalAlbemarle Co. +29.4% +39.7% +1,039.4% +43.1%Charlottesville -3.0% +1.8% -61.9% -8.0%Fluvanna Co. +51.6% -5.9% -9.1% +27.4%Greene Co. +13.4% +5.9% -27.0% +10.6%Louisa Co. +32.9% -8.1% +11.5% +26.9%Nelson Co. +16.3% +27.6% -1.6% +15.0%
Orange Co. +16.0% -17.0% -5.3% +7.4%Region (Total) +18.7% +20.6% -9.9% +17.9%Virginia (Outside Region) +16.4% +3.8% +14.4% +13.3%
Source: Data from Virginia Employment Commission
Page 14
Change in Overall EmploymentGreater Charlottesville & State of Virginia
Page 15
The Chamber Jobs Report - 2011
Early and incomplete employment indicators suggest that a modest jobs
rebound has occurred during the first six months of 2011 as the region’s
unemployment rate has dropped below 2010. The Report indicates that a 2011
jobs growth rebound within the Greater Charlottesville region could be +/-1.5%.