141 DEEP AND SHALLOW STRUCTURES OF GEOTHERMAL SEULAWAH AGAM BASED ON ELECTROMAGNETIC AND MAGNETIC DATA Marwan 1,2 , Muhammad Syukri 2 , Rinaldi Idroes 3 , *Nazli Ismail 2 1 Graduate School of Mathematics and Applied Sciences, Syiah Kuala University, Indonesia 2 Department of Geophysical Engineering, Faculty of Engineering, Syiah Kuala University, Indonesia 3 Department of Chemistry, Faculty of Mathematics and Natural Sciences, Syiah Kuala University, Indonesia *Corresponding Author, Received: 05 Nov. 2018, Revised: 07 Dec. 2018, Accepted: 22 Dec. 2018 ABSTRACT: Indonesia is a country with the largest geothermal reserves in the world, but exploration and utilization of geothermal energy are still low. As an effort in increasing exploration process, an integrated geophysical method to image the subsurface structure of the geothermal system has been done at Seulawah Agam Geothermal Field, Aceh Province, Indonesia. Very low frequency (VLF-R) method was used for shallow and magnetotellurics method for deep structures studies in the area. The magnetic method was used for a complementary of the electromagnetic methods. Magnetotelluric data were acquired at ten stations along a 30 km distance profile crossing the Seulawah Agam volcano in a north-south direction. The VLV-R and Magnetic stations were measured on the Ie Ju manifestation area only, located at the northern slope of the volcano. The magnetic and VLF-R methods have been able to investigate the local structure, while the regional structure of subsurface is described by the magnetotelluric method. 2D resistivity model of magnetotelluric data shows a conceptual model of the geothermal system based on resistivity variation. The model also reveals two local faults crossing the volcano in a northwest-southeast direction. Most of the geothermal manifestations in Seulawah Agam are controlled these faults. Application of VLF-R and magnetic methods on the Ie Ju manifestation area has shown clearly near surface structures of the area. The inverted models have strong agreement with a reduction to the pole of total magnetic field anomalies. Presence of the conductors in the resistivity models coincides with low total magnetic field anomalies. In addition, the total magnetic field anomalies map can be also used to locate the presence of geothermal manifestation with or without their appearance on the surface Keywords: Magnetotellurics, Total magnetic field anomaly, VLF-R, 2D resistivity model, Geothermal, Volcano 1. INTRODUCTION Utilization of geothermal energy, especially for the power plant, may reduce people's dependence on the use of fossil fuels and help to preserve natural resources in the future [1]. Geothermal energy is environmentally friendly and can be renewed [2]. The utilization of geothermal energy has also increased rapidly over the past three decades [3]. On the other hand, most of the world's energy needs still depend on fossil energy. Therefore, efforts are needed to find potential new geothermal resources, especially for Indonesia as a country with the largest geothermal reserves in the world. Seulawah Agam is one of the geothermal prospecting areas that potentially developed for a future power plant in Aceh Province, Indonesia. About 165 MWe is estimated from this geothermal field [4]. However, the area has not been completely explored yet. A comprehensive study for geothermal exploration in the area is needed to acquire a comprehensive information for future development. Geophysical detection and monitoring of reservoirs with several kilometres in depth is the key to the exploration of geothermal energy [5]. However, only a few references are found for subsurface studies of Seulawah Agam Geothermal Field based on geophysical methods. Most of them are still as preliminary studies [6,7]. To complete the geophysical studies, in this paper, a combination of electromagnetic and magnetic methods to image the subsurface structure of the geothermal system was present in the study area. Electromagnetic methods (EM) have been widely applied in geothermal exploration because they are sensitive to the presence of conductive materials beneath subsurface. Geothermal reservoir systems are generally characterized by relatively high electrical conductivity properties with the presence of alterations to clay minerals, fault structure and geothermal fluids. We have been successfully used very low frequency (VLF-R) and magnetotellurics methods for shallow and deep structures studies in the area, respectfully. Magnetotellurics method is a favourable technique for geothermal exploration. Its ability to penetrate to the deeper part of the subsurface and to image conceptual model of a geothermal system made the method suitable for advance geothermal International Journal of GEOMATE, Jan., 2019 Vol.16, Issue 53, pp.141 - 147 Geotec., Const. Mat. & Env., DOI: https://doi.org/10.21660/2019.53.17214 ISSN: 2186-2982 (Print), 2186-2990 (Online), Japan
Transcript
141
DEEP AND SHALLOW STRUCTURES OF GEOTHERMAL SEULAWAH AGAM BASED ON ELECTROMAGNETIC AND
MAGNETIC DATA
Marwan1,2, Muhammad Syukri2, Rinaldi Idroes3, *Nazli Ismail2
1Graduate School of Mathematics and Applied Sciences, Syiah Kuala University, Indonesia
2Department of Geophysical Engineering, Faculty of Engineering, Syiah Kuala University, Indonesia 3Department of Chemistry, Faculty of Mathematics and Natural Sciences, Syiah Kuala University, Indonesia
ABSTRACT: Indonesia is a country with the largest geothermal reserves in the world, but exploration and utilization of geothermal energy are still low. As an effort in increasing exploration process, an integrated geophysical method to image the subsurface structure of the geothermal system has been done at Seulawah Agam Geothermal Field, Aceh Province, Indonesia. Very low frequency (VLF-R) method was used for shallow and magnetotellurics method for deep structures studies in the area. The magnetic method was used for a complementary of the electromagnetic methods. Magnetotelluric data were acquired at ten stations along a 30 km distance profile crossing the Seulawah Agam volcano in a north-south direction. The VLV-R and Magnetic stations were measured on the Ie Ju manifestation area only, located at the northern slope of the volcano. The magnetic and VLF-R methods have been able to investigate the local structure, while the regional structure of subsurface is described by the magnetotelluric method. 2D resistivity model of magnetotelluric data shows a conceptual model of the geothermal system based on resistivity variation. The model also reveals two local faults crossing the volcano in a northwest-southeast direction. Most of the geothermal manifestations in Seulawah Agam are controlled these faults. Application of VLF-R and magnetic methods on the Ie Ju manifestation area has shown clearly near surface structures of the area. The inverted models have strong agreement with a reduction to the pole of total magnetic field anomalies. Presence of the conductors in the resistivity models coincides with low total magnetic field anomalies. In addition, the total magnetic field anomalies map can be also used to locate the presence of geothermal manifestation with or without their appearance on the surface Keywords: Magnetotellurics, Total magnetic field anomaly, VLF-R, 2D resistivity model, Geothermal, Volcano 1. INTRODUCTION
Utilization of geothermal energy, especially for the power plant, may reduce people's dependence on the use of fossil fuels and help to preserve natural resources in the future [1]. Geothermal energy is environmentally friendly and can be renewed [2]. The utilization of geothermal energy has also increased rapidly over the past three decades [3]. On the other hand, most of the world's energy needs still depend on fossil energy. Therefore, efforts are needed to find potential new geothermal resources, especially for Indonesia as a country with the largest geothermal reserves in the world.
Seulawah Agam is one of the geothermal prospecting areas that potentially developed for a future power plant in Aceh Province, Indonesia. About 165 MWe is estimated from this geothermal field [4]. However, the area has not been completely explored yet. A comprehensive study for geothermal exploration in the area is needed to acquire a comprehensive information for future development.
Geophysical detection and monitoring of reservoirs with several kilometres in depth is the
key to the exploration of geothermal energy [5]. However, only a few references are found for subsurface studies of Seulawah Agam Geothermal Field based on geophysical methods. Most of them are still as preliminary studies [6,7]. To complete the geophysical studies, in this paper, a combination of electromagnetic and magnetic methods to image the subsurface structure of the geothermal system was present in the study area.
Electromagnetic methods (EM) have been widely applied in geothermal exploration because they are sensitive to the presence of conductive materials beneath subsurface. Geothermal reservoir systems are generally characterized by relatively high electrical conductivity properties with the presence of alterations to clay minerals, fault structure and geothermal fluids. We have been successfully used very low frequency (VLF-R) and magnetotellurics methods for shallow and deep structures studies in the area, respectfully.
Magnetotellurics method is a favourable technique for geothermal exploration. Its ability to penetrate to the deeper part of the subsurface and to image conceptual model of a geothermal system made the method suitable for advance geothermal
International Journal of GEOMATE, Jan., 2019 Vol.16, Issue 53, pp.141 - 147 Geotec., Const. Mat. & Env., DOI: https://doi.org/10.21660/2019.53.17214 ISSN: 2186-2982 (Print), 2186-2990 (Online), Japan
International Journal of GEOMATE, Jan., 2019 Vol.16, Issue 53, pp.141 - 147
142
exploration [8]. On the other hand, other geophysical approaches, such as gravity and magnetic methods are mostly used for the preliminary study.
However, an integrated geophysical method will be effectively applied [9] to identify the subsurface structures of geothermal prospecting in the area as well as their manifestations such as fumarole, mudflow and hot spring [10]. The magnetic and VLF-R methods are presented in this paper to study the local structure, as a comparison to the regional structure of subsurface obtained by the magnetotellurics method.
Seulawah Agam is an active volcano located at northern Sumatra Island, Indonesia. The existence of the Sunda Megathrust at the eastern side of the Sumatra Island caused the area is tectonically active. There are 30 volcanoes found along the island, only a few of them have been developed for geothermal power plant [9]. In the northern tip of Sumatra, namely Aceh Province, at least there are four potential geothermal fields including Seulawah Agam Volcano. The volcano is located in Seulimeum, Great Aceh District, Aceh Province.
Seulawah Agam geothermal field is located in high volcanic terrain, i.e. 1500 m above mean sea level. In such elevation, the location of the heat source and reservoirs are relatively deep within the earth. The magnetotellurics method will be able to penetrate up to 10 km, therefore the method is
suitable to be applied for Seulawah Agam geothermal exploration. While the VLF and magnetic methods are used here for near surface investigation. The methods are applied in a selected geothermal manifestation field of Ie Ju in order to model shallow structures.
2. GEOLOGICAL SETTING
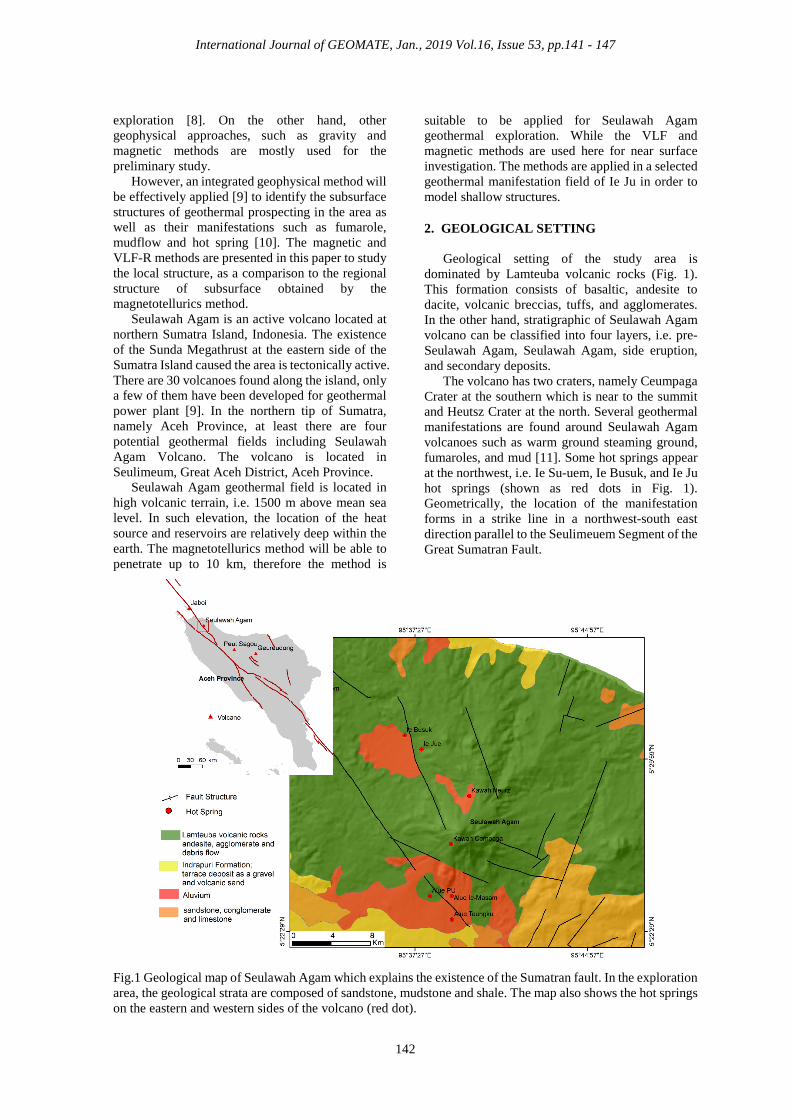
Geological setting of the study area is dominated by Lamteuba volcanic rocks (Fig. 1). This formation consists of basaltic, andesite to dacite, volcanic breccias, tuffs, and agglomerates. In the other hand, stratigraphic of Seulawah Agam volcano can be classified into four layers, i.e. pre-Seulawah Agam, Seulawah Agam, side eruption, and secondary deposits.
The volcano has two craters, namely Ceumpaga Crater at the southern which is near to the summit and Heutsz Crater at the north. Several geothermal manifestations are found around Seulawah Agam volcanoes such as warm ground steaming ground, fumaroles, and mud [11]. Some hot springs appear at the northwest, i.e. Ie Su-uem, Ie Busuk, and Ie Ju hot springs (shown as red dots in Fig. 1). Geometrically, the location of the manifestation forms in a strike line in a northwest-south east direction parallel to the Seulimeuem Segment of the Great Sumatran Fault.
Fig.1 Geological map of Seulawah Agam which explains the existence of the Sumatran fault. In the exploration area, the geological strata are composed of sandstone, mudstone and shale. The map also shows the hot springs on the eastern and western sides of the volcano (red dot).
International Journal of GEOMATE, Jan., 2019 Vol.16, Issue 53, pp.141 - 147
143
Tectonically, the subduction zone of Sunda Megathrust at the western of Sumatra makes the Great Sumatran Fault split into 20 segments. These segments extend about 1900 km from Lampung to Andaman Sea [12]. At the northern Sumatra, the Great Sumatran Fault divided into 2 branches, namely the Aceh fault and Seulimeuem fault. The Seulimeuem Fault crossing the Seulawah Agam volcano at the west (Fig. 2 insets; marked by a red line in the northwest-southeast).
3. METHODS AND DATA ACQUISITION Geophysical methods used in this study include
electromagnetics and magnetic methods. For the electromagnetic survey, we measured both; i.e. magnetotellurics and VLV-R methods to map deep
and shallow structures of the area, respectively. The magnetotellurics method is a passive electromagnetic survey used for mapping electrical resistivity distribution of the subsurface. The method measures natural electromagnetics source of the Earth [13]. The range of frequency from 0.0005 to 1 Hz used in magnetotellurics method allows us to penetrate to a deeper part of the Earth.
In practice, the method measures horizontal components of electric (E) and magnetic (H) fields simultaneously as a function of time. The time series data are transformed to the frequency domain using fast Fourier transform (FFT) process. The horizontal of electric and magnetic fields are connected by an impedance tensor (Z) where E = ZH. The tensor impedance consists of real (X) and imaginary (Y) parts, where Z = X + i Y.
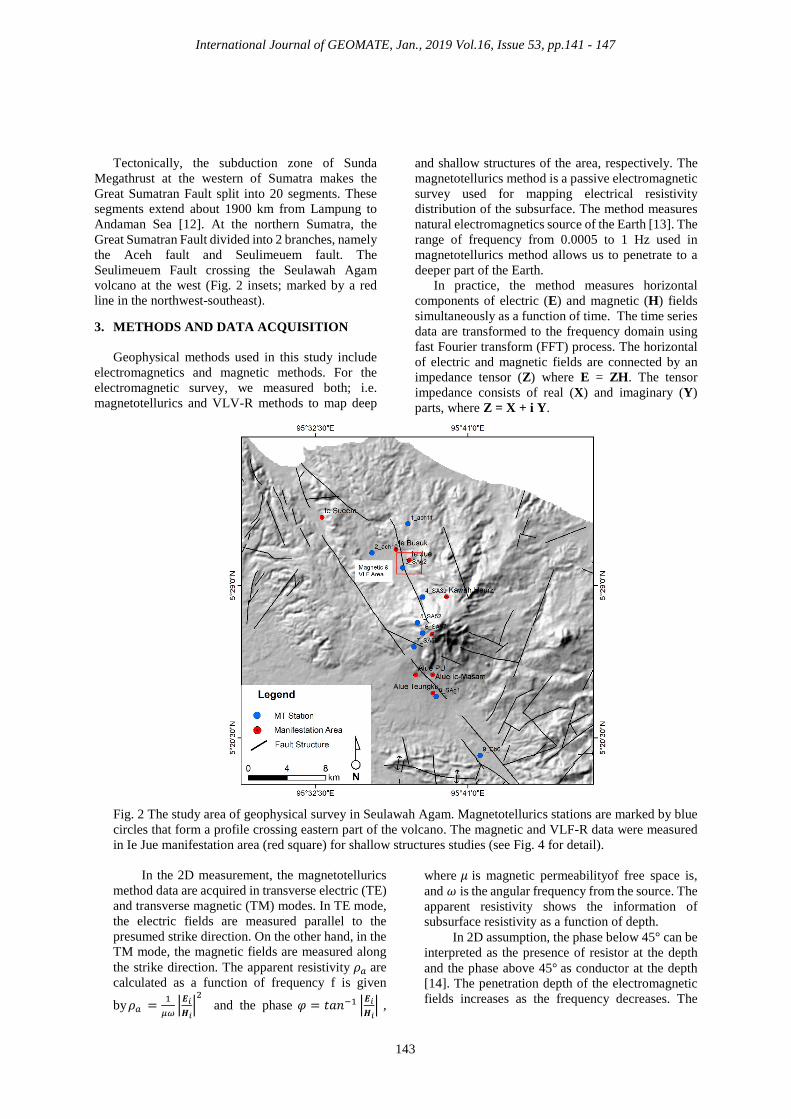
Fig. 2 The study area of geophysical survey in Seulawah Agam. Magnetotellurics stations are marked by blue circles that form a profile crossing eastern part of the volcano. The magnetic and VLF-R data were measured in Ie Jue manifestation area (red square) for shallow structures studies (see Fig. 4 for detail).
In the 2D measurement, the magnetotellurics
method data are acquired in transverse electric (TE) and transverse magnetic (TM) modes. In TE mode, the electric fields are measured parallel to the presumed strike direction. On the other hand, in the TM mode, the magnetic fields are measured along the strike direction. The apparent resistivity 𝜌𝜌𝑎𝑎 are calculated as a function of frequency f is given
by𝜌𝜌𝑎𝑎 = 1𝜇𝜇𝜇𝜇�𝑬𝑬𝑖𝑖𝑯𝑯𝑖𝑖�2
and the phase 𝜑𝜑 = 𝑡𝑡𝑡𝑡𝑡𝑡−1 �𝑬𝑬𝑖𝑖𝑯𝑯𝑖𝑖� ,
where 𝜇𝜇 is magnetic permeabilityof free space is, and 𝜔𝜔 is the angular frequency from the source. The apparent resistivity shows the information of subsurface resistivity as a function of depth.
In 2D assumption, the phase below 45° can be interpreted as the presence of resistor at the depth and the phase above 45° as conductor at the depth [14]. The penetration depth of the electromagnetic fields increases as the frequency decreases. The
International Journal of GEOMATE, Jan., 2019 Vol.16, Issue 53, pp.141 - 147
144
skin depth (δ) is written as δ = 503√𝜌𝜌𝑓𝑓 , where ρ is
the resistivity of the medium and f is the exploration frequency in Hertz [13].
The basic concept used in the magnetotelluric method is similar to the VLF-R method, except for source and range of frequency used. Radio transmitters operating in 15–30 kHz frequency bandwidth provides an electromagnetic source for the VLF-R method. The range of frequency used in VLF-R method allows us to gather information of shallow depth. The apparent resistivity 𝜌𝜌𝑎𝑎 and the phase angle ϕ between horizontal electric field and magnetic field of the subsurface may be defined as a function of frequency as in magnetotelluric method [15].
Magnetotelluric data acquisition were conducted from 2010 to 2014 using Phoenix Instrument. Ten stations of MT data were measured along a profile crossing the Seulawah Agam volcano in a north-south direction. Each station spent about 12 hours for data acquiring. Fig. 2 shows the distribution of the MT stations. Length of the MT profile is about 30 km with spacing between stations vary.
The VLV-R and magnetic stations were measured on the Ie Ju manifestation area only, located at the northern slope of Seulawah Agam volcano (see Fig. 2 and Fig. 4). The VLF-R data
were measured using the IRIS Instrument along two parallel profiles in a northwest-southeast direction. The frequencies used in this study were transmitted by JJI Japan (22300 Hz) and HWU France (18300 Hz). The frequency is acceptable at the measurement site with 60% signal quality, but the signal quality of 20% may already be used for exploration using VLF method. The measurement profiles were made to cross the area of manifestation. Length of the first profile is 110 meters while the second profile is 190 meters with 10 meters spacing between each station.
In the magnetic method, total magnetic field data were measured in an area of 50 m x 50 m that cover the Ie Ju geothermal manifestation area. We used GEM Instrument magnetometer for the total magnetic field measurement. The magnetic method used in this study aimed to complement the electromagnetic methods.
4. RESULT
Raw MT data measured from the field were
processed using software SSMT2000 produced by Phoenix Geophysics. Apparent resistivity and phase data for each station were obtained after this processing. Further smoothing and editing of the apparent resistivity and phase of impedance were performed using MT Editor.
Fig. 3 Resistivity section derived from 2D inversion of MT data. The MT profile was made crossing the two geothermal manifestation areas i.e. Ie Jue and Alue Pu. The black dotted line in the Fig. indicated as the fault where the thermal fluid exits towards the surface.
The 2D inversion of apparent resistivity and phase data was performed using Reduced basis Occam’s (Rebocc) inversion code [16]. We combined TE- and TM-mode data for the inversion. An RMS misfit of 5.2 was reached after 10 iterations. The inverted model is presented in Fig. 3. The 2D inverted model depicts a geothermal system of the subsurface based on resistivity variation. The model may include depth of heat source, reservoir
and clay cap layer. The resistivity model also shows two faults crossing the volcano. The existence of the faults in the geothermal field is considerably important. They allow the hydrothermal process within the system.
In agreement with a geological map of the area study (Fig. 2), the 2D resistivity model (Fig. 3) shows that Ie Ju manifestation is controlled by the local fault directed in northwest-south east. While
International Journal of GEOMATE, Jan., 2019 Vol.16, Issue 53, pp.141 - 147
145
some manifestations found at the south of Seulawah Agam volcano are related to another local fault as shown in our resistivity model. The lower resistivity values (<5 Ohm.m) at the middle along the profile (area in rectangular in Fig. 3) can be interpreted as alteration rocks known as clay cap. This layer
reaches a thickness about 1000 m with depth up to 1500 m sea level. Some geothermal manifestations appeared at the north and the south of the volcano are connected to the presence of reservoir that is found below the clay cap layer. Resistivity values of the reservoir range from 10 to 40 Ohm-m.
Fig. 4 Two-dimensional resistivity model of inverted VLF-Resistivity data along (a) profile 1 and (b) profile 2 that crossing the hot spring in the area. Detail of Two profiles of VLF-R showed by red lines, while the magnetic data (green dots) were measured in 50 x 50 meters grid covering the Ie Ju hot spring area.
NW
SE
N
International Journal of GEOMATE, Jan., 2019 Vol.16, Issue 53, pp.141 - 147
146
The VLF-R profiles were measured close to station 3 along the MT profile, i.e. within the Ie Ju manifestation. The apparent resistivity and phase of VLF-R data were also inverted using Rebocc inversion code [16]. The inversion reached an RMS misfit of 4.5 after 6 iterations. The 2D resistivity models of VLF-R data are shown in Fig. 4.
The low resistivity values at distance 100 to 120 meters and 60 meters along profile 1 can be interpreted as a weak zone. A manifestation as steaming ground found at distance 100 to 120 meters along profile 1 coincides with the conductive anomaly within it. The weak zones are dominated by cracks that allow fluids reached to the surface and seen as geothermal manifestation. A conductive anomaly is also found at distance 60 to 70 meters along profile 2 at depth 10 m. The weak zone at distance 60 m found along profile 1 is connected the zone along profile 2, geometrically. However, it does not show as a direction of the fault since the profiles are spaced too close (i.e. 20 meters) each other. The lowest resistivity zones at northwest along profile 1 and profile 2 are not in agreement with in presence of manifestation on the surface.
Even though a conductive anomaly showed within the earth, it will not arise to the surface when there is no path to the surface, such as cracks, fault, and pores.
The models shown in Fig. 4 are superimposed with total magnetic field anomalies sampled along the same profiles. We have seen very strong agreement between 2d inverted resistivity models of VLF-R data and reduction to the pole of a total magnetic anomaly. Conductive zones shown in the VLF-R models coincide with the presence of “U” shapes of the total magnetic field anomalies (see Fig. 4).
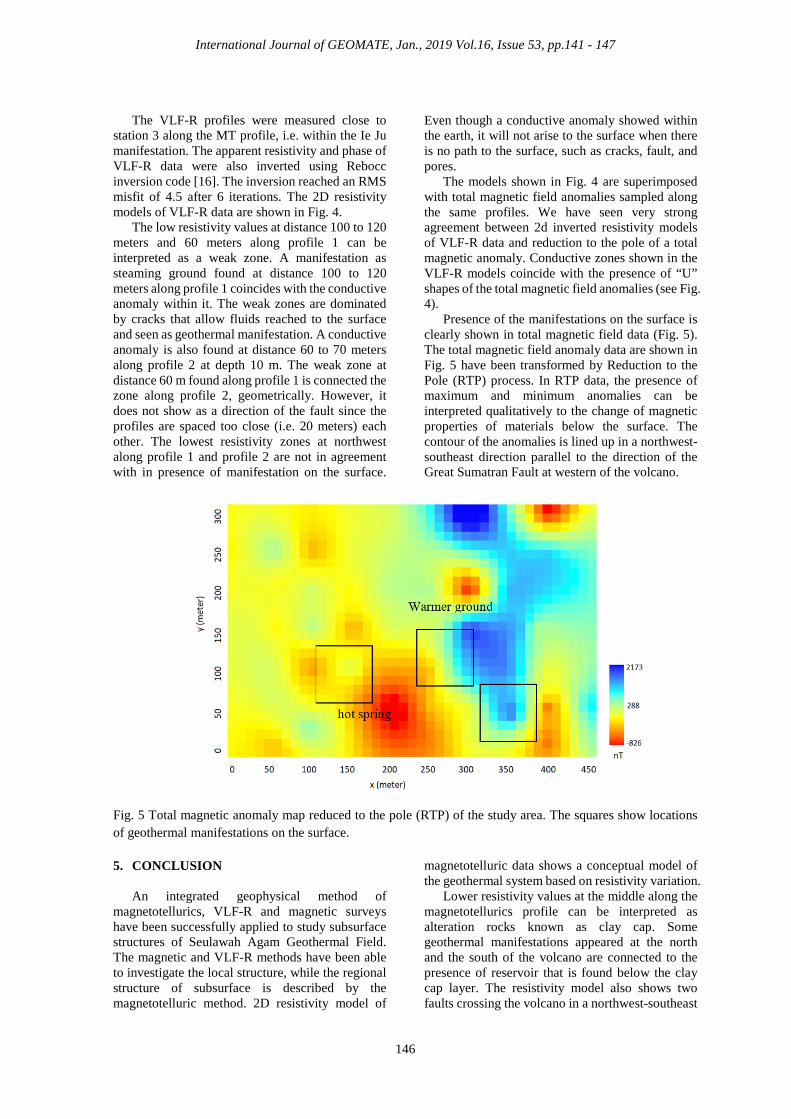
Presence of the manifestations on the surface is clearly shown in total magnetic field data (Fig. 5). The total magnetic field anomaly data are shown in Fig. 5 have been transformed by Reduction to the Pole (RTP) process. In RTP data, the presence of maximum and minimum anomalies can be interpreted qualitatively to the change of magnetic properties of materials below the surface. The contour of the anomalies is lined up in a northwest-southeast direction parallel to the direction of the Great Sumatran Fault at western of the volcano.
Fig. 5 Total magnetic anomaly map reduced to the pole (RTP) of the study area. The squares show locations of geothermal manifestations on the surface.
5. CONCLUSION
An integrated geophysical method of magnetotellurics, VLF-R and magnetic surveys have been successfully applied to study subsurface structures of Seulawah Agam Geothermal Field. The magnetic and VLF-R methods have been able to investigate the local structure, while the regional structure of subsurface is described by the magnetotelluric method. 2D resistivity model of
magnetotelluric data shows a conceptual model of the geothermal system based on resistivity variation. Lower resistivity values at the middle along the magnetotellurics profile can be interpreted as alteration rocks known as clay cap. Some geothermal manifestations appeared at the north and the south of the volcano are connected to the presence of reservoir that is found below the clay cap layer. The resistivity model also shows two faults crossing the volcano in a northwest-southeast
International Journal of GEOMATE, Jan., 2019 Vol.16, Issue 53, pp.141 - 147
147
direction. Most of the geothermal manifestations in Seulawah Agam are controlled these faults.
Application of VLF-R and magnetic methods on Ie Ju manifestation area has shown clearly near surface structures of the area. The 2D inverted resistivity models of VLF-R data imaged clearly location of conductive zones at near surface, even though they are not seen at the surface as geothermal manifestations. The inverted models have strong agreement with a reduction to the pole of total magnetic field anomalies. Presence of the conductors in the resistivity models coincides with low total magnetic field anomalies. In addition, the total magnetic field anomalies map can be also used to locate the presence of geothermal manifestation with or without their appearance on the surface.
6. REFERENCES
[1] Enrico B., Geothermal Energy Technology and Current Status: An Overview, Renewable and Sustainable Energy Reviews, Vol. 6, Issues 1–2, 2002, pp. 3-65.
[2] Ingrid S. and Kurt B., Geothermal Energy From Theoretical Models to Exploration and Development, Springer, 2013.
[3] Ingvar B. F., Geothermal Energy for the Benefit of the People, Renewable and Sustainable Energy Reviews, Vol. 5, Issue 3, 2001, pp. 299-312.
[4] ESDM, "Potensi Panas Bumi Aceh.," 2015. [Online]. Available: distamben.acehprov.go.id.
[5] Viacheslav S. and Adele M., Electromagnetic Sounding of Geothermal Zones, Journal of Applied Geophysics, 2009, pp. 459-478.
[6] Nazli I., Muhammad Y., Marwan and Muyassir, Electrical Resistivity Model of Seulawah Agam Volcano Based on Magnetotelluric Determinant Data, in The 7 th International Conference on Theoretical and Applied Physics (ICTAP), 2017.
[7] Marwan, Ibnu R., Gartika S. N. and Asrillah, Study of Seulawah Agam’s Geothermal
Source Using Gravity Method, Jurnal Natural, 2014.
[8] Yohannes L. D., Graham H., Stephan T. and Lars K., Magnetotelluric Monitoring of Permeability Enhancement at Enhanced Geothermal System Project, Geothermics, Vol. 66, 2017, pp. 23–38.
[9] Hochstein and Sayogi S., Geothermal Resources of Sumatra, Geothermics, Vol. 22, Issue 3, 1993, pp. 181-200.
[10] Janvier D. K., Noel D., Danwe R, Philippe N. N. and Abdouramani D., A Review of Geophysical Methods for Geothermal Exploration," Renewable and Sustainable Energy Reviews, 2015, pp. 87-95.
[11] Rinaldi I., Muhammad Y., M. A, Subhan, Andi L., Rivansyah S., Ghazi M. I. and Marwan, Geochemistry of Hot Springs in the Ie Seu’um Hydrothermal Areas at Aceh Besar District, Indonesia, in The 3rd International Conference on Chemical Engineering Sciences and Applications, 2018.
[12] Kerry S. and Danny N., Neotectonic of the Sumatran Fault Indonesia, Journal of Geophysical Research Atmospheres, Vol 105, Issue B12, 2000.
[13] Alan D. C. and Alan G. J., The Magnetotelluric Method Theory and Practice, Cambridge University Press, 2012.
[14] Keeva V., Electromagnetic Methods in Applied Geophysics, in Book of the magnetotelluric Method, Society of Exploration Geophysics, 1991, pp. 641-711.
[15] Louis C., Basic Theory of the Magneto-telluric Method of Geophysical Prospecting, Geophysics, 1953.
[16] Weerachai S. and Gary E., An Efficient Data-Subspace Inversion Method for 2-D Magnetotelluric Data," Geophysics, 2000, pp. 791-803.