Deep Bed Filters and Deep Bed Filters and High Rate Service High Rate Service R. Rhodes Trussell, Ph.D, P.E. R. Rhodes Trussell, Ph.D, P.E. http://www. http://www. trusselltech trusselltech .com .com Ca- Ca- Nv Nv AWWA, Sacramento Oct 14, 2004 AWWA, Sacramento Oct 14, 2004
Transcript
Deep Bed Filters andDeep Bed Filters andHigh Rate ServiceHigh Rate ServiceR. Rhodes Trussell, Ph.D, P.E.R. Rhodes Trussell, Ph.D, P.E.
Ca-Ca-Nv Nv AWWA, Sacramento Oct 14, 2004AWWA, Sacramento Oct 14, 2004
OutlineOutline
1.Understanding why filtration rate is an1.Understanding why filtration rate is animportant design considerationimportant design consideration
2. Understanding the relationship between2. Understanding the relationship betweenfilter performance, filter rate and filter mediafilter performance, filter rate and filter mediadesigndesign
3. A little bit about the technical constraints3. A little bit about the technical constraintsto high rate filtrationto high rate filtration
The Bottom LineThe Bottom Line
Deep filters can be operated at substantiallyDeep filters can be operated at substantiallyhigher rates than those customarily used inhigher rates than those customarily used indesigndesign
The most important risk in a well-operatedThe most important risk in a well-operatedhigh rate filter plant is not poor water quality,high rate filter plant is not poor water quality,but difficulties managing recycled flowsbut difficulties managing recycled flows
But first: the importance of chemicalBut first: the importance of chemicalconditioningconditioning
Why the chemistry is importantWhy the chemistry is important
Rapid filtration is accomplished by attachment ofRapid filtration is accomplished by attachment ofthe particles to the media, not the particles to the media, not ““filtrationfiltration”” (i.e. rapid(i.e. rapidfilters do not work by straining or size exclusion)filters do not work by straining or size exclusion)
Virtually all particles targeted for removal byVirtually all particles targeted for removal byfiltration are negatively charged and so is the filterfiltration are negatively charged and so is the filtermedia itselfmedia itself
Thus the particles and the media are not attractedThus the particles and the media are not attractedto each other, in fact they are repelled by eachto each other, in fact they are repelled by eachotherother
Thus, for rapid filtration to succeed, the surfaceThus, for rapid filtration to succeed, the surfacechemistry of these target particles must bechemistry of these target particles must bemodifiedmodified
Why make an issue out of theWhy make an issue out of thechemistry?chemistry?
Because itBecause it’’s important to remember that filter rates important to remember that filter rateis not the most important aspect of filter design oris not the most important aspect of filter design oroperationoperation
ItIt’’s the chemistrys the chemistry ItIt’’s important to keep in mind that no rapid filter wills important to keep in mind that no rapid filter will
perform well in removing particles if the chemistryperform well in removing particles if the chemistryis wrongis wrong
One bad thing about high rate filters is that, whenOne bad thing about high rate filters is that, whenthe chemistry is wrong, they produce the samethe chemistry is wrong, they produce the samebad water bad water fasterfaster
Why is filter rate important?Why is filter rate important?
Why is filter rate important?Why is filter rate important?
The answer is $$$The answer is $$$
The impact of filter rate on the active filterThe impact of filter rate on the active filtersurface that must be built for a 100 surface that must be built for a 100 mgd mgd plantplant
4,000
6,000
8,000
10,000
12,000
14,000
16,000
18,000
0 5 10 15 20
Filter Rate, gpm/sf
Filte
r are
a, sf
The impact of filter rate on the active filterThe impact of filter rate on the active filtersurface that must be built for a 100 surface that must be built for a 100 mgd mgd plantplant
4,000
6,000
8,000
10,000
12,000
14,000
16,000
18,000
0 5 10 15 20
Filter Rate, gpm/sf
Filte
r are
a, sf
The impact of filter rate on the active filterThe impact of filter rate on the active filtersurface that must be built for a 100 surface that must be built for a 100 mgd mgd plantplant
4,000
6,000
8,000
10,000
12,000
14,000
16,000
18,000
0 5 10 15 20
Filter Rate, gpm/sf
Fil
ter
are
a,
sf
The impact of filter rate on the active filterThe impact of filter rate on the active filtersurface that must be built for a 100 surface that must be built for a 100 mgd mgd plantplant
4,000
6,000
8,000
10,000
12,000
14,000
16,000
18,000
0 5 10 15 20
Filter Rate, gpm/sf
Filte
r are
a, sf
Chicago
The impact of filter rate on the active filterThe impact of filter rate on the active filtersurface that must be built for a 100 surface that must be built for a 100 mgd mgd plantplant
4,000
6,000
8,000
10,000
12,000
14,000
16,000
18,000
0 5 10 15 20
Filter Rate, gpm/sf
Filte
r are
a, sf
Chicago
Most in CA
The impact of filter rate on the active filterThe impact of filter rate on the active filtersurface that must be built for a 100 surface that must be built for a 100 mgd mgd plantplant
4,000
6,000
8,000
10,000
12,000
14,000
16,000
18,000
0 5 10 15 20
Filter Rate, gpm/sf
Filte
r are
a, sf
Chicago
Prospect, Sydney
LAAFP
Most in CA
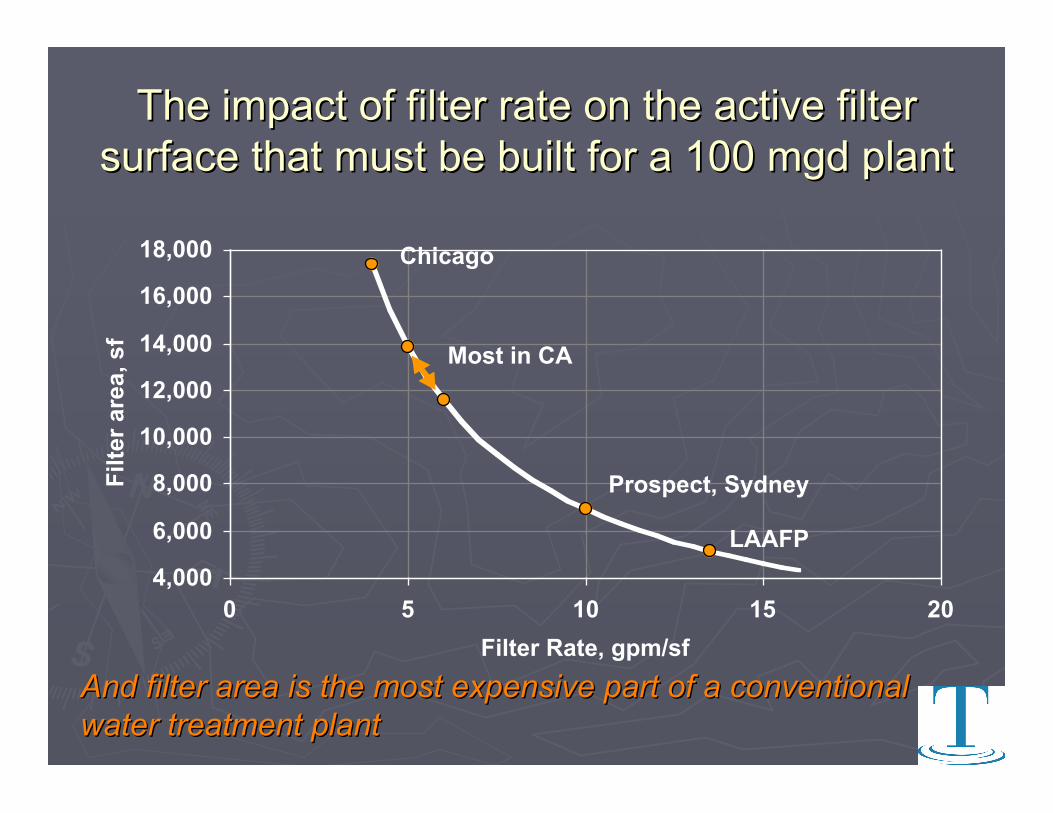
Between the rates used at Chicago and Los Angeles, theBetween the rates used at Chicago and Los Angeles, therequired filter area changes by more than 3Xrequired filter area changes by more than 3X
The impact of filter rate on the active filterThe impact of filter rate on the active filtersurface that must be built for a 100 surface that must be built for a 100 mgd mgd plantplant
4,000
6,000
8,000
10,000
12,000
14,000
16,000
18,000
0 5 10 15 20
Filter Rate, gpm/sf
Filte
r are
a, sf
Chicago
Prospect, Sydney
LAAFP
Most in CA
And filter area is the most expensive part of a conventionalAnd filter area is the most expensive part of a conventionalwater treatment plantwater treatment plant
The relationship between filterThe relationship between filterperformance, filter rate and filterperformance, filter rate and filter
media designmedia design
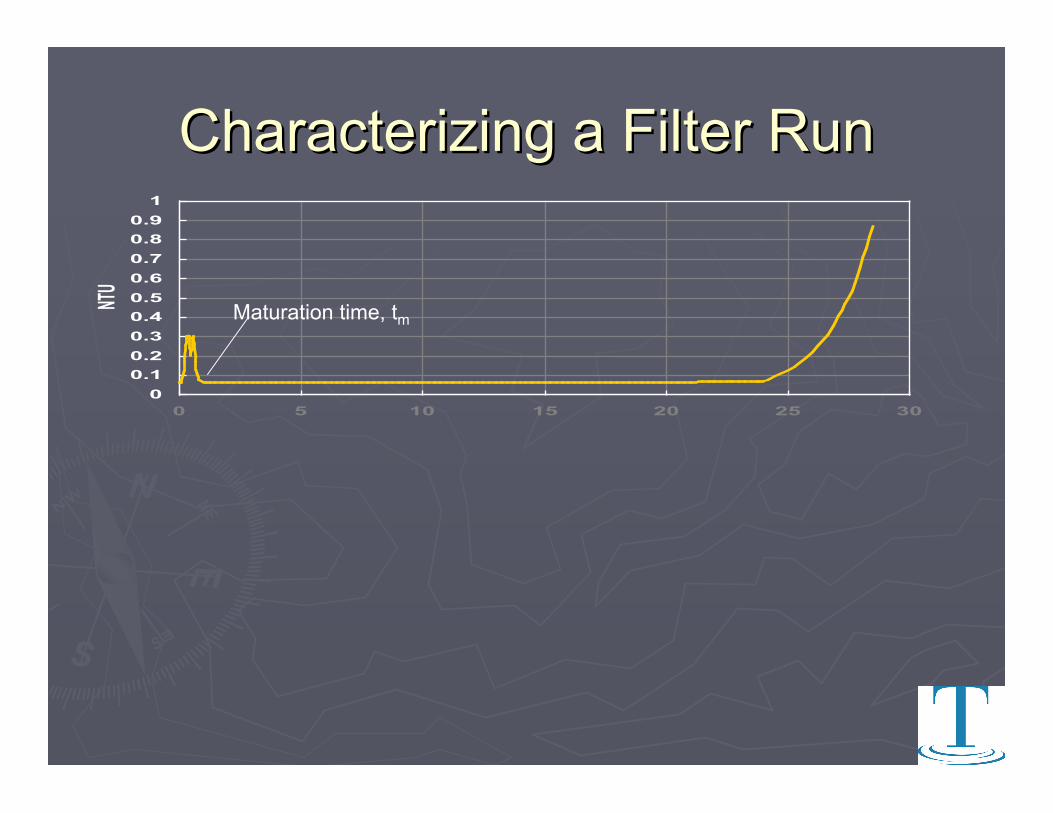
Characterizing a Filter RunCharacterizing a Filter Run
0
0.1
0.2
0.3
0.4
0.5
0.6
0.7
0.8
0.9
1
0 5 10 15 20 25 30
NTU
Filter run timeFilter run time
Characterizing a Filter RunCharacterizing a Filter Run
0
0.1
0.2
0.3
0.4
0.5
0.6
0.7
0.8
0.9
1
0 5 10 15 20 25 30
NTU
Maturation time, tm
Characterizing a Filter RunCharacterizing a Filter Run
0
0.1
0.2
0.3
0.4
0.5
0.6
0.7
0.8
0.9
1
0 5 10 15 20 25 30
NTU
Maturation time, tmOperating Turbidity, TO
Characterizing a Filter RunCharacterizing a Filter Run
0
0.1
0.2
0.3
0.4
0.5
0.6
0.7
0.8
0.9
1
0 5 10 15 20 25 30
NTU
Maturation time, tm
Time to breakthrough, tb
Operating Turbidity, TO
Characterizing a Filter RunCharacterizing a Filter Run
0
0.1
0.2
0.3
0.4
0.5
0.6
0.7
0.8
0.9
1
0 5 10 15 20 25 30
NTU
0
10
20
30
40
50
60
70
80
0 5 10 15 20 25 30
Run Time, hours
Head
loss
, inc
hes
Maturation time, tm
Time to breakthrough, tb
Operating Turbidity, TO
Characterizing a Filter RunCharacterizing a Filter Run
0
0.1
0.2
0.3
0.4
0.5
0.6
0.7
0.8
0.9
1
0 5 10 15 20 25 30
NTU
0
10
20
30
40
50
60
70
80
0 5 10 15 20 25 30
Run Time, hours
Head
loss
, inc
hes
ΔHo
Maturation time, tm
Time to breakthrough, tb
Operating Turbidity, TO
Characterizing a Filter RunCharacterizing a Filter Run
0
0.1
0.2
0.3
0.4
0.5
0.6
0.7
0.8
0.9
1
0 5 10 15 20 25 30
NTU
0
10
20
30
40
50
60
70
80
0 5 10 15 20 25 30
Run Time, hours
Head
loss
, inc
hes
ΔHo
Maturation time, tm
Time to breakthrough, tb
Time to design headloss, th
Operating Turbidity, TO
Characterizing a Filter RunCharacterizing a Filter Run
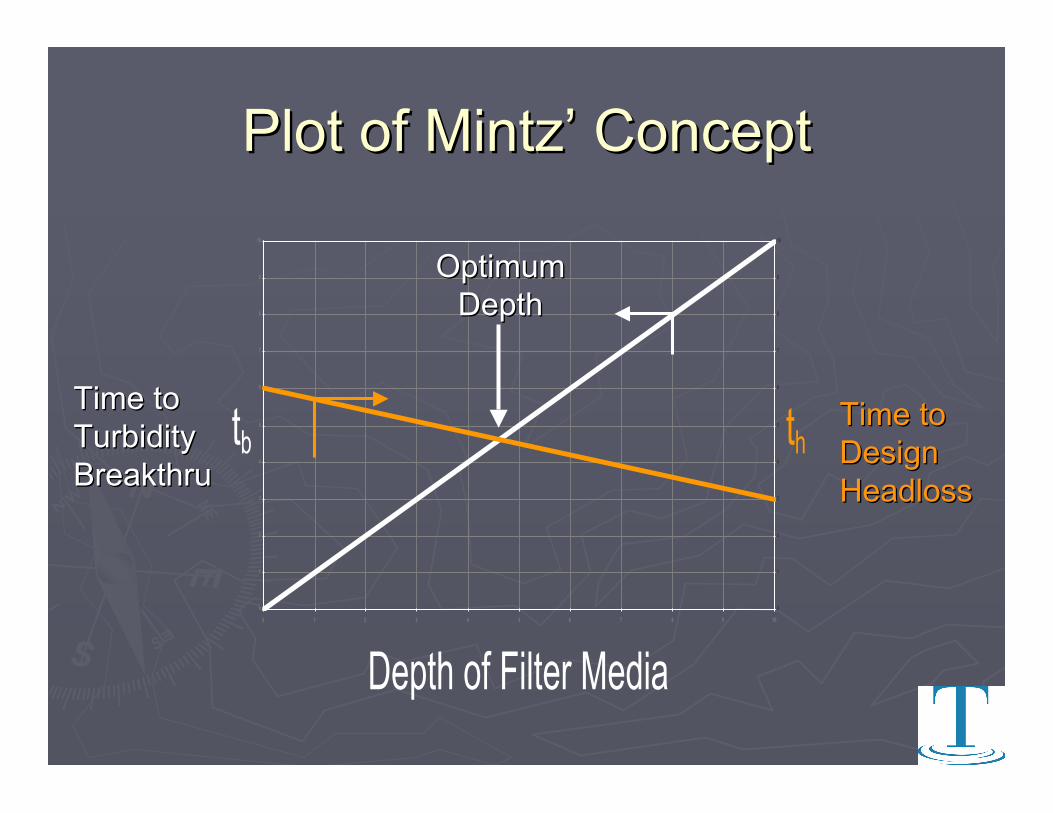
Region of Region of Possible OperationPossible Operation
OptimumOptimumDepthDepth
LetLet’’s look at some real data tos look at some real data toverify verify MintzMintz’’ conceptconcept
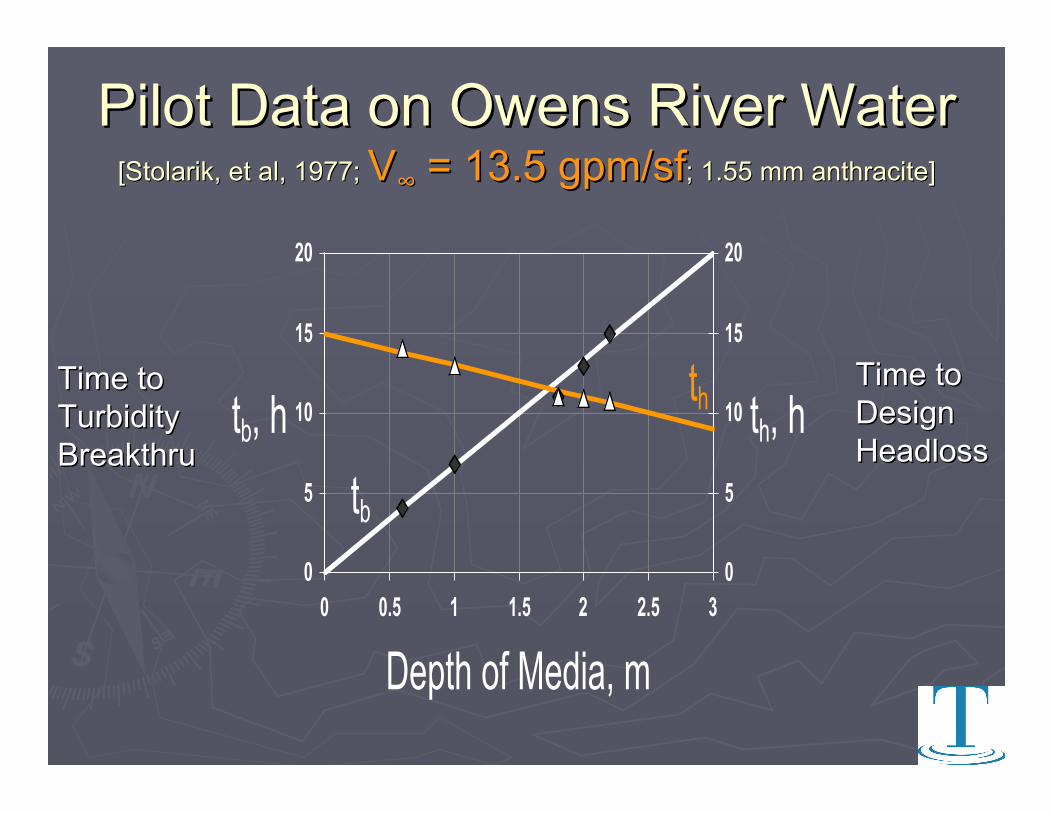
Pilot Data on Owens River WaterPilot Data on Owens River Water[[StolarikStolarik, et al, 1977; , et al, 1977; VV∞∞ = 13.5 gpm/sf = 13.5 gpm/sf; 1.55 mm anthracite]; 1.55 mm anthracite]
0
5
10
15
20
0 0.5 1 1.5 2 2.5 3
Depth of Media, m
tb, h
0
5
10
15
20
th, hth
tb
Time toTime toTurbidityTurbidityBreakthruBreakthru
Time toTime toDesignDesignHeadlossHeadloss
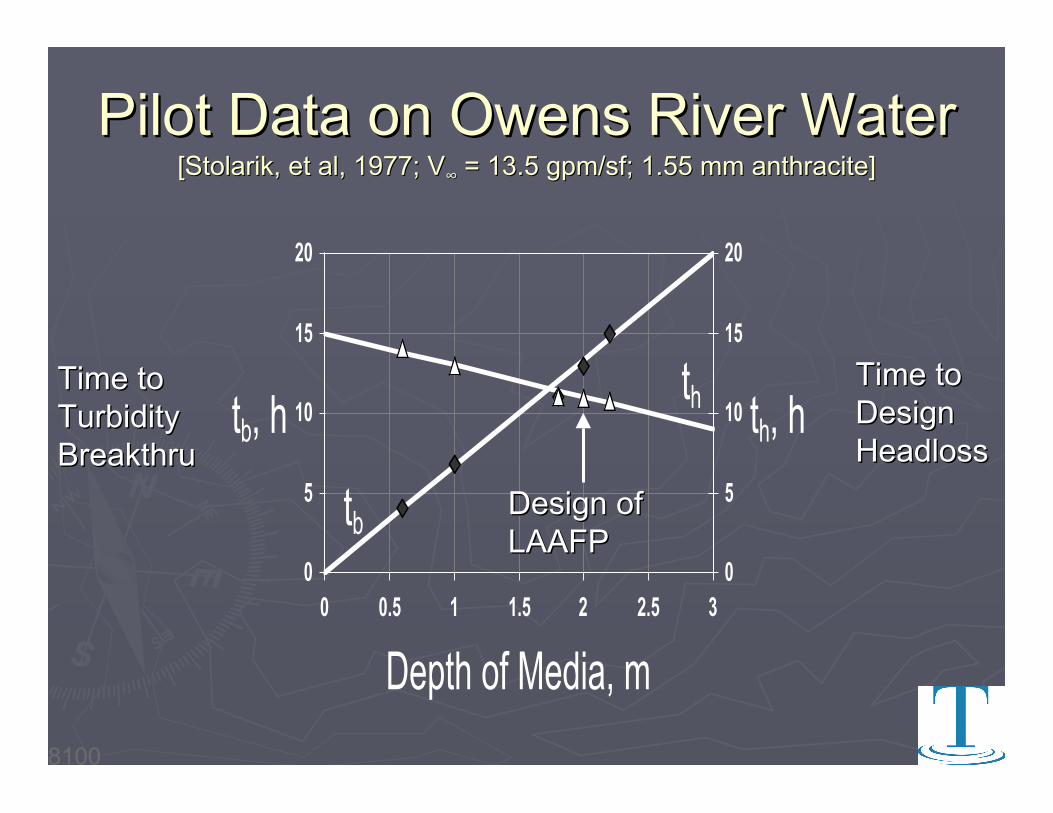
Pilot Data on Owens River WaterPilot Data on Owens River Water[[StolarikStolarik, et al, 1977; V, et al, 1977; V∞∞ = 13.5 gpm/sf; 1.55 mm anthracite] = 13.5 gpm/sf; 1.55 mm anthracite]
Pilot Data on Owens River WaterPilot Data on Owens River Water[[StolarikStolarik, et al, 1977; V, et al, 1977; V∞∞ = 13.5 gpm/sf; 1.55 mm anthracite] = 13.5 gpm/sf; 1.55 mm anthracite]
Time toTime toDesignDesignHeadlossHeadlossLLoptopt
105 in.105 in.
40500
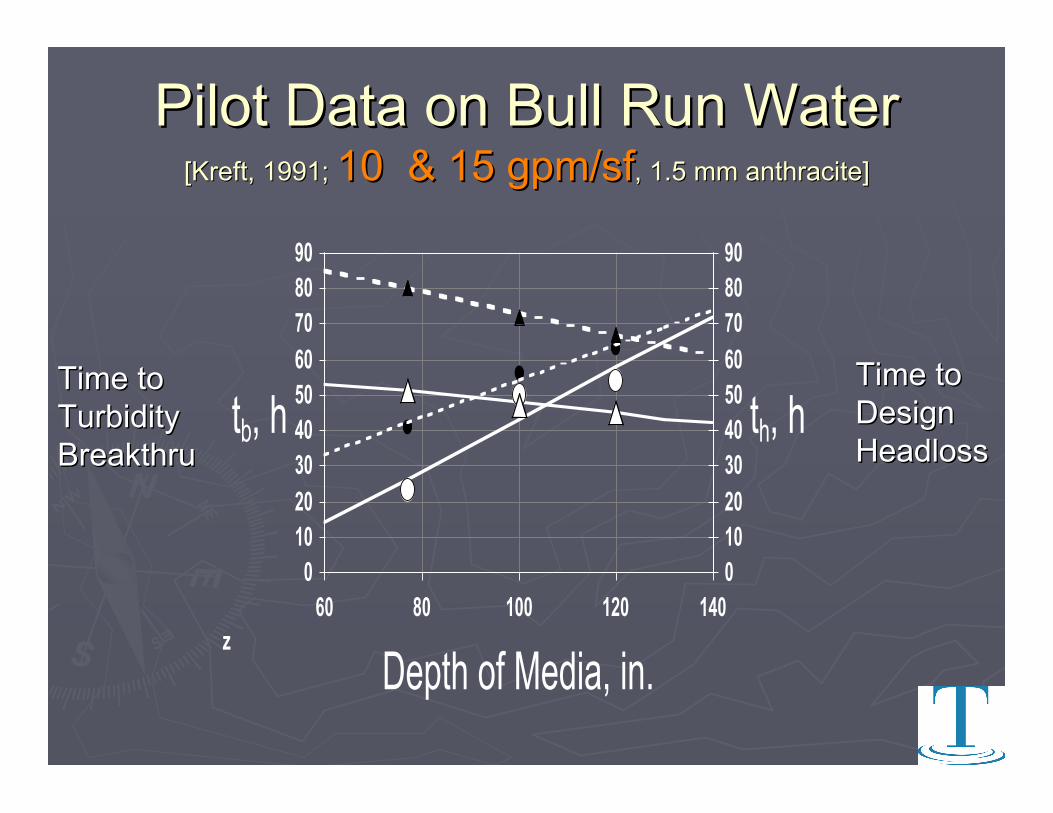
Pilot Data on Bull Run WaterPilot Data on Bull Run Water[[KreftKreft, 1991; , 1991; 10 & 15 gpm/sf10 & 15 gpm/sf, 1.5 mm anthracite], 1.5 mm anthracite]
0
10
20
30
40
50
60
70
80
90
60 80 100 120 140
Depth of Media, in.
tb, h
0
10
20
30
40
50
60
70
80
90
th, h
z
Time toTime toTurbidityTurbidityBreakthruBreakthru
Time toTime toDesignDesignHeadlossHeadloss
Increasing the filter rate:Increasing the filter rate:1)1) Modestly reduces the time to breakthroughModestly reduces the time to breakthrough
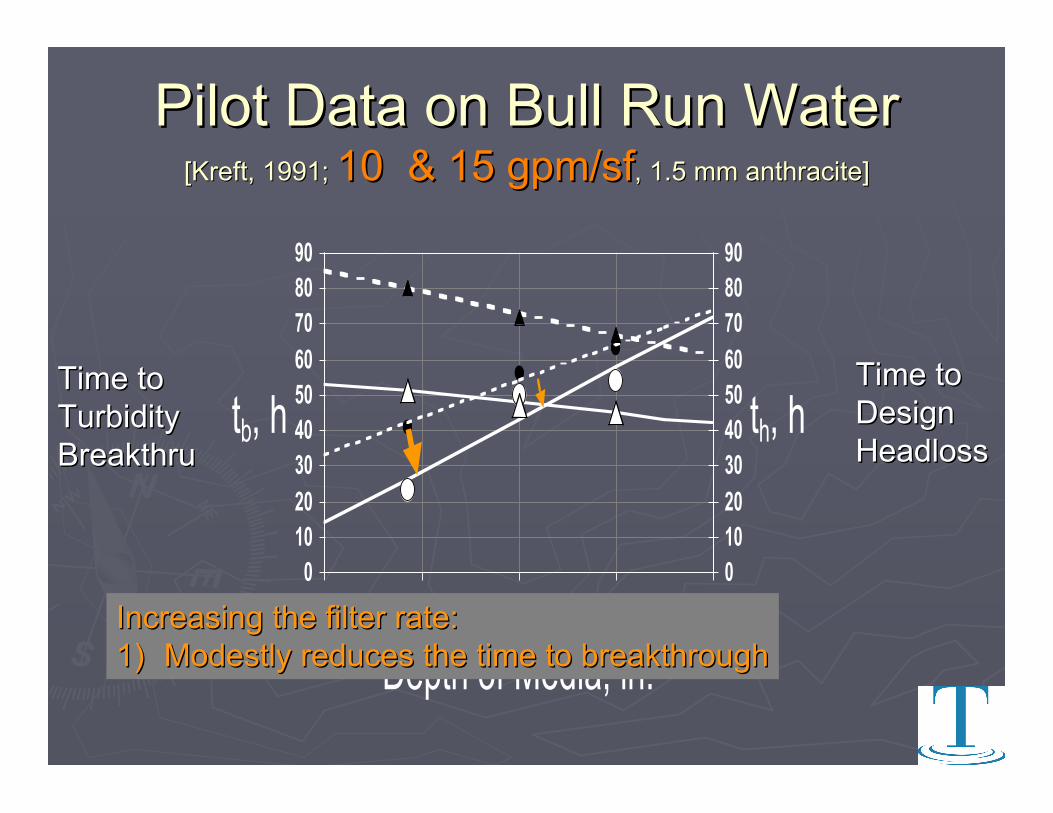
Pilot Data on Bull Run WaterPilot Data on Bull Run Water[[KreftKreft, 1991; , 1991; 10 & 15 gpm/sf10 & 15 gpm/sf, 1.5 mm anthracite], 1.5 mm anthracite]
0
10
20
30
40
50
60
70
80
90
60 80 100 120 140
Depth of Media, in.
tb, h
0
10
20
30
40
50
60
70
80
90
th, h
z
Time toTime toTurbidityTurbidityBreakthruBreakthru
Time toTime toDesignDesignHeadlossHeadloss
Increasing the filter rate:Increasing the filter rate:1)1) Modestly reduces the time to breakthrough andModestly reduces the time to breakthrough and2)2) Substantially reduces the time to headlossSubstantially reduces the time to headloss
Pilot Data on Bull Run WaterPilot Data on Bull Run Water[[KreftKreft, 1991; , 1991; 10 & 15 gpm/sf10 & 15 gpm/sf, 1.5 mm anthracite], 1.5 mm anthracite]
0
10
20
30
40
50
60
70
80
90
60 80 100 120 140
Depth of Media, in.
tb, h
0
10
20
30
40
50
60
70
80
90
th, h
z
Time toTime toTurbidityTurbidityBreakthruBreakthru
Time toTime toDesignDesignHeadlossHeadloss
Increasing the filter rate:Increasing the filter rate:1)1) Modestly reduces the time to breakthrough andModestly reduces the time to breakthrough and2)2) Substantially reduces the time to headlossSubstantially reduces the time to headloss3)3) Resulting in a lower optimum depth and shorter runsResulting in a lower optimum depth and shorter runs
Pilot Data on Bull Run WaterPilot Data on Bull Run Water[[KreftKreft, 1991; , 1991; 10 & 15 gpm/sf10 & 15 gpm/sf, 1.5 mm anthracite], 1.5 mm anthracite]
0
10
20
30
40
50
60
70
80
90
60 80 100 120 140
Depth of Media, in.
tb, h
0
10
20
30
40
50
60
70
80
90
th, h
z
Time toTime toTurbidityTurbidityBreakthruBreakthru
Time toTime toDesignDesignHeadlossHeadloss
But this comparison based on filter run time isnBut this comparison based on filter run time isn’’t reallyt reallyan accurate portrayal of efficiency because the filter an accurate portrayal of efficiency because the filter running at 15 gpm/sf produces 50% more water in the running at 15 gpm/sf produces 50% more water in the same time period. What happens if we compare both same time period. What happens if we compare both filters on the basis of gallons/sf-run?`filters on the basis of gallons/sf-run?`
Pilot Data on Bull Run WaterPilot Data on Bull Run Water[[KreftKreft, 1991; , 1991; 10 & 10 & 1515 gpm/sf gpm/sf, 1.5 mm anthracite], 1.5 mm anthracite]
0
10,000
20,000
30,000
40,000
50,000
60,000
70,000
60 80 100 120 140
Depth of Media, in.
FRVbgal/sf
0
10,000
20,000
30,000
40,000
50,000
60,000
70,000
FRVhgal/sf
z
Filter RunFilter RunVolumeVolumeto to BrkthruBrkthru
Filter RunFilter RunVolumeVolumeto to HdlossHdloss
Here are the same dataHere are the same data replotted replotted with run time convertedwith run time convertedto filter run volume (FRV), expressed as gallons/sf. to filter run volume (FRV), expressed as gallons/sf.
Pilot Data on Bull Run WaterPilot Data on Bull Run Water[[KreftKreft, 1991; , 1991; 10 &10 & 1515 gpm/sfgpm/sf, 1.5 mm anthracite], 1.5 mm anthracite]
0
10,000
20,000
30,000
40,000
50,000
60,000
70,000
60 80 100 120 140
Depth of Media, in.
FRVbgal/sf
0
10,000
20,000
30,000
40,000
50,000
60,000
70,000
FRVhgal/sf
Filter RunFilter RunVolumeVolumeto to BrkthruBrkthru
Filter RunFilter RunVolumeVolumeto to HdlossHdloss
Note that now we do a bit better at 15 gpm/sf Note that now we do a bit better at 15 gpm/sf (yellow) (yellow) than we did at 10 gpm/sf than we did at 10 gpm/sf (white)(white)
Pilot Data on Bull Run WaterPilot Data on Bull Run Water[[KreftKreft, 1991; , 1991; 10 &10 & 1515 gpm/sfgpm/sf, 1.5 mm anthracite], 1.5 mm anthracite]
0
10,000
20,000
30,000
40,000
50,000
60,000
70,000
60 80 100 120 140
Depth of Media, in.
FRVbgal/sf
0
10,000
20,000
30,000
40,000
50,000
60,000
70,000
FRVhgal/sf
z
Filter RunFilter RunVolumeVolumeto to BrkthruBrkthru
Filter RunFilter RunVolumeVolumeto to HdlossHdloss
Note that now we do a bit better at 15 gpm/sf Note that now we do a bit better at 15 gpm/sf (yellow) (yellow) than we did at 10 gpm/sf than we did at 10 gpm/sf (white)(white)
So we get more through theSo we get more through thefilter at higher rates evenfilter at higher rates even
though the run time is shorterthough the run time is shorter
Is there anything we can do to getIs there anything we can do to geta longer run time if we want that?a longer run time if we want that?
Remember the runtime decreases atRemember the runtime decreases atthe higher rate because the time tothe higher rate because the time to
Can we do anything about the headloss?Can we do anything about the headloss?
The higher headloss at higher rates isThe higher headloss at higher rates isalmost all a result of increased clean bedalmost all a result of increased clean bedheadlossheadloss
Clean bed headloss is very sensitive toClean bed headloss is very sensitive tomedia diametermedia diameter
Thus increasing media diameter will result inThus increasing media diameter will result ina longer time to design headlossa longer time to design headloss
But increasing media diameterBut increasing media diametermight affect turbiditymight affect turbidity
What is the impact of mediaWhat is the impact of mediadiameter and filter rate on effluentdiameter and filter rate on effluent
turbidity?turbidity?
Data from the Cedar RiverData from the Cedar Riverthree diameters, three filter ratesthree diameters, three filter rates
[L/d = 1300 in all cases][L/d = 1300 in all cases]
0
0.02
0.04
0.06
0.08
0.1
0.12
4 6 8 10 12 14 16
Filter rate, gpm/sf
ntu
d=1.0
d=1.5
d=2.0
Here are data from work done on the Cedar River (the waterHere are data from work done on the Cedar River (the watersupply for Seattle) that show the effect of media diameter andsupply for Seattle) that show the effect of media diameter andfilter rate.filter rate.
Data from the Cedar RiverData from the Cedar Riverthree diameters, three filter ratesthree diameters, three filter rates
[L/d = 1300 in all cases][L/d = 1300 in all cases]
0
0.02
0.04
0.06
0.08
0.1
0.12
4 6 8 10 12 14 16
Filter rate, gpm/sf
ntu
d=1.0
d=1.5
d=2.0
Diameters of 1 to 2 mm and rates of 5 to 15 gpm/sf are shownDiameters of 1 to 2 mm and rates of 5 to 15 gpm/sf are shown
Data from the Cedar RiverData from the Cedar Riverthree diameters, three filter ratesthree diameters, three filter rates
[L/d = 1300 in all cases][L/d = 1300 in all cases]
0
0.02
0.04
0.06
0.08
0.1
0.12
4 6 8 10 12 14 16
Filter rate, gpm/sf
ntu
d=1.0
d=1.5
d=2.0
Conclusion: Increasing either the rate or the media diameterConclusion: Increasing either the rate or the media diameterdoes result in some degradation in effluent turbiditydoes result in some degradation in effluent turbidity
Can we compensate by makingCan we compensate by makingthe filter media deeper?the filter media deeper?
The Iwasaki Equation suggests itThe Iwasaki Equation suggests itshould be pretty easyshould be pretty easy
LnLn[C[CLL /C /Coo] = -] = -λλLL Where Where λλ = filter coefficient = filter coefficient
-6
-5
-4
-3
-2
-1
0
0 2 4 6 8 10
Media Depth, Ft
Turbidity Removal
Ln[CL/Co]
Iwasaki:
Ln[CL/Co] = !"L
Data Gathered by DWPData Gathered by DWP[Owens River, C[Owens River, Coo = 11 = 11 ntu ntu, V, V∞∞ = 15 gpm/sf, d = 15 gpm/sf, dmm = 1.55 mm] = 1.55 mm]
-6
-5
-4
-3
-2
-1
0
0 2 4 6 8 10
Media Depth, Ft
Turbidity Removal
Ln[CL/Co]
Iwasaki:
Ln[CL/Co] = !"L
The data gathered by DWP show an improvement with depth.The data gathered by DWP show an improvement with depth.But the improvement achieved has diminishing returnsBut the improvement achieved has diminishing returns
LetLet’’s look at some other datas look at some other data
Data Gathered at Seattle:EffectData Gathered at Seattle:Effectof Filter Rate and Media Depthof Filter Rate and Media Depth
[Cedar River, C[Cedar River, Coo = 0.2 to 0.3 = 0.2 to 0.3 ntuntu, , monomedia monomedia ddmm = 1.25 mm = 1.25 mm]]
0.00
0.02
0.04
0.06
0.08
0.10
0.12
0.14
0.16
0.18
0.20
20 40 60 80 100 120 140 160 180
Media Depth, in.
Effluent Turbidity
ntu
V=8
V=12
V=16
V=20
Depth does make a difference. At a depth of 120 inches theDepth does make a difference. At a depth of 120 inches theperformance at 20 gpm/sf is about the same as the performanceperformance at 20 gpm/sf is about the same as the performanceAt 8 gpm/sfAt 8 gpm/sf
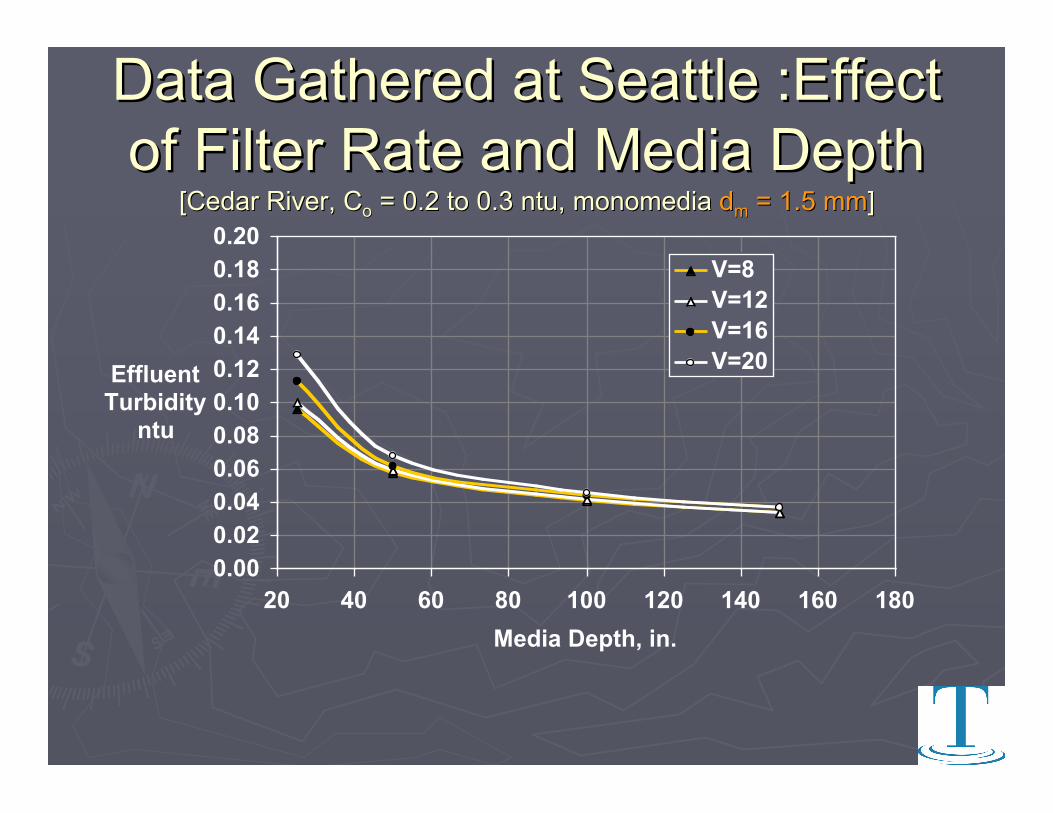
Data Gathered at Seattle :EffectData Gathered at Seattle :Effectof Filter Rate and Media Depthof Filter Rate and Media Depth
[Cedar River, C[Cedar River, Coo = 0.2 to 0.3 = 0.2 to 0.3 ntuntu, , monomedia monomedia ddmm = 1.5 mm = 1.5 mm]]
0.00
0.02
0.04
0.06
0.08
0.10
0.12
0.14
0.16
0.18
0.20
20 40 60 80 100 120 140 160 180
Media Depth, in.
Effluent Turbidity
ntu
V=8
V=12
V=16
V=20
Data Gathered at Seattle :EffectData Gathered at Seattle :Effectof Filter Rate and Media Depthof Filter Rate and Media Depth
[Cedar River, C[Cedar River, Coo = 0.2 to 0.3 = 0.2 to 0.3 ntuntu, , dual media ddual media dmm = 2/1 mm = 2/1 mm]]
0.00
0.02
0.04
0.06
0.08
0.10
0.12
0.14
0.16
0.18
0.20
20 40 60 80 100 120 140 160 180
Media Depth, in.
Effluent Turbidity
ntu
V=8
V=12
V=16
V=20
Conclusion: increasing mediaConclusion: increasing mediadepth compensates well fordepth compensates well forincreases in filter rateincreases in filter rate
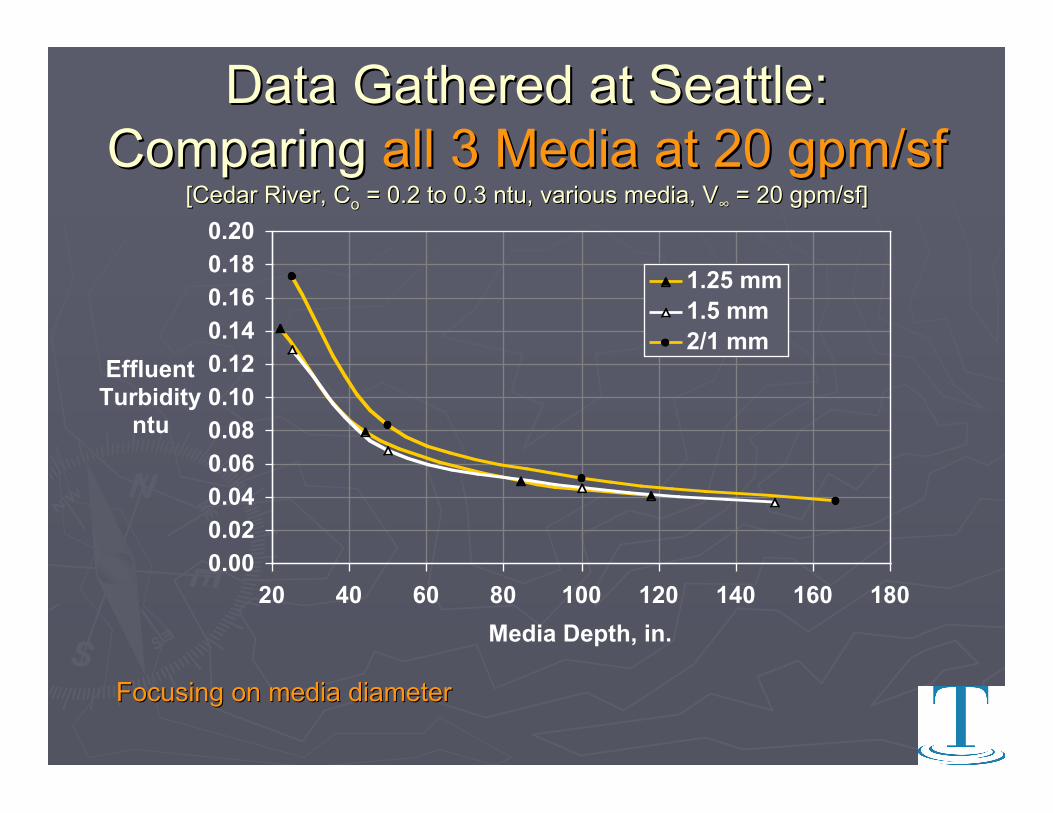
Data Gathered at Seattle:Data Gathered at Seattle:Comparing Comparing all 3 Media at 20 gpm/sfall 3 Media at 20 gpm/sf
[Cedar River, C[Cedar River, Coo = 0.2 to 0.3 = 0.2 to 0.3 ntuntu, various media, V, various media, V∞∞ = 20 gpm/sf] = 20 gpm/sf]
0.00
0.02
0.04
0.06
0.08
0.10
0.12
0.14
0.16
0.18
0.20
20 40 60 80 100 120 140 160 180
Media Depth, in.
Effluent Turbidity
ntu
1.25 mm
1.5 mm
2/1 mm
Focusing on media diameterFocusing on media diameter
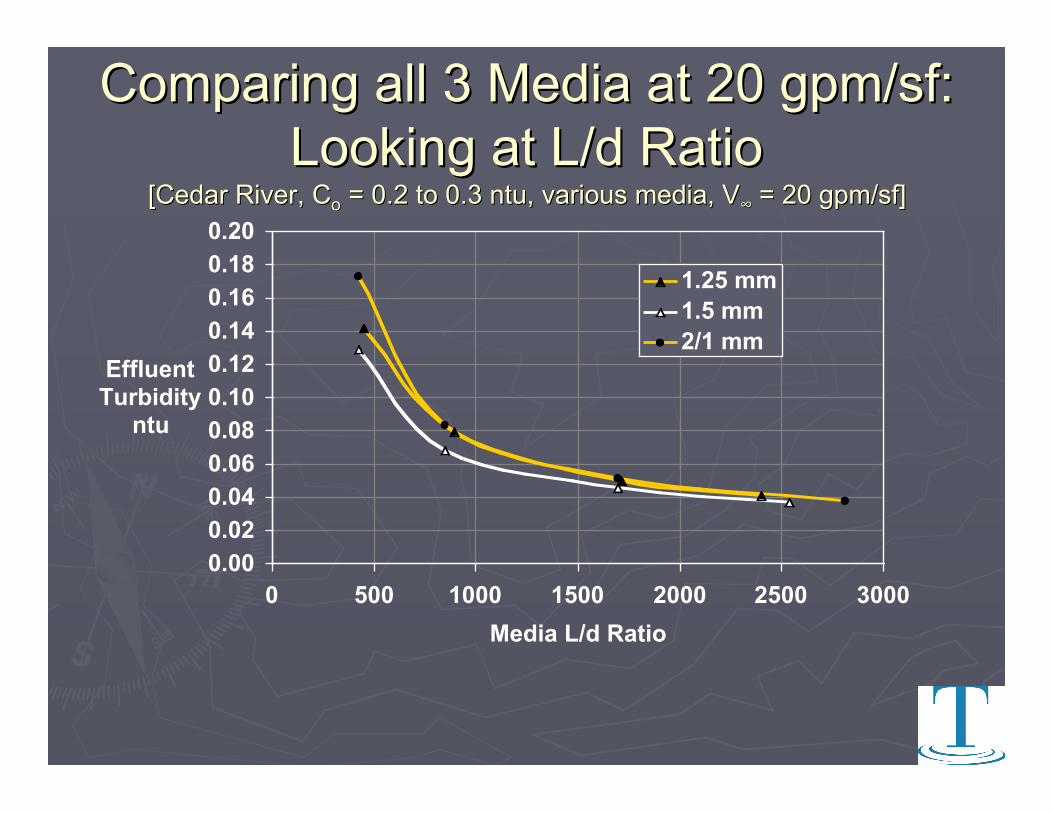
Comparing all 3 Media at 20 gpm/sf:Comparing all 3 Media at 20 gpm/sf:Looking at L/d RatioLooking at L/d Ratio
[Cedar River, C[Cedar River, Coo = 0.2 to 0.3 = 0.2 to 0.3 ntuntu, various media, V, various media, V∞∞ = 20 gpm/sf] = 20 gpm/sf]
0.00
0.02
0.04
0.06
0.08
0.10
0.12
0.14
0.16
0.18
0.20
0 500 1000 1500 2000 2500 3000
Media L/d Ratio
Effluent Turbidity
ntu
1.25 mm
1.5 mm
2/1 mm
Conclusion: increasing media depth compensates well forConclusion: increasing media depth compensates well forincreases in media diameter, provided if we keep L/d constantincreases in media diameter, provided if we keep L/d constant
Conclusion from this dataConclusion from this data
Higher rates can be achieved by usingHigher rates can be achieved by usingdeeper filters and larger diameterdeeper filters and larger diametermediamedia
Limits of high rate filtrationLimits of high rate filtration
What is the upper limit in media depth?What is the upper limit in media depth? DonDon’’t know.t know. Max. used in full-scale design so far is ~100 in.Max. used in full-scale design so far is ~100 in. Max. used in pilot is ~ 170 in. (14 ft.)Max. used in pilot is ~ 170 in. (14 ft.) Above 48 in., recommend both air/water and surfaceAbove 48 in., recommend both air/water and surface
washwash What is the upper limit in media size?What is the upper limit in media size?
Again, donAgain, don’’t knowt know Upper limit tested in pilots is 2 mmUpper limit tested in pilots is 2 mm Required depth increases roughly in proportion to theRequired depth increases roughly in proportion to the
diameterdiameter
Limits of high rate filtrationLimits of high rate filtration
What is the upper limit for filtration rate?What is the upper limit for filtration rate? Depends on media designDepends on media design The highest rate plant in service is LAAFPThe highest rate plant in service is LAAFP
600 600 mgdmgd 13.5 gpm/sf13.5 gpm/sf 1,5 mm, 60 in. depth1,5 mm, 60 in. depth
Next highest INext highest I’’ve worked on is Prospect in Sydneyve worked on is Prospect in Sydney 900 900 mgdmgd 10 gpm/sf10 gpm/sf 1.55 mm, 60 in. depth1.55 mm, 60 in. depth
Highest rate in pilot test ~ 40 gpm/sf (LADWP)Highest rate in pilot test ~ 40 gpm/sf (LADWP) Several successful tests at 15 to 20 gpm/sfSeveral successful tests at 15 to 20 gpm/sf
Limits of high rate filtrationLimits of high rate filtration
Success with high rates requires the use of deeperSuccess with high rates requires the use of deepermedia and often larger diameter media as wellmedia and often larger diameter media as well
To have a reasonable chance of success ITo have a reasonable chance of success Irecommend both pilot studies and studies with arecommend both pilot studies and studies with alarge-scale prototype.large-scale prototype.
I donI don’’t know what DHS will say before me, but It know what DHS will say before me, but Isuspect theysuspect they’’ll want to see testing as wellll want to see testing as well
This was done in both Los Angeles and SydneyThis was done in both Los Angeles and Sydney
finisfinis
Treatment of Bull Run Water O3=1.5, 8100=1, ferric 2.5 mg/L