Proceedings of the 1st Conference on Information Technology and Data ScienceDebrecen, Hungary, November 6–8, 2020
published at http://ceur-ws.org
AbstractDuring the last 13.5 year motion cycle of the interplanetary research
project, there were necessary flight path modifications of the Cassini space-craft. In the order of signal travel time (approximatively 80 minutes) on theEarth-Cassini long sized channel, complex event detection of orbital mod-ifications requires special investigation and analysis of the collected largetrajectory dataset. This paper presents a sophisticated, in-depth learningapproach for detecting Cassini spacecraft’s trajectory modifications in post-processing mode. The model uses neural networks with Long Short-TermMemory (LSTM) to extract useful data and learn the time series’ inner datapattern, together with the penetrability of the LSTM layers distinguish de-pendencies between the long- and short-term phases.
∗This work was supported by the construction EFOP-3.6.3-VEKOP-16-2017-00002. Theproject was supported by the European Union, co-financed by the European Social Fund. Thepaper was supported by the QoS-HPC-IoT Laboratory, too.
19
1. Introduction
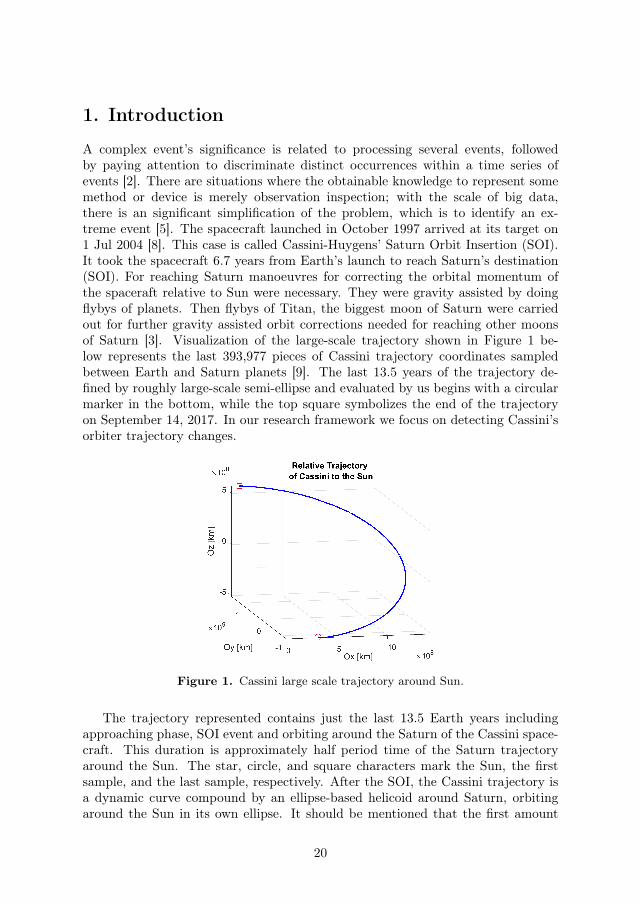
A complex event’s significance is related to processing several events, followedby paying attention to discriminate distinct occurrences within a time series ofevents [2]. There are situations where the obtainable knowledge to represent somemethod or device is merely observation inspection; with the scale of big data,there is an significant simplification of the problem, which is to identify an ex-treme event [5]. The spacecraft launched in October 1997 arrived at its target on1 Jul 2004 [8]. This case is called Cassini-Huygens’ Saturn Orbit Insertion (SOI).It took the spacecraft 6.7 years from Earth’s launch to reach Saturn’s destination(SOI). For reaching Saturn manoeuvres for correcting the orbital momentum ofthe spaceraft relative to Sun were necessary. They were gravity assisted by doingflybys of planets. Then flybys of Titan, the biggest moon of Saturn were carriedout for further gravity assisted orbit corrections needed for reaching other moonsof Saturn [3]. Visualization of the large-scale trajectory shown in Figure 1 be-low represents the last 393,977 pieces of Cassini trajectory coordinates sampledbetween Earth and Saturn planets [9]. The last 13.5 years of the trajectory de-fined by roughly large-scale semi-ellipse and evaluated by us begins with a circularmarker in the bottom, while the top square symbolizes the end of the trajectoryon September 14, 2017. In our research framework we focus on detecting Cassini’sorbiter trajectory changes.
Figure 1. Cassini large scale trajectory around Sun.
The trajectory represented contains just the last 13.5 Earth years includingapproaching phase, SOI event and orbiting around the Saturn of the Cassini space-craft. This duration is approximately half period time of the Saturn trajectoryaround the Sun. The star, circle, and square characters mark the Sun, the firstsample, and the last sample, respectively. After the SOI, the Cassini trajectory isa dynamic curve compound by an ellipse-based helicoid around Saturn, orbitingaround the Sun in its own ellipse. It should be mentioned that the first amount
20
of samples are before SOI, consequently the time interval between SOI and end ofproject is just 13.3 years. With the established method, we aim to detect events inpost processing mode relevant to Cassini’s trajectory modifications. To this end,we put forward our model that uses the capacity of Long-Short Term Memoryneural networks to produce useful data and learn the internal data structure of thetrajectory time series and leverage the memory dependence LSTM potential.
In section 2 we provide a brief literature review of several related studies withinthe field. Section 3 describes extraction of sampling and trajectory characteris-tics of the Cassini database (Imaging Science Subsystem (ISS), Saturn EDR DataSets (Volume 1 – Volume 116) [9], which was indexed by National Aeronautics andSpace Administration of the USA (NASA). Section 4 discusses spacecraft trajec-tory modifications detection by LSTM based artificial intelligence algorithm alongwith the adopted method for the detection of trajectroy changes. Section 5 con-tains the experimental results of the trajectory manoeuvres detection and section6 summarizes our research conclusions.
2. Related Work and Previous Studies
Cassini’s project’s trajectory was separated into three classes of activities occur-ring in phases: i) launching and journey to Saturn, ii) approaching and arrivalat Saturn, and iii) science phase. Controlling the trajectory required processinga variety of status information including certain step length, velocity, etc. Theapproaching and arrival process provided complete project trajectory information.Basic role of trajectory maps in the science phase is to position the spacecraft in aspecific location related to Saturn, which has been meticulously planned and hassufficient entrance conditions consistent with spacecraft velocity and path angle.Paper [11] offers recent research results on the Cassini project orbiter remodelingand mostly shifting our view of the Cassini orbiter; like in the last half of 2016, oneof Cassini’s near flybys changed the trajectory of Cassini to form a sequence of 20rings containing marvelous orbits.
Paper [7] surveyed artificial intelligence developments in the concept of space-craft control and guidance dynamics and focused on evolutionary logic and deeplearning as the cornerstone to potential systemic space science. The method in-cludes artificial intelligence and automatic logic to monitor the navigation and theremote sensing of the external space mission trajectories. Gated Recurrent Unit(GRU) provides a periodic neural network algorithm for real-time trajectory pre-diction, where its parameters are acquired as an initial step by batch processing,then the qualified feedback for trajectory prediction [6]. In work [10] a model-basedreinforcement learning is proposed to conduct almost quintessential reconfigurationin establishing flying spacecraft. Along with two other algorithms, the LSTM layernetwork and reverse reinforcement learning were used to remodel and forecast pos-sible trajectories to acquire collision-free maneuvers. These merits encouraged usto use LSTM networks, where the LSTM approach suits our study field.
21
3. Extracting Sampling and Trajectory Characteris-tics of the Cassini-Huygens Database
There were two pieces of the spacecraft: Huygens probe and Cassini orbiter.Cassini-Huygens (C-H) arrived at Saturn in 2004, sending useful data back toEarth. Huygens moved through Titan’s atmosphere, Saturn’s biggest moon, plungeddown by parachute to the furthest point so far, landed on his surface. Huygens tooksamples, testing them, and submitting the findings to Cassini, who then returnedthese signals to Earth. Remote sensing devices gathered data from vast distancesremotely. The acquired image data was provided by NASA’s Imaging Science Sub-system (ISS). The ISS comprises of two detached wide-angle video cameras and anarrow-angle camera. The dataset of ISS picture volumes comprises an immensenumber of images and their corresponding labels. The dataset is freely accessibleby reference [9]. Table 1 shows the project’s time stamp.
Table 1. Tasks time stamps of main phases (UTC).
Task Starting Date Ending DateC_H Project 15 October 1997 15 September 2017Analyzed DB by us 6 February 2004 15 September 2017Prime Mission 1 July 2004 1 July 2008Equinox Mission 1 July 2008 11 October 2010Solstice Mission 11 October 2010 15 September 2017
We evaluated the 116 volumes of the data collection from the above NASAsource. The staring study had time stamp 02:07:06 on February 6, 2004, and endstamps on September 14, 2017, all clarified in UTC (Coordinated Universal Time).The C-H project’s five key objectives (i.e., Saturn study, Moon Titan, Saturnrings, ice satellites, and magnetosphere) involved trajectory maneuvers. Reference[4] gives the amount of expected and performed adjustments in the trajectory ofeach mission. Table 2 provides the number of Saturn orbits along with the plannedand executed maneuvers. The percentage of performed and expected trajectorymaneuvers for the Prime and Equinox project is 69.5% and 67.3%, respectively.
Table 2. Number of Saturn orbits and manoeuvres.
Mission No. of Orbits Trajectory ManeuversPlanned
Trajectory ManeuversExecuted
Prime 75 161 112Equinox 64 104 70Solstice 155 206 141
With no official details on the Solstice mission’s performed trajectory modifi-cations, our forecast is 68.4 percent (average of the previous two) of the scheduled
4. Conditions of the Complex Event Detection of theCassini Trajectory
Our classifier’s key purpose is to specify complex events from sensory produceddata; we expanded the sensory data index to detect temporal semantics for com-plex event detection. Potential dynamic data set occurrences are where observationsequences shift. We consider severe trajectory adjustment as the Cassini orbitervelocity vector shifts more than a threshold metric. Since velocity is a measurevector, extreme trajectory occurrences mean satisfying either of the following twoconditions: extreme alteration of the velocity direction or of the acceleration vec-tor’s magnitude.
4.1. Modification per Time of the Velocity Vector Direction
The speed of the angle modification ∆𝜙𝑖 between consecutive velocity vectors 𝑣𝑖and 𝑣𝑖+1 is given by the following formula:
∆𝜙𝑖
∆𝑡𝑖=
cos(︁
𝑣𝑖+1·𝑣𝑖‖𝑣𝑖‖·‖𝑣𝑖+1‖
)︁
𝑡𝑖+1 − 𝑡𝑖, 𝑖 = 1, 2, . . . , 𝑁 − 1 (4.1)
where 𝑣𝑖 and 𝑣𝑖+1 are two consecutive velocity vectors of the orbiter, ‖𝑣𝑖‖ is themagnitude of the vector, ∆𝑡𝑖 is the time interval between two consecutive samplingsand 𝑖 = 1, 2, . . . , 𝑁−1. The number of vectors is the total number of samples in thePrime, Equinox and Solstice missions: 𝑁 = 407, 303 − 13, 326 = 393, 977. Valuearound 0 of the ∆𝜙/∆𝑡 means a very small modification of the direction per unitof time. Such cases were at the beginning of the project (see values before 2005 onthe Figure 2a).
This amount of samples analysed by us belongs to the last 13.3 years of the C-Hproject. Starting with the SOI event, the angle of the consecutive samplings of thevelocity direction modified in a higher range per unit of time. The spacecraft tra-jectory has been updated many times, but no specific knowledge on these incidentsis accessible to the public. NASA’s open 116-volume archive includes samples ofhigh time dispersion. Values of the ∆𝜙/∆𝑡 in the scale of over 1 rad/sec weresampled in case of relatively short delay time between consecutive samplings. Thedistribution of the ∆𝜙/∆𝑡 is exponential conform to the right hand side histogramof Figure 2.
4.2. Modification of the Acceleration Vector Magnitude
Trajectory adjustment happens as the magnitude of velocity vector v (𝑣𝑥, 𝑣𝑦, 𝑣𝑧)varies during successive sampling by a higher value than the threshold 𝑇ℎ𝑣. The
23
(a) Angle modification vs. date. (b) Histogram of angle modification.
Figure 2. Basic properties of angle modification velocity vs. date.Majority of angle velocity are less than 0.01 rad/sec.
estimation of the adjustment magnitude per unit of time of the velocity vector be-tween two consecutive samples (being the moving average acceleration) is centeredon the velocity components defined in the database as follows:
𝑣 = 𝑣𝑥 + 𝑣𝑦 + 𝑣𝑧 (4.2)
𝑎𝑖 =‖∆𝑣𝑖‖
∆𝑡𝑖=
‖𝑣𝑖+1 − 𝑣𝑖‖𝑡𝑖+1 − 𝑡𝑖
, 𝑖 = 1, 2, . . . , 𝑁 − 1. (4.3)
The magnitude of velocity modification can be derived using the following re-lation:
‖𝑣𝑖+1 − 𝑣𝑖‖2 = (∆𝑣𝑥,𝑖)2 + (∆𝑣𝑦,𝑖)
2 + (∆𝑣𝑧,𝑖)2 (4.4)
where ∆𝑣𝑥,𝑖 , ∆𝑣𝑦,𝑖 , ∆𝑣𝑧,𝑖 are the modification of the orthogonal velocity com-ponents in the sampling interval 𝑖, and 𝑖 + 1. The acceleration magnitude of theCassini can be seen on the left-hand side of Figure 3. It can be observed thatthe distribution of the acceleration magnitude is power function conform to theright-hand side histogram of Figure 3.
The histogram denotes a structure in which the amplitude of acceleration eventscalculated in a specified magnitude duration is spread through possible magnitudevalues. Each level within the generated histogram expresses the acceleration rateamong the acceleration span. A linear function, resulting in the histogram’s powerfunction dependency, will approximate the log-log scale histogram.
4.3. Complex Event Detection of the Cassini Orbiter Trajec-tory
Our classifier’s key purpose is to specify complex events from sensory produceddata; we expanded the sensory data index to detect temporal semantics for complex
24
(a) Acceleration magnitude vs. date. (b) Histogram of acceleration magnitude.
Figure 3. Acceleration magnitude of the Cassini vs. date. Majorityof the magnitudes of a are less than 1 km/s2.
event detection. Potential dynamic data set occurrences are where observationsequences shift. Let’s have trajectory adjustment indexes where 𝐼 set unique events:
𝐼𝜙 = {1 < 𝑖 < 𝑁 − 1 | ∆𝜙𝑖
∆𝑡𝑖≥ 𝑇ℎ𝜙} (4.5)
𝐼𝑎 = {1 < 𝑖 < 𝑁 − 1 | 𝑎𝑖 ≥ 𝑇ℎ𝑎} (4.6)
𝐼 = 𝐼𝜙 ∪ 𝐼𝑎 (4.7)
𝐽 = 𝐼𝜙 ∩ 𝐼𝑎 (4.8)
where 𝐼𝜙 and 𝐼𝑎 are sample indexes of the analyzed NASA database for whichthe velocity direction modifications or the acceleration magnitude are greater thanthe corresponding threshold values. Set 𝐽 is used to sense the individual effectsimultaneously of the two conditions mentioned in subsections 3.1 and 3.2. If theset 𝐽 ’s cardinality is low, then conditions (4.5) and (4.6) are not strongly dependentand both of them help to detect complex events on the trajectory. The resultingset 𝐼 contains all the sampling indexes detected by the proposed complex eventdetector.
𝐼 = 𝑖1, 𝑖2, . . . , 𝑖𝑘 (4.9)
After the SOI phase in 2004, the spacecraft performed many trajectory ad-justments in compliance with the Earth commands sent by the supervisor squad.Cardinality 𝑘𝐼 and 𝑘𝐽 of the sets 𝐼 and 𝐽 , respectively, give the number of ex-treme events called Cassini trajectory modifications dependent on circumstances(4.7) or (4.8) over the last 13.3 years of the project studied. Obviously, numberof trajectory variations should be less than the amount of observations listed inTable 2.
25
Working points are represented with red bubble markers and are placed inthe extreme modification coordinates of the gradient of the surfaces. Based onTable 1. the amount of conducted maneuvers is considered 323. By leveragingthe dependence of severe values on the threshold values 𝑇ℎ𝜙 and 𝑇ℎ𝑎 within ourmodel, we may evaluate the working point in three-dimensional space. Figure 4sets out this dependency as a surface plot. The working point on both surfaces isplaced on cordinates with extreme modification of the surfaces. To fulfill the totalnumber of trajectory manoeuvres the values of the thresholds are (𝑇ℎ𝜙, 𝑇ℎ𝑎) =(2.85𝑟𝑎𝑑/𝑠, 33.84𝑘𝑚/𝑠2). For these threshold values, the cardinality of the set 𝐼and 𝐽 were found to be (𝑘𝐼 , 𝑘𝐽) = (323, 1). It was found that approximately twotimes more extreme events appear in set 𝐼𝜙 than in set 𝐼𝑎. These two sets are notdisjunctive because in several samples, both of the conditions (4.5) and (4.6) fulfill.The union of these two sets gives precisely 323 extreme trajectory adjustment cases.In the continuation, we demonstrate the approach for detecting these trajectorymaneuvers with recurrent neural network.
(a) Cardinality of set 𝐼 vs. thresholds. (b) Cardinality of set 𝐽 vs. thresholds.
Figure 4. Dependence of the cardinality of sets 𝐼 and 𝐽 .
4.4. Deep Learning Method of Detecting Trajectory Modifi-cations
The work presented in [1] aids in analyzing the effect on the trajectory of spacecraft,depending on how two or more ideas or artifacts are related between the orbitalelements. Any framework’s productive research includes the time-domain scientificfindings reference. The suggested solution is an amalgamated structure that maydefine trajectory adjustments in the C-H expedition project. Trajectory analysisenables knowledge to be gained, not only regarding spacecraft motion but alsofor improved machine learning-based motion analysis. Our system collects thetrajectory data as inputs and analyses them momentarily and spatially based onthe sample number and pacing alongside the spacecraft’s velocity.
26
The input to the RNN system is a sequence of sample ID, 𝑖 ∈ {1, . . . , 𝑁 − 1 =393,976}, sampling intervals ∆𝑡𝑖 = 𝑡𝑖+1−𝑡𝑖, modification of the position coordinates(∆𝑥𝑖,∆𝑦𝑖,∆𝑧𝑖) and modification of the velocity components (∆𝑣𝑥,𝑖,∆𝑣𝑦,𝑖,∆𝑣𝑧,𝑖)among the last 13.3 years of the studied time interval. The input 𝑋 of the neuralnetwork is a 7𝑥𝑁 type matrix conform to the formula below:
𝑋 = [𝑋1, 𝑋2, . . . , 𝑋𝑁−1], (4.10)
where column vectors 𝑋𝑖 have the following elements:
The data set having 𝑁−1 samples is divided into the subsets of objects conformto Table 3. We used half of the samples for learning and the remaining half ofsamples is divided equally for validation and testing. Based on the formula (4.11)each matrix has 7 rows and 𝑁 columns.
The human control team from Earth sent adjustment orders on the trajectorydue to the mission’s numerous science and celestial goals. We use LSTM neuralnetwork layers to better sense the memory property of the trajectory because ofinertia of the Cassini. Figure 5 provide the adopted architecture of the recurrentneural network.
Figure 5. Architecture of the adopted recurrent neural network.
27
The RNN method conducts a binary trajectory sample classification. The se-quences of the sampled multidimensional time series will be detected depending onthe trajectory’s extreme events. The orbiter’s automatic adjustments have beenproduced to hold the orbiter on the complicated helicoid described in Section 3.
It is common to stack LSTM layers for better modeling capacity, particularlywhen a large amount of training data is available based on its ability to manip-ulate previous computation knowledge. In principle, RNNs should accommodatearbitrary long-term dependencies in the input series to prevent the gradient issuewhere long-term dependencies occur. Our each neural network machine perfor-mance is a binary feature that demonstrates how the Cassini orbiter trajectory ishighly changed. Each neural network has formation algorithm style ADAM; thethreshold gradient method is L2Norm. Table 4 offers additional criteria for theused set of neural networks.
Table 4. Training option values of the RNN.
Option ValueGradientDecayFactor 0.9000SquaredGradientDecayFactor 0.9900InitialLearnRate 0.0200GradientThreshold 1.0000MaxEpochs 100Number of Classes 2
The number of classes for the tested neural networks is two to detect the trajec-tory’s complex events. As the CED conditions (see relations 4.5, 4.6) are fulfilledfor any trajectory samples, that sample is classified True, otherwise is classifiedFalse.
5. Experimental Results of the Trajectory Manoeu-vres Detection
Training and validation of trajectory research data sets are conducted in the last13.3 years of the Cassini project using a set of twelve separate recurrent neuralnetworks. Half of them are LSTMs, while the remainders are BiLSTMs. Thechanging input parameters (mini-batch scale, number of hidden units, number ofclasses on layer three and layer four) and measured performance metrics (subse-quent learning time and the precision of these networks’ identification) are shownin Table 5. It should note that for each RNN type we got detection accuracy over99 %. Big difference is detected between the learning time of LSTM and BiLSTMnetwork types. It is obvious that having both direction of the signal propagationthe BiLSTM requires extra processing relative to the LSTM structure.
28
Table 5. Detection accuracy of the trajectory modification of dif-ferent RNNs.
A popular challenge in machine learning is research and building algorithms thatcan learn from and render data predictions. These algorithms operate by renderingdata-driven forecasts or decisions by creating a theoretical framework from inputdata. The accuracy levels provided in the deep learning-based model’s spacecraftmaneuvering behavior are acquired within the training dataset. The results supportthe view that deep models are important in the detection of trajectory modificationsdetection of sensory data.
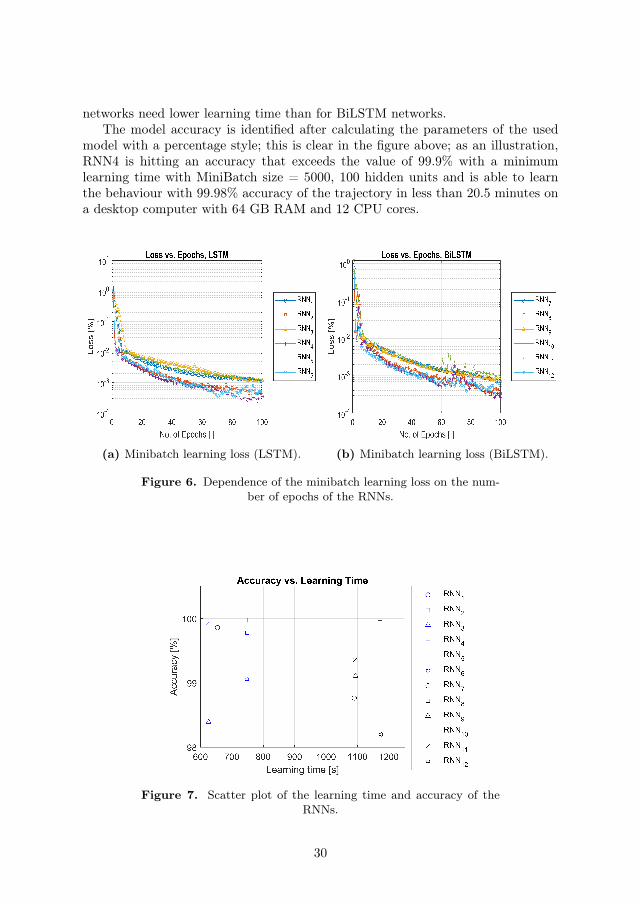
Figure 6 (left) and Figure 6 (right) visualize the deficit during the learningprocess. It can be found that L2’s number of secret units affects learning loss. Thefewer the number of hidden units are, the greater the loss are. For 10 hidden units,the learning loss doubles. The related activity has LSTM and BiLSTM networks,but the last one is learned on the L2 layer for 100 hidden units.
The ideal learning rate is bound to be exposed to the lack of the results’ learnedbehavior, which depends on the dataset and architecture used. The loss value showshow effectively or adequately the model performs during each learning iteration.Figure 6a reveals that RNN4 LSTM offers the best loss relative to other versions.We can see that RNN8 BiLSTM has the strongest loss on the figure’s right handrelative to other versions. The efficiency of identification is the ratio betweenthe number of identified trajectory corrections and the number of real trajectorycorrections. In this context we name it accuracy metric like in popular statisticalsoftware tool environments.
Generally defined model accuracy after measuring the parameters of the thismodel is explained in percentage. It is called the model accuracy metric thatcompares the model forecast with the correct data. Figure 7 represent dependencyof the accuracy on the learning time for each of the analysed RNN. All LSTM
29
networks need lower learning time than for BiLSTM networks.The model accuracy is identified after calculating the parameters of the used
model with a percentage style; this is clear in the figure above; as an illustration,RNN4 is hitting an accuracy that exceeds the value of 99.9% with a minimumlearning time with MiniBatch size = 5000, 100 hidden units and is able to learnthe behaviour with 99.98% accuracy of the trajectory in less than 20.5 minutes ona desktop computer with 64 GB RAM and 12 CPU cores.
(a) Minibatch learning loss (LSTM). (b) Minibatch learning loss (BiLSTM).
Figure 6. Dependence of the minibatch learning loss on the num-ber of epochs of the RNNs.
Figure 7. Scatter plot of the learning time and accuracy of theRNNs.
30
6. ConclusionsC-H spacecraft trajectory modifications detection method was conducted usingLSTM/BiLSTM networks; as far as we know, this study is the first to detectthe events of spacecraft trajectory modifications. By the provided results, we showthat our test study clearly identifies that LSTM models with the chosen parametershave a reasonable option for specifying Cassini’s trajectory modifications. Theirusage and extra stacked layers produce a noticeable boost in increasing detectionprocess efficiency. It is worth mentioning that the models used can be comfortablygeneralized to cover a large scientific field relevant to estimation. With more specificinformation, the provided models present a robust processing step in employingthe inner features and time-series representation via LSTM time dependencies forprecise detection. The proposed detection model was capable of identifying 99.98%of the trajectory modifications of the Cassini orbiter.
References
[1] A. ALDabbas, Z. Gal: On the Complex Event Identification Based on Cognitive Classifica-tion Process, in: 2019 10th IEEE International Conference on Cognitive Infocommunications(CogInfoCom), IEEE, 2019, pp. 29–34.
[2] A. ALDabbas, Z. Gál: Complex Event Processing Based Analysis of Cassini–HuygensInterplanetary Dataset, in: Intelligent Computing Paradigm and Cutting-edge Technologies:Proceedings of First international conference on Innovative Computing and Cutting-edgeTechnologies (ICICCT 2019), Istanbul, Turkey: Springer, 2019, pp. 51–66,doi: https://doi.org/10.1007/978-3-030-38501-9.
[3] A. ALDabbas, Z. Gál: Getting facts about interplanetary mission of Cassini-Huygensspacecraft, in: 10th Hungarian GIS Conference and Exhibition, Debrecen, Hungary, 2019.
[4] B. Buffington: Designing the Cassini Solstice Mission Trajectory, ASK Magazine, pages.15-18, (Accessed on 30/10/2020),url: https://appel.nasa.gov/wp- content/uploads/2013/04/513854main_ASK_41s_designing.pdf.
[5] G. Dematteis, T. Grafke, E. Vanden-Eijnden: Rogue waves and large deviations indeep sea, Proceedings of the National Academy of Sciences 115.5 (2018), pp. 855–860.
[6] P. Han, W. Wang, Q. Shi, J. Yang: Real-time Short-Term Trajectory Prediction Basedon GRU Neural Network, in: 2019 IEEE/AIAA 38th Digital Avionics Systems Conference(DASC), IEEE, 2019, pp. 1–8.
[7] D. Izzo, M. Märtens, B. Pan: A survey on artificial intelligence trends in spacecraftguidance dynamics and control, Astrodynamics (2019), pp. 1–13.
[8] M. Meltzer: Building an international partnership and preventing mission cancellation,in: The Cassini-Huygens Visit to Saturn, Switzerland: Springer, 2015, pp. 27–46,doi: https://doi.org/10.1007/978-3-319-07608-9_2.
[9] NASA: National Aeronautics and Space Administration of the USA, Cassini ISS OnlineData Volumes, Imaging Science Subsystem (ISS), Saturn EDR Data Sets, (Accessed on30/10/2020),url: https://pds-imaging.jpl.nasa.gov/volumes/iss.html.
[10] S. Silvestrini, M. R. Lavagna: Spacecraft Formation Relative Trajectories Identificationfor Collision-Free Maneuvers using Neural-Reconstructed Dynamics, in: AIAA Scitech 2020Forum, 2020, p. 1918.
[11] L. Spilker, S. Edgington: Cassini-Huygens: Recent Science Highlights and Cassini Mis-sion Archive, EPSC 2019 (2019), EPSC–DPS2019.