Deep structure of an open sea eddy in the Algerian Basin S. Ruiz a, * , J. Font a , M. Emelianov a , J. Isern-Fontanet a , C. Millot b , J. Salas a , I. Taupier-Letage b a Institut de Cie `ncies del Mar (CMIMA-CSIC), P. Maritim 37-49, 08003 Barcelona, Spain b Laboratoire d’Oce ´anographie et de Bioge ´ochimie, COM-CNRS, BP330, 83507 La Seyne-sur-Mer, France Received 16 November 2000; accepted 1 August 2001 Abstract The Algerian Basin dynamics is dominated by the presence of very energetic mesoscale structures. Deep open sea eddies are key features that influence the regional circulation of water masses at all depths. In May 1998, an open sea eddy was sampled near 38jN2jE by means of CTD, Acoustic Doppler Current Profiler (ADCP) and surface Lagrangian drifters. For the first time, it has been possible to characterise one of these mesoscale structures in its full depth, down to 2800 m. The density distribution indicated the presence of lighter water in the centre of the eddy from the surface to the bottom. The direct velocity measurements in the surface layer, plus the determination of the baroclinic shear from CTD data, evidenced that the anticyclonic motion was present in the whole water depth. D 2002 Elsevier Science B.V. All rights reserved. Keywords: Mesoscale eddies; Hydrographic measurements; Lagrangian buoys; ADCP; Altimetry; Deep circulation; Mediterranean Sea; Algerian Basin 1. Introduction The Algerian Basin occupies most of the southern part of the western Mediterranean Sea. Due to its geographic characteristics, the Algerian Basin dynam- ics is dominated by the interaction between light waters of recent Atlantic origin and the resident denser waters. The major feature of its circulation is the Algerian current (AC), the alongslope flow that drives the Modified Atlantic Water (MAW), incoming from Gibraltar, to the rest of the western and eastern Mediterranean Basins (Millot, 1985). Due to complex hydrodynamical processes, baroclinic/barotropic insta- bility mainly, this alongslope current generally devel- ops meanders as soon as 0 – 1jE, creating an upwelling cell and an anticyclonic eddy inside. Usually, a shal- low and short-lived cyclonic circulation also develops upcrest of the meander (Millot, 1999), while the meander itself is the most energetic part of the meso- scale structure. Anticyclonic eddies can rapidly grow up to 50–100 km in diameter, and drift eastwards along the slope at a few km/day. In some cases, they are associated to a bigger deep anticyclonic circulation (Millot, 1994; Millot et al., 1997; Obaton et al., 2000). They are then called events, and are generated only a few times a year. Most of these energetic events are 0924-7963/02/$ - see front matter D 2002 Elsevier Science B.V. All rights reserved. PII:S0924-7963(02)00058-1 * Corresponding author. Present affiliation: Instituto Mediterra ´- neo de Estudios Avanzados, (CSIC-UIB), Palma de Mallorca, Spain. Tel.: +34-971-611732; fax: +34-971-611761. E-mail address: [email protected] (S. Ruiz). www.elsevier.com/locate/jmarsys Journal of Marine Systems 33 – 34 (2002) 179 – 195
Transcript
Deep structure of an open sea eddy in the Algerian Basin
S. Ruiz a,*, J. Font a, M. Emelianov a, J. Isern-Fontanet a, C. Millot b,J. Salas a, I. Taupier-Letage b
aInstitut de Ciencies del Mar (CMIMA-CSIC), P. Maritim 37-49, 08003 Barcelona, SpainbLaboratoire d’Oceanographie et de Biogeochimie, COM-CNRS, BP330, 83507 La Seyne-sur-Mer, France
Received 16 November 2000; accepted 1 August 2001
Abstract
The Algerian Basin dynamics is dominated by the presence of very energetic mesoscale structures. Deep open sea eddies are
key features that influence the regional circulation of water masses at all depths. In May 1998, an open sea eddy was sampled
near 38jN 2jE by means of CTD, Acoustic Doppler Current Profiler (ADCP) and surface Lagrangian drifters. For the first time,
it has been possible to characterise one of these mesoscale structures in its full depth, down to 2800 m. The density distribution
indicated the presence of lighter water in the centre of the eddy from the surface to the bottom. The direct velocity
measurements in the surface layer, plus the determination of the baroclinic shear from CTD data, evidenced that the anticyclonic
motion was present in the whole water depth. D 2002 Elsevier Science B.V. All rights reserved.
lite images indicated it was moving to the west at about
2–3 km/day. Thanks to an onboard satellite receiving
station (Sea Space Terascan HRPT), the surface ther-
mal structure was precisely located during the survey.
The strategy of the cruise was designed in order to cross
the eddy in different directions with underway meas-
urements (thermosalinograph, ADCP, XBTs and a
towed undulating CTD in the top 120 m).
Fig. 1. Infrared image of the Algerian Basin in October 1996. Several coastal and open sea eddies can be identified (from Salas, 1999).
S. Ruiz et al. / Journal of Marine Systems 33–34 (2002) 179–195180
2.1. Hydrographic data: CTD
Three CTD transects (Neil Brown Mark III probe,
resolution DT = 0.001 jC, DS = 0.001) were per-
formed perpendicularly to the Balearic islands south-
ern slope (Fig. 3) with stations 5 nautical miles apart:
one along the diameter of the eddy (with casts down
to a few metres from the bottom), and two f 45 km
apart on both sides (casts alternatively to the bottom
and to 1000 dbar). Salinity/density calculations, data
processing and more technical details are the same
than for other cruises on board R/V Hesperides, as
given in Font et al. (1998b). Final profiles were
interpolated with a vertical resolution of 1 m.
2.2. Velocity data: VM-ADCP and surface drifters
Direct velocity measurements in the surface layer
were made by two means: a Vessel Mounted Acoustic
Doppler Current Profiler (VM-ADCP 150 kHz from
RD Instruments) and surface drifters. The VM-ADCP,
which was continuously operating, was configured
with a 4-m depth cell and a total of 80 cells (maximum
depth profile of 328 m). The velocity profiles were
averaged in 10-min intervals. Using differential GPS
positioning, as well as precise heading correction by
means of a 3D GPS, we have computed high accuracy
absolute current profiles in the top 200 m (see for
instance Griffiths (1994) for a detailed description of
the impact of heading error on ADCP velocities).
Below this depth, the quality of the echo signal is
not good enough to obtain precise current velocities.
The mean error in ADCP velocities induced by gyro-
compass heading dependence error was estimated in
4–5 cm s� 1 (Ruiz, 2000). Similar errors on ADCP
data have been found in other cruises using the same
configuration acquisition and equivalent processing
methodology (see Allen et al., 1997). It should be
pointed out that in this part of the Mediterranean, the
tidal current and inertial oscillations are weak (a few
centimetres per second). Therefore, no specific filter-
ing of tidal and inertial oscillation was performed.
Fifteen surface drifting buoys were released across
the eddy following the almost north–south diameter
along the central CTD transect at stations #4 to #18.
They were of the classical TOGA-WOCE standard
type, drogued with a 10-m long holy sock at a mean
depth of 10 m. The drifters’ positions, tracked by
Fig. 2. Sea surface temperature of the Alboran Sea and western Algerian Basin as measured by NOAA/AVHRR on 7 May 1998. The
anticyclonic eddy can be observed south of the Balearic Islands. Image downloaded from the DLR GISIS public server.
S. Ruiz et al. / Journal of Marine Systems 33–34 (2002) 179–195 181
satellite, were received directly on board with the
HRPT station, and through the ARGOS service after
the end of the cruise (more technical details can be
found in Salas, 1999).
2.3. Altimeter data
Radar altimeters can measure the instantaneous sea
level with an error of a few centimetres. This accuracy
is adequate to observe big eddies in the open oceans,
but close to the threshold for detecting mesoscale
structures in most of the Mediterranean. However, the
Algerian Basin is an exception to this since the open sea
eddies at this area are big (f 100 km in radius) and
strong (50 cm/s as a maximum speed) enough to allow
a correct altimeter identification (Iudicone et al., 1998;
Bouzinac et al., 1998; Fuda et al., 2000). Although
tides and atmospheric effects can be modelled and
filtered out from altimeter data, the lack of a precise
geoid knowledge does not allow the use of absolute sea
level measurements but only anomalies in respect to a
temporal average. The energetic character of the Alger-
ian Basin, and the consequent absence of permanent
flows off the Algerian coast, allow the sea level ano-
Fig. 3. Study area south of Ibiza and Formentera Islands, with the bathymetry, CTD stations (cast depth indicated on the right and numeration on
the left) and position of the eddy according to its SST signature.
S. Ruiz et al. / Journal of Marine Systems 33–34 (2002) 179–195182
malies (SLA) to fully describe the circulation features.
Fig. 4 is the SLA map of the Algerian Basin closest
to the cruise dates (18–27 May 1998), where the eddy
sampled during the cruise can be identified near 38jN1.5jE.
A series of SLA maps of combined ERS plus
Topex/Poseidon (T/P) have been used. As ERS has
a repeat cycle of 35 days and Topex/Poseidon of 10
days, the analysed SLA maps are produced at inter-
vals of 10 days. The interpolated SLA maps have
been provided by CLS, Toulouse. The maps of SLA,
combining T/P and ERS data, have been interpolated
on a regular 0.2j� 0.2j grid using a suboptimal
space/time objective analysis (Bretherton et al.,
1976) which takes into account along-track correlated
errors (for a more detailed description of this mapping
technique see Le Traon et al. (1998)).
3. Univariate objective analysis
The higher precision measurements made in the 49
fixed CTD stations were objectively interpolated
using a successive correction scheme (Pedder, 1993)
to a regular grid of 8� 8 km. The scheme uses a
simple Gaussian correlation model with a character-
istic length scale of 25 km, which was computed from
observed data (figure not shown). The method
assumes no correlation between error variance and
isotropic correlation over the scattered data distribu-
tion. A horizontal filter is applied in order to remove
non-resolved structures. This filter consists in a con-
volution of the Gaussian correlation model with a
normal-error filter. We used a cutoff wavelength of 90
km that is imposed by the mean distance between
adjacent transects (f 45 km).
The same objective analysis scheme used with
CTD data has been applied to construct gridded
horizontal fields of velocity from ADCP measure-
ments, as well as from geostrophic computations.
Drifters’ velocities, computed from successive satel-
lite locations, have also been filtered and interpolated
to the same grid.
4. Analysed fields
4.1. Hydrographic results
Fig. 5a shows the potential temperature, salinity
and potential density (sigma–theta) in the top 500
dbar along the central section. The structure of the
isolines is typical of an anticyclonic eddy. Due to the
development of the seasonal thermocline (May is
Fig. 4. Sea level anomaly map generated with ERS2 and Topex/Poseidon altimeter data on 22 May 1998.
S. Ruiz et al. / Journal of Marine Systems 33–34 (2002) 179–195 183
Fig. 5. Vertical distribution of potential temperature, salinity and sigma– theta measured with CTD across the centre of the eddy in a cross-slope
(almost N–S) direction: (a) in the top 500 dbar, (b) between 500 and 1000 dbar and (c) from 1000 to 2800 dbar. The separation between isolines
is not constant, to better display the gradients.
S. Ruiz et al. / Journal of Marine Systems 33–34 (2002) 179–195184
usually the month with the most intense increase in
surface temperature), salinity displays more clearly
this characteristic. In the centre of the eddy, an almost
homogeneous salinity layer (36.9–37.0) is found in
the top 80 dbar, while in the outer edge surface,
salinity is about 37.4. Below 300 dbar for temper-
ature, and 400 dbar for salinity, the presence of
Levantine Intermediate Water (LIW) is indicated by
the presence of relative and absolute maxima, respec-
tively. In this central section, the LIW core values
(h = 13.45 jC at 360 dbar, S = 38.55 psu at 460 dbar)
are found near the centre (slightly south of it),
although higher salinity values (38.56 at 380–400
dbar) were detected in the eastern section. These
values are very similar to those measured by Benzohra
and Millot (1995b) in an open sea eddy around 5j in
May–June 1986, and that appeared to be clearly
higher than in surrounding waters. This is a clear
indication of a possible ‘‘unstructured’’ LIW distribu-
tion, i.e. it forms filaments everywhere in the interior
so that this accounts for the eddy action on the LIW in
the Algerian Basin and contradicts a LIW-westward-
flowing vein.
In the layer 500–1000 dbar (Fig. 5b) the deepening
of isotherms, increased by the relative LIW maximum
just above, is considerable: 13j is found at 930 dbar inthe centre of the eddy and some 150 dbar above on
both sides. The salinity, due to the presence of LIW
until 500–600 dbar, is now decreasing with depth,
which is the typical situation for the Mediterranean.
As LIW was found mainly in the centre (core values)
and the southern half of the section, the isohalines
display an asymmetrical deepening: the saltier water
in the centre is found 130 dbar above in the southern
edge and 180 dbar in the northern edge (e.g. 38.50
isohaline). In spite of this salinity distribution acting
to increase the density in the centre, the temperature
effect dominates and the isopycnals continue to indi-
cate the presence of light waters surrounded by denser
ones. The horizontal gradients have even increased in
the southern part of the eddy: from a slope of 1.5 m/
km for the 28.5 isopycnal (at 200 dbar in the centre) to
2.3 m/km for 29.1 (790 dbar).
The structure of lighter (warmer, although saltier)
water in the centre with respect to the southern part is
maintained in the deep layers (Fig. 5c). However,
isolines tend to become horizontal when approaching
the slope, and below 1300–1400 dbar both isothermsFig. 5 (continued ).
S. Ruiz et al. / Journal of Marine Systems 33–34 (2002) 179–195 185
and isohalines appear tilted in a typical shelf/slope
front position with only an undulation marking the
respectively maximum/minimum values in the centre
of the eddy. Their opposite effects on density result in
a distribution of sigma–theta curves that still present a
strong and not so asymmetrical deepening, so that the
conditions for an anticyclonic motion are maintained.
The slope of isopycnals is 3.5–4 m/km on both sides
when they are near 1200 dbar in the centre. Below
2000 dbar, the centre of the eddy is only 10–15 km
from the continental slope, and the thermal structure
appears as relatively warm water between the centre
and the slope, and colder (� 0.015j) water outside
separated by a marked front (more than 30 m/km). In
density we can only distinguish light water close to
the slope and heavier (+ 0.002rh) offshore. This is
illustrated by a comparison (Fig. 6) of the deep rh
profiles between a station in the centre of the eddy
(#10) and one in the southern edge (#17). Stations
situated at an equivalent radial distance from the
centre in the other two transects (#34, #50 in the
southern edge and #26 in the slope) show a deep
profile very similar to #17. The evident instability of
the density field observed on vertical plots (Fig. 5c,
potential density) is likely an artifact produced by the
analysis scheme because of its 2D character. That is,
the analysis interpolation is performed independently
for each defined level, without any connection
between them, which makes the algorithm to not
exploit the vertical coherence of the data (this limi-
tation has also been reported recently by other authors
(Gomis et al., 2001)). Additionally, in this particular
case, we have to keep in mind that at low levels there
are few available data. However, it is worth remarking
that horizontal distribution of density at different
depths (Fig. 7) confirms the nearly circular structure
with lighter water in the centre. This pattern is main-
tained down to the bottom, in spite of the intersection
with the continental slope.
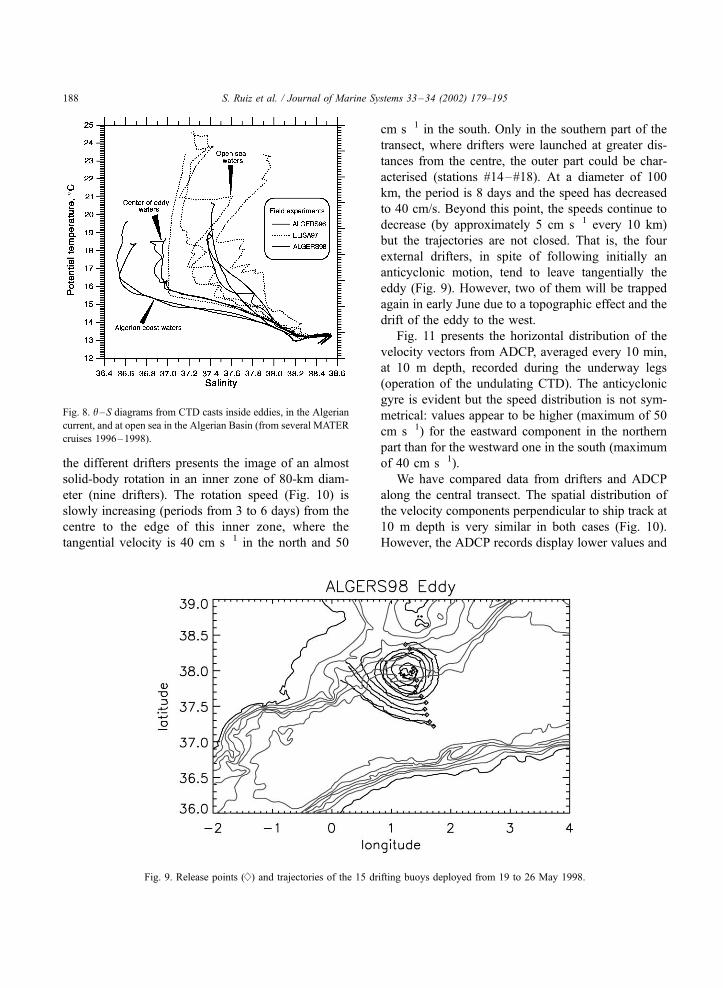
h–S diagrams of stations in the centre of the eddy
compared to others from the Algerian current and open
Algerian Basin (Fig. 8) indicate the different stages of
MAW mixing. Like the one measured in the eastern
Algerian Basin during ELISA in 1997 (Taupier-Letage,
2000), the salinity in the surface layer in the centre of
our eddy lies between the low values of the Algerian
current (36.6 in October 1996) and the higher at open
sea locations (37.2–37.9 in different cruises). This
clearly accounts for the origin of the eddy from the
Algerian current and its further drift in the open basin.
The origin and trajectory specified by Isern-Fontanet et
al. (2000) using a retrospective analysis of satellite
thermal imagery and altimeter sea level anomaly maps,
which showed that the trajectory had not been a typical
one, is confirmed by the present analysis. Instead of
having been released offshore in the channel of Sardi-
nia, it detached in February 1998 from another big
anticyclonic eddy that was in contact with the coast
near 4–5jE.Concerning the detected LIW, it is less mixed in
the centre of the eddy than in other areas of the
western Algerian Basin, but more than in open sea
eddies in the eastern basin as those sampled during
ELISA. These results are consistent with the water
masses distribution found in previous studies (Ben-
zohra and Millot, 1995a; Emelianov et al., 1999).
4.2. Velocity results
4.2.1. Surface velocity
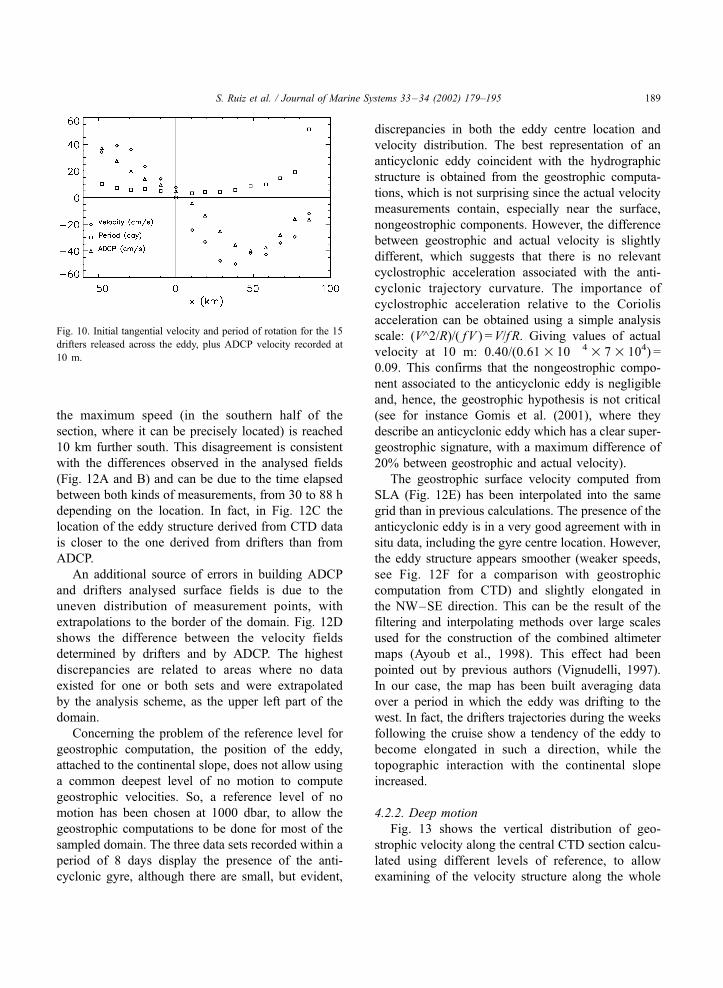
The trajectories of the buoys (Fig. 9) immediately
indicated an anticyclonic sense of rotation with the
centre very close to station #9, since the drifter
launched at that position experienced almost no
motion. A comparison of the successive positions ofFig. 6. Comparison between the deep part of one density profile in
the centre of the eddy (#10) and one in its outer edge (#17).
S. Ruiz et al. / Journal of Marine Systems 33–34 (2002) 179–195186
Fig. 7. Objectively analysed density distributions at different depths from data recorded with CTD at fixed stations. From left to right and top to bottom: 50, 500, 1000, 1500, 2000
and 2500 dbar.
S.Ruizet
al./JournalofMarin
eSystem
s33–34(2002)179–195
187
the different drifters presents the image of an almost
solid-body rotation in an inner zone of 80-km diam-
eter (nine drifters). The rotation speed (Fig. 10) is
slowly increasing (periods from 3 to 6 days) from the
centre to the edge of this inner zone, where the
tangential velocity is 40 cm s�1 in the north and 50
cm s�1 in the south. Only in the southern part of the
transect, where drifters were launched at greater dis-
tances from the centre, the outer part could be char-
acterised (stations #14–#18). At a diameter of 100
km, the period is 8 days and the speed has decreased
to 40 cm/s. Beyond this point, the speeds continue to
decrease (by approximately 5 cm s�1 every 10 km)
but the trajectories are not closed. That is, the four
external drifters, in spite of following initially an
anticyclonic motion, tend to leave tangentially the
eddy (Fig. 9). However, two of them will be trapped
again in early June due to a topographic effect and the
drift of the eddy to the west.
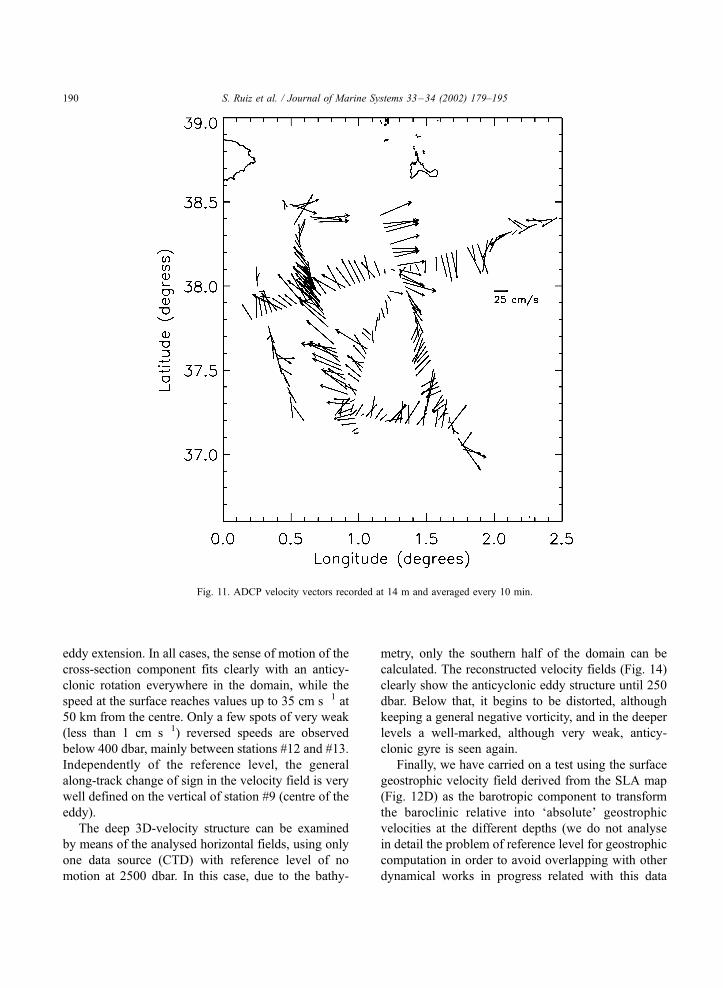
Fig. 11 presents the horizontal distribution of the
velocity vectors from ADCP, averaged every 10 min,
at 10 m depth, recorded during the underway legs
(operation of the undulating CTD). The anticyclonic
gyre is evident but the speed distribution is not sym-
metrical: values appear to be higher (maximum of 50
cm s�1) for the eastward component in the northern
part than for the westward one in the south (maximum
of 40 cm s�1).
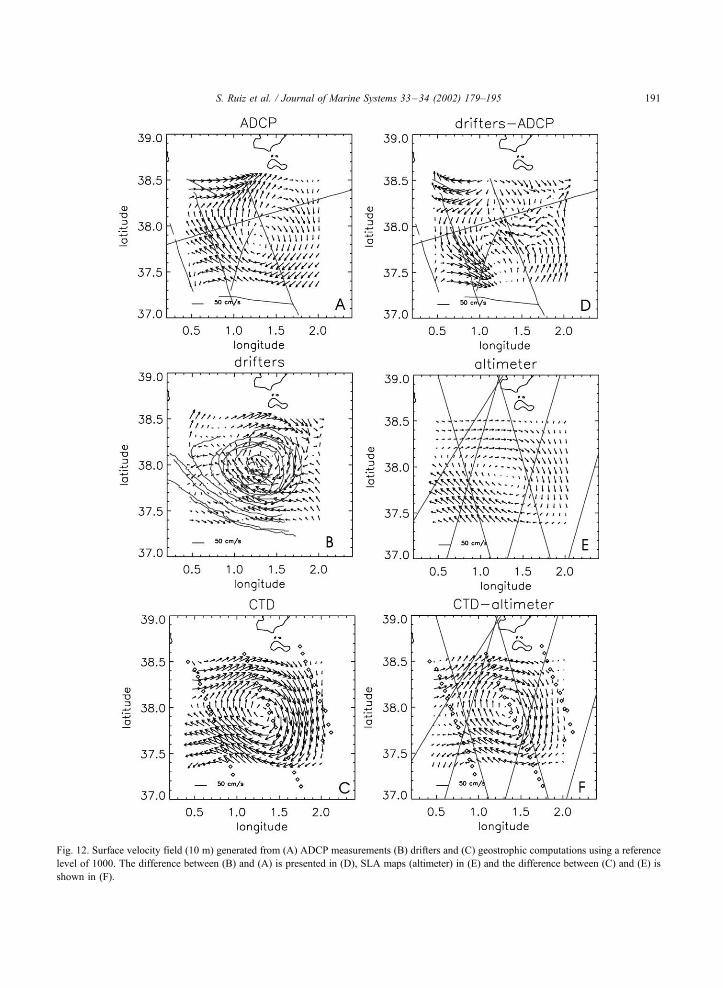
We have compared data from drifters and ADCP
along the central transect. The spatial distribution of
the velocity components perpendicular to ship track at
10 m depth is very similar in both cases (Fig. 10).
However, the ADCP records display lower values and
Fig. 8. h–S diagrams from CTD casts inside eddies, in the Algerian
current, and at open sea in the Algerian Basin (from several MATER
cruises 1996–1998).
Fig. 9. Release points (w) and trajectories of the 15 drifting buoys deployed from 19 to 26 May 1998.
S. Ruiz et al. / Journal of Marine Systems 33–34 (2002) 179–195188
the maximum speed (in the southern half of the
section, where it can be precisely located) is reached
10 km further south. This disagreement is consistent
with the differences observed in the analysed fields
(Fig. 12A and B) and can be due to the time elapsed
between both kinds of measurements, from 30 to 88 h
depending on the location. In fact, in Fig. 12C the
location of the eddy structure derived from CTD data
is closer to the one derived from drifters than from
ADCP.
An additional source of errors in building ADCP
and drifters analysed surface fields is due to the
uneven distribution of measurement points, with
extrapolations to the border of the domain. Fig. 12D
shows the difference between the velocity fields
determined by drifters and by ADCP. The highest
discrepancies are related to areas where no data
existed for one or both sets and were extrapolated
by the analysis scheme, as the upper left part of the
domain.
Concerning the problem of the reference level for
geostrophic computation, the position of the eddy,
attached to the continental slope, does not allow using
a common deepest level of no motion to compute
geostrophic velocities. So, a reference level of no
motion has been chosen at 1000 dbar, to allow the
geostrophic computations to be done for most of the
sampled domain. The three data sets recorded within a
period of 8 days display the presence of the anti-
cyclonic gyre, although there are small, but evident,
discrepancies in both the eddy centre location and
velocity distribution. The best representation of an
anticyclonic eddy coincident with the hydrographic
structure is obtained from the geostrophic computa-
tions, which is not surprising since the actual velocity
measurements contain, especially near the surface,
nongeostrophic components. However, the difference
between geostrophic and actual velocity is slightly
different, which suggests that there is no relevant
cyclostrophic acceleration associated with the anti-
cyclonic trajectory curvature. The importance of
cyclostrophic acceleration relative to the Coriolis
acceleration can be obtained using a simple analysis
scale: (V^2/R)/( f V ) =V/f R. Giving values of actual
velocity at 10 m: 0.40/(0.61�10 � 4� 7� 104) =
0.09. This confirms that the nongeostrophic compo-
nent associated to the anticyclonic eddy is negligible
and, hence, the geostrophic hypothesis is not critical
(see for instance Gomis et al. (2001), where they
describe an anticyclonic eddy which has a clear super-
geostrophic signature, with a maximum difference of
20% between geostrophic and actual velocity).
The geostrophic surface velocity computed from
SLA (Fig. 12E) has been interpolated into the same
grid than in previous calculations. The presence of the
anticyclonic eddy is in a very good agreement with in
situ data, including the gyre centre location. However,
the eddy structure appears smoother (weaker speeds,
see Fig. 12F for a comparison with geostrophic
computation from CTD) and slightly elongated in
the NW–SE direction. This can be the result of the
filtering and interpolating methods over large scales
used for the construction of the combined altimeter
maps (Ayoub et al., 1998). This effect had been
pointed out by previous authors (Vignudelli, 1997).
In our case, the map has been built averaging data
over a period in which the eddy was drifting to the
west. In fact, the drifters trajectories during the weeks
following the cruise show a tendency of the eddy to
become elongated in such a direction, while the
topographic interaction with the continental slope
increased.
4.2.2. Deep motion
Fig. 13 shows the vertical distribution of geo-
strophic velocity along the central CTD section calcu-
lated using different levels of reference, to allow
examining of the velocity structure along the whole
Fig. 10. Initial tangential velocity and period of rotation for the 15
drifters released across the eddy, plus ADCP velocity recorded at
10 m.
S. Ruiz et al. / Journal of Marine Systems 33–34 (2002) 179–195 189
eddy extension. In all cases, the sense of motion of the
cross-section component fits clearly with an anticy-
clonic rotation everywhere in the domain, while the
speed at the surface reaches values up to 35 cm s�1 at
50 km from the centre. Only a few spots of very weak
(less than 1 cm s�1) reversed speeds are observed
below 400 dbar, mainly between stations #12 and #13.
Independently of the reference level, the general
along-track change of sign in the velocity field is very
well defined on the vertical of station #9 (centre of the
eddy).
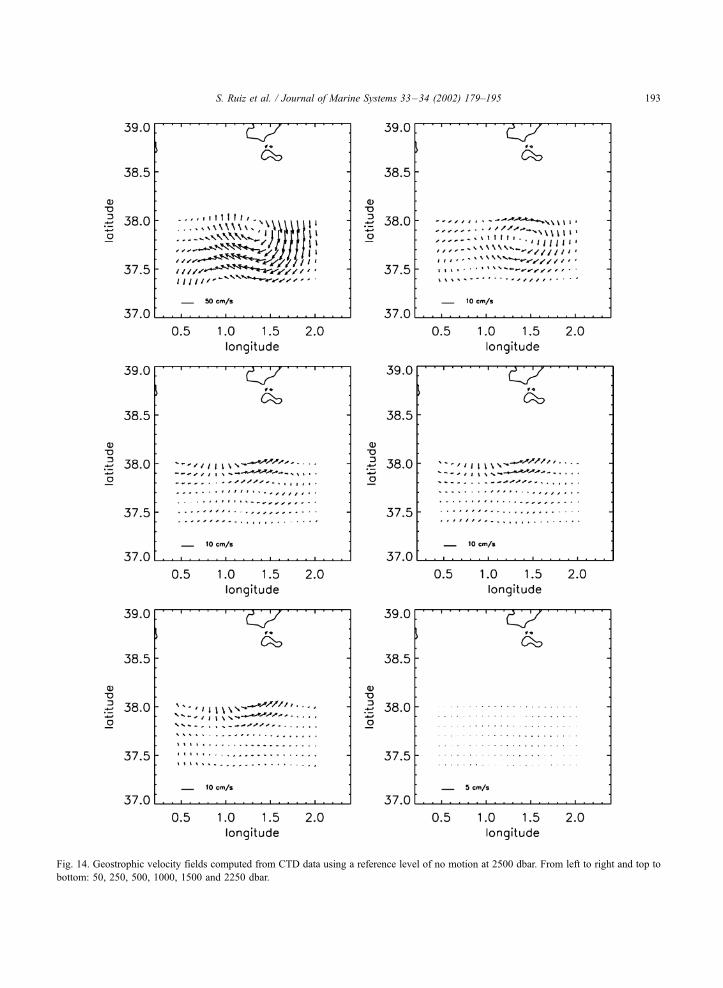
The deep 3D-velocity structure can be examined
by means of the analysed horizontal fields, using only
one data source (CTD) with reference level of no
motion at 2500 dbar. In this case, due to the bathy-
metry, only the southern half of the domain can be
calculated. The reconstructed velocity fields (Fig. 14)
clearly show the anticyclonic eddy structure until 250
dbar. Below that, it begins to be distorted, although
keeping a general negative vorticity, and in the deeper
levels a well-marked, although very weak, anticy-
clonic gyre is seen again.
Finally, we have carried on a test using the surface
geostrophic velocity field derived from the SLA map
(Fig. 12D) as the barotropic component to transform
the baroclinic relative into ‘absolute’ geostrophic
velocities at the different depths (we do not analyse
in detail the problem of reference level for geostrophic
computation in order to avoid overlapping with other
dynamical works in progress related with this data
Fig. 11. ADCP velocity vectors recorded at 14 m and averaged every 10 min.
S. Ruiz et al. / Journal of Marine Systems 33–34 (2002) 179–195190
Fig. 12. Surface velocity field (10 m) generated from (A) ADCP measurements (B) drifters and (C) geostrophic computations using a reference
level of 1000. The difference between (B) and (A) is presented in (D), SLA maps (altimeter) in (E) and the difference between (C) and (E) is
shown in (F).
S. Ruiz et al. / Journal of Marine Systems 33–34 (2002) 179–195 191
Fig. 13. Vertical distribution of geostrophic velocity across the eddy with reference level at 800, 1500 and 2500 dbar. Left is north and right is
south. Isolines are at 1 cm/s intervals under 5 cm/s and at 5 cm/s above it. (Positive values into section.)
S. Ruiz et al. / Journal of Marine Systems 33–34 (2002) 179–195192
Fig. 14. Geostrophic velocity fields computed from CTD data using a reference level of no motion at 2500 dbar. From left to right and top to
bottom: 50, 250, 500, 1000, 1500 and 2250 dbar.
S. Ruiz et al. / Journal of Marine Systems 33–34 (2002) 179–195 193
set). As the surface eddy detected by altimetry is
weaker compared to the structure measured in situ,
the resulting velocity fields (not shown) are also
weaker. Subsequently, the baroclinic shear forces an
inversion of the sense of rotation below 100 dbar, so
that the eddy becomes clearly cyclonic. This is in
contradiction with in situ data (ADCP) that until 250
m, the deepest velocity measurements available still
show an anticyclonic motion. Hence, the SLA map, in
spite of providing the kind of information needed for
geostrophic calculations (sea surface slope), is too
coarse to compute the eddy barotropic velocity with
an accuracy to resolve the deep motion.
Independently from velocity measurements or indi-
rect calculations, the penetration in depth of an anti-
cyclonic eddy detected in the surface can be diagnosed
from theoretical assumptions. Gill (1981) analysed the
problem of a homogeneous intrusion in a stratified
rotating fluid. He demonstrated that an intrusion with
horizontal scale L, into an initially linearly stratified
fluid with Brunt-Vaisala frequency N, will produce a
density irregularity with a vertical scale of order
Hf fL/N, where f is the Coriolis parameter. Introduc-
ing in this formula the typical values obtained during
our eddy observations ( ff 10�4 s�1, Lf 105 and
Nf 10�3 s�1) we obtain H > 2000 m. This is a rather
rough estimation but consistent with the results of our
observations.
5. Summary and discussion
During the May 1998 MATER cruise, an open sea
mesoscale eddy in the Algerian Basin has been
sampled for the first time from the surface to the
bottom, at 2800 m. CTD casts, ADCP velocity pro-
files and Lagrangian surface drifters have allowed a
characterisation of the surface velocity field and the
hydrographic structure in the whole water depth. In
the upper levels, we have reported small differences (a
few centimetres per second) between actual and geo-
strophic currents, which suggest the absence of sig-
nificant ageostrophic motion associated to the gyre.
The successive position of the different drifters
presents the image of an almost solid-body rotation
in an inner zone of 80-km diameter, with maximum
velocities of 50 cm s� 1 in the south. The differences
between ADCP and drifters data at upper levels (10
m) in terms of magnitude and position of the eddy are
due to the time elapsed between both kinds of
measurements. Concerning the geostrophic computa-
tions, we have found that independently of the refer-
ence level chosen, there is a clear change of sign in the
velocity field, which is defined on the vertical of CTD
station #9.
We have identified an intermediate degree of
MAW mixing, comparing the hydrographic properties
of the centre of the eddy with hydrographic properties
of the Algerian current and the open sea eddies in the
eastern Algerian Basin. This clearly accounts for the
origin of the eddy from the Algerian current and its
further drift in the open basin. Concerning the pres-
ence of the eddy at deep levels, although the signal is
very weak, the geostrophic computations evidence an
anticyclonic rotation and the nearly circular structure
with lighter water in the centre is well marked by the
horizontal analysis of density field.
Acknowledgements
The authors are grateful to the HESPERIDES
master and crew, as well as to all the colleagues on
board, for their efficient cooperation. The cruise was
funded by the Spanish National R +D Plan under
grants MAR96-2585-C03-CE and MAR97-1930-E.
Satellite infrared images previous to the cruise were