DeepEdgeNet: Edge Detection With EfficientNets. Category: Computer Vision Atem Aguer Stanford University [email protected]Dean Zhou Stanford University [email protected]Abstract Traditional edge detection methods normally involve the use of carefully hand- crafted filters or kernels that are convolved with images to produce feature maps representing gradient changes between pixels in images that are then used to detect edges in the image. Despite working decently well when it comes to detecting edges, traditional methods like Canny, Sobel, etc can’t still have a holistic and semantic understanding of the content in images which tends to bring limited accuracy in predictions made. With the recent rise and success of deep learning and convolutional neural networks in the past decade in their application to object detection, image classification, and feature learning, their use for edge detection was explored by papers like CASEnet, HED (Holistically-Nested Edge Detection), DexiNed (Dense Extreme Xception Network), etc. In this paper, we intend to use the learnings from DexiNed, HED, and CASEnet to explore, investigate, and build a robust deep neural network for holistic and reliable edge detection in images. 1 Introduction Edge detection is important for a variety of computer vision tasks, such as line and lane detection, semantic segmentation, object recognition, medical imaging, photo sketching, etc. Pushing the upper bound on edge detection algorithms would greatly aid many different fields and is part of the baseline of many other machine learning algorithms. Our primary motivation for pursuing edge detection was the improvement of algorithms in self-driving cars, but the need for edge detection is so ubiquitous that it can be used in a variety of different problems. The input to our algorithm is simply an image. We will use a neural network to output a predicted edge map. 2 Related work Deep neural nets have been previously explored in the field of semantic edge detection. Some of these research projects have achieved significantly accurate results in their experiments using different techniques. CASEnet used a novel end-to-end deep semantic edge learning architecture based on ResNet and a new skip-layer architecture where category-wise edge activations at the top convolution layer share and are fused with the same set of bottom layer features. DexiNed, on the other hand, proposed a Dense Extreme Inception Network architecture, consisting of an encoder composed of six main blocks each of which is composed by sub-blocks that are densely interconnected by the output of the previous main block. This dense structure enabled their feature extraction network to propagate edge features much deeper layers within the network. HED upon which both DexiNed and CASEnet drew their inspiration used a holistic image training and prediction approached coupled with multi-level and multi-scale feature learning to classify edges in images. Similarly, traditional CS230: Deep Learning, Autumn 2020, Stanford University, CA. (LateX template borrowed from NIPS 2017.)
Transcript
DeepEdgeNet: Edge Detection With EfficientNets.Category: Computer Vision
Traditional edge detection methods normally involve the use of carefully hand-crafted filters or kernels that are convolved with images to produce feature mapsrepresenting gradient changes between pixels in images that are then used to detectedges in the image. Despite working decently well when it comes to detectingedges, traditional methods like Canny, Sobel, etc can’t still have a holistic andsemantic understanding of the content in images which tends to bring limitedaccuracy in predictions made. With the recent rise and success of deep learningand convolutional neural networks in the past decade in their application to objectdetection, image classification, and feature learning, their use for edge detectionwas explored by papers like CASEnet, HED (Holistically-Nested Edge Detection),DexiNed (Dense Extreme Xception Network), etc. In this paper, we intend to usethe learnings from DexiNed, HED, and CASEnet to explore, investigate, and builda robust deep neural network for holistic and reliable edge detection in images.
1 Introduction
Edge detection is important for a variety of computer vision tasks, such as line and lane detection,semantic segmentation, object recognition, medical imaging, photo sketching, etc. Pushing the upperbound on edge detection algorithms would greatly aid many different fields and is part of the baselineof many other machine learning algorithms. Our primary motivation for pursuing edge detection wasthe improvement of algorithms in self-driving cars, but the need for edge detection is so ubiquitousthat it can be used in a variety of different problems. The input to our algorithm is simply an image.We will use a neural network to output a predicted edge map.
2 Related work
Deep neural nets have been previously explored in the field of semantic edge detection. Some of theseresearch projects have achieved significantly accurate results in their experiments using differenttechniques. CASEnet used a novel end-to-end deep semantic edge learning architecture based onResNet and a new skip-layer architecture where category-wise edge activations at the top convolutionlayer share and are fused with the same set of bottom layer features. DexiNed, on the other hand,proposed a Dense Extreme Inception Network architecture, consisting of an encoder composed ofsix main blocks each of which is composed by sub-blocks that are densely interconnected by theoutput of the previous main block. This dense structure enabled their feature extraction network topropagate edge features much deeper layers within the network. HED upon which both DexiNed andCASEnet drew their inspiration used a holistic image training and prediction approached coupledwith multi-level and multi-scale feature learning to classify edges in images. Similarly, traditional
CS230: Deep Learning, Autumn 2020, Stanford University, CA. (LateX template borrowed from NIPS 2017.)
methods like Sobel, Roberts, Prewitt operators have been extensively used for edge detection fordecades.
From exploring and investigating DexiNed, HED, and CASEnet, we made some key learnings andobservations which we have listed below:
• All of them had a feature extraction backbone that fed their multi-layer feature outputs tocorresponding upsampling layers. CASEnet and HED used pretrained CNN network as afeature extractor for multi-level and multi-scale image features while DexiNed developed adense extreme inception model inspired by the Xception Network[5]. In the case of HED,a VGG-16 network pretrained on ImageNet was used, while DexiNed used a more robustDense Extreme Inception architecture with residual style skip connections to extract andpropagate far richer edge feature information to deeper layers in the network.
• They all use an upsampling layer to reproduce scaled intermediate edge maps at differentlayers within the network. The multi-level intermediate maps are then fused together tocreate a final output.
• DexiNed used an Xception style network as its backbone for feature extraction in contrastto the VGG-16 network used in the HED network. The Xception architecture which usesdepthwise separable convolutions has significant advantages over the VGG-16 network inthat it is less computationally expensive, uses far fewer parameters, and extracts more edgefeature information which is learned in deeper layers of the network which enabled DexiNedto predict highly accurate and thin edges images.
• The accuracy of the results of each model was also mainly impacted by how robust it’sfeature extraction backbone was. DexiNed which used a dense extreme inception networkperformed better than CASEnet which used a ResNet-50 network and HED used a VGG-16network. From this observation, we concluded that using a robust feature extractor is crucialin producing accurate edge maps.
• In conclusion, all the above-listed edge detection architecture share similar traits. Theyinvolve a backbone network that acts as a feature extractor, upsampling blocks are used toupscale the multi-level feature maps, and then the outputs are fused into a final output.
3 Dataset
We used the Kaggle dataset BIPED (https://www.kaggle.com/xavysp/biped). The dataset consistsof 250 images, 200 of which are training, and 50 of which are test images. All of the images are1280x720. The dataset also comes with human-labeled edge maps. We used the 50 test images forour evaluation.
We used but technically did not train nor evaluate on the Cityscapes dataset (https://www.cityscapes-dataset.com/). The dataset consists of 5000 images, 3000 of which are training, 500 of which arevalidation, and 1500 which are test images. All of the images are 2048x1024. These images do notcome with human-labeled edge maps, but with human-labeled segmentation masks. We mostly usedthese images to test our padding implementation and visually see our progress because the imagesare high quality but we do not have labels in the format that we want.
We used the BSDS300 benchmark for training. The dataset contains 300 images, with 100 of thembeing test images. We also chose to create a different run where we train only on the BSDS300dataset training images (somewhat overfitting) in an effort to score well on the BSDS300 benchmark.
We used the PASCAL Boundaries Dataset, also known as the Semantic Boundaries Dataset(SBD). This dataset is based on the object detection PASCAL VOC 2012 dataset, except it is labeledfor segmentation and edge detection. The SBD dataset and benchmark is very large, consisting ofover 11,000 images of various sizes, that are not split up into train and test yet. It is important tonotice that some of the BSDS300 and the SBD datasets overlap, so we made sure not to train on oneand evaluate on the other.
2
4 Method
Our method was inspired by CASEnet, HED, and DexiNed architectures. Initially, we had chosen toreplace the standard convolution blocks used in DexiNed with Xception[5] blocks that use depth-wiseseparable convolutions. Chollet et al showed in their paper that they are better feature extractors.However, after our milestone, we learned of a newly released type of CNN architectures calledEfficientNets[6] that not only outperformed the state-of-the-art CNN architectures on different imageclassification benchmarks but also have a significantly smaller number of parameters and are faster totrain.
We, therefore, decided to use an EfficientNet backbone as a feature extractor with upsampling blocksfrom DexiNed to upscale the multi-level intermediate outputs from different layers within EfficientNetto original real image sizes. The different outputs from the upsampling blocks are then fused to formone final edge map output.
Figure 1: Common feature extractor backbone andside layer upsampling architecture used. Figure isfrom the CASEnet paper.
Figure 2: OurEfficientNetbackbone.
5 Loss Function
For our loss function, we used the same weighted cross-entropy loss function used by DexiNed,CASEnet, and HED which is given below:
ln(W,ωn) = −β∑j∈Y +
log σ(yj = 1|X;W,ωn)− (1− β)∑j∈Y −
log σ(yj = 0|X;W,ωn),
then,
L(W,ω) =
N∑n=1
δn × ln(W,ωn)
where ln(W,ωn) is the side-output loss for each level in the network, W represents all networkparameters, ω represents the side-output loss weights ,X represents the collection of input images, δis a weight for each scale level and β =|Y−|/|Y + + Y | and (1 - β) =|Y+|/|Y + + Y |. (|Y |, |Y +|denote the edge and non-edge pixels in the ground truth).
6 Evaluation & Experiments
Many of the papers’ datasets and benchmarks chose to employ the following evaluation metrics: fixedcontour threshold (ODS), per-image best threshold (OIS), and average precision (AP). To evaluate ourmethods, we trained the model several datasets that include Cityscapes, SBD, and BIPED, and usedthe BIPED benchmark and calculated those evaluation metrics to determine how good our modelperforms in comparison.
3
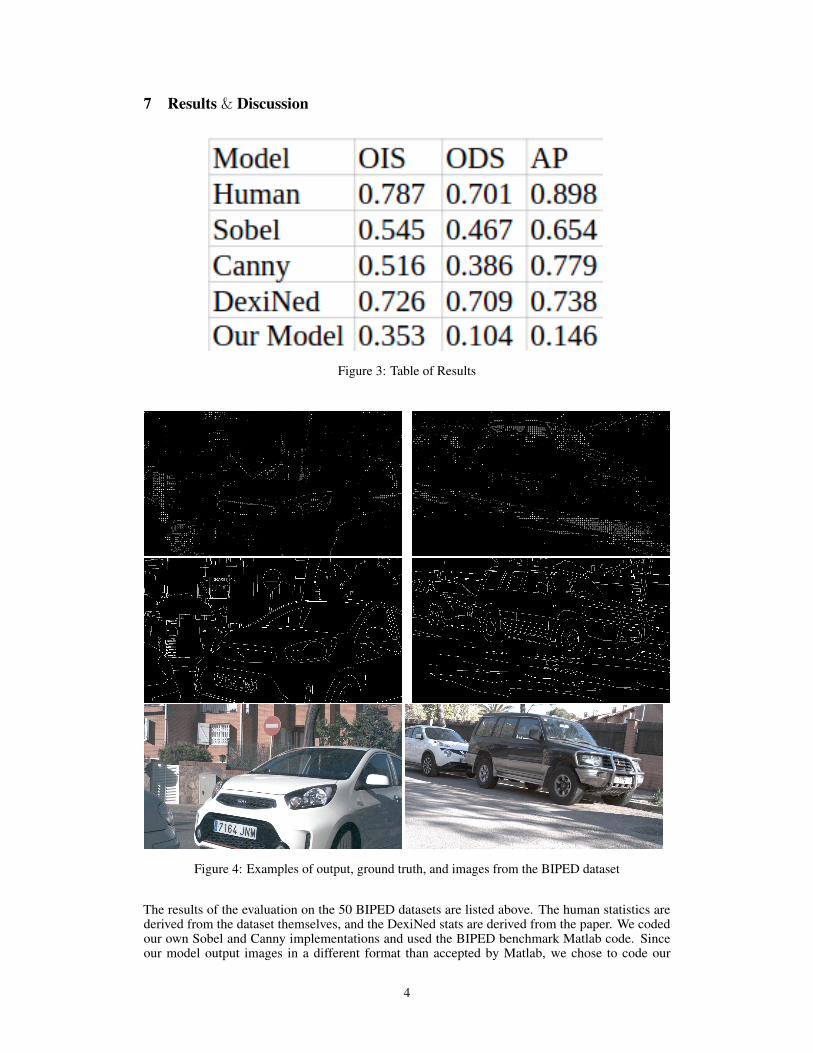
7 Results & Discussion
Figure 3: Table of Results
Figure 4: Examples of output, ground truth, and images from the BIPED dataset
The results of the evaluation on the 50 BIPED datasets are listed above. The human statistics arederived from the dataset themselves, and the DexiNed stats are derived from the paper. We codedour own Sobel and Canny implementations and used the BIPED benchmark Matlab code. Sinceour model output images in a different format than accepted by Matlab, we chose to code our
4
own implementation of the various evaluation metrics for specific image formats and arrived at thefollowing metrics for our model on the BIPED benchmark. It is very clear that our model is not up tostandard, not surpassing the Sobel nor the Canny filter in performance. If you look at the generatededge maps, it seems that they are decent, but that they are still not as good as the Sobel or Cannybaselines, so the evaluation metrics make sense.
One concern is that our implementation of the evaluation metrics may not be completely accurate.This may be true, but it does not change the immediate conclusion from looking at the outputtededge maps that our model does not outperform baseline models. The quantitative analysis created bythe code, then, is more of just verification, and only really matters when you get to the upper end ofperformance.
Another common concern that may be raised is the relative low-scoring nature of F1 scores (whichOIS and ODS are based upon). An image that is random often gets an F1 score of 0.5 for example. Inthis case, F1 scores are actually based upon positive pixels only and their relation to false positivesand false negatives. This means that images that mostly consist of 0 values actually receive lowerscores, lower than the perceived random of 0.5. It turns out that all of the edge maps largely consistof negative or ’non-edge’ pixels, which drives the F1 scores to be relatively low.
Our results were not the greatest. The OIS, ODS, and AP were all lower than the baseline models, butthat was almost to be expected, as our model is not as robust and was not trained as long as those inCutting-edge research. You can also see that our model actually performs quite well in the examples.Note in the images that the edge-map output at the top and the ground truth is in the middle. We alsowould like to clarify that results obtained by our model were after 10 epochs of training with no skipconnections. Due to time constraints we were unable to include those residual skip connections [8]which we believe should have drastically improved our accuracy.
8 Conclusion
In conclusion, our investigation reveals that in order for a neural net based edge detector to performgood edge detection, it requires a robust feature extractor, most preferably one that is dense anddeeply supervised.
9 Future Work
Edge detection is a preliminary task in many computer vision applications involving objectiondetection, line and shape detection, image segmentation, etc. In the future, we intend to extend ourwork to the task of line and lane detection for autonomous driving agents, something that actuallyinspired this project.
10 Author Contributions
Dean Zhou wrote the code for generalized evaluation metrics of MSELoss, OIS, ODS, and AP onedge maps. Dean Zhou wrote the code for baseline models of the Sobel and Canny Filter. Dean Zhouwrote code and organized the file systems so the images produced by the model could be comparedagainst their counterparts in the datasets.
Atem performed the literature review and designed the architecture of the model. He also wrote thecode, trained and tested our model which integrates DexiNed upsampling blocks and EfficientNetpytorch implementations.
The authors are also grateful to TA Divyansh Garg for valuable insights on architecture developmentand current literature as well as deep learning in general.
We also want to acknowledge the developers of the EfficientNet pytorch implementation that we usedin our model and also the developers that created the DexiNed pytorch version which we used in ourmodel as well.
5
References
[1] X. Soria, E. Riba and A. Sappa, "Dense Extreme Inception Network: Towards a Robust CNN Model for EdgeDetection," 2020 IEEE Winter Conference on Applications of Computer Vision (WACV), Snowmass Village,CO, USA, 2020, pp. 1912-1921, doi: 10.1109/WACV45572.2020.9093290.
[2] Z. Yu, C. Feng, M. Liu and S. Ramalingam, "CASENet: Deep Category-Aware Semantic Edge Detection,"2017 IEEE Conference on Computer Vision and Pattern Recognition (CVPR), Honolulu, HI, 2017, pp. 1761-1770, doi: 10.1109/CVPR.2017.191.
[3] Ronneberger, Olaf; Fischer, Philipp; Brox, Thomas (2015). "U-Net: Convolutional Networks for BiomedicalImage Segmentation". arXiv:1505.04597
[4] Xie, Saining, and Zhuowen Tu. "Holistically-nested edge detection." Proceedings of the IEEE internationalconference on computer vision. 2015.
[5] Yu, Zhiding, et al. "Casenet: Deep category-aware semantic edge detection." Proceedings of the IEEEConference on Computer Vision and Pattern Recognition. 2017.
[6] Chollet, François. "Xception: Deep learning with depthwise separable convolutions." Proceedings of theIEEE conference on computer vision and pattern recognition. 2017.
[7] Tan, Mingxing, and Quoc V. Le. "Efficientnet: Rethinking model scaling for convolutional neural networks."arXiv preprint arXiv:1905.11946 (2019).
[8] He, Kaiming, et al. "Deep residual learning for image recognition." Proceedings of the IEEE conference oncomputer vision and pattern recognition. 2016.
Appendix A - Mathematical Formulas and Metrics for Evaluation
First, we must understand our labels and our outputs. Labels are edge maps, which are essentially black andwhite (boolean) images, with white representing that there is an edge at that pixel location. The images thatwe produce as outputs are edge probability maps, where each pixel has an assigned floating point numberrepresenting the probability that the model believes it is an edge.
The following describes the math behind the evaluation metrics and the formulas for calculatingthem, but in reverse order, sorted by their difficulty to describe.
Average precision is rather simple, where we go through every pixel in every image and sum up theprobability for all of the pixels that are labeled as edges and divide it by the total number of pixels that are edges.One of the following formulas is below:
AveP =
∑nk=1(P (k)× rel(k))
number of relevant documents,
where rel(k) is an indicator function equaling 1 if the item at k is an edge, and zero otherwise. Note that theaverage is over all edges and all non-edges get a precision score of zero. Another way to calculate AveragePrecision is integrating over the precision-recall curve. Notice that this metric strictly measures precisionbecause an edge map with all probabilities of 1 will get an average precision of 1.
The next metric to describe is per-image best threshold (OIS). The idea behind per-image best thresh-old is that there is an image has a threshold selected such that all pixels with probability above it is white, and allpixels with probability below it is black. Then, we can conduct an F1 score between the this new thresholdededge map and the label edge map. The value that is determined to be OIS is actually the max F1 score thatcan be attained by setting the threshold to any value. Let this threshold value be represented by the symbol θ.Mathematically, we can express OIS as
OIS(img, label) =1
len(images)
∑img∈images
maxθ F1Score(thresholdImage(img, θ), label)
. When we average this for every image, we get the per-image best threshold, or OIS.
The final metric, fixed contour threshold (ODS), is much easier to explain in the context of OIS. Thethought is the exact same as OIS, except that the threshold, θ, is kept fixed for the entire evaluation. Fortesting/evaluation, the threshold value is set for the optimum for the training set. More formally, we can expressODS as
ODS(img, label) =1
len(images)maxθ
∑img∈images
F1Score(thresholdImage(img, θ), label)
6
The difference is very subtle and lies in the ordering of the maximization and summation. Notice that OIS for adataset will always be greater than or equal to the ODS of a dataset. Also note that benchmarks oftentimes havemultiple human ’truth’ labels, where all of these metrics are calculated with the best per-pixel label match,which artificially boosts the F1-scores but since this boosting is relatively standardized the evaluation is still justas effective.
Just for extra simplification or verification, we decided to evaluate the baselines of our model withMean Square Error (MSE). For preliminary results, the Canny Edge Detector has an average MSE of 3519.6over the 200 BIPED images, and the Sobel Filter has an average MSE of 2067.4 over the 200 BIPED images.This discrepancy is most likely due to the fact that our Sobel filter is not yet thresholded, while the Canny EdgeDetector already has detected its optimal threshold.