Deer Hunter Demography: Age, Period, and Cohort Analysis of Trends in Hunter Participation in Wisconsin Richelle Winkler, Applied Population Lab, University of Wisconsin- Madison 316 Ag Hall 1450 Linden Dr. Madison, WI 53706 608-262-1216 (phone) 608-262-6022 (fax) [email protected]Jennifer Huck, Applied Population Lab, University of Wisconsin- Madison 316 Ag Hall 1450 Linden Dr. Madison, WI 53706 608-890-2077 (phone) 608-262-6022 (fax) [email protected]Keith Warnke, Wisconsin Department of Natural Resources, Wildlife Management 101 S Webster Street - WM/6 Madison WI 53703 608-264-6023 (phone) [email protected]
Transcript
Deer Hunter Demography: Age, Period, and Cohort Analysis of Trends in Hunter Participation in Wisconsin
Richelle Winkler, Applied Population Lab, University of Wisconsin- Madison 316 Ag Hall 1450 Linden Dr. Madison, WI 53706 608-262-1216 (phone) 608-262-6022 (fax) [email protected] Jennifer Huck, Applied Population Lab, University of Wisconsin- Madison 316 Ag Hall 1450 Linden Dr. Madison, WI 53706 608-890-2077 (phone) 608-262-6022 (fax) [email protected] Keith Warnke, Wisconsin Department of Natural Resources, Wildlife Management 101 S Webster Street - WM/6 Madison WI 53703 608-264-6023 (phone) [email protected]
Abstract The deer herd in the State of Wisconsin is largely kept in check by private hunters who purchase licenses and kill deer each fall. Not only is hunting vital to wildlife management efforts, but it is also an important cultural activity through which people become intricately connected to the natural world. However, purchases of deer hunting licenses by Wisconsin hunters have declined in recent years, and as the Baby Boom generation ages, this decline may become more exacerbated over the next several years. This study takes a demographic perspective to analyzing this applied problem faced by the Wisconsin Department of Natural Resources. We employ an Age-Period-Cohort (APC) approach to analyzing deer hunting participation rates over time by age, sex, and type of license (gun vs. archer). Here, we compare age, period, and cohort effects to gain an understanding of how changes in participation rates are related to the changing age structure of the Wisconsin population, generational/cohort differences in likelihood to hunt, and/or specific events, such as the discovery of Chronic Wasting Disease (CWD) in the Wisconsin herd. Building on this analysis, we then generate and compare projections of future deer hunters using cohort component, share, and APC estimation methods. Overall, we find that male gun hunter decline is due to a combination of age, cohort, and period effects. Constant rate share projections suggest slight increases in the male gun hunter population between 2007 and 2030, while cohort component and APC models project significant decline.
Keywords: population projections, APC analysis, age effects, period effects, cohort effects, applied demography, deer hunting
Note: Please recognize that this paper is a work in progress. It should be considered to be in draft form.
1
Demographers have long been interested in the ways through which changes in vital rates by age, period, and cohort impact population processes. In fact, age, period, and cohort approaches to understanding populations lie at the core of how demographers address questions, because they lend understanding to the “how and why” behind population change. Similarly, applied demographers should consider and control for the potential impact of differences by age, period, and/or cohort in examining population change and generating population estimates and projections. However, specific, easily applied, approaches to dealing with age-period-cohort (APC) effects, particularly in conjunction with one another, have long been missing from the applied demographer’s toolkit.
This paper presents one potential way that applied demographers can integrate APC analyses into their work to better understand population change and to project future population using the case of the deer hunter population in the State of Wisconsin. In this case, exploratory data analysis showed evidence of age, period, and cohort effects explaining observed deer hunter population decline. However, because these processes are integrally related, the independent effects of age, period, and cohort are difficult to understand and explain using standard applied demographic tools. Still, better understanding these independent effects would provide insight into how and why the deer hunter population has declined in recent years and how it is likely to change in the future. For these reasons, we employ an APC analysis to estimate the independent effects of age, period, and cohort on recent deer hunter population change, and we generate a model based on these estimates to project future hunter populations. Finally, these APC-based projections are compared conceptually and empirically to more traditional share and cohort-component methods of population projection. Our purpose is not to present this specific APC model as a superior method of population projection, but rather to encourage applied demographers to thoughtfully consider age-period-cohort effects and to experiment with new ways to include these issues in analyses. This paper offers some examples of how age, period, and cohort effects can be considered in an applied case and what might be gained through this process.
The Case
This paper is the result of a study undertaken by the Applied Population Laboratory at the University of Wisconsin-Madision at the request of the Wisconsin Department of Natural Resources (WDNR), Wildlife Management. It is a collaborative project between these two organizations with the goal of better understanding how the population of the state’s hunters is changing over time and to project the population of future deer hunters. The study was initiated because wildlife managers at WDNR noticed a recent decline in the number of deer hunters in the state, wanted to better understand this decline and why it had occurred, and wanted professional projections of the number of future deer hunters in the state.
The deer herd in the state of Wisconsin is largely kept in check by private hunters who purchase licenses and kill deer each fall. Not only is hunting vital to wildlife management efforts and as a WDNR revenue stream, but it is also an important cultural activity through which people become intricately connected to the natural world. However, the number of gun deer hunters in Wisconsin declined from 645,047 in
2
2000 to 600,787 in 2007 (or almost 7% in eight years). This sudden and dramatic decline has caused concern about the future of the herd and the sport.
Data
The primary data used in this analysis come from WDNR records on the number deer hunting licenses sold to residents of the state of Wisconsin annually between 2000 and 2007. These data include classifications by single year of age, sex, and type of license (gun or archer). In order to generate participation rates from these counts, we draw on estimates of the total Wisconsin population by single year of age and sex that were generated using a cohort component method at the Applied Population Lab.1
Because detailed deer hunting license records are only available since 1999, we supplement this rich data source with data from the National Survey of Fishing, Hunting, and Wildlife- Associated Recreation (FHWAR) conducted by the Census Bureau for the U.S. Fish and Wildlife Service, U.S. Department of the Interior. We draw on data from surveys conducted in 1991, 1996, 2001, and 2006 to provide a more longitudinal look at hunting population rates over time. The surveys are conducted at the national level, and state level estimates are also produced. We specifically examine estimates of hunting participation rates by age group from the state of Wisconsin.
Recent Trends in the Deer Hunting Population
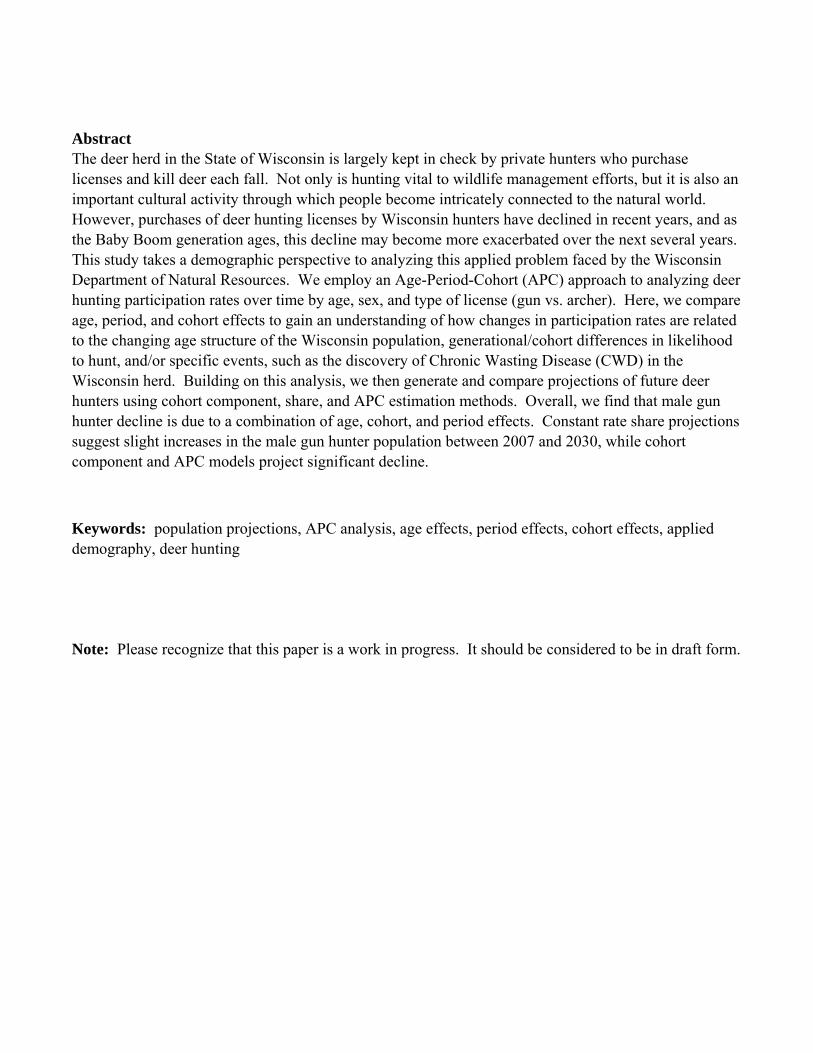
Exploratory data analysis tools were used to examine recent trends in the deer hunter population in the state of Wisconsin. First, we examined participation rates by age, sex, and type of hunter (gun or archer) annually between 2000 and 2007 (see Figures 1-3 below). Rates were calculated by age over time so that the proportion of all Wisconsin people of a certain age who purchased deer hunting licenses in a particular year could be examined. Isolating these rates by age and examining them annually allows for a comparison of how participation has changed over time and at specific time periods, holding constant changes in the age structure of the total population of the state.
In the charts below lighter colors represent earlier years, and darker blues represent more recent years, except for 2002 which is shown in red because this was the year that Chronic Wasting Disease (CWD) was discovered in the Wisconsin herd. CWD is a contagious degenerative disease found in deer and elk that is transferred from animal to animal through close contact. The likelihood that CWD can be passed to humans remains unclear, and for this reason, some hunters have at times chosen not to hunt because they do not feel safe eating venison that could be infected.
1 Wisconsin population estimates and projections 2000-2030 were generated by Professor Paul Voss at the Applied Population Lab at the University of Wisconsin- Madison in May 2007.
3
Male gun hunter participation rates declined steadily at almost every age between 2000 and 2007. Hunters over age 65 were the exception, experiencing increasing rates. In particular, male gun hunting rates for the population under age 47 have continued to decline every year since 2000, with a particularly large drop off between 2001 and 2002, which is likely associated with the discovery of CWD. In 2000, 34% of Wisconsin males aged 39 purchased gun deer hunting licenses in comparison to only 27% in 2007. Similarly, 29% of 15 year-old males gun-hunted in 2000 compared to only 25% in 2007.
Figure 1: Male Gun Hunter Participation Rates, 2000-2007
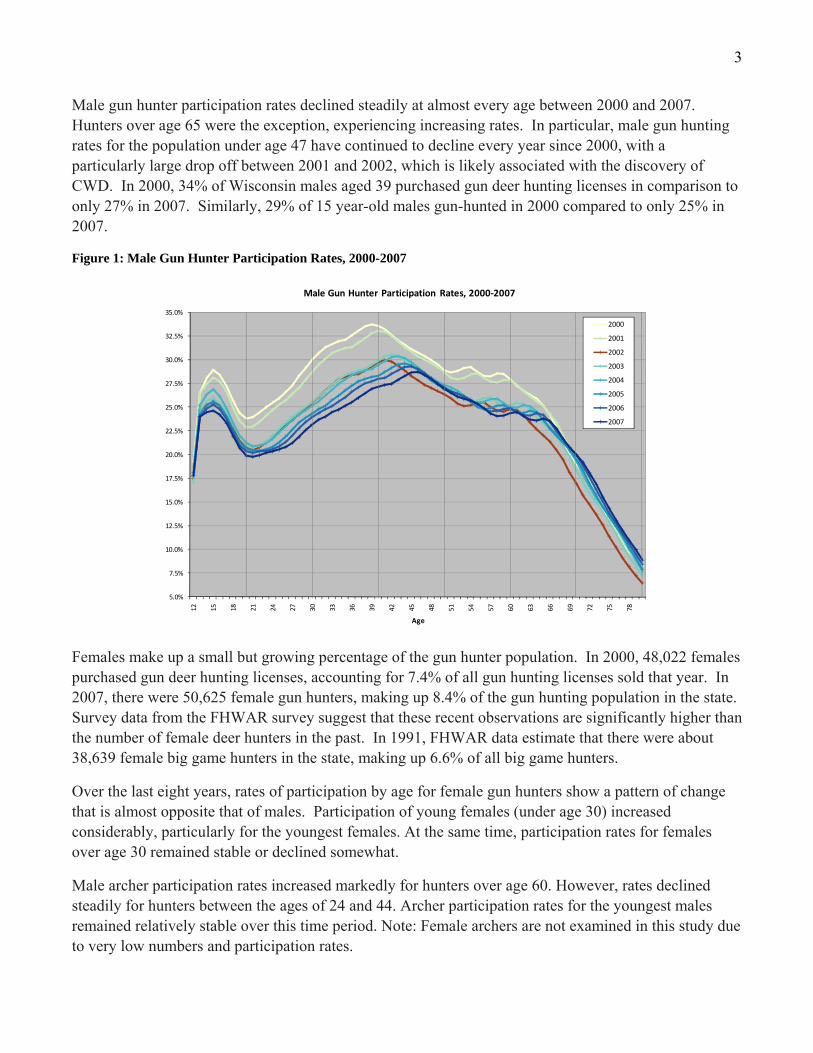
Females make up a small but growing percentage of the gun hunter population. In 2000, 48,022 females purchased gun deer hunting licenses, accounting for 7.4% of all gun hunting licenses sold that year. In 2007, there were 50,625 female gun hunters, making up 8.4% of the gun hunting population in the state. Survey data from the FHWAR survey suggest that these recent observations are significantly higher than the number of female deer hunters in the past. In 1991, FHWAR data estimate that there were about 38,639 female big game hunters in the state, making up 6.6% of all big game hunters.
Over the last eight years, rates of participation by age for female gun hunters show a pattern of change that is almost opposite that of males. Participation of young females (under age 30) increased considerably, particularly for the youngest females. At the same time, participation rates for females over age 30 remained stable or declined somewhat.
Male archer participation rates increased markedly for hunters over age 60. However, rates declined steadily for hunters between the ages of 24 and 44. Archer participation rates for the youngest males remained relatively stable over this time period. Note: Female archers are not examined in this study due to very low numbers and participation rates.
Age is one of the most important demographic variables because it is closely related to vital events (birth and death) and to major life course events (Hobcraft, Menken, and Preston 1982). The charts above make clear that with hunting as well, there are specific patterns of participation that vary by age. Most obviously, hunter participation rates drop off markedly after about age 65. These variations are likely related to life course events that tend to occur at particular ages and that may impact the likelihood of hunting, such as the transition to adulthood and moving out of the childhood home, marriage, childbirth, work, retirement, and death. In addition, age is biologically associated with health and ability to engage in physical activity, such as hunting. For all of these reasons, we should expect that hunter participation rates will vary by age and that age-specific hunting rates may vary by sex and in comparing gun hunters to archers.
Accordingly, previous studies of deer hunting populations have emphasized the importance of age-related patterns. Heberlein (1987) advises that in the United States most hunters are young males, age 18-34, and that with the aging of the population decline in hunter numbers experienced between 1980 and 1985 is likely to continue. Similarly, Heberlein and Thomson (1996) found that age was one of the most important predictors of hunting in the United States between 1980 and 1990; and Duda, Bissell, and Young (1995) found that an aging population contributed to male hunter decline in the 1980’s. More recently, Poudyal, Cho, and Bowker (2008) forecast hunter decline in the southeast United States due to the changing age and racial composition of the population.
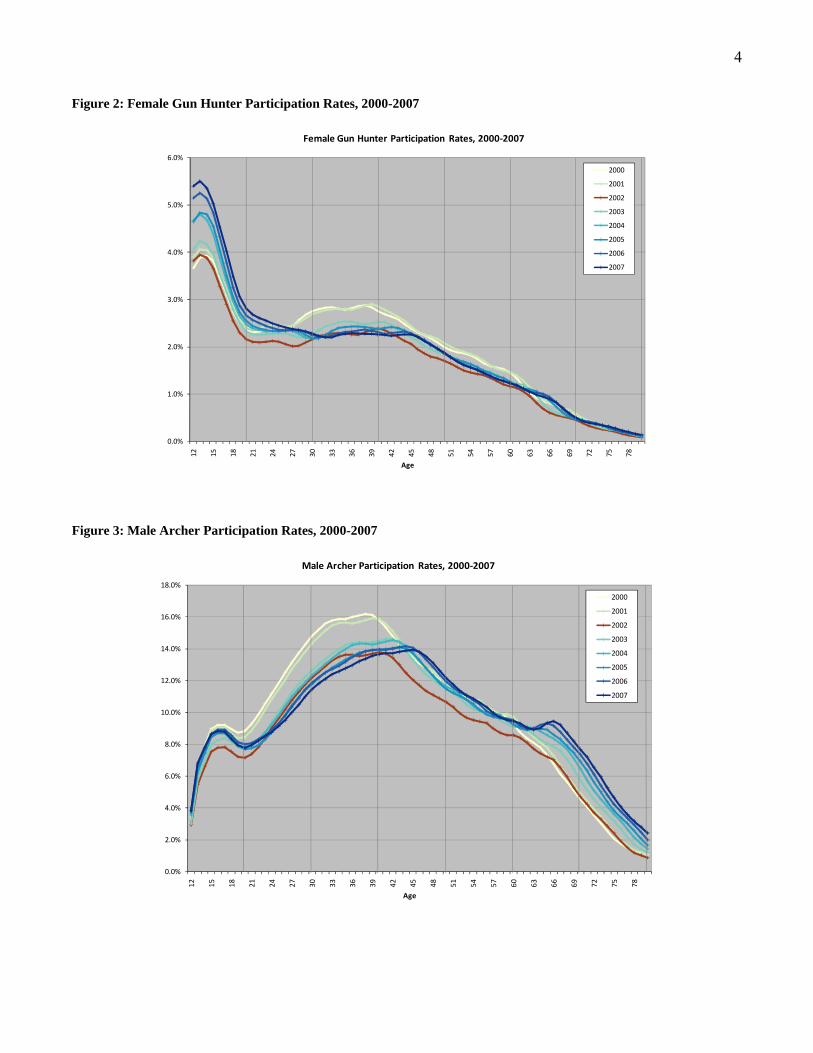
When people are more likely to hunt at certain ages in comparison to others, the number of hunters will be affected by changes in the age composition of the total population of the state of Wisconsin. Figure 4 shows the Wisconsin total population by age and sex in 2000 and projected for 2020. As the large cohorts of the Baby Boom generation grow older with time, the composition of the state’s population changes. In particular, the number of people between the ages of 40 and 50 in 2020 is expected to be smaller than the number of people at these ages in 2000. Hunter participation rates have been among their highest for males age 40 to 50. If there is something special about this age group that makes people more inclined to hunt and the number of people at those ages declines over time, then hunter numbers might be expected to decline as well.
In 2007, 41% of Wisconsin resident hunters were between ages 41 and 61 (the Baby Boom generation). The combination of a large number of potential hunters (people overall) in the Baby Boom generation and relatively high rates of participation for Baby Boomers has contributed to a large number of hunters in the late 1990s and early 2000s. To what extent have recent declines in the deer hunter population been due to the aging of the population, including Baby Boomers?
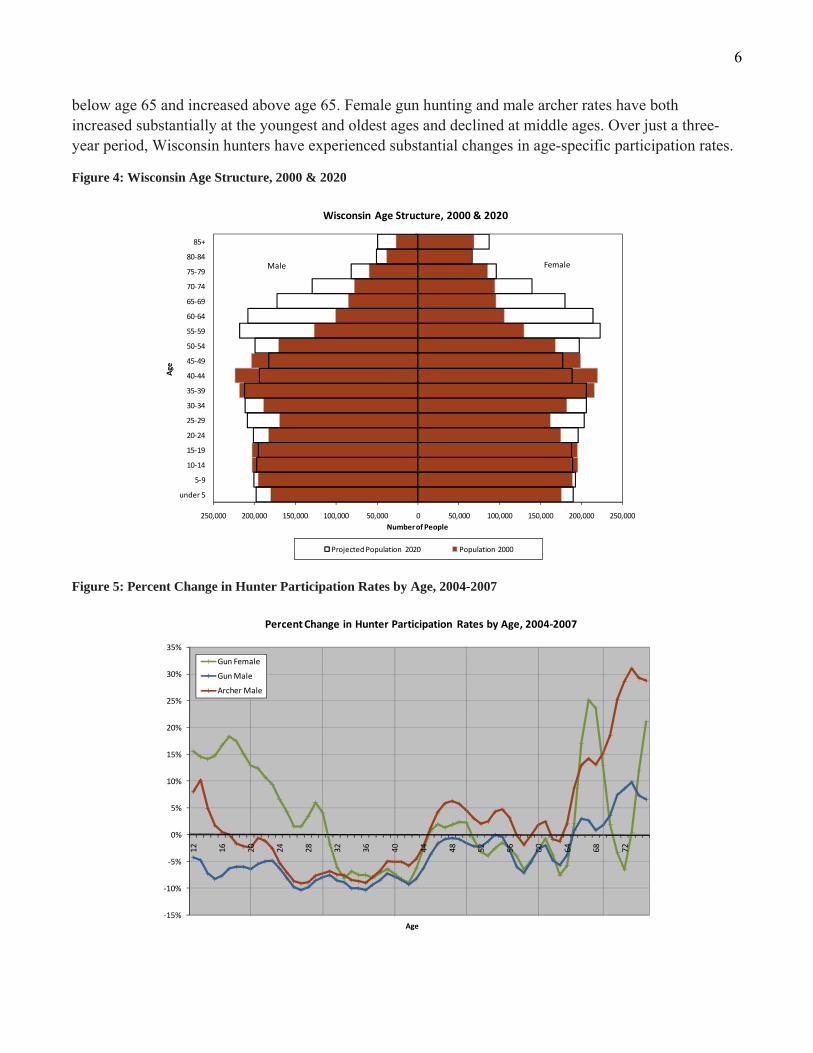
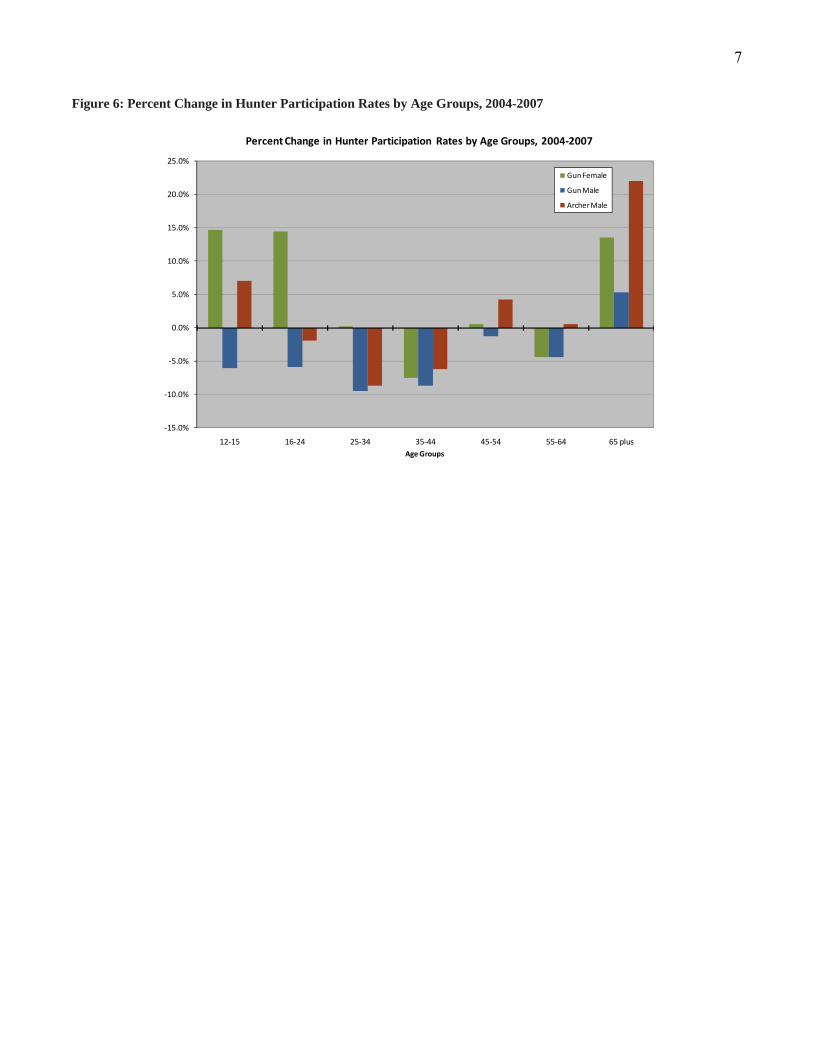
The extent to which such age effects impact hunter numbers depends upon the stability of participation rates by age. Age effects are most important when age-specific participation rates are relatively con-sistent over time. However, Wisconsin hunter participation rates have changed significantly over the last several years. Figures 5 and 6 show percent changes in hunter participation rates between 2004 and 2007. This short time period occurred after the impact of CWD on the hunter population, so that the effects of CWD discovery are excluded from this analysis. Male gun hunting rates declined at all ages
6
below age 65 and increased above age 65. Female gun hunting and male archer rates have both increased substantially at the youngest and oldest ages and declined at middle ages. Over just a three-year period, Wisconsin hunters have experienced substantial changes in age-specific participation rates.
Figure 5: Percent Change in Hunter Participation Rates by Age, 2004-2007
‐15%
‐10%
‐5%
0%
5%
10%
15%
20%
25%
30%
35%
12 16 20 24 28 32 36 40 44 48 52 56 60 64 68 72
Age
Percent Change in Hunter Participation Rates by Age, 2004‐2007
Gun Female
Gun Male
Archer Male
7
Figure 6: Percent Change in Hunter Participation Rates by Age Groups, 2004-2007
‐15.0%
‐10.0%
‐5.0%
0.0%
5.0%
10.0%
15.0%
20.0%
25.0%
12‐15 16‐24 25‐34 35‐44 45‐54 55‐64 65 plusAge Groups
Percent Change in Hunter Participation Rates by Age Groups, 2004‐2007
Gun Female
Gun Male
Archer Male
8
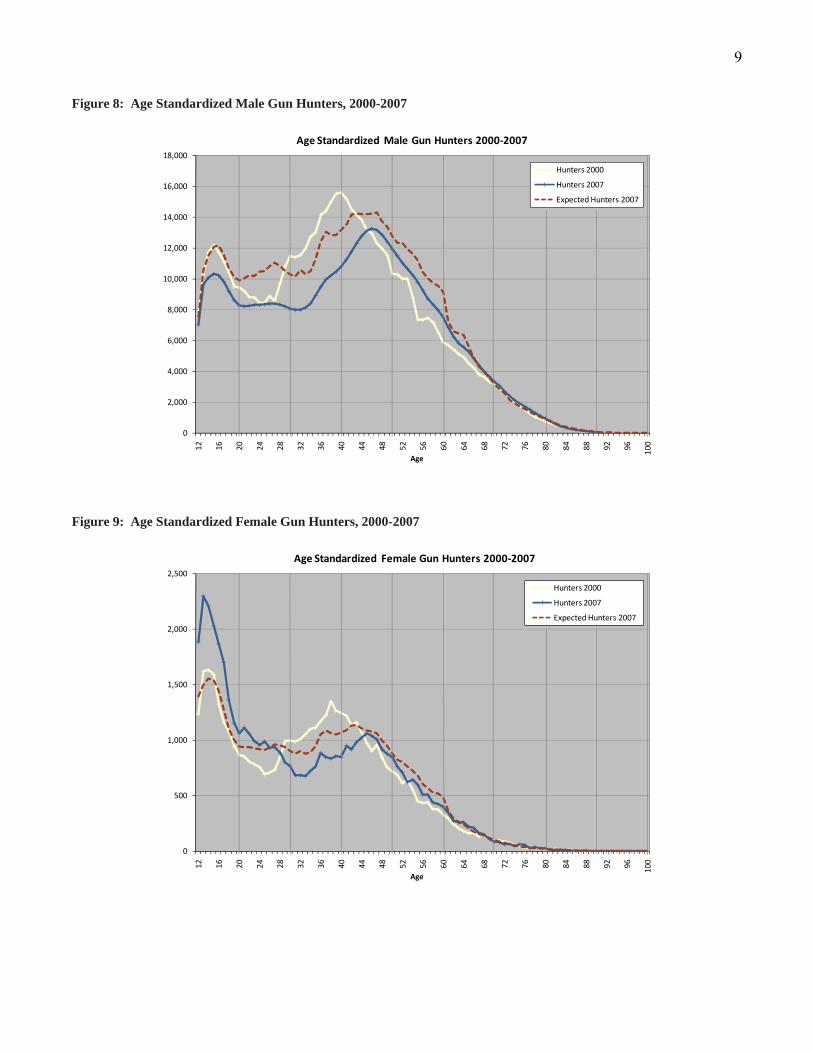
In order to more specifically examine the effects of age in recent deer hunter decline, we standardized age-specific participation rates in 2000 to the age composition of the total population of Wisconsin in 2007. This indirect standardization offers an analysis of what the 2007 hunter population would have been if participation rates by age had remained constant from 2000 (see Figures 7-10).
Figure 7 shows the difference between observed numbers of hunters in 2002 (the year CWD was discovered in the Wisconsin herd), 2004, and 2007 and the expected number of hunters that there would have been in each year if the same participation rates by age experienced in 2000 had remained constant and only the underlying population composition of the state had changed. In other words, it shows differences between actual hunters and the number of hunters that would have been based exclusively on age effects. Had rates by age from 2000 remained constant, there would have been 91,801 more male gun hunters in 2007 than what Wisconsin actually had. This would have meant that hunter numbers would have increased based on changing age structure alone, rather than the decline experienced.
Figure 7: Age Standardized Hunter Population, 2000-2007
‐100,000
‐80,000
‐60,000
‐40,000
‐20,000
0
20,000
Difference between Num
ber of Actual H
unters and
Expected Hunters
based on
2000 Participation Ra
tes b
y Ag
e
Hunter Population Controlling for Age Effects, 2000‐2007
Gun Female Gun Male Archer Male
2002 2004 2007
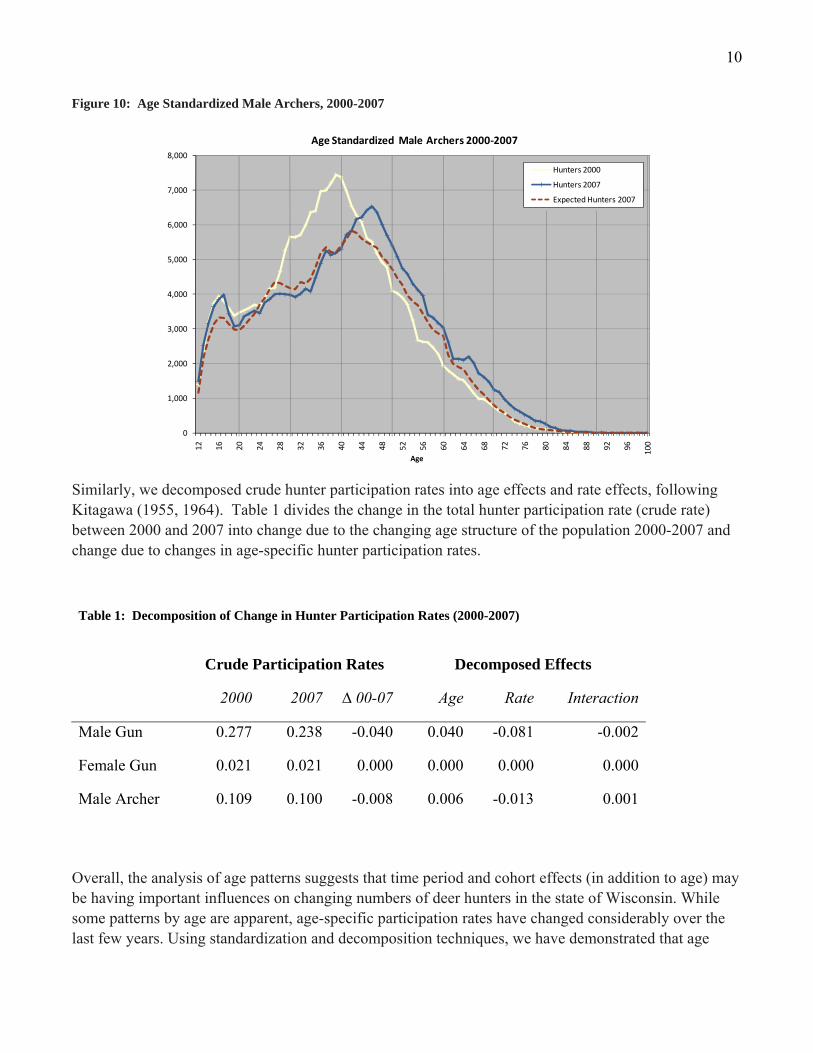
Figures 8-10 show hunter numbers in 2000 and 2007 by age and the number of age-standardized hunters that would have been expected in 2007 had 2000 participation rates remained constant and been applied to the 2007 population. These figures are similar to Figure 6, only they show breakdowns by single year of age. This view is useful for examining age effects within specific age groups. For instance, for male hunters we can see that the number of hunters age 20-30 should have increased between 2000 and 2007 based on age effects, rather than remaining stable; whereas the number of hunters age 30-50 was expected to decline due to age effects, but declined even more dramatically than what age effects would have predicted.
9
Figure 8: Age Standardized Male Gun Hunters, 2000-2007
Similarly, we decomposed crude hunter participation rates into age effects and rate effects, following Kitagawa (1955, 1964). Table 1 divides the change in the total hunter participation rate (crude rate) between 2000 and 2007 into change due to the changing age structure of the population 2000-2007 and change due to changes in age-specific hunter participation rates.
Table 1: Decomposition of Change in Hunter Participation Rates (2000-2007)
Crude Participation Rates Decomposed Effects
2000 2007 ∆ 00-07 Age Rate Interaction
Male Gun 0.277 0.238 -0.040 0.040 -0.081 -0.002
Female Gun 0.021 0.021 0.000 0.000 0.000 0.000
Male Archer 0.109 0.100 -0.008 0.006 -0.013 0.001
Overall, the analysis of age patterns suggests that time period and cohort effects (in addition to age) may be having important influences on changing numbers of deer hunters in the state of Wisconsin. While some patterns by age are apparent, age-specific participation rates have changed considerably over the last few years. Using standardization and decomposition techniques, we have demonstrated that age
11
effects clearly do not explain recent decline in the number of deer hunters. This finding implicates projections of future deer hunters in a few ways. First, if future patterns of age-specific participation rates continue to change, then standard share projections based on constant rates should be interpreted with extreme caution. Second, projection methods that incorporate period and/or cohort effects, as well as age effects are warranted. Finally, increasing participation rates at older ages suggest that population aging may have only a moderate effect on hunter numbers in the near future as the large cohorts of the Baby Boom generation may be more likely to hunt as they reach older ages than the generations who came before them.
Period Effects
Period effects are evident when age-specific rates change in the same direction at all (or most) age groups over time, and these fluctuations tend to be associated with changing social conditions, like the discovery of CWD in the Wisconsin herd, changes in policy, and more gradually occurring changes in social, cultural, and economic conditions (Hobcraft, Menken, and Preston 1982). In the last section we demonstrated clear patterns of decline in age-specific participation rates for most Wisconsin hunter groups (by age, sex, and hunter/archer) between 2000 and 2007, suggesting that period effects are indeed impacting the population of Wisconsin deer hunters. Now, we more closely examine the extent to which recent hunter population change can be explained by period changes by attempting to separate period effects from potential cohort effects.
Demographers have been less clear in explicating tools and strategies for examining period effects than they have for age effects. Demographers have long emphasized the impacts of age on demographic processes because it tends to be the most important predictor of differences across populations and because its intrinsic biological connections make it a good predictive variable (Hobcraft, Menken, and Preston 1982). On the flip side, period effects have often been treated as a remainder, or the effect that remains in examination of change over time after age has been controlled for. The predicament with this “remainder” approach is that period and cohort effects become confounded with one another. In many situations (including our analysis of deer hunters) this is problematic, because period and cohort effects each have different implications for how future populations may be affected.
In order to examine period effects in the deer hunter case, we apply a somewhat different remainder-type strategy. Having already learned that the impact of age on hunter population decline is nonexistent, we now examine the extent to which cohort-specific hunting participation rates have changed over time. We do this by examining cohort-based survival ratios. If cohort survival ratios and age-specific rates have been changing in a consistent direction over time, then period effects are truly evident in the population of interest.2
2 This does not rule out the possibility that age and/or cohort effects may also simultaneously be operating to impact hunter participation rates.
12
Survival ratios compare the number of hunters at a certain age in one year to the number of hunters one year older the next year. If that ratio comparison is greater than 1.0, then that cohort added new hunters over the year. If the ratio is less than 1.0, then that cohort lost hunters in the course of the year. These annual survival ratios can be compared over time to see if there are consistent period effects impacting the hunter population at different ages.
Figure 11 shows the average survival ratios for all ages between 2000 and 2007 weighted by the number of hunters at the starting age in the starting year. More specifically, we generate a matrix of survival ratios for each age-age and year-year transition, and then we average the annual ratios across all ages. Male and female gun hunters and male archers all saw decreased survival between 2001 and 2002 with the discovery of CWD in the Wisconsin herd. Female gun hunters were most notably affected by this discovery. Similarly, all groups experienced a rebound in survival above 1.0 (people coming back to hunting after a one-year CWD break) between 2002 and 2003. Male archers were most likely to come back to hunting in 2003 and 2004. Otherwise, average survival ratios for the pairs of other years (2000-‘01, 2003-‘04, 2004-‘05, 2005-‘06, and 2006-‘07) remained relatively consistent with some ups and downs, but without a clear pattern of period change. This suggests that period effects have been important in relation to specific events of the last few years (namely the discovery of CWD), but that over this short time period (eight years), strong and consistent period effects that impact all ages are not clear.
Figure 11: Average Annual Survival Ratios, 2000-2007
In addition to the impacts of age or time period, people’s experiences (and their likelihood to hunt) vary by generation. Generational (or cohort) effects stem from influences of the past that have affected
13
certain cohorts differently than others. In other words, cohort effects occur because transformations of the social world influence people of different ages in different ways and these transformations persist within cohorts over time (Ryder 1965). For example, the economic boom of the post- World War II period in the United States influenced the developmental years of the Baby Boom generation, which in turn might have influenced the likelihood of that generation to hunt in the past and still today. More recent generations of females, on the other hand, may be more likely to hunt than previous generations due to the empowerment of younger cohorts of women over time to take part in activities which were formerly socially and culturally considered to be a masculine domain (like hunting).
In this section, we examine such generational influences by analyzing hunters by the year they reached hunting age (age 12). This is their hunting cohort, and we examine recent changes in hunter participation between cohorts. Are people who came of age in some years more or less likely to hunt than people who reached hunting ages at other times?
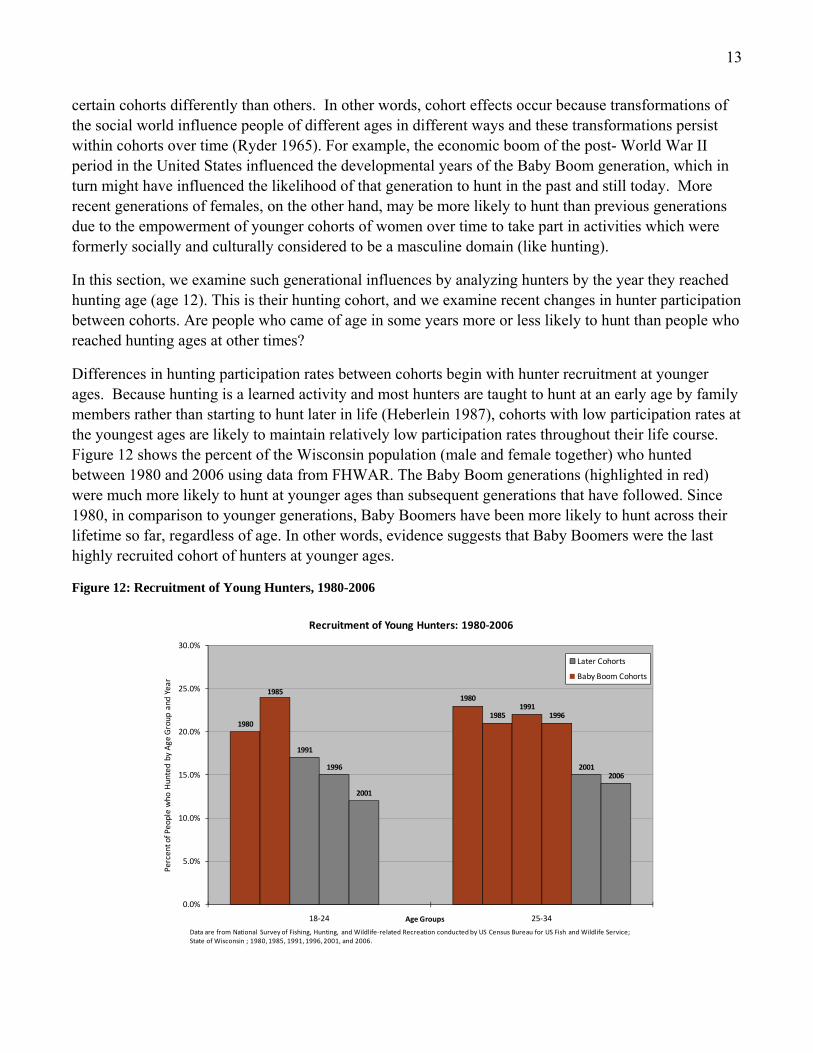
Differences in hunting participation rates between cohorts begin with hunter recruitment at younger ages. Because hunting is a learned activity and most hunters are taught to hunt at an early age by family members rather than starting to hunt later in life (Heberlein 1987), cohorts with low participation rates at the youngest ages are likely to maintain relatively low participation rates throughout their life course. Figure 12 shows the percent of the Wisconsin population (male and female together) who hunted between 1980 and 2006 using data from FHWAR. The Baby Boom generations (highlighted in red) were much more likely to hunt at younger ages than subsequent generations that have followed. Since 1980, in comparison to younger generations, Baby Boomers have been more likely to hunt across their lifetime so far, regardless of age. In other words, evidence suggests that Baby Boomers were the last highly recruited cohort of hunters at younger ages.
Figure 12: Recruitment of Young Hunters, 1980-2006
1980
19801985
1985
1991
1991
1996
1996
2001
20012006
0.0%
5.0%
10.0%
15.0%
20.0%
25.0%
30.0%
18‐24 25‐34
Percent of People who
Hunted by Age
Group
and
Year
Age Groups
Recruitment of Young Hunters: 1980‐2006
Later Cohorts
Baby Boom Cohorts
Data are from National Survey of Fishing, Hunting, and Wildlife‐related Recreation conducted by US Census Bureau for US Fish and Wildlife Service; State of Wisconsin ; 1980, 1985, 1991, 1996, 2001, and 2006.
14
In recent years, the Baby Boom generation (and especially younger Baby Boomers who were age 37 to 42 in 2000) has had higher participation rates than other cohorts (see Figure 1 and Figure 3). Still, it is difficult to determine whether these high participation rates are due to age effects and/or cohort effects. Notice in these figures that the peak age-specific participation rate in 2000 at ages 38 and 39 (33.7% for male gun hunters) advances forward in age over time with the cohort to ages 39-40 in 2001, 40-41 in 2002, and so forth until ages 46-47 in 2007. This shift over time suggests that cohort effects, in addition to age and period effects, are important in determining how the hunter population has changed over the last several years.
Looking back to Figure 2 at female gun hunter participation rates, we can see that female participation rates have increased markedly at younger ages over the last several years. In particular, cohorts born after about 1980 have higher age-specific participation rates than cohorts who came before them at those same ages.3 We know that dramatic social change with respect to the acceptance of females in traditionally male activities has occurred, and these changes may impact younger generations of women differently than older ones. In particular, cohorts born in about 1975 and later have grown up in a world where women are increasingly legally, socially, and culturally more accepted as equal to men.4 Both women and men of these younger generations may generally be more open to women’s participation in activities like hunting than generations who came before. .
In summary, cohort issues are often left out of applied demographic understandings of the past and in projections of the future because of a scarcity of detailed longitudinal datasets available in most applied cases that might be used to understand cohort issues. They are also left out because of the complexity involved in separating cohort effects from those related to age and period and because of a dearth of proven applied demographic methods that are commonly used in population projections. We argue that by ignoring the possibilities of cohort effects, applied demographers miss important nuances that would help to better understand demographic changes of the past and better project future populations. In the case of Wisconsin deer hunters, cohort effects are particularly important in understanding how an aging Baby Boom population might impact total hunter numbers in the coming years and in understanding changes in the number of female hunters. If cohort effects were ignored, we would gain only a marginal understanding of why and how recent number of deer hunters have declined and we would make less
3 Note: Because detailed data are only available 2000-2007, this conclusion is limited by the fact that we cannot be certain of female hunting participation rates of previous generations at younger ages. It could be the case that females from older generations also experienced high participation rates when they were young, but then dropped out of hunting before they show up in these data. Although limited by small sample size, data from FHWAR suggest that female hunting participation rates are higher today than they have been at any time since 1980. The combination of these two data sources and sociological knowledge about the empowerment of women and social and cultural change to encourage women’s participation in traditionally male activities all suggest that these observed changes in female hunting participation of the last few years do represent true generational differences and that cohorts of females born 1980 and after are more likely to hunt than their predecessors.
4 For instance, it was in 1964 that Title VII of the Civil Rights Act banned discrimination in the workforce based on sex. In 1972 Title 9 offered girls and women the right to participate in athletic events for the first time. Women have increasingly earned degrees in math and science-related subject areas and taken jobs in these arenas since the late 1960s. It was not until 1993 that the United States allowed women to take combat positions in the military.
15
valid assumptions about how age and period effects are likely to impact future hunter populations. For instance, in comparison to older generations (born before 1946), Baby Boomers may be more likely to continue to hunt as they grow older because of a combination of their prior experiences with hunting and the fact that they are staying healthier and living longer, retiring earlier, remaining more active at older ages, and have higher income than any cohort that has come before them. Similarly, younger females are likely hunting at relatively high rates not because they are young, but because social and cultural changes have impacted their generation differently than older generations of women.5 If we were to make projections based on age-specific participation rates of these females (ignoring cohort effects), we would likely grossly underestimate the number of female hunters in their 30s and 40s over the next several years.
Age-Period-Cohort (APC) Analysis
As discussed, age, period, and cohort all impact the likelihood of people to deer hunt. Age effects are relatively straightforward and related to life course events that tend to occur at particular ages (such as going away to college, having children, or retiring) and physiological changes that occur as our bodies mature. Period effects could represent specific events that occur at a certain moment in time, like the discovery of CWD in the Wisconsin herd, or more gradually occurring biological, social, economic, and cultural changes that have transpired over the last few years (i.e., programs promoting youth hunting, habitat change, or economic recession). Cohort effects refer to experiences of different generations and reflect social and cultural transformations that occurred in the past or that have occurred very gradually over a long period of time and have impacted different age groups in different ways (i.e., the empowerment of women to pursue activities traditionally associated with males only). Thinking about changes in the deer hunter population in these ways offers information about how and why the population is changing and how it might continue to change over the next several years.
The complicated aspect about an age-period-cohort analysis is that these factors work simultaneously together, making it difficult to separate effects caused by each individual component. In other words, it is difficult to tell whether it is a group’s age at the moment, something about the time period, and/or a cohort issue that is affecting participation rates. The previous charts and discussion have attempted to distinguish these effects; nevertheless, the three are conflated. In order to isolate the effects of age, period, and cohort and to individually examine each, we implement an Age-Period-Cohort (APC) statistical analysis aimed at understanding how each of these factors works independently of the others to impact the Wisconsin deer hunting population.
Statistical estimation of APC models has long been plagued by what has been called the “identification problem,” whereby separating the effects of age, period, and cohort is difficult because they are linearly related to one another so that period = age + cohort (Yang et al. 2008). We address this issue by following Yang et al.’s (2008) intrinsic estimator approach. Yang et al. build on the APC accounting model made popular by Mason et al. (1973) which can be written in linear regression form as 5 Duda, Bissell, and Young (1995) find that female hunter participation rates have been increasing due to social change.
16
rij = Hij/Pij = µ + αi + βj + γk + εij
where rij denotes the observed hunting participation rate for the ith age group at the jth time period; Hij denotes the number of hunters observed in the ijth group; Pij denotes the total population at risk of hunting in the ijth group; µ denotes the intercept (mean hunting participation rate); αi denotes the coefficient representing the age effect for the ith age group; βj denotes the coefficient representing the period effect for the jth period; γk denotes the kth diagonal cohort effect; and εij denotes a random error. They then introduce an intrinsic estimator (IE) to address the identification problem associated with this basic model. The IE is a principal components regression estimator that is designed to “remove the influence of the design matrix on coefficient estimates” (Yang et al. 2008: 1707). Please see Yang et al. (2008) for more details on the construction of the IE, for comparison between different types of APC models, and for validation of the IE approach.
APC Application to the Deer Hunter Case
Using data from 2000 to 2007 on the number of licenses sold by single year of age (12 to 80+), we estimate the independent effects of age, period, and cohort on changes in the Wisconsin deer hunter population using Yang et al.’s IE approach. Using Stata statistical software, we follow Yang et al.’s command
to perform a poisson distributed regression model with log likelihood estimation. We ran this model for male gun hunters, female gun hunters, and male archers.
Before showing the results of this estimation, it is important to recognize that these data only represent eight single years (periods) and that this is a major constraining factor in this modeling process. Yang et al. do not mention data requirements when describing their APC IE model, and we are unsure about the specific effects of using such a short time frame. It is possible that age and cohort are not distinguished well, especially for cohorts were there are fewer than 8 observations, which is true for the youngest and oldest cohorts (e.g., the 1995 cohort found only in the 2007 time period). We recognize that with only eight years of data, estimates of age, period, and especially cohort effects should be interpreted cautiously and with some skepticism. Still, these results are generally supported by data on age-specific hunter participation rates and sex-specific hunter participation rates from FHWAR back to 1980, and they are consistent theoretically with social, cultural, and economic differences between the Baby Boom generation and their predecessors and with women’s empowerment. As new data become available, these estimates should be checked and updated to ensure their consistency over longer time periods.
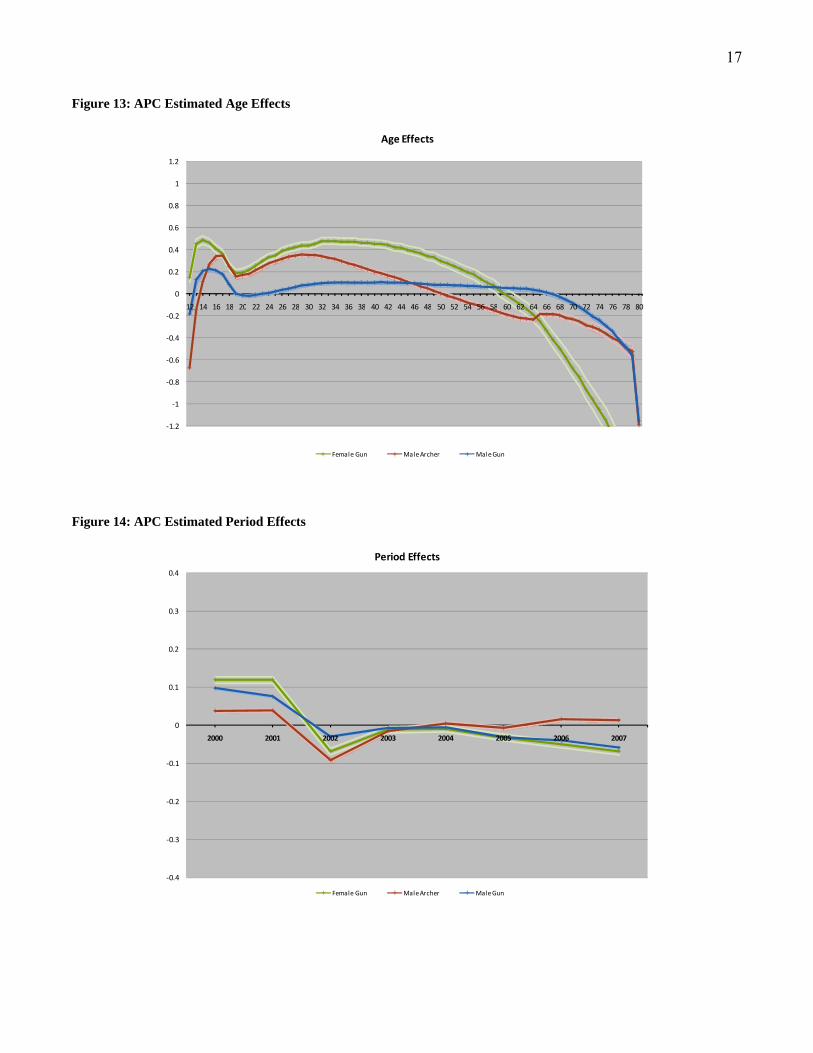
Figures 13-15 show the results of the APC analysis by likelihood (log-likelihood) to purchase a hunting license. Values below the zero axis represent decreased likelihood of hunting at that age, cohort, or time period; values above the zero axis represent increased likelihood to hunt. The farther from zero, the stronger the positive or negative effect is. The lighter colored lines bordering the estimates represent 95% confidence intervals.
Figure 15: APC Estimated Cohort Effects by Year Reaching Age 12
‐1.2
‐1
‐0.8
‐0.6
‐0.4
‐0.2
0
0.2
0.4
0.6
0.8
1
1.2
2007
2005
2003
2001
1999
1997
1995
1993
1991
1989
1987
1985
1983
1981
1979
1977
1975
1973
1971
1969
1967
1965
1963
1961
1959
1957
1955
1953
1951
1949
1947
1945
1943
1941
1939
1937
1935
1933
Cohort Effects
Female Gun Male Archer Male Gun
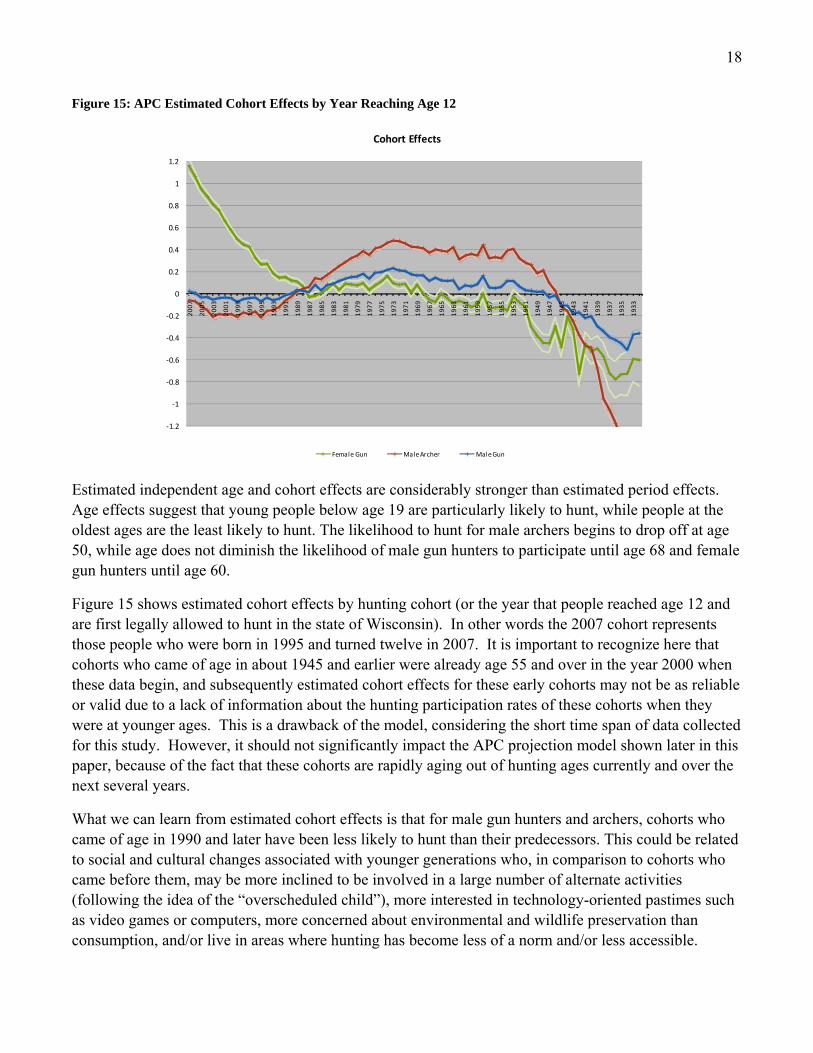
Estimated independent age and cohort effects are considerably stronger than estimated period effects. Age effects suggest that young people below age 19 are particularly likely to hunt, while people at the oldest ages are the least likely to hunt. The likelihood to hunt for male archers begins to drop off at age 50, while age does not diminish the likelihood of male gun hunters to participate until age 68 and female gun hunters until age 60.
Figure 15 shows estimated cohort effects by hunting cohort (or the year that people reached age 12 and are first legally allowed to hunt in the state of Wisconsin). In other words the 2007 cohort represents those people who were born in 1995 and turned twelve in 2007. It is important to recognize here that cohorts who came of age in about 1945 and earlier were already age 55 and over in the year 2000 when these data begin, and subsequently estimated cohort effects for these early cohorts may not be as reliable or valid due to a lack of information about the hunting participation rates of these cohorts when they were at younger ages. This is a drawback of the model, considering the short time span of data collected for this study. However, it should not significantly impact the APC projection model shown later in this paper, because of the fact that these cohorts are rapidly aging out of hunting ages currently and over the next several years.
What we can learn from estimated cohort effects is that for male gun hunters and archers, cohorts who came of age in 1990 and later have been less likely to hunt than their predecessors. This could be related to social and cultural changes associated with younger generations who, in comparison to cohorts who came before them, may be more inclined to be involved in a large number of alternate activities (following the idea of the “overscheduled child”), more interested in technology-oriented pastimes such as video games or computers, more concerned about environmental and wildlife preservation than consumption, and/or live in areas where hunting has become less of a norm and/or less accessible.
19
Cohort effects for female gun hunters particularly stand out and are opposite those of males. Females who reached age 12 in about 1969 and later are more likely to hunt than their predecessors, and this likelihood has steadily increased for each subsequent cohort of women so that for the last ten years, female cohorts have been considerably more likely to hunt than women who came before. This change represents a substantial shift in the likelihood of newer cohorts of women to hunt and should be expected to have significant impacts on the female hunter population over the next several years. If these recent cohorts of women continue to hunt as they age into their 20s, 30s, and 40s, then the number of female hunters will increase dramatically. This type of profound social change with respect to female engagement in hunting might be expected considering the considerable social, cultural, and economic changes in women’s empowerment over the last several decades, and particularly since the late 1960s when women began for the first time to engage in activities that had formerly been male dominated (like sports, college education, math and science-based education, and military) and to be treated with increasing equality to men in the workforce, the home, and in leisure activities.
Period effects, while overall not as strong as cohort or age effects, reflect a dip in likelihood to hunt in 2002 with the discovery of CWD in the Wisconsin herd and an overall decline in the likelihood to hunt for male and female gun hunters between 2000 and 2007, controlling for age and cohort effects that continued after the dip in 2002. This decline might be explained by economic, social, environmental, and/or policy-related changes over the last several years. The economy has seen significant decline since 2000, which may have impacted the amount of time, energy, and money that people have available to devote to leisure activities, such as hunting. At the same time, the housing boom from 2000-2005 increased land values considerably in all parts of the state of Wisconsin increasing the cost of owning hunting land. Environmentally, the housing boom of early 2000s together with continued suburbanization and exurbanization have removed habitat from hunting and moved people into more urban environments where hunting may not be as accessible. In addition to these changes, new policies introduced and/or expanded by the Wisconsin DNR aimed at reducing the size of the deer herd and/or stopping the spread of CWD (like Earn-A-Buck) may have negatively impacted some people’s inclination to hunt.
Male archers were the group that was impacted the most from the discovery of CWD in 2002, but the likelihood of this group to participate has increased steadily since that time so that in 2006 and 2007 male archers were getting close to as likely to hunt as they were before the discovery of CWD in 2000 and 2001. This rebound for archers in the likelihood to hunt may be related to new and expanded DNR programs aimed to reducing the size of the deer herd and stopping the spread of CWD. For instance, the Earn-A-Buck policy mandates that hunters shoot a doe before they shoot a buck in order to encourage hunters to kill more than one deer and to kill does, which is important for reducing the size of the herd. Hunters may shoot their doe during archery or gun season. Because archery season opens before gun season and lasts for a longer period of time, some hunters take part in archery hunting in order to “earn a buck” before gun season begins. There is also evidence that another new policy that allows archers age 65 and over to use a cross bow has increased the likelihood of older males to engage in archery in the last few years.
20
Population Projections using an Age-Period-Cohort Approach
Hobcraft, Menken, and Preston argued in 1982 that “if, especially over the short term, either period or cohort effects predominate, then one avenue for providing projections is to model the observed trend in these effects and continue it into the future” (p. 6). Still, standard population projection methods do not explicitly allow for age, period, and cohort-based assumptions in conjunction with one another. Having demonstrated the importance of age, period, and cohort effects on recent changes in the Wisconsin deer hunter population, the remainder of this paper is dedicated to (1) offering a methodological framework for building age, period, and cohort considerations into population projections and (2) examine the conceptual utility of such a model in comparison to more standard demographic methods of population projection. What can we learn by taking age, period, and cohort into account when making population projections? How different are APC projections from more established projection methodologies both conceptually and empirically?
In order to address these questions and to provide the Wisconsin DNR with well-conceptualized projections of future deer hunters, we applied APC estimates generated using Yang et al.’s IE model (as discussed above) to predict future hunter participation rates in the state of Wisconsin. Then, we applied these rates to the projected future age/sex/race composition of the state in order to project future numbers of deer hunters. While the APC IE model is intended to estimate effects in the past, we follow the advice of Hobcraft, Menken, and Preston to “model the observed trend and continue it into the future.”
More specifically, we project future hunters annually by sex 2008-2030 using an APC projection model that employs statistical estimates of the likelihood of hunting by age, period, and cohort (as shown in Figures 13-15) between 2000 and 2007 and applies these estimates to future age structure, cohorts, and time periods. Using the APC IE model, the effect of every age group (12 to 80+), period (2000 to 2007), and hunting cohort group (1932 to 2007) is estimated. These likelihood estimates are then transformed to provide estimated rates of participation by age, period, and cohort. Building from the linear model explicated by Mason et al. and shown on page 15, the appropriate projected age, period, and cohort rates are summed with the estimated constant (mean) term to create a matrix of projected rates. These projected rates are then applied to the population projections of the state based on age, sex, and race.
In this process, we assume
1. that estimated age and cohort effects are constant over time;
2. that cohort effects for incoming cohorts, those who will come of age over the next several years and who have not yet been observed, will equal the average of the cohort effects for the ten-year range between 2006 and 19956;
6 For females, the single-year 2007 cohort rate is applied to all future cohorts (constantly). This assumes that future cohorts of females will continue to participate at the highest observed rates 2000-2007. Still, this assumption might be considered to be conservative in the female cohort effects have increased considerably each year over the observed time period.
21
3. that future period effects will equal the period effect for the year prior (beginning with 2007) plus the average annual change in period effect from 2005-2007, so that period effects vary over time.7
The APC model is unique in that it explicitly incorporates age, period, and cohort effects to population projections. Because of the linear nature of the model, it is also easily adjusted as assumptions change. For instance, if we wanted to assume that something will be done to begin to increase hunter participation rates generally over time, the coefficient for period effects can be adjusted, without compromising age or cohort effects. Similarly, if a new program aimed increasing accessibility of hunting at older ages were to be implemented, age effects for older hunters could be adjusted.
Comparing APC Projections to Share and Cohort Component Methods
In addition to APC projection model we employed share and cohort component projection models to project future deer hunters in the state of Wisconsin.
First, we generated a simple share model in which a subset of the population (in this case, deer hunters) is expressed as a proportion of the total population (the state of Wisconsin). Assuming that the average age-specific participation rates between 2005 and 2007 will remain stable and that changes in the structure of the base population (the total Wisconsin population) will drive changes in the hunter population, this model averages participation rates for 2005, 2006, and 2007 by age, sex, and hunting type to generate a constant rate that is applied to a forecast of the total Wisconsin population by age and sex. The share model is well-suited for situations in which it is believed that age-specific participation rates will remain stable over time.
In the case of Wisconsin deer hunters, where observed age-specific participation rates have not remained constant but have changed considerably over the last several years, this model will likely produce unrealistic estimates of future hunters, unless age-specific participation rates stabilize in the coming years. For this reason, the share model’s best uses might be as a gauge against which to compare other projection models or to examine the future effects of changing age composition on hunter numbers. This model offers a useful comparison with respect to the APC model, because it relies solely on age effects, without consideration of period or cohort effects.
Recognizing the limitations of taking a strictly age-based approach, demographers often adjust this basic share model by employing shift-share methods to account for period and/or cohort effects. A shift-share approach might assume that age-specific participation rates will change in the future according to some schedule, rather than remain constant. The difficulty with shift-share models is that assumptions about how rates will change in the future are often made ad-hoc or based on recent past changes in rates. When recent past changes in rates are made without specific consideration of the potential influences of 7 This assumes that the period effect will contribute to hunter decline for male and female gun hunters, as lower likelihoods of hunting were estimated each year 2005-2007 for these populations, but that period effects will contribute to increasing numbers of male archers, due to the observed period increases for this group 2005-2007.
22
period and cohort (independent of one another), assumptions about how future rates might change can be flawed.
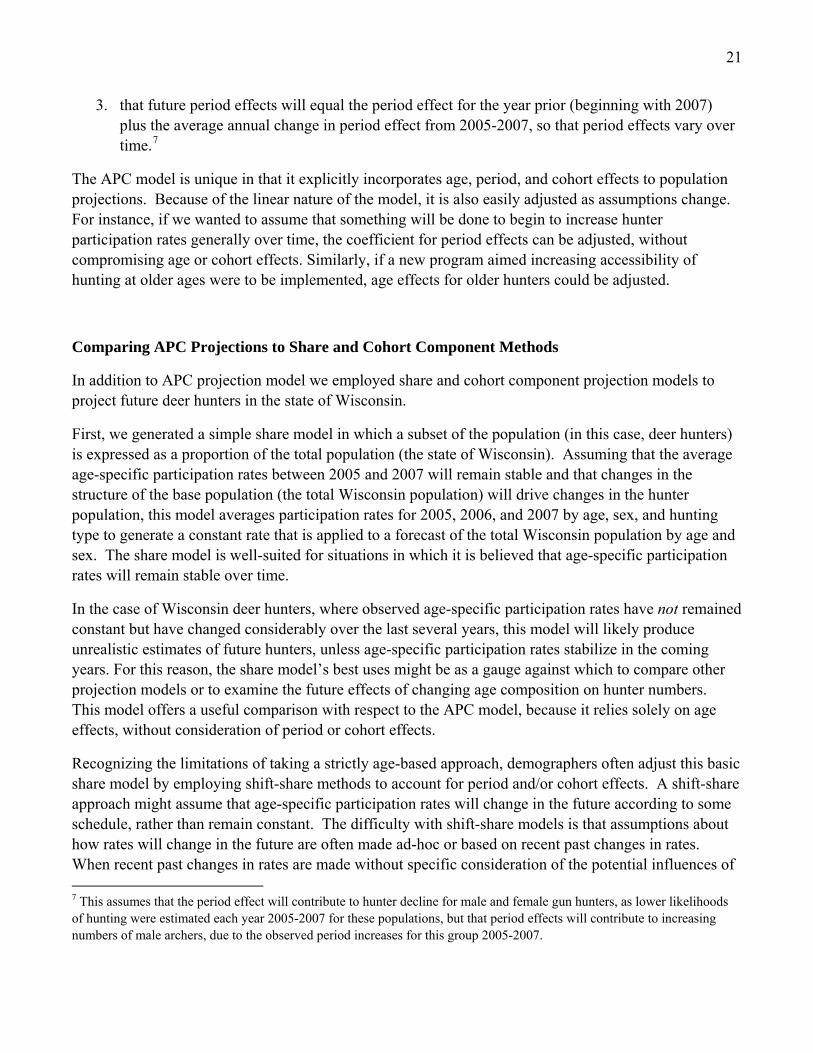
The second type of method we employed is a classic cohort component (or survival ratio) method. With this method, survival ratios depict changes in hunter rates, year to year and age to age measuring the effects of people coming into and going out of hunting by age over time. More specifically, survival ratios compare the number of hunters at a certain age in one year to the number of hunters one year older the next year (in effect, measuring age and period effects on cohort retention). If that ratio comparison is greater than 1.0, then that cohort added new hunters over the year. If the ratio is less than 1.0, then that cohort lost hunters in the course of the year. We average annual ratios by age experienced between 2004 and 2007 (a time period after the effects of the discovery of CWD had stabilized) in order to examine the average “survival” of hunters from one year to the next between specific ages and we assume that these average annual changes will continue into the future (see Figure 16).8
Figure 16: Average Survival Ratios by Age, 2004-2007
For male gun hunters, cohorts on average lost hunters between the ages of 15 and 20, retained current hunters between ages 21 to 37, experienced a moderate loss between ages 40 and 61, and declined significantly at ages above 61. Female gun hunting cohorts on average lost members at ages 15 to 20, gained participants aged 21 to 37, remained stable at ages 38 to 49, and dropped off significantly above
8 Incoming cohorts of 12 year old hunters are projected by first determining the proportion of 12 year olds who hunted on average between 2005 and 2007. This rate is then applied to projected future 12 year olds in the state of Wisconsin. For females, we apply the single-year rate from 2007, rather than the three-year average, because the rate has been increasing over time.
23
age 50. Male archers tended to experience cohort gains at ages 20 to 48, slight loss at ages 49 to 64, a marked increase at retirement age 65 to 66, then decline above age 66.
The cohort component model captures the effects of age, recent period changes, and to a lesser extent cohort trends because it follows cohorts of hunters over time. This model assumes that the average rates of transfer into and out-of hunting by cohorts at particular ages in recent years will continue into the future. As such, this type of model combines age and period effects. The model is less adept at capturing cohort effects. While cohort logic is employed by aging cohorts forward in time, survival ratios may vary across cohorts, and this potential variation is not captured in this model. For example, in comparison to older generations (born before 1946), Baby Boomers may be more likely to continue to hunt as they grow older because they are staying healthier and living longer, retiring earlier, and have higher income than any cohort that has come before them. A cohort component model would not capture this potential difference, unless specific modifications to the model were made based on cohort-related logic.9
In sum, the APC model differs conceptually from the share and cohort component models. The share model best captures age effects and when age-specific rates are held constant, ignores any potential period or cohort effects. The cohort component model is much more adept at capturing complex interactions between age, period, and to a lesser extent cohort effects; still, it does not account for potential variation in the way that cohorts experience age and period effects.
In the case of Wisconsin deer hunters, the APC model is unique in that it assumes that younger generations of females are significantly more likely to hunt than previous generations, and it assumes that the Baby Boom generation will continue to hunt as they reach older ages (up to age 70) than older generations who came before them. These reasonable assumptions would be somewhat more difficult to implement in a share- or cohort-based projection model.
Wisconsin Deer Hunter Population Projections: Empirical Results
Male Gun Hunters
Projections of the male gun hunter population suggest that the number of future hunters over the next several years will decrease considerably. Both the cohort component and APC models indicate 9 A final modification was made in each of these projections regarding race/ethnicity. The minority population of Wisconsin is growing at a rapid rate and has a relatively young age structure. It would be misleading to apply hunting rates of today to an increasingly minority population of tomorrow because of differences in the likelihood to hunt by race/ethnicity. According to the National Survey of Fishing, Hunting, and Wildlife-Associated Recreation, in 2006, 89% of the total Wisconsin Population were white, while 97% of hunters were white. (All references to “white” indicate non-Hispanic white.) Similarly, in 2006, 70% of the total U.S. population were white, while 93% of all hunters were white. These statistics indicate that hunting is an overwhelmingly white recreational activity. Rather than applying hunting rates to the total Wisconsin population, we assume that 97% of hunters in each age, sex, and license category are white and 3% are minority, create rates of participation for both white and minority populations based on estimates of the Wisconsin white and minority populations, and apply those rates to the projected white and minority populations.
24
declining numbers of male gun deer hunters. The cohort component model assumes that the low levels of hunter retention that were experienced in the recent past will continue into the future. Based on the survival ratios, between the ages of 18 and 65, cohorts lose an average of 1.9% of their hunters each year as hunters age over time. Above age 65 these decreases are more pronounced. This leads to a low projection of only about 428,000 male gun hunters by the year 2030, substantially lower than the about 550,000 hunters in 2007. If hunters continue to drop out of hunting and new young hunters enter hunting at rates similar to what they have in the recent past, then the cohort component model should reasonably predict the number of future male gun hunters. The APC model assumes that participation rates of the Baby Boom generation will remain relatively high as this group ages until at least age 70, but that declining period effects and lower participation rates of younger cohorts will lead to hunter decline. Modifications to make hunting land more accessible to an aging population might be necessary to fulfill this projection.
The share model assumes that participation rates will not continue to decline as they have since 1980, but rather that participation rates will remain stable in the future. This model shows what future numbers of male gun hunters will be if age effects were the only factor affecting hunter population change.
Figure 17: Male Gun Hunter Population History & Projections: 2000-2030
0
100,000
200,000
300,000
400,000
500,000
600,000
700,000
2000 2005 2010 2015 2020 2025 2030
Male Gun Hunter Projection: 2000‐2030
Share Model
Cohort Component Model
APC Model
Observed Hunters
25
Figure 18: Projected Male Gun Hunter Population by Age: 2030
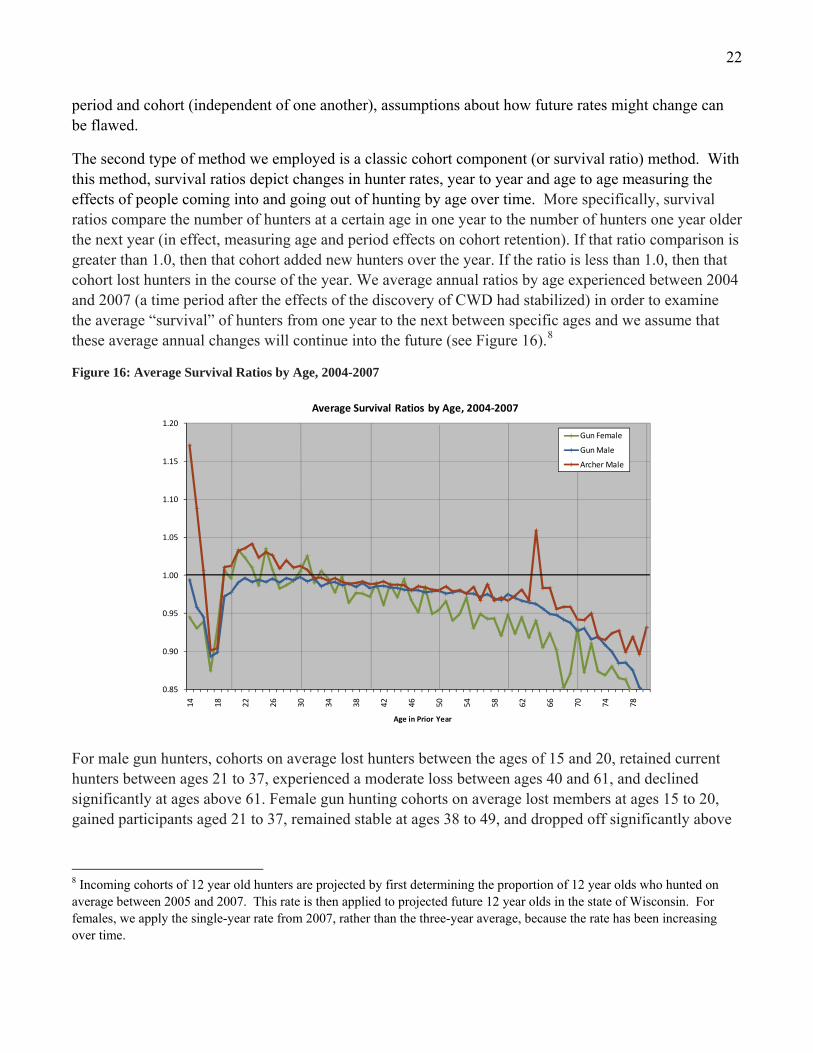
The cohort component and APC projection models suggest that numbers of female gun hunters will increase considerably in the coming years. The share model, on the other hand, projects little growth. Because the share model only considers age effects and assumes that participation rates by age will remain constant, it does not take into account the increased inclination of younger generations of females to hunt.
The cohort component and APC models allow participation rates to vary over time in relation to cohort effects. These models are particularly affected by the fact that more and more young females are hunting. The cohort component model assumes that the recently large cohorts of female hunters will, for the most part, continue to hunt through middle adulthood, after a drop off in the late teens and early twenties. The APC model is heavily influenced by cohort effects. It assumes that there has been a substantive change in more recent generations that encourages females to hunt to an extent that was never experienced by previous cohorts. In other words, the APC model is largely based on the observation that younger cohorts of women are more likely to hunt. The model assumes that these younger generations will continue to hunt as they grow older and that new incoming cohorts of females will also be similarly likely to hunt.
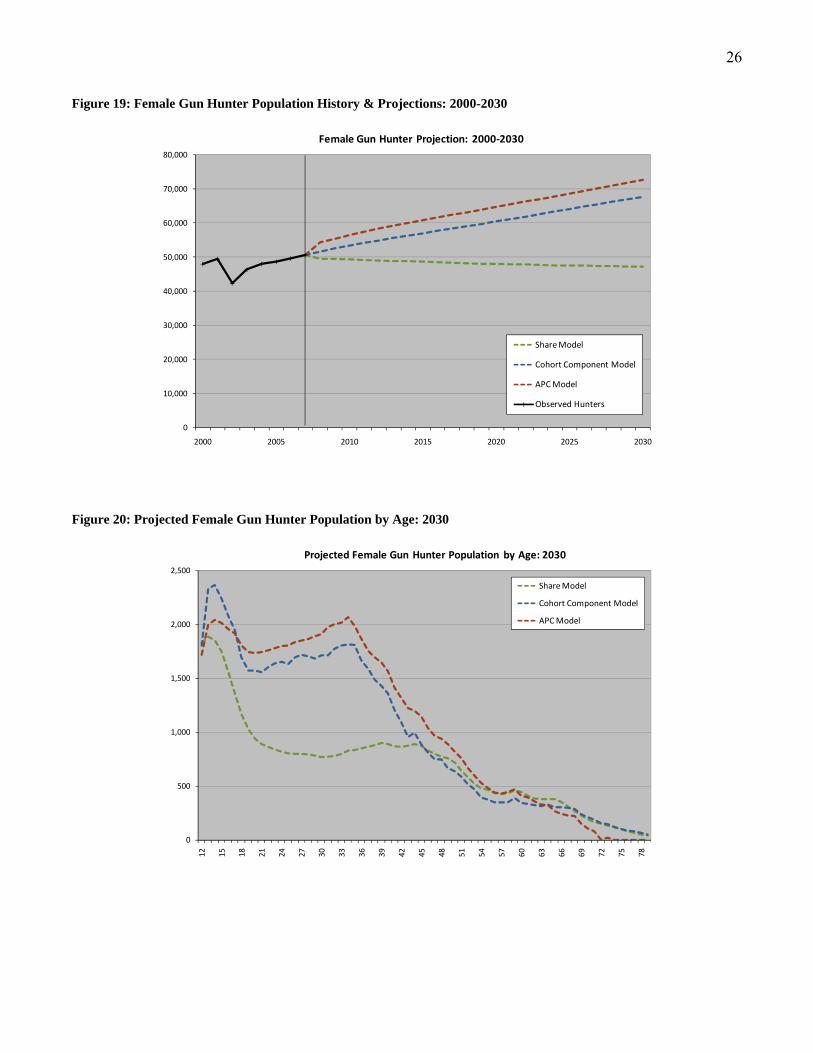
The differences in 2030 projections by age between the share, cohort component, and APC models reflect these conceptual differences. Whereby the share model assumes rates by age will remain constant, the cohort component model acknowledges the large cohorts of younger women who are currently hunters and assumes that these women will continue to hunt into the future, and APC models assume a generational shift in the likelihood of females to hunt.
26
Figure 19: Female Gun Hunter Population History & Projections: 2000-2030
0
10,000
20,000
30,000
40,000
50,000
60,000
70,000
80,000
2000 2005 2010 2015 2020 2025 2030
Female Gun Hunter Projection: 2000‐2030
Share Model
Cohort Component Model
APC Model
Observed Hunters
Figure 20: Projected Female Gun Hunter Population by Age: 2030
Projected Female Gun Hunter Population by Age: 2030
Share Model
Cohort Component Model
APC Model
27
Male Archers
The male archer population is projected to remain relatively flat in the coming years. The share and cohort component models predict similar numbers of hunters, indicating that participation rates have been relatively stable in recent history. The APC model assumes that Baby Boomers will continue to hunt into older ages and that archery will continue to become more popular as it has in recent years. With these assumptions, the APC model projects moderately increasing numbers of archers.
A point of interest: Almost all archers are also gun hunters. It may seem easy to assume that as participation in gun hunting declines, so will participation in archery. However, this has not been the case in recent years. Gun hunting has shown a strong decline, while participation in archery has remained stable over the last eight years, and has even seen increasing rates of participation at older age groups. With that in mind, it is not advisable to assume that because male gun hunters are projected to decline, so will male archers.
Figure 21: Male Archer Population History & Projections: 2000-2030
0
50,000
100,000
150,000
200,000
250,000
300,000
2000 2005 2010 2015 2020 2025 2030
Male Archer Projections: 2000‐2030
Share Model
Cohort Component Model
APC Model
Observed Hunters
28
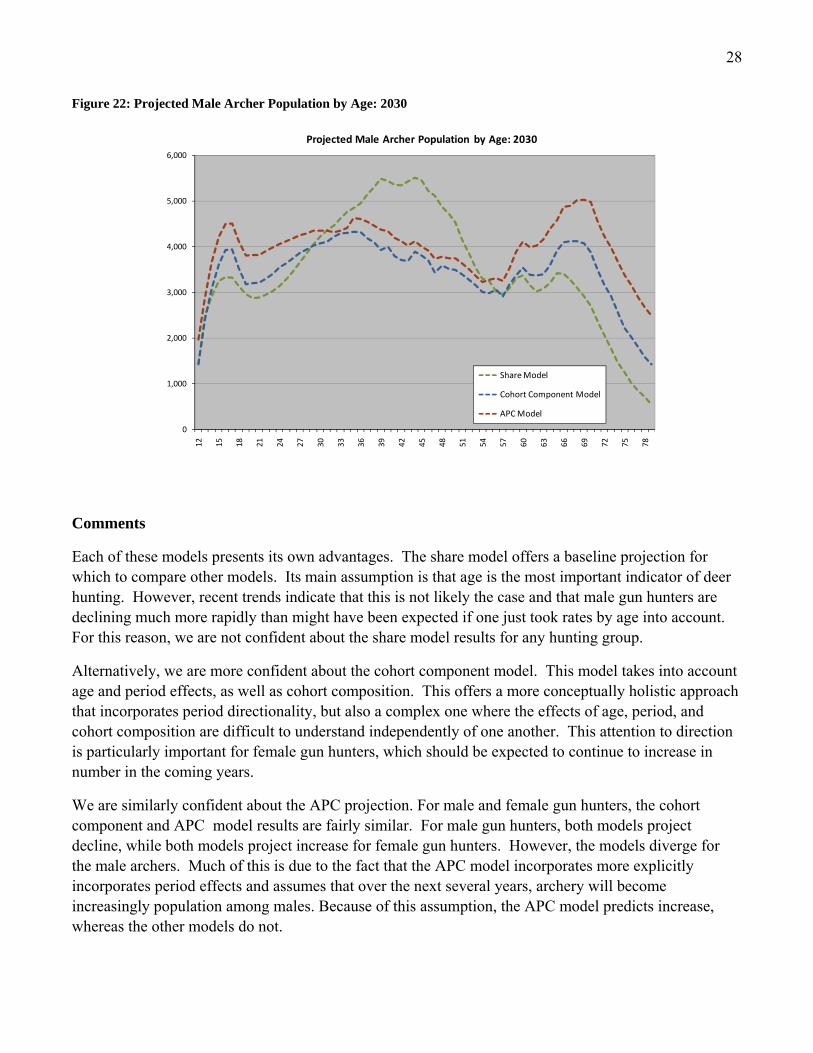
Figure 22: Projected Male Archer Population by Age: 2030
Each of these models presents its own advantages. The share model offers a baseline projection for which to compare other models. Its main assumption is that age is the most important indicator of deer hunting. However, recent trends indicate that this is not likely the case and that male gun hunters are declining much more rapidly than might have been expected if one just took rates by age into account. For this reason, we are not confident about the share model results for any hunting group.
Alternatively, we are more confident about the cohort component model. This model takes into account age and period effects, as well as cohort composition. This offers a more conceptually holistic approach that incorporates period directionality, but also a complex one where the effects of age, period, and cohort composition are difficult to understand independently of one another. This attention to direction is particularly important for female gun hunters, which should be expected to continue to increase in number in the coming years.
We are similarly confident about the APC projection. For male and female gun hunters, the cohort component and APC model results are fairly similar. For male gun hunters, both models project decline, while both models project increase for female gun hunters. However, the models diverge for the male archers. Much of this is due to the fact that the APC model incorporates more explicitly incorporates period effects and assumes that over the next several years, archery will become increasingly population among males. Because of this assumption, the APC model predicts increase, whereas the other models do not.
29
Three important benefits of the APC model are apparent. First, it forces the analyst to consider the potential impact of age, period, and cohort effects independently of one another and in conjunction with one another. This kind of careful consideration allows analysts to think more sociologically about population change and encourages consideration of the different social, economic, cultural, and/or policy-oriented changes that might impact age, period, and/or cohort effects in different ways. This theorizing process can lend important insight for making assumptions in projection models of future populations, as well as more generally offering a deeper understanding of population change. While demographers might do well to consider age, period, and cohort effects regardless of the type of projection methodology they choose, this kind of consideration is often overlooked as applied demographers simply employ traditional models of population projection to their cases. Second, the APC model is better able to capture the independent effects of age, period, and cohort in conjunction with one another than traditional share or cohort component models. Finally, the APC model offers the most intuitive means for making theory-based adjustments to age, period, and/or cohort effects based on different assumptions about the future independently of one another.
However, we must be cautious about using the APC IE regression model to form a projection. The APC IE model was not created with projections in mind, but is instead intended to estimate the effects of the past. The APC IE model is itself relatively new and untested. We are charting into unknown territory by using such a new model in this way. We believe that the APC IE model certainly has its merits and should be continue to be tested and expanded. Our purpose with this paper is not to preach the virtues of this specific method, but rather, to encourage other applied demographers to thoughtfully consider and to experiment with age-period-cohort analyses in examining recent population change and in projecting future populations.
Another point of concern is that the range of years for which we have data (2000 to 2007) is rather short. While there are no stated data requirements in Yang, et al. (2008), we are concerned that there remains a potential for age, period, and cohort to be conflated here. Because of the short time span of data available, there might not be enough time for age and cohort effects to really reveal their differences. Nevertheless, we believe that the APC projection applied to the case of Wisconsin deer hunters is trustworthy because it conforms to theory, it produces results similar to the cohort component model, and because FHWAR data generally confirm its cohort effects.
Summary
In this paper, we have applied age-period-cohort (APC) analysis to an applied study of the Wisconsin deer hunter population. We have suggested ways in which to examine the effects of age, period, and cohort on population change through exploratory data analysis and through a statistical estimation approach. In addition, we applied linear model APC estimation to generate projections of future deer hunters in the state of Wisconsin and compared differences conceptually and empirically between the APC projection model and more standard projection methodologies.
30
We hope that this case study will help to encourage and inform other applied demographers to consider and pursue APC analysis. While demographers have long been concerned with the effects of age, period, and cohort; considerable room for learning and advancing techniques remains, particularly within the realm of applied demography where APC approaches have been less common. In an effort to advance the field of applied demography, we would like to see additional studies to test the merits of the approach advanced here as well as alternative innovative approaches to applied problems using APC analysis.
Works Cited
Duda, M.D., S.J. Bissell, and K.C. Young. 1995. Factors related to hunting and fishing participation in the United States. Phase V: Final Report. U.S. Fish and Wildlife Reference Service Report.
Heberlein, T. A. 1987. Stalking the predator: A profile of the American hunter. Environment 29 (7).
Heberlein, T. and E. Thomson. 1996. Changes in US hunting participation, 1980-1990. Human Dimensions of Wildlife 1 (1).
Hobcraft, J., J. Menken, and S. Preston. 1982. Age, period, and cohort effects in demography: A review. Population Index 48 (1): 4-43.
Mason, K.O., W.H. Mason, H.H. Winsborough, and K. Poole. 1973. Some methodological issues in cohort analysis of archival data. American Sociological Review 38: 242-58.
Poudyal, N., S.H. Cho, and J.M. Bowker. 2008. Demand for resident hunting in the Southeastern United States. Human Dimensions of Wildlife 13: 158-174.
Ryder, N.B. 1965. The cohort as a concept in the study of social change. American Sociological Review 30 (6): 843-61.
Yang, Y., W. J. Fu, S. Schulhofer-Wohl, and K.C. Land. 2008. The intrinsic estimator for age-period-cohort analysis: What it is and how to use it. American Journal of Sociology 113 (6): 1697-1736.