Default and Recovery Rates of Convertible Bond Issuers: 1970-2000 Special Comment July 2001 Contact Phone New York David T. Hamilton (212) 553-1653 Pamela M. Stumpp Richard Cantor Summary This study refines Moody’s corporate bond default research to focus on convertible long-term debt issuers from 1970 to 2000. Given the increased popularity of this asset class, concern about the credit risk of these investments is well placed in the current environment of high and increasing default rates. Briefly this study finds that: • Since 1970, 280 convertible bond issuers have defaulted on $86.7 billion of long-term con- vertible debt. The distribution of convertible bond defaulters by broad industry grouping is comparable to that for all long-term corporate defaulters. • Default rates for all rated convertible debt issuers are higher than for those of issuers without convertible bonds in their capital structures. For speculative-grade-rated issuers, however, default rates do not differ from non-convertible issuers in a statistically meaningful way. • Convertible bond issuers that do not convert/redeem their bonds early face heightened risk of default not only in the third year following issuance, as is typical of most issuers, but also again in the fifth and sixth years. • Recovery rates for defaulted convertible bonds are significantly lower than those for non- convertible bonds, recovering $29 on average compared with $43 per $100 par for straight bonds. The results hold even after controlling for security and level of subordination. • Historical loss rates for convertible bonds are significantly higher than those of non-con- vertible issues. The one-year average loss rate for convertible bonds is 1.05%, compared with 0.63% for all non-convertible bonds. The fact that most convertible bonds are con- tractually or effectively subordinated seems to underlie this result. • Higher expected credit losses for convertible securities resulting from their subordinated status relative to other obligations are reflected in ratings that are often two or more notches below the issuer’s senior implied rating. continued on page 3 Default and Recovery Rates of Convertible Bond Issuers: 1970-2000 Special Comment Annual One-Year Default Rates, 1970-2000 Convertible Bond Issuers vs. Corporate (Ex-Convertible) Bond Issuers 1970 1972 1974 1976 1978 1980 1982 1984 1986 1988 1990 1992 1994 1996 1998 2000 0.0% 0.5% 1.0% 1.5% 2.0% 2.5% 3.0% 3.5% 4.0% 4.5% 5.0% Convertible Non-Convertible
Transcript
Defa
ult a
nd R
ecovery
Rate
s o
f Convertib
le B
ond Is
suers
: 1970-2
000
S
July 2001
Contact Phone
New York
David T. Hamilton (212) 553-1653Pamela M. StumppRichard Cantor
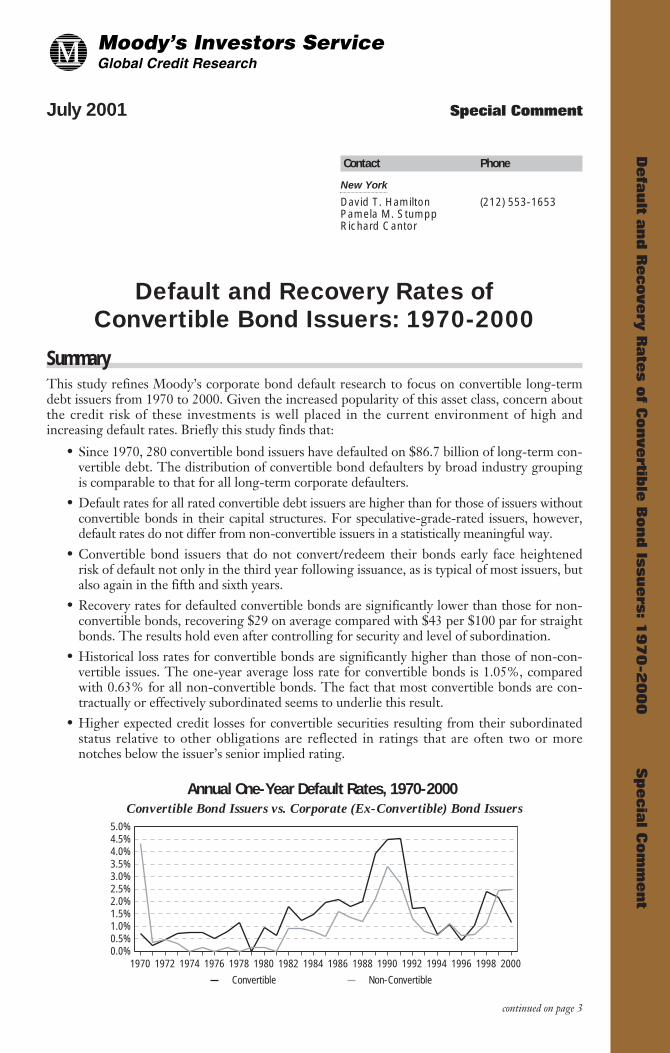
SummaryThis study refines Moody’s corporate bond default research to focus on convertible long-termdebt issuers from 1970 to 2000. Given the increased popularity of this asset class, concern aboutthe credit risk of these investments is well placed in the current environment of high andincreasing default rates. Briefly this study finds that:
• Since 1970, 280 convertible bond issuers have defaulted on $86.7 billion of long-term con-vertible debt. The distribution of convertible bond defaulters by broad industry groupingis comparable to that for all long-term corporate defaulters.
• Default rates for all rated convertible debt issuers are higher than for those of issuers withoutconvertible bonds in their capital structures. For speculative-grade-rated issuers, however,default rates do not differ from non-convertible issuers in a statistically meaningful way.
• Convertible bond issuers that do not convert/redeem their bonds early face heightenedrisk of default not only in the third year following issuance, as is typical of most issuers, butalso again in the fifth and sixth years.
• Recovery rates for defaulted convertible bonds are significantly lower than those for non-convertible bonds, recovering $29 on average compared with $43 per $100 par for straightbonds. The results hold even after controlling for security and level of subordination.
• Historical loss rates for convertible bonds are significantly higher than those of non-con-vertible issues. The one-year average loss rate for convertible bonds is 1.05%, comparedwith 0.63% for all non-convertible bonds. The fact that most convertible bonds are con-tractually or effectively subordinated seems to underlie this result.
• Higher expected credit losses for convertible securities resulting from their subordinatedstatus relative to other obligations are reflected in ratings that are often two or morenotches below the issuer’s senior implied rating.
Default and Recovery Rates ofConvertible Bond Issuers: 1970-2000
Special Comment
pecia
l Com
ment
Annual One-Year Default Rates, 1970-2000Convertible Bond Issuers vs. Corporate (Ex-Convertible) Bond Issuers
IntroductionThe dollar volume of outstanding convertible debt securities grew by more than 50% per year between1995 and 2000, driven in part by issuers in search of cheap debt financing and in part by investors seekingthe upside potential of a stock with the security of a bond. (Convertibles allow holders of interest-bearingfixed-income securities to swap these obligations for common stock when the company’s stock price hits apredetermined level.) Given the rapid rise in popularity of this asset class, concern about the credit risk ofthese investments relative to straight bond issuers is well placed in the current environment of high andincreasing default rates.
When choosing between convertible and straight bonds, many investors focus only on the tradeoffbetween a higher promised coupon rate on the straight bond and the potential equity "kicker" optionimbedded in the convertible bond. This choice implicitly assumes that expected investor losses due todefault are equivalent for similarly rated convertible and non-convertible bonds. This assumption is quitenatural because most corporate capital structures contain cross-default covenants that imply all bonds,both convertible and nonconvertible, will be drawn into default at the same time, under the same circum-stances. Moreover, one might expect that loss severity in default should generally be the same for convert-ible and nonconvertible issues of the same security class, because all debt issues within a given securityclass theoretically share the same priority of claim in bankruptcy.
However, this assumption – that investor expected loss rates are equal for equivalently rated convert-ible and nonconvertible bonds – might not be correct if convertible bonds issuance were subject to eitheradverse (or favorable) selection bias.1 In particular, convertible bonds could experience higher (or lower)default incidence than similarly rated straight bonds if convertible bond issuers were more likely thannon-convertible bond issuers to bring debt to market when their credit profile or broader credit marketconditions were improving (or declining). Similarly, selection bias could lead to differences in average lossseverity in the event of default for convertible and non-convertible bonds.
This study provides evidence that convertible bond issuance is subject to adverse selection bias thatleads to higher average investor loss rates relative to non-convertible bonds. However, to maintain compa-rability with Moody’s standard corporate bond default study, we analyze this issue somewhat indirectly,focusing on default experience at the issuer level, rather than on the bond level. We contrast the incidenceof default among companies that issue convertibles (many of whom also issue non-convertibles) to theincidence of default among firms that issue only straight bonds. Default severity, in contrast, is measuredat the bond level.
This study also supplements Moody’s Special Comment Critical Issues in Evaluating the Creditworthinessof Convertible Debt Securities (Stumpp 2001). Whereas here we take a panoramic view of the default andloss experience of convertible bond issuers for the thirty-one year period 1970-2000, that report focusesmore closely on the 1995-2000 period. This report provides quantitative measures of credit risk (defaultrates and loss severity rates), while Stumpp evaluates the fundamental credit issues related to convertibledebt securities. Taken together, the two studies provide a comprehensive picture of the credit risks associ-ated with convertible bond issuers.
The first section of this report describes the sources of data used in the analysis and provides a generaloverview of the characteristics of the data set and our methodology. The second section examines defaultrates for convertible bond issuers in detail. We examine recovery rates and historical credit loss rates fordefaulted convertible debt in the third and fourth sections. The final section presents Moody’s conclu-sions. Tables detailing one-year and cumulative default rates by rating category and over time are con-tained in the appendix.
1. Adverse selection is a problem that can arise as a result of asymmetric information when the undesirable (adverse) members of a population of buyers or sellers are more likely to participate (selection) in a voluntary exchange.
4 Moody’s Special Comment
Ratings DistributionMoody’s bases the results of this study on a proprietary database of ratings and defaults for industrial andtransportation companies, utilities, financial institutions, and sovereigns that issued long-term debt to thepublic. Municipal debt issuers, structured finance transactions, and issuers with only short-term debt rat-ings are excluded. In total, the data cover the credit experiences of over 16,000 issuers that sold long-termdebt publicly at some time between 1920 and 2000. Moody’s default database contains over 3,400 bonddefaults, rated and unrated.
For our sample of 1,993 rated convertible issuers, we tracked rating events (i.e. upgrades, downgrades,defaults and rating withdrawals) over time, producing a panel dataset of 7,392 issuer/rating observations.Of these, 6,497 are from US issuers, 417 from Japanese issuers, 83 from the UK and 69 from Canada,with the rest coming from issuers in over 30 countries in Europe, Asia, Australia, and the Caribbean.
Following the methodology of previous default studies, we use the issuer’s estimated senior unsecuredrating as the standard unit of account for measuring default rates by rating category. This approach, whichprovides a common basis for comparison across issuers, is discussed more fully in the following section.2
The distribution of estimated senior unsecured ratings held by issuers at the time they issued convert-ible debt between 1970 and 2000 is presented in Exhibit 1 below. Our data show that, similar to non-con-vertible issuers, speculative-grade senior unsecured ratings (Ba or lower) are about as common as invest-ment-grade ratings at the time of issuance for issuers of convertible bonds. Convertible issuers, however,show a distribution that is characterized by thinner tails: i.e., there are fewer initial ratings in the Aaa-Aaand single-B-Caa-C ranges relative to firms that do not issue convertibles.
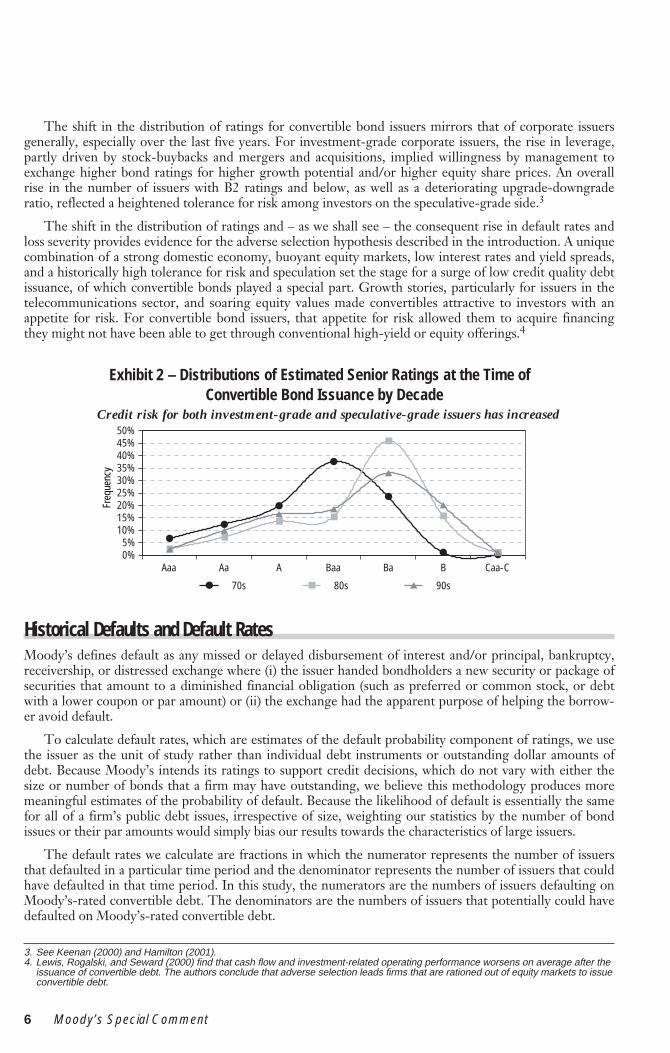
The distribution of ratings for convertible bond issuers has come to be dominated by the more risky,speculative-grade rating categories over the last twenty years, for both investment-grade and non-invest-ment-grade-rated firms. Exhibit 2 shows the change (and emerging bi-modality) in the ratings distributionthat has occurred since 1980. In the 1970s, the ratio of investment-grade to non-investment grade-ratedissuers was more heavily weighted toward investment-grade issuers: 76% of convertible bond issuers heldinvestment-grade ratings at the time of issuance A marked shift occurred in 1982, resulting in nearly equalnumbers of speculative- and investment-grade convertible issuers. Another dramatic shift began in 1986,ultimately producing a ratio exceeding two speculative-grade issuers for every one investment-grade.Currently, the distribution of ratings for investment-grade convertible bond issuers is concentrated in theBaa ratings. The proportion of issuers holding the highest speculative-grade ratings (Ba1-3) has fallenfrom 46% in the 1980s to 33% at the end of 2000.
2. See Hamilton (2001) for a full explanation of estimated senior ratings.
Exhibit 1 – Distributions of Estimated Senior Ratings at theTime of Issuance, Convertible vs Non-Convertible, 1970-2000
◆
◆
◆
◆
◆
◆
◆▲
▲
▲▲
▲ ▲
▲
Aaa Aa A Baa Ba B Caa-C0%5%
10%15%20%25%30%35%40%45%
◆ Convertible ▲ Non-Convertible
Freq
uenc
y
Moody’s Special Comment 5
The shift in the distribution of ratings for convertible bond issuers mirrors that of corporate issuersgenerally, especially over the last five years. For investment-grade corporate issuers, the rise in leverage,partly driven by stock-buybacks and mergers and acquisitions, implied willingness by management toexchange higher bond ratings for higher growth potential and/or higher equity share prices. An overallrise in the number of issuers with B2 ratings and below, as well as a deteriorating upgrade-downgraderatio, reflected a heightened tolerance for risk among investors on the speculative-grade side.3
The shift in the distribution of ratings and – as we shall see – the consequent rise in default rates andloss severity provides evidence for the adverse selection hypothesis described in the introduction. A uniquecombination of a strong domestic economy, buoyant equity markets, low interest rates and yield spreads,and a historically high tolerance for risk and speculation set the stage for a surge of low credit quality debtissuance, of which convertible bonds played a special part. Growth stories, particularly for issuers in thetelecommunications sector, and soaring equity values made convertibles attractive to investors with anappetite for risk. For convertible bond issuers, that appetite for risk allowed them to acquire financingthey might not have been able to get through conventional high-yield or equity offerings.4
Historical Defaults and Default RatesMoody’s defines default as any missed or delayed disbursement of interest and/or principal, bankruptcy,receivership, or distressed exchange where (i) the issuer handed bondholders a new security or package ofsecurities that amount to a diminished financial obligation (such as preferred or common stock, or debtwith a lower coupon or par amount) or (ii) the exchange had the apparent purpose of helping the borrow-er avoid default.
To calculate default rates, which are estimates of the default probability component of ratings, we usethe issuer as the unit of study rather than individual debt instruments or outstanding dollar amounts ofdebt. Because Moody’s intends its ratings to support credit decisions, which do not vary with either thesize or number of bonds that a firm may have outstanding, we believe this methodology produces moremeaningful estimates of the probability of default. Because the likelihood of default is essentially the samefor all of a firm’s public debt issues, irrespective of size, weighting our statistics by the number of bondissues or their par amounts would simply bias our results towards the characteristics of large issuers.
The default rates we calculate are fractions in which the numerator represents the number of issuersthat defaulted in a particular time period and the denominator represents the number of issuers that couldhave defaulted in that time period. In this study, the numerators are the numbers of issuers defaulting onMoody’s-rated convertible debt. The denominators are the numbers of issuers that potentially could havedefaulted on Moody’s-rated convertible debt.
3. See Keenan (2000) and Hamilton (2001).4. Lewis, Rogalski, and Seward (2000) find that cash flow and investment-related operating performance worsens on average after the
issuance of convertible debt. The authors conclude that adverse selection leads firms that are rationed out of equity markets to issueconvertible debt.
6 M
Exhibit 2 – Distributions of Estimated Senior Ratings at the Time ofConvertible Bond Issuance by Decade
Credit risk for both investment-grade and speculative-grade issuers has increased
●
●
●
●
●
● ●■
■
■ ■
■
■
■▲
▲
▲▲
▲
▲
▲
Aaa Aa A Baa Ba B Caa-C0%5%
10%15%20%25%30%35%40%45%50%
● 70s ■ 80s ▲ 90s
Freq
uenc
y
oody’s Special Comment
If an issuer’s convertible bond rating is withdrawn, it is subtracted from the denominator. Failing tocorrect the denominators in this way tends to generate artificially low estimates of the risk of default. It isimportant to note that Moody’s does not withdraw ratings because of deterioration in credit quality. Insuch cases, the issuer’s bonds are simply downgraded.
Moody’s ratings incorporate both the likelihood and the severity of default. So, in order to calculatethe default probability component of ratings, we must hold severity considerations constant. We do thisby taking the rating on each company’s senior unsecured debt or, if there is none, by statistically implyingsuch a rating on the basis of rated subordinated or secured debt. In most cases, this will yield an assess-ment of risk that is relatively unaffected by special considerations of collateral or of position within thecapital structure.
CONVERTIBLE BOND DEFAULT OVERVIEWBetween 1970 and 2000, 280 issuers have defaulted on approximately $86.7 billion of Moody’s-rated, con-vertible, long-term, publicly held corporate debt. Exhibit 3 presents a detailed breakdown of convertibleissuer defaults by major industrial sector in terms of defaulted dollar amounts, and Exhibit 4 presents theindustry breakdown as a percentage of issuers.
By dollar volume, financial institutions comprise the largest portion of convertible defaults – $19.6 bil-lion (22.6%). In second-place were technology firms (which includes the telecommunications sector), con-tributing another $15.3 billion (17.7%). The third-place slot was filled by industrial firms, which defaultedon another $11 billion (12.7%). These percentages conform closely to those observed over the broaderuniverse of all Moody’s-rated issuers over the same period.
CONVERTIBLE BOND DEFAULT RATESThe chart on the cover of this report shows the annual 12-month trailing average default rate for all ratingcategories, from 1970 to the present, for convertible issuers versus issuers without convertible bonds intheir capital structures. While the two series track each other closely in terms of their direction, thedefault rate for convertible issuers is almost everywhere higher than the rate for issuers ex-converts, and issignificantly higher in 1991. The average annual default rate for convertible issuers over this period is1.47%, compared to 1.06% for non-convertible issuers. The difference is statistically significant at the 5%level of confidence.5
5. t=2.29; the difference is not significant at 1%. The standard significance test might not be appropriate if one believes that issuers of convertible bonds face correlated shocks that are imperfectly correlated with shocks to straight debt issuers. Since most convertible debt issuers also issue straight debt, the standard approach seems appropriate. See Cantor and Falkenstein (2001) for further discussion.
Exhibit 3 – Defaulted Convertible Debt Volume By Broad Industry
Financial institutions and technology firmscontribute bulk of defaults by dollar volume…
Technology (23%)
Industrial (16%)
Hotel, Gaming, & Leisure (15%)
Retail (14%)
Transportation (10%)
Consumer Products (8%)
Banking (8%)Energy (4%)
Miscellaneous (1%)Utilities (0%)
Media (0%)
Exhibit 4 – Defaulted Convertible Debt Issuers by Broad Industry
… But more industrial firms default than all others
Technology (13%)
Industrial (28%)
Hotel, Gaming, & Leisure (10%)
Retail (13%)
Transportation (9%)
Consumer Products (6%)
Banking (5%)
Energy (10%)Miscellaneous (4%)
Utilities (1%)Media (1%)
Moody’s Special Comment 7
Exhibit 5, which plots the two series calculated for speculative-grade-rated issuers only, shows no sta-tistical difference, however. Here the two rates track each other more closely, nearly lying on top of oneanother. Despite the larger difference in the average annual default rate – 4.23% for spec-grade convert-ible issuers versus 2.93% (3.72% excluding 1970) for non-convertible issuers – the difference is not statis-tically significant.6 The higher default rates for all corporate convertible issuers shown on the cover chart(as opposed to Exhibit 5) therefore reflects the distribution of ratings for convertible debt issuers, which ismore heavily weighted toward speculative-grade (refer to Exhibit 2).
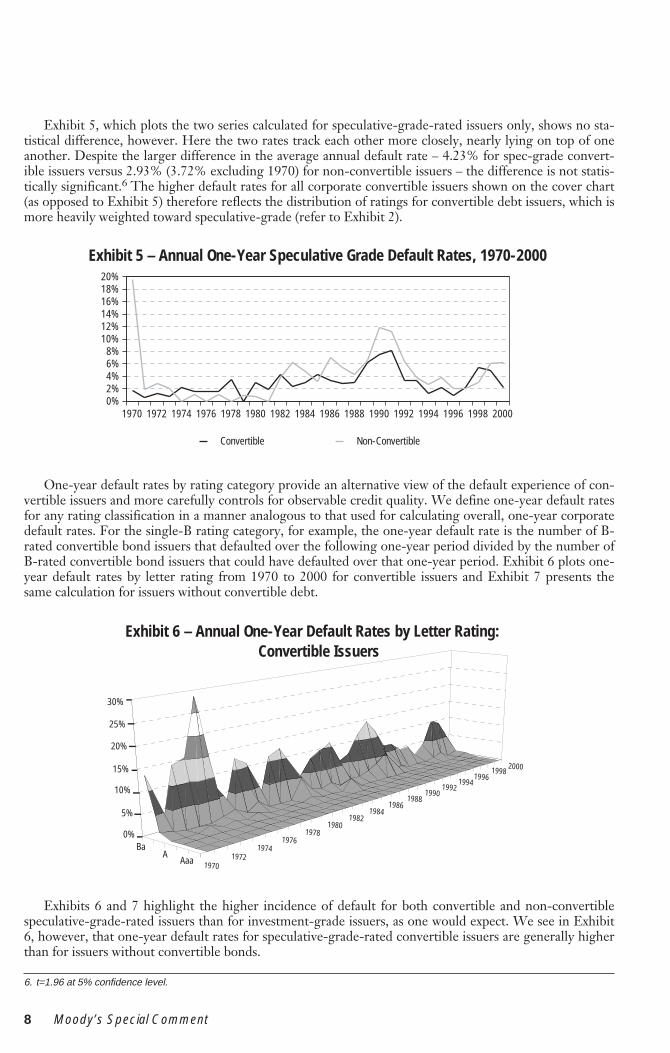
One-year default rates by rating category provide an alternative view of the default experience of con-vertible issuers and more carefully controls for observable credit quality. We define one-year default ratesfor any rating classification in a manner analogous to that used for calculating overall, one-year corporatedefault rates. For the single-B rating category, for example, the one-year default rate is the number of B-rated convertible bond issuers that defaulted over the following one-year period divided by the number ofB-rated convertible bond issuers that could have defaulted over that one-year period. Exhibit 6 plots one-year default rates by letter rating from 1970 to 2000 for convertible issuers and Exhibit 7 presents thesame calculation for issuers without convertible debt.
Exhibits 6 and 7 highlight the higher incidence of default for both convertible and non-convertiblespeculative-grade-rated issuers than for investment-grade issuers, as one would expect. We see in Exhibit6, however, that one-year default rates for speculative-grade-rated convertible issuers are generally higherthan for issuers without convertible bonds.
Exhibit 6 – Annual One-Year Default Rates by Letter Rating:Convertible Issuers
oody’s Special Comment
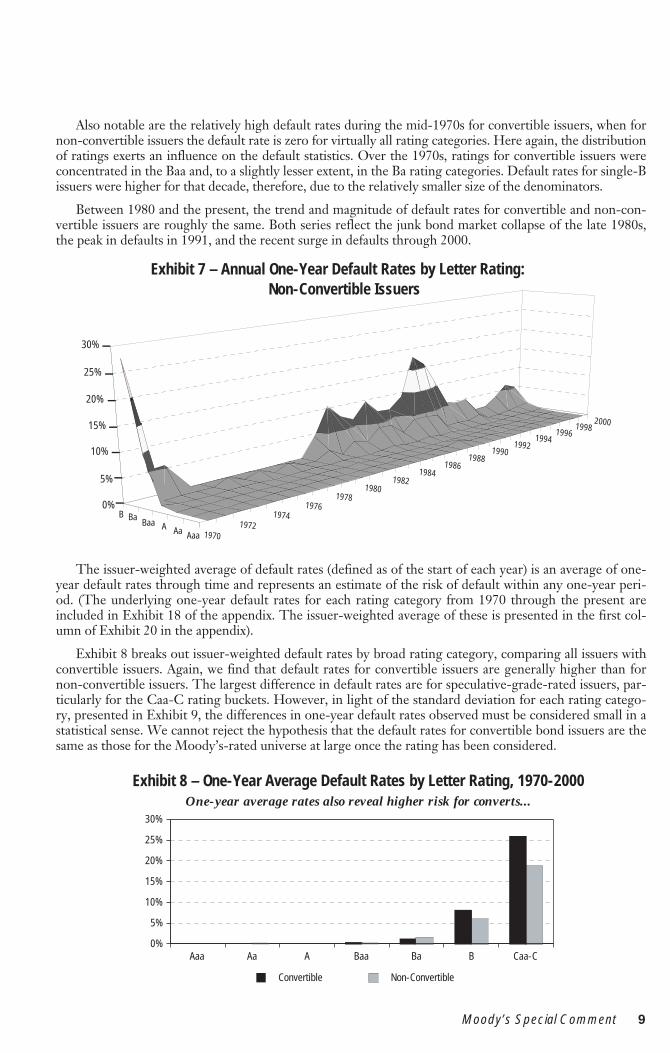
Also notable are the relatively high default rates during the mid-1970s for convertible issuers, when fornon-convertible issuers the default rate is zero for virtually all rating categories. Here again, the distributionof ratings exerts an influence on the default statistics. Over the 1970s, ratings for convertible issuers wereconcentrated in the Baa and, to a slightly lesser extent, in the Ba rating categories. Default rates for single-Bissuers were higher for that decade, therefore, due to the relatively smaller size of the denominators.
Between 1980 and the present, the trend and magnitude of default rates for convertible and non-con-vertible issuers are roughly the same. Both series reflect the junk bond market collapse of the late 1980s,the peak in defaults in 1991, and the recent surge in defaults through 2000.
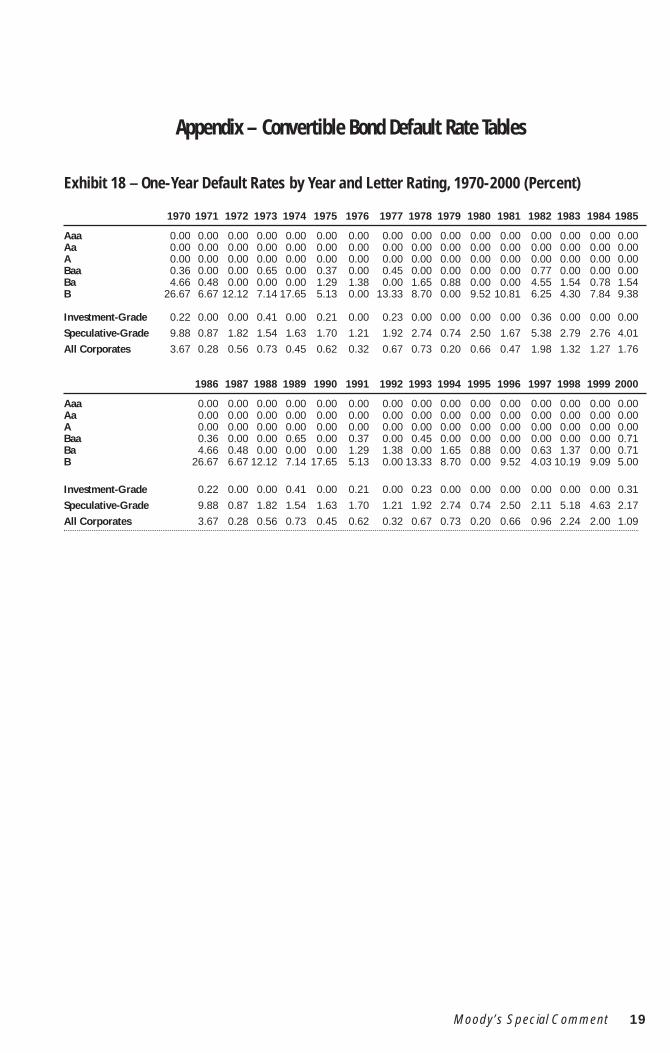
The issuer-weighted average of default rates (defined as of the start of each year) is an average of one-year default rates through time and represents an estimate of the risk of default within any one-year peri-od. (The underlying one-year default rates for each rating category from 1970 through the present areincluded in Exhibit 18 of the appendix. The issuer-weighted average of these is presented in the first col-umn of Exhibit 20 in the appendix).
Exhibit 8 breaks out issuer-weighted default rates by broad rating category, comparing all issuers withconvertible issuers. Again, we find that default rates for convertible issuers are generally higher than fornon-convertible issuers. The largest difference in default rates are for speculative-grade-rated issuers, par-ticularly for the Caa-C rating buckets. However, in light of the standard deviation for each rating catego-ry, presented in Exhibit 9, the differences in one-year default rates observed must be considered small in astatistical sense. We cannot reject the hypothesis that the default rates for convertible bond issuers are thesame as those for the Moody’s-rated universe at large once the rating has been considered.
19701972
19741976
19781980
19821984
19861988
19901992
19941996
19982000
AaaAaABaaBaB
0%
5%
10%
15%
20%
25%
30%
Exhibit 7 – Annual One-Year Default Rates by Letter Rating:Non-Convertible Issuers
Exhibit 8 – One-Year Average Default Rates by Letter Rating, 1970-2000One-year average rates also reveal higher risk for converts...
Aaa Aa A Baa Ba B Caa-C0%
5%
10%
15%
20%
25%
30%
Convertible Non-Convertible
Moody’s Special Comment 9
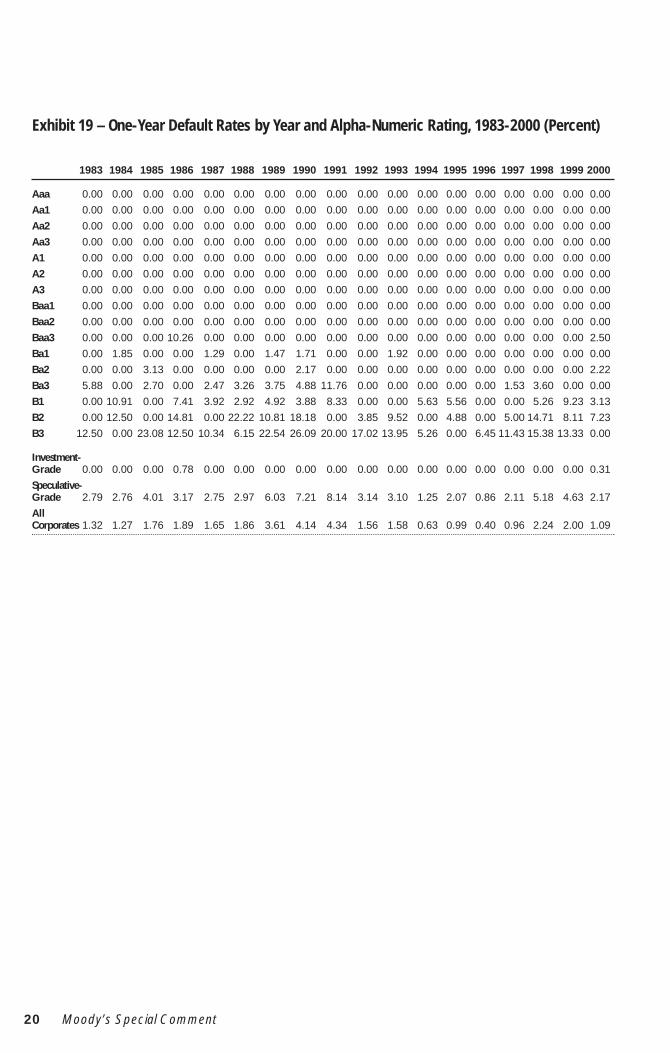
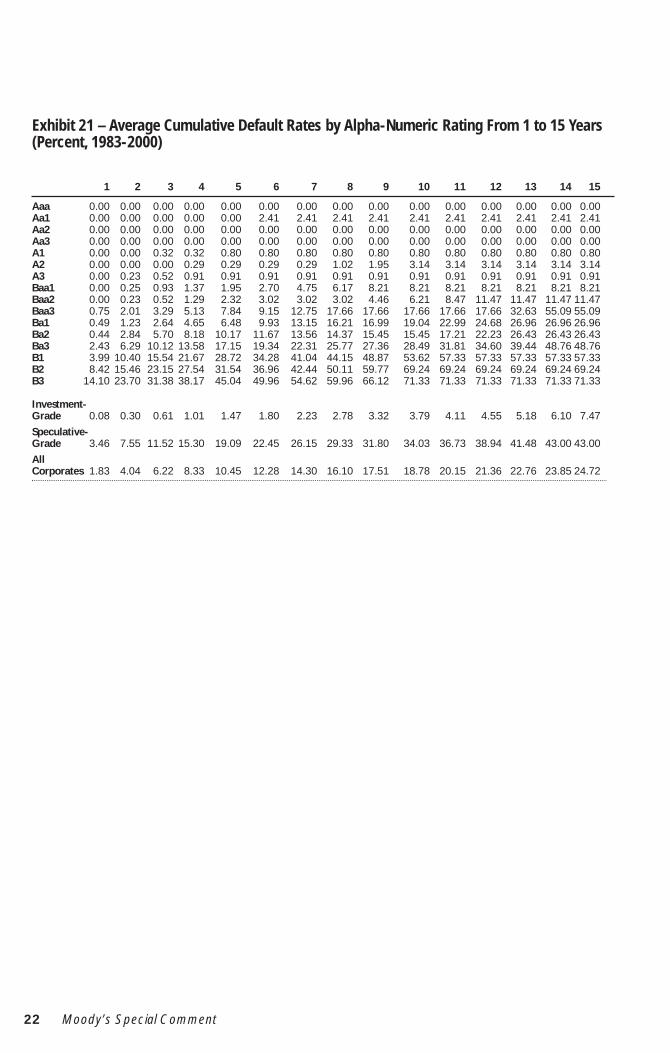
Moody’s refined its rating scale in April 1982 by adding numerical modifiers. The ratings from Aa tosingle-B were expanded to include three numerical modifiers each in order to provide finer gradations ofcredit risk. Exhibit 19 in the appendix presents one-year default rates for each of these modified rating cat-egories. The issuer weighted averages of these default rates for each rating category are presented in thefirst column of Exhibit 21. The results suggest that the relationship between ratings and default likelihoodholds for numerically modified rating categories as well as for the letter rating categories, as average one-year default rates climb from 0.0% for Aaa to 24.5% for Caa-C ratings. Again, the average default ratesare generally higher for convertibles for almost all of the rating categories.
The aggregate default statistics presented above show that default rates for convertible bond issuersdiffer meaningfully from those of issuers that do not have convertible bonds in their capital structures.Those statistics are, however, aggregate averages over a long period of time and macro in scope. A sepa-rate, but related question is: "Does default risk for individual issuers of convertible bonds differ significant-ly from that of individual non-convertible issuers?"
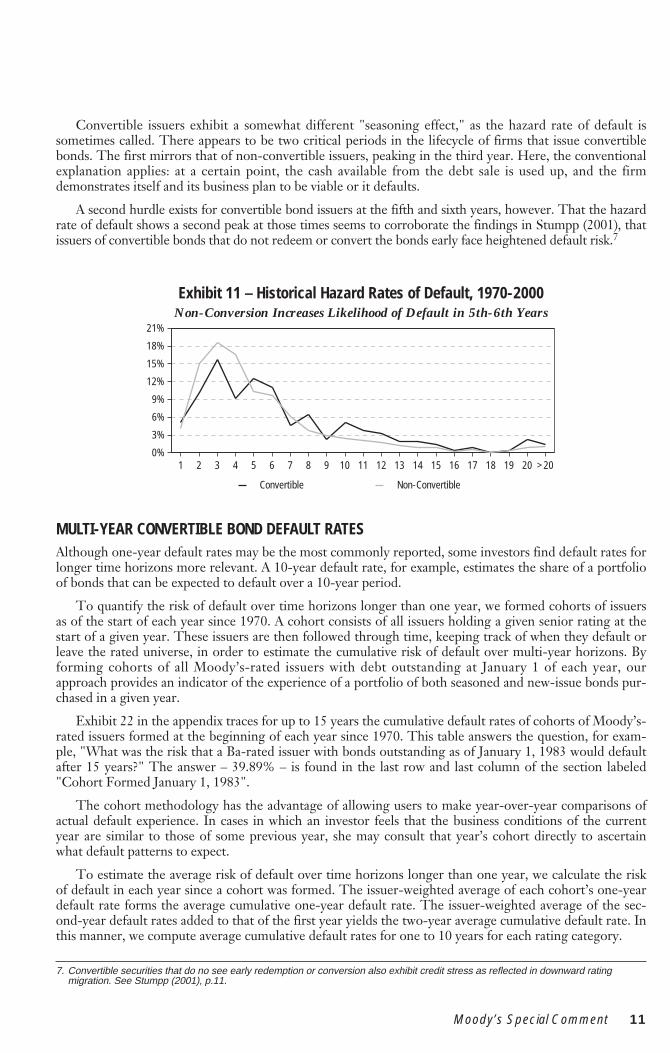
One way to answer that question is to calculate default rates as a function of time in the market (hazardrate of default) for convertible issuers and non-convertible issuers and compare the two. We do this inExhibit 11. The chart shows the frequency of default plotted against the time after which an issuer wasfirst rated.
For straight bond issuers, this mortality curve has the familiar, single-peaked shape that reaches a max-imum at about the third or fourth year after the first rating date. The curve falls off sharply thereafter, sig-nifying rapidly and almost completely monotonically decreasing default risk.
10
Exhibit 9 – One-Year Default Rate Volatilities...but difference not statistically once rating is considered.
Aaa Aa A Baa Ba B Caa-C0%
5%
10%
15%
20%
25%
30%
35%
40%
Convertible Non-Convertible
Stan
dard
Dev
iatio
n
Exhibit 10 – One-Year Average Default Rates by Alpha-Numeric Rating,1983-2000
Relationship between default and rating holds for modified categories
Convertible issuers exhibit a somewhat different "seasoning effect," as the hazard rate of default issometimes called. There appears to be two critical periods in the lifecycle of firms that issue convertiblebonds. The first mirrors that of non-convertible issuers, peaking in the third year. Here, the conventionalexplanation applies: at a certain point, the cash available from the debt sale is used up, and the firmdemonstrates itself and its business plan to be viable or it defaults.
A second hurdle exists for convertible bond issuers at the fifth and sixth years, however. That the hazardrate of default shows a second peak at those times seems to corroborate the findings in Stumpp (2001), thatissuers of convertible bonds that do not redeem or convert the bonds early face heightened default risk.7
MULTI-YEAR CONVERTIBLE BOND DEFAULT RATESAlthough one-year default rates may be the most commonly reported, some investors find default rates forlonger time horizons more relevant. A 10-year default rate, for example, estimates the share of a portfolioof bonds that can be expected to default over a 10-year period.
To quantify the risk of default over time horizons longer than one year, we formed cohorts of issuersas of the start of each year since 1970. A cohort consists of all issuers holding a given senior rating at thestart of a given year. These issuers are then followed through time, keeping track of when they default orleave the rated universe, in order to estimate the cumulative risk of default over multi-year horizons. Byforming cohorts of all Moody’s-rated issuers with debt outstanding at January 1 of each year, ourapproach provides an indicator of the experience of a portfolio of both seasoned and new-issue bonds pur-chased in a given year.
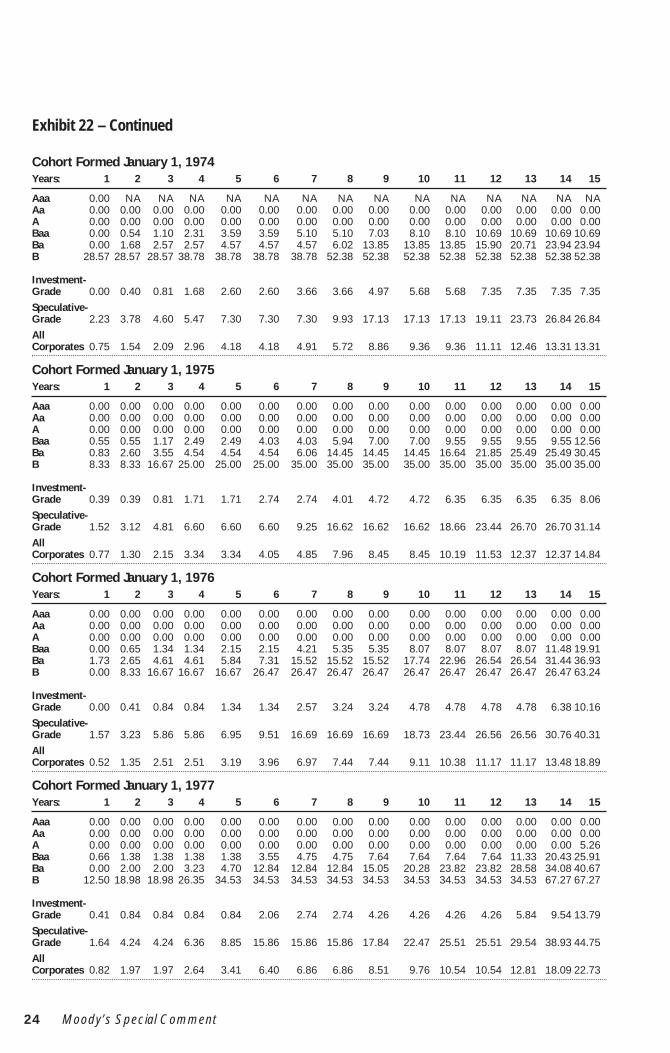
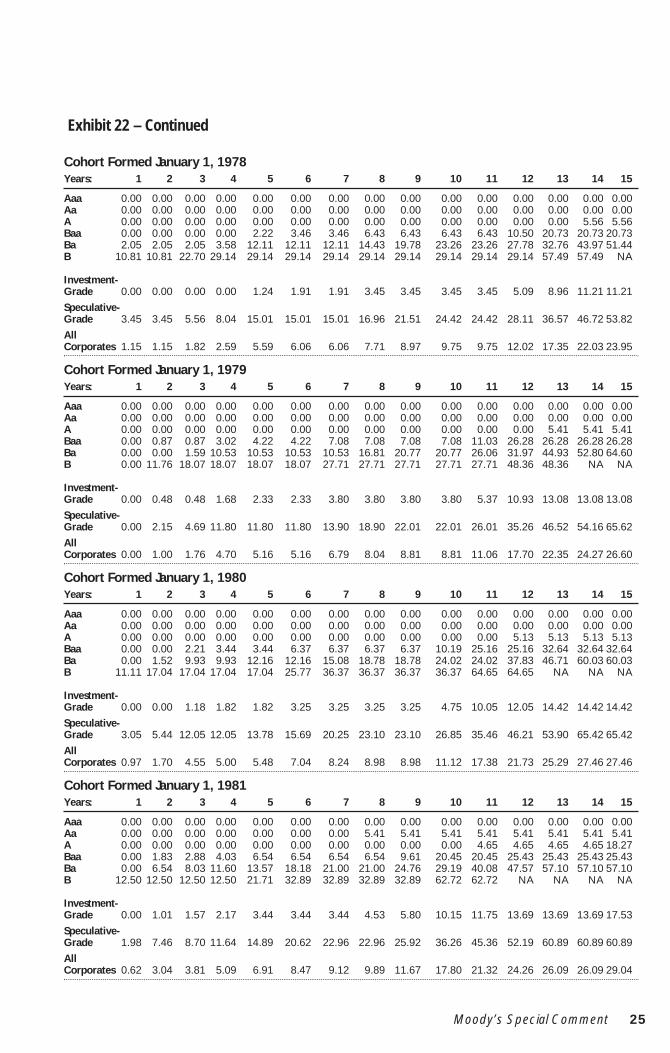
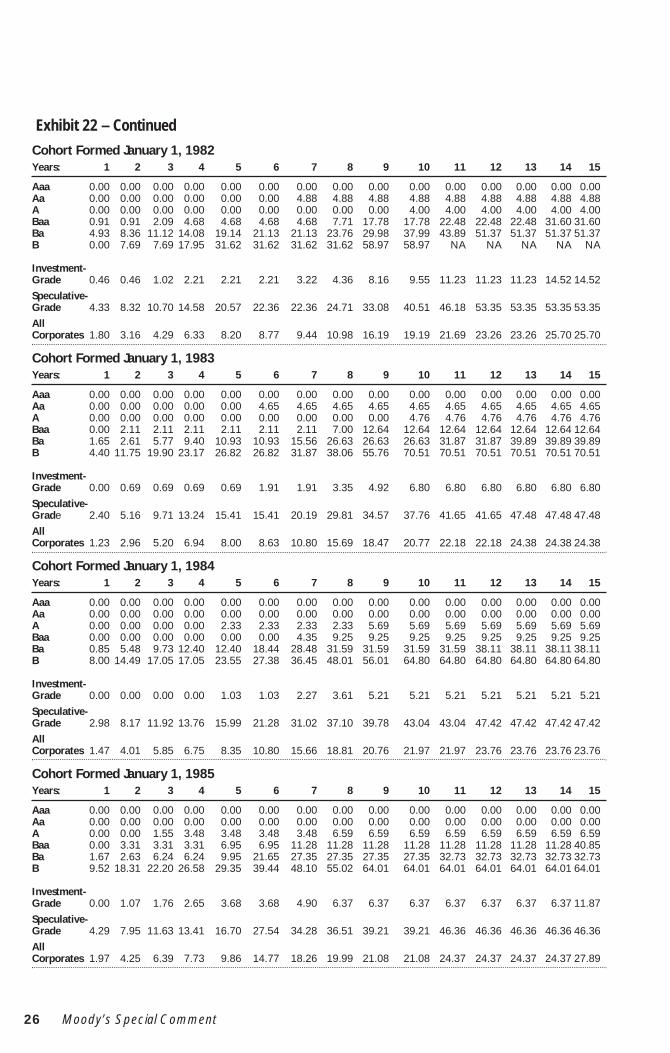
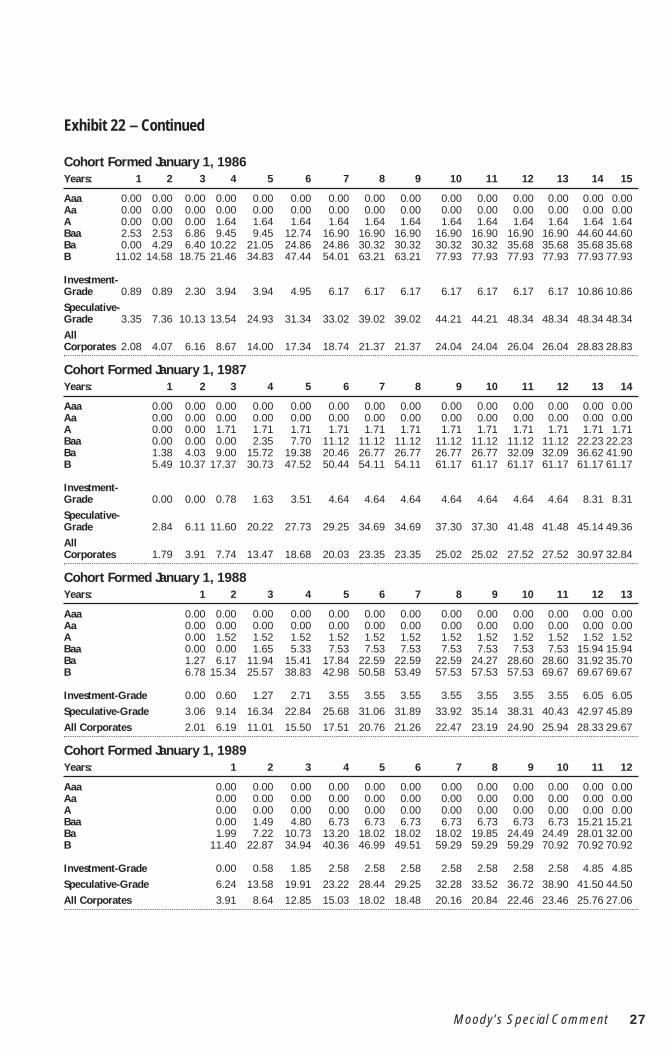
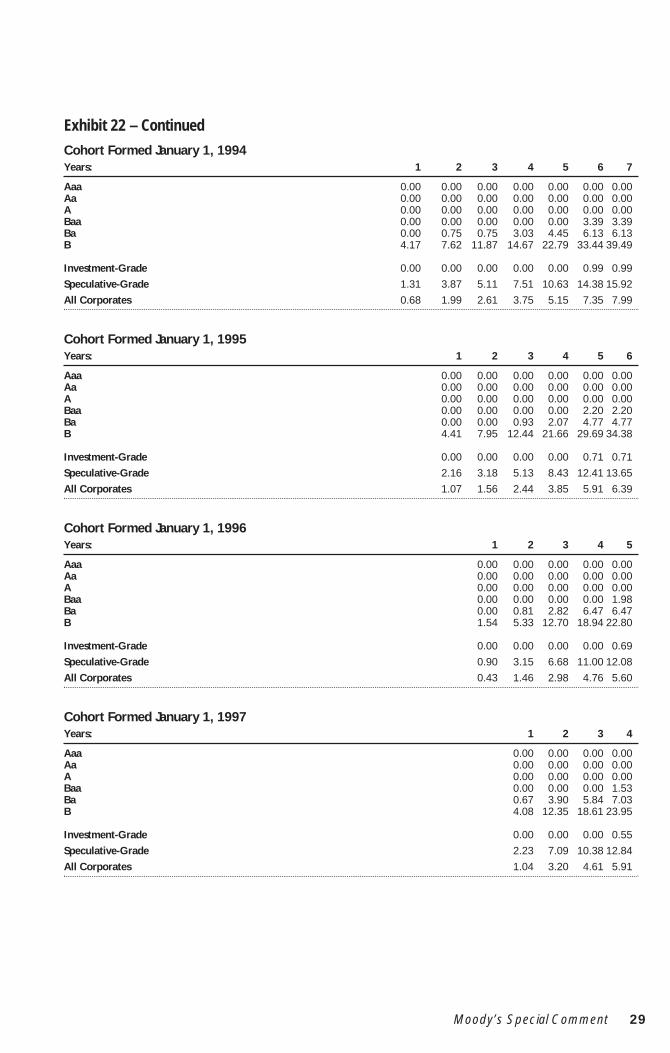
Exhibit 22 in the appendix traces for up to 15 years the cumulative default rates of cohorts of Moody’s-rated issuers formed at the beginning of each year since 1970. This table answers the question, for exam-ple, "What was the risk that a Ba-rated issuer with bonds outstanding as of January 1, 1983 would defaultafter 15 years?" The answer – 39.89% – is found in the last row and last column of the section labeled"Cohort Formed January 1, 1983".
The cohort methodology has the advantage of allowing users to make year-over-year comparisons ofactual default experience. In cases in which an investor feels that the business conditions of the currentyear are similar to those of some previous year, she may consult that year’s cohort directly to ascertainwhat default patterns to expect.
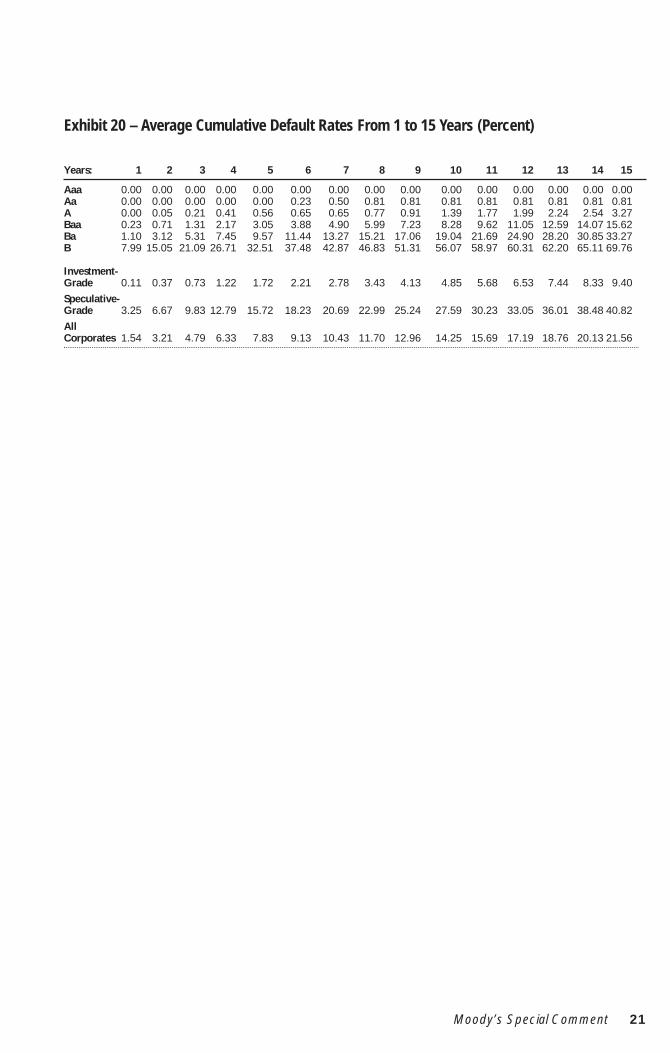
To estimate the average risk of default over time horizons longer than one year, we calculate the riskof default in each year since a cohort was formed. The issuer-weighted average of each cohort’s one-yeardefault rate forms the average cumulative one-year default rate. The issuer-weighted average of the sec-ond-year default rates added to that of the first year yields the two-year average cumulative default rate. Inthis manner, we compute average cumulative default rates for one to 10 years for each rating category.
7. Convertible securities that do no see early redemption or conversion also exhibit credit stress as reflected in downward rating migration. See Stumpp (2001), p.11.
Exhibit 11 – Historical Hazard Rates of Default, 1970-2000Non-Conversion Increases Likelihood of Default in 5th-6th Years
Exhibit 12 presents default rates for 5, 10, and 15-year time horizons based on data since 1970. Exhibit16 in the appendix presents these data in detail for the period 1970 to the present. Exhibit 20 presentsaverage cumulative default rates by broad rating category and Exhibit 21 by numerically modified ratingsfor up to ten years.
Exhibit 12 shows that higher default risk for lower rating categories remains evident for convertibleissuers over investment periods exceeding one year. For example, average default rates for five-year hold-ing periods climb from 0.0% for the Aaa rating category to 7.9% for the B rating category. Exhibit 12 alsoshows that the pattern recurs for average default rates for 10-year and 15-year holding periods. These pat-terns are relatively smooth and well behaved, suggesting that the convertible issuer subset has had a defaultexperience very similar to the full sample of corporate issuers when broken down by rating category.
Recovery Rate EstimatesA critical aspect of a corporate bond default is the severity of the loss incurred. Eventually, most bonddefault resolutions provide bondholders with some amount of recovery, which may take the form of cash,other securities, or even physical assets. The recovery rate, defined here as the percentage of par valuereturned to the bondholder, is a function of several variables. These variables include the seniority of theissue within the issuer’s capital structure, the quality of collateral (if any), the overall state of the economy,and the thickness of the market for corporate assets.8
What may seem the most straightforward methodology for calculating recovery rates is not particular-ly practical. This methodology would track all payments made on a defaulted debt instrument, discountthem back to the date of default, and present them as a percentage of the par value of the security.However, this methodology is problematic because it relies on many assumptions. One must make a sepa-rate estimate of the discount rate to apply to each payment generated by the defaulted instrument.Furthermore, one often must make assumptions concerning the values of certain payments. The resolu-tion may hand bondholders various equity and derivative instruments, enhancements to the terms of thesurviving debt, or sometimes even physical assets in place of cash. As there is frequently no market forsuch payments, there is no precise and accurate measure of their value.
For these reasons, we use the trading price of the defaulted instrument as a proxy for the present valueof the ultimate recovery. Although it is only an estimate of the actual recovery, it has the advantage ofbeing the definite measure of the recovery realized by those debtholders who liquidate a position soonafter default.
One may translate defaulted debt prices into recovery rate estimates by presenting them as percentagesof par (not percentages of original issue prices or accreted values). Investors are entitled to receive facevalue at maturity, even though they may have paid somewhat less or more for the bond either at issue orin the secondary market. Because discount bonds have unique pricing features, we have removed themfrom the sample.
8. See Hamilton (1999).
12 M
Exhibit 12 – 5, 10 & 15 Year Average Convertible DefaultRates: 1970-2000
Aaa Aa A Baa Ba B0%
2%
4%
6%
8%
10%
12%
14%
5-Year 10-Year 15-Year
oody’s Special Comment
We collected, from several sources, prices for many of the bonds that defaulted between 1970 and2000. For each defaulted issue, we considered the convertibility, seniority, date of default, and the priceapproximately one month after default. Exhibit 13 maps out the yearly average of defaulted non-convert-ible and convertible subordinated bond prices in our database since 1970.9
The data reveal considerable volatility in average defaulted bond prices year-over-year, as well as somedegree of correlation with macroeconomic variables and the risk of default. The lows of 1990 correspondto a peak in the corporate default rate and an economic recession in the US. Interpretation of the 1981and 1979 lows for the average defaulted convertible bond prices should be tempered by the fact that sam-ple sizes for these years are critically low.
Overall, the average defaulted convertible bond price series tracks that of the non-convertible bondsclosely suggesting that these instruments react similarly to prevailing business conditions.
Exhibit 14 below also compares the average defaulted bond pricing observed for non-convertiblebonds versus convertible bonds, this time examining the manner in which these recoveries are correlatedwith the seniority of the respective claims.10 The average prices of the non-convertible bonds decline asthe seniority and security of the claim falls from senior and secured, $51.81, to junior subordinated andunsecured, $18.72, as expected.
However, the pattern is not as clearly defined for the average convertible bond prices. The averageprice is highest for the senior unsecured convertible bonds, $34.07 Furthermore, the average prices fordefaulted convertible bonds are considerably different than those of non-convertible defaulted bonds atthe senior secured through senior subordinated levels.
Overall, recovery rates for convertible debt are statistically significantly lower than recovery rates fornon-convertible, straight debt. When broken out by level of subordination and security, t-statistics do notsuggest statistically significant differences, except for subordinated debt, where convertibles’ lower recov-ery is statistically significant.
9. For the period before 1979 sample sizes are small; they are included in these results for the sake of completeness.10. Security and the level of subordination have been found to be the strongest univariate determinant of recovery values in default.
See Hamilton (1998).
Exhibit 13 – Annual Average Defaulted Bond Prices: 1970-2000Convertible and non-convertible recoveries respond similarly to macroeconomic
These anomalies are largely attributable to the small sample sizes available for defaulted convertiblebonds at the senior secured through senior subordinated levels. The average recovery rate for defaultedsenior secured convertible bonds, for example, is based upon prices for just five convertible mortgagebond issues of the same issuer – Damson Oil. While the sample size is slightly larger for defaulted seniorunsecured convertible issues, for which there are six different issuers, the sample size is still too small todraw any reliable conclusions from these data.
The recovery estimates presented in Exhibit 14 are simple averages of defaulted bond prices. Theyapproximate the most likely bond price to arise from a particular default, but they do not convey the rangeof possible outcomes. For example, while the estimated recovery for all convertible subordinated bonds is$28.84 per $100 par amount, frequently prices above and below $28.84 were observed. This volatility indefaulted bond prices is an important additional consideration when determining likely recovery rates.
Exhibit 14 includes the standard deviation of the average bond prices presented. Again, small samplesgenerally make it hazardous to draw conclusions about the volatility of defaulted senior secured, senior unse-cured, senior subordinated or junior subordinated convertible debt relative to non-convertible debt of thesame seniority and security. However, in the case of defaulted convertible subordinated debt, the sample sizeis adequate and the standard deviation is very near to that for non-convertible debt of the same seniority.
An F-test for the difference between the two variances (that of the defaulted convertible subordinatedbonds and that of the defaulted non-convertible bonds) fails to reject the hypothesis that the two are thesame at the 10% level of confidence. Hence, the uncertainty that surrounds the value of defaulted non-convertible subordinated claims seems also to characterize defaulted convertible subordinated claims.
However, these average defaulted bond prices are only indirect estimates of any difference that mayexist between the value of a defaulted convertible and straight bonds. In order to accurately estimate theeffect of a bond’s convertibility provisions on recovery, we must hold constant the circumstances peculiarto each default. We accomplish this by comparing the prices of convertible and non-convertible bonds ofthe same security and level of subordination and the same issuing firm. Exhibit 15 presents a summary ofthis analysis.
Exhibit 15 – Comparison Between Defaulted Convertible and Non-Convertible Debt PricingDefaulted convertibles are worth, on average, $7.74 less than non-convertible bonds of the same issuer
Default Date Defaulter Name Debt Seniority Convertible Price Straight Price Difference
01-Sep-80 White Motor Corporation Subordinated $32.00 $44.00 ($12.00)15-Apr-82 Saxon Industries, Inc. Subordinated $22.25 $22.63 ($0.38)15-Sep-82 Tridex Corporation Subordinated $59.00 $62.00 ($3.00)07-Feb-85 Oak Industries, Inc. Subordinated $53.50 $65.00 ($11.50)01-Mar-85 Castle & Cooke, Inc. Subordinated $79.00 $73.13 $5.8801-Aug-85 Global Marine Inc. Sr. Subordinated $33.00 $31.46 $1.5401-Sep-85 Pettibone Corp. Subordinated $40.00 $40.75 ($0.75)25-Sep-85 Crystal Oil Company Subordinated $46.50 $53.75 ($7.25)20-Oct-87 Pathe Communications Corporation Sr. Subordinated $27.00 $36.00 ($9.00)13-Nov-87 Care Enterprises, Inc. Sr. Subordinated $30.00 $29.00 $1.0014-Jul-89 Southmark Corporation Subordinated $8.00 $8.50 ($0.50)01-Sep-89 Lomas Financial Corporation Subordinated $30.06 $31.10 ($1.03)31-Jan-90 One Bancorp, The Subordinated $13.00 $84.31 ($71.31)25-Apr-90 Ames Department Stores, Inc. Subordinated $13.75 $36.25 ($22.50)15-Jun-90 Western Union Corporation Subordinated $34.25 $19.50 $14.7515-May-91 Nortek Inc. Sr. Unsecured $42.38 $48.00 ($5.63)14-Jun-91 Lionel Corp. Subordinated $21.50 $35.50 ($14.00)19-Sep-91 Southeast Banking Corporation Subordinated $1.25 $4.00 ($2.75)16-Apr-99 Altos Hornos de Mexico, S.A. de C.V. Sr. Unsecured $29.50 $36.50 ($7.00)19-Jul-99 Daewoo Corporation Sr. Unsecured $73.17 $84.50 ($11.33)01-Nov-99 Integrated Health Services, Inc. Sr. Subordinated $1.00 $6.75 ($5.75)
Average ($7.74)Standard Deviation $16.52
14 Moody’s Special Comment
For each of the 21 defaults for which we have pricing for both convertible and non-convertible bondsof the same seniority/security, the fourth column of Exhibit 15 presents the price of the convertible debtof the seniority/security indicated in the third column.11 The fifth column of Exhibit 15 presents the priceof the non-convertible debt of the seniority indicated in the third column. The last column presents thedifference between these two prices and so is an indication of the market’s perception of the value of theconvertibility of the debt holding constant the circumstances of each particular default, the seniority of theclaim and its security.
The average difference between the prices of the defaulted convertible and non-convertible debt pre-sented in Exhibit 15 amounts to $7.74. That is, convertible defaulted bonds are worth, on average, $7.74less than their non-convertible counterparts. Although the variability of this statistic, as indicated by itsstandard deviation ($16.52), is large, we reject the hypothesis that the difference is actually zero.12 Hence,the data provide further evidence that there is a statistically significant difference between the way thatdefaulted convertible debt claims are priced and the way that defaulted non-convertible claims are priced.The next section discusses some of the reasons that lead to this result.
Historical Loss RatesMoody’s rating process is designed to produce a consistent measure of relative credit risk, the primaryconsideration of which is Moody’s evaluation of expected credit loss. Moody’s evaluation of expectedcredit loss reflects both the probability of default and the severity of loss in the event of default expressedthrough a simple rating symbol on a uniform rating scale. Moody’s ratings are designed to provideinvestors with a consistent indicator of credit quality with the full consideration of geographic, sectoral,structural, and contractual standing of the obligation.13
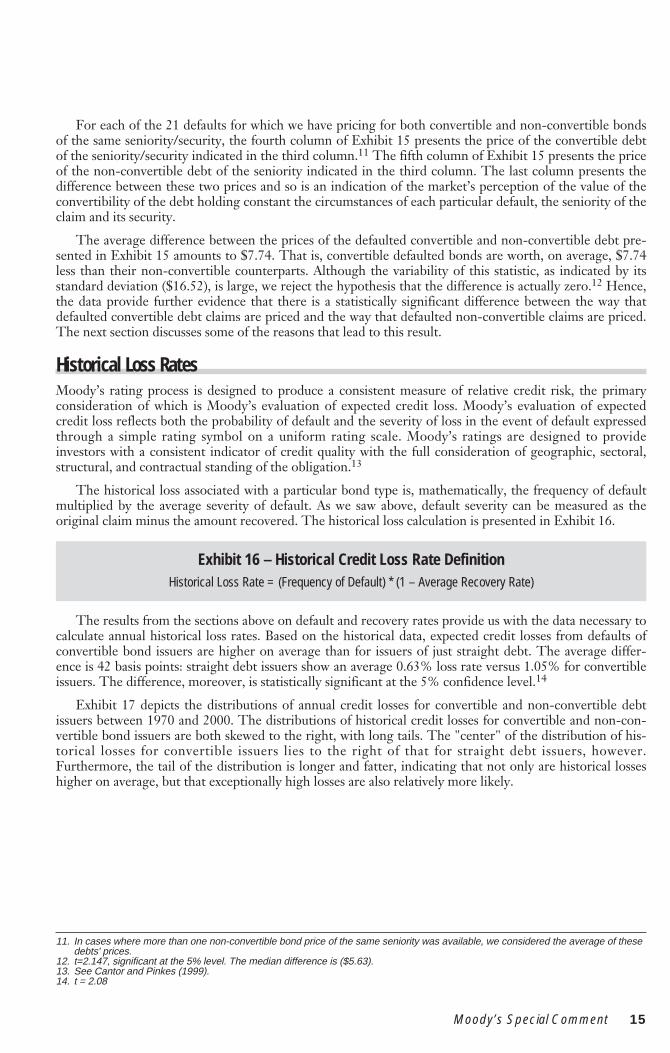
The historical loss associated with a particular bond type is, mathematically, the frequency of defaultmultiplied by the average severity of default. As we saw above, default severity can be measured as theoriginal claim minus the amount recovered. The historical loss calculation is presented in Exhibit 16.
The results from the sections above on default and recovery rates provide us with the data necessary tocalculate annual historical loss rates. Based on the historical data, expected credit losses from defaults ofconvertible bond issuers are higher on average than for issuers of just straight debt. The average differ-ence is 42 basis points: straight debt issuers show an average 0.63% loss rate versus 1.05% for convertibleissuers. The difference, moreover, is statistically significant at the 5% confidence level.14
Exhibit 17 depicts the distributions of annual credit losses for convertible and non-convertible debtissuers between 1970 and 2000. The distributions of historical credit losses for convertible and non-con-vertible bond issuers are both skewed to the right, with long tails. The "center" of the distribution of his-torical losses for convertible issuers lies to the right of that for straight debt issuers, however.Furthermore, the tail of the distribution is longer and fatter, indicating that not only are historical losseshigher on average, but that exceptionally high losses are also relatively more likely.
11. In cases where more than one non-convertible bond price of the same seniority was available, we considered the average of these debts' prices.
12. t=2.147, significant at the 5% level. The median difference is ($5.63).13. See Cantor and Pinkes (1999).14. t = 2.08
Exhibit 16 – Historical Credit Loss Rate DefinitionHistorical Loss Rate = (Frequency of Default) * (1 – Average Recovery Rate)
Moody’s Special Comment 15
Since we have already seen that default rates are higher and recovery rates lower (severity higher), onaverage, for convertible issuers than for non-convertible issuers, it is not surprising that historical lossrates are commensurately higher. Several fundamental credit factors characteristic of convertible debtmotivate this result:
• Convertible debt issues are often low in priority (subordinated) in the capital structure. As we saw inExhibit 14 in the recovery rates section, 225, or 82% of the convertible bonds with available priceswere subordinated.
• When not contractually subordinated, convertibles are often structurally subordinated, usuallyissued by a holding company. This structural subordination often increases over time, puttingincreasing distance between debt holders and the sources of recovery in the event of default.15
• Absent upstream guarantees and/or meaningful covenants, holders of convertible debt usually haveno seat at the negotiating table and virtually no say in restucturing at the operating company level.In other words, structural subordination caused by the absence of a guarantee leaves the convertswith a claim against the holding company only. Moreover, since they have no covenants that restrictwhat happens at the operating company, their consent is not needed for a restructuring at the oper-ating company. In essence, convert holders can only passively take a "wait and see" approach whilethe better positioned creditors at the operating company do other things to try to improve theirposition (such as take collateral).If there were no structural subordination because the convertibles were issued by the operating com-pany directly, or if the convertibles were issued by the holding company with guarantees (unlikely),higher credit losses could still occur relative to pari-passu bonds in situations where the bonds havenegative pledges and the creditors want to take collateral. In this case, the consent of the bondhold-ers may be required and the bondholders may get a second lien on collateral, thereby improvingtheir position vis-a-vis the convertible holders. These situations exist because the bonds may havebetter terms (such as covenants) that give them more negotiating leverage.
Moody’s ratings of convertible debt issues reflect the effects of these factors on expected credit loss.Assuming a simplified legal firm structure, convertible subordinated debt will likely be rated at least onenotch below the senior implied or senior unsecured rating for companies whose senior implied rating isBa2 and above. For issuers whose senior implied rating is Ba3 and below, the debt will be notched down atleast two notches.16
15. See Stumpp (2001), p.5, for an elaboration on the effect of structural subordination.16. Ibid.
16
Exhibit 17 – Distribution of Annual Historical Loss Rates, 1970-2000Convertible bonds experienced higher loss rates compared to non-convertibles
0%
5%
10%
15%
20%
25%
30%
35%
Convertible Non-Convertible
4.00
%
3.75
%
3.50
%
3.25
%
3.00
%
2.75
%
2.50
%
2.25
%
2.00
%
1.75
%
1.50
%
1.25
%
1.00
%
0.75
%
0.00
%
0.25
%
0.50
%
Moody’s Special Comment
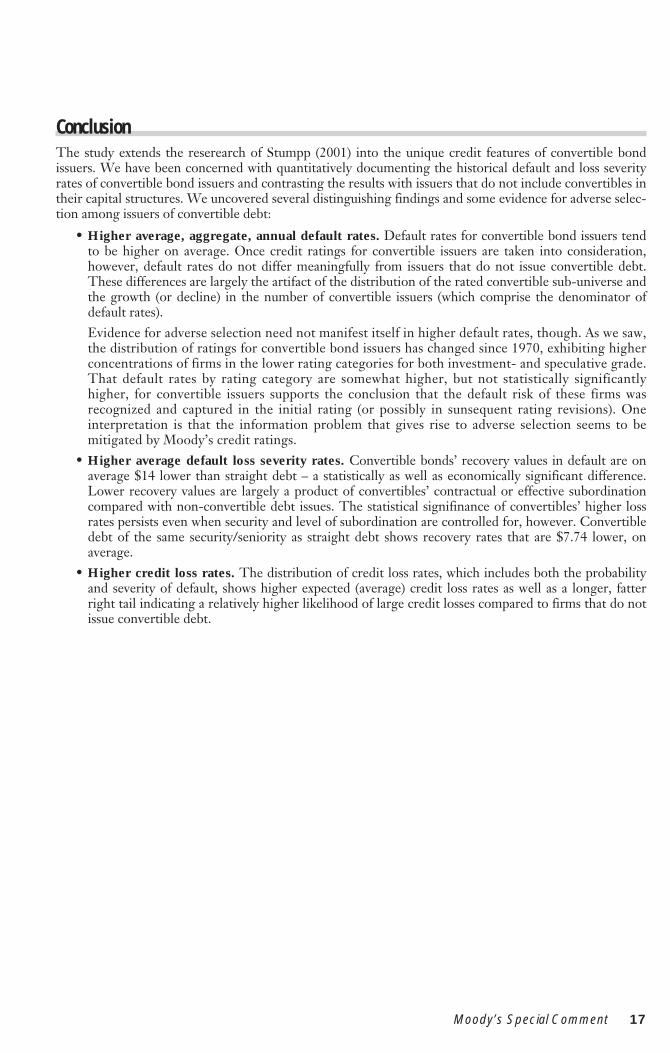
ConclusionThe study extends the reserearch of Stumpp (2001) into the unique credit features of convertible bondissuers. We have been concerned with quantitatively documenting the historical default and loss severityrates of convertible bond issuers and contrasting the results with issuers that do not include convertibles intheir capital structures. We uncovered several distinguishing findings and some evidence for adverse selec-tion among issuers of convertible debt:
• Higher average, aggregate, annual default rates. Default rates for convertible bond issuers tendto be higher on average. Once credit ratings for convertible issuers are taken into consideration,however, default rates do not differ meaningfully from issuers that do not issue convertible debt.These differences are largely the artifact of the distribution of the rated convertible sub-universe andthe growth (or decline) in the number of convertible issuers (which comprise the denominator ofdefault rates).Evidence for adverse selection need not manifest itself in higher default rates, though. As we saw,the distribution of ratings for convertible bond issuers has changed since 1970, exhibiting higherconcentrations of firms in the lower rating categories for both investment- and speculative grade.That default rates by rating category are somewhat higher, but not statistically significantlyhigher, for convertible issuers supports the conclusion that the default risk of these firms wasrecognized and captured in the initial rating (or possibly in sunsequent rating revisions). Oneinterpretation is that the information problem that gives rise to adverse selection seems to bemitigated by Moody’s credit ratings.
• Higher average default loss severity rates. Convertible bonds’ recovery values in default are onaverage $14 lower than straight debt – a statistically as well as economically significant difference.Lower recovery values are largely a product of convertibles’ contractual or effective subordinationcompared with non-convertible debt issues. The statistical signifinance of convertibles’ higher lossrates persists even when security and level of subordination are controlled for, however. Convertibledebt of the same security/seniority as straight debt shows recovery rates that are $7.74 lower, onaverage.
• Higher credit loss rates. The distribution of credit loss rates, which includes both the probabilityand severity of default, shows higher expected (average) credit loss rates as well as a longer, fatterright tail indicating a relatively higher likelihood of large credit losses compared to firms that do notissue convertible debt.
Moody’s Special Comment 17
Bibliography
Cantor, Richard and K. Pinkes, "The Evolving Meaning of Moody’s Bond Ratings," A Moody’s SpecialReport, September 1999.
Cantor, Richard and E. Falkenstein, "Testing for Consistency in Annual Default Rates," A Moody’sSpecial Report, February 2001.
Hamilton, David T., "Debt Recoveries for Corporate Bankruptcies," A Moody’s Special Report, June 1998.
Hamilton, David T., "Default and Recovery Rates of Corporate Bond Issuers: 2000," A Moody’s SpecialReport, February 2001.
Keenan, Sean C., "Historical Default Rates of Corporate Bond Issuers, 1920-1999,"A Moody’s SpecialReport, January 2000.
Lewis, Craig M., R. Rogalski, and J. Seward, "The Long-Run Performance of Firms That IssueConvertible Debt: An Empirical Analysis of Operating Characteristics and Analyst Forecasts," WorkingPaper, Vanderbilt Univeristy, May 2000.
Stumpp, Pamela M., "Critical Issues in Evaluating the Creditworthiness of Convertible Debt Securities,"A Moody’s Special Report, June 2001.
18 Moody’s Special Comment
Appendix – Convertible Bond Default Rate Tables
Exhibit 18 – One-Year Default Rates by Year and Letter Rating, 1970-2000 (Percent)
To order reprints of this report (100 copies minimum), please call 800.811.6980 toll free in the USA. Outside the US, please call 1.212.553.1658.Report Number: 68884