Page 1
Defect-based Condition Assessment Model of Railway Infrastructure
by
Laith El-khateeb
A Thesis
in
The Department
of
Building, Civil and Environmental Engineering
Presented in Partial Fulfillment of the Requirements
for the Degree of Master of Applied Science (Civil Engineering)
at
Concordia University
Montreal, Quebec, Canada
March 2017
© Laith El-Khateeb, 2017
CONCORDIA UNIVERSITY
Page 2
Page ii
CONCORDIA UNIVERSITY
School of Graduate Studies
This is to certify that the thesis prepared
By: Laith El-khateeb
Entitled: Defect-Based Condition Assessment Model of Railway Infrastructure
and submitted in partial fulfillment of the requirements for the degree of
Master of Applied Science (Civil Engineering)
complies with the regulations of the University and meets the accepted standards with respect to
originality and quality.
Signed by the final examining committee:
______________________________________ Chair
Dr. M. Nik-Bakht
______________________________________ Examiner
Dr. L. Amador
______________________________________ Examiner
Dr. S. Rakheja
______________________________________ Supervisor
Dr. T. Zayed
Approved by ________________________________________________
Chair of Department or Graduate Program Director
________________________________________________
Dean of Faculty
Date ________________________________________________
Page 3
Page iii
ABSTRACT
The condition of railway infrastructure, such as rails, ballasts and sleepers, should always
be monitored and analyzed to ensure ride safety and ride quality for both passengers and freight.
Railway infrastructure is hard to assess and monitor in terms of its condition due to various types
of infrastructure components. The existing condition assessment models are mostly limited in
terms of the components and/or the techniques when several models focus only on the
assessment of track geometry condition. A few other condition assessment models evaluate the
structural condition of the railway infrastructure by considering one component or utilizing one
inspection technique. Therefore, a comprehensive condition assessment tool should be developed
to cover the numerous railway infrastructure components. Different inspection techniques are
also needed to ensure the safety and quality of public services.
This research aims at developing a defect-based condition assessment model of railway
infrastructure. This model attempts to cover the structural and geometrical defects associated
with the different components of railway infrastructure. The defects of each component are
identified and examined through literature and by experts in the field. Two main sets of input are
used to develop the model: (1) the relative weights of the importance of components, defects and
their categories, and (2) defects severities. To obtain the relative importance weights, the
Analytic Network Process (ANP) technique is adopted, considering the interdependencies
between the components and their defects. Fuzzy logic is used to unify all the different defect
criteria and to translate the linguistic condition assessment grading scale to a numerical score.
Furthermore, the weighted sum mean is used to integrate both the weights and severities to
Page 4
Page iv
determine the conditions and to evaluate the overall condition of the railway infrastructure. The
required data for the present research is collected from railway condition classification manuals,
literature and questionnaires distributed to professionals across Canada. The fruit of this fusion is
also presented in a user-friendly automated tool using EXCEL. The developed model gives a
detailed condition of the railway infrastructure by representing a three-level condition state,
starting with representing the condition of the individual defect categories of components, the
condition of the components themselves and an overall condition that describes the railway
infrastructure. The developed model is implemented in two case studies from Ontario, Canada.
The model output results for the case studies and the experts’ decision are compared, with
similar results, indicating the reliability of the developed model. This model helps in minimizing
the inaccuracy of the railway condition assessment through the application of severity,
uncertainty mitigation and robust aggregation. It also benefits asset managers by providing the
detailed condition of railway components, defect categories and overall condition for
maintenance, rehabilitation and budget allocation purposes.
Page 5
Page v
ACKNOWLEDGEMENTS
I would like to first thank GOD for granting me the health, peace, and wellness required to
complete this course of study.
I wish to express my sincere appreciation and gratitude to my supervisor Professor Tarek Zayed
for his continuous support, patience, motivation, and endless encouragement along this
program of study. I would also like to thank Dr. Zayed for the inspirational knowledge and
awareness that I have gained by working under his supervision, and for believing in me and
trusting my capabilities in fulfilling the objectives of this program. Without his guidance and
persistent aid, the completion of this thesis would not have been possible.
In addition, I would like to thank the Faculty of Engineering and Computer Science in general,
and the Department of Building, Civil, and Environmental Engineering in Concordia University
for all the provided help and guidance. Moreover, I would like to acknowledge Canarail
Company for their support and collaboration. It was a pleasure for me to work alongside with
Canarail.
It is my deepest pleasure to thank the two persons who always strived to make me an educated
professional. I will always be indebted to my beloved parents (Professor Mohammed El-khateeb
and Sawsan Makhadmeh).Without your support and blessings, I would have never been able to
attain this accomplishment. .
Finally, I would like to thank all my friends, colleagues, and beloved ones who assisted and
supported me throughout this program. I appreciate your consistent help.
Page 6
Page vi
TABLE OF CONTENTS
ABSTRACT ................................................................................................................................... iii
1 CHAPTER I: INTRODUCTION ............................................................................................... 14
1.1 Overview ............................................................................................................................. 14
1.2 Problem Statement ............................................................................................................... 15
1.3 Research Objectives ............................................................................................................ 16
1.4 Research Methodology ........................................................................................................ 16
1.5 Thesis Organization ............................................................................................................. 19
2 CHAPTER II: LITERATURE REVIEW .................................................................................. 21
2.1 Overview ............................................................................................................................. 21
2.2 Railway Infrastructure Inspection Techniques .................................................................... 21
2.2.1 Visual Inspection ........................................................................................................... 21
2.2.2 Camera Inspection ......................................................................................................... 22
2.2.3 Track Geometry Cars .................................................................................................... 22
2.2.4 Ultrasonic ...................................................................................................................... 22
2.2.5 LIDAR ........................................................................................................................... 23
2.2.6 Ground Penetrating Radar (GPR) ................................................................................. 23
2.2.7 Laser Crack Measurement System (LCMS) ................................................................. 23
2.3 Railway Infrastructure Manuals .......................................................................................... 24
2.3.1 AREMA ........................................................................................................................ 24
Page 7
Page vii
2.3.2 FRA ............................................................................................................................... 25
2.3.3 Canada Track Safety Standards..................................................................................... 25
2.3.4 RailCorp Engineering Manual ...................................................................................... 25
2.4 Previous Research on Railway Infrastructure ..................................................................... 26
2.5 Multi-Criteria Decision-making .......................................................................................... 34
2.5.1 The Analytic Network Process ...................................................................................... 34
2.5.2 The Fuzzy Set Theory ................................................................................................... 36
2.5.3 Weighted Sum Model.................................................................................................... 38
2.6 Summary and Limitations of Previous Research Works ..................................................... 39
3 CHAPTER III: RESEARCH METHODOLOGY ..................................................................... 41
3.1 Overview ............................................................................................................................. 41
3.2 Data Collection .................................................................................................................... 43
3.3 Model Development ............................................................................................................ 43
3.3.1 Weight Determination via the Analytic Network Process (ANP)................................. 44
3.3.2 Defect Severity Quantification ...................................................................................... 44
3.3.3 Condition Assessment Model........................................................................................ 46
3.3.4 Model Testing ............................................................................................................... 48
3.4 Railway Condition Assessment Automated Tool ................................................................ 48
3.5 Summary .............................................................................................................................. 49
4 CHAPTER IV: DATA COLLECTION ..................................................................................... 50
Page 8
Page viii
4.1 Introduction ......................................................................................................................... 50
4.2 Components, Defect Categories and Defects ...................................................................... 50
4.2.1 Rail Defects ................................................................................................................... 51
4.2.2 Sleeper (Tie) Defects ..................................................................................................... 53
4.2.3 Ballast Defects............................................................................................................... 55
4.2.4 Track Geometry Defects ............................................................................................... 56
4.2.5 Insulated Rail Joints Defects ......................................................................................... 57
4.3 Weight Data Collection ....................................................................................................... 58
4.3.1 Questionnaire Response Statistics ................................................................................. 59
4.3.2 Questionnaire Analysis ................................................................................................. 61
4.4 Defect Severities .................................................................................................................. 61
4.5 Case Studies ......................................................................................................................... 64
4.5.1 Case Study 1 .................................................................................................................. 64
4.5.2 Case Study 2 .................................................................................................................. 65
4.6 Summary .............................................................................................................................. 67
5 CHAPTER V: MODEL IMPLEMENTATION ........................................................................ 68
5.1 Introduction ......................................................................................................................... 68
5.2 Model Hierarchies ............................................................................................................... 68
5.2.1 Railway Infrastructure Defects Hierarchy..................................................................... 69
5.3 Weights (W) ........................................................................................................................ 71
Page 9
Page ix
5.4 Defect Severity (S) .............................................................................................................. 75
5.4.1 Severities Quantification ............................................................................................... 79
5.5 Defect-based Condition Assessment Model ........................................................................ 81
5.5 Model Implementation to Case Study and Validation ......................................................... 81
5.5.1 Case Study 1 .................................................................................................................. 82
5.5.2 Case Study 2 .................................................................................................................. 82
5.6 Sensitivity Analysis ............................................................................................................. 83
6 CHAPTER VI: CONDITION ASSESSMENT AUTOMATED TOOL ................................... 86
6.1 Introduction ......................................................................................................................... 86
6.2 Data Base ............................................................................................................................. 86
6.3 Automated Condition Assessment Model ........................................................................... 87
6.4 Summary .............................................................................................................................. 94
7 CHAPTER VII: CONCLUSIONS AND RECOMMENDATIONS ......................................... 95
7.1 Research Overview .............................................................................................................. 95
7.2 Research Conclusions .......................................................................................................... 96
7.3 Research Contributions........................................................................................................ 98
7.4 Research Limitations ........................................................................................................... 98
7.5 Future Work Recommendations .......................................................................................... 99
7.5.1 Enhancements................................................................................................................ 99
7.5.2 Extensions ................................................................................................................... 100
Page 10
Page x
REFERENCES ........................................................................................................................... 101
APPENDICEIES......................................................................................................................... 106
Page 11
Page xi
LIST OF TABLES
Table 2-1 Severity levels .............................................................................................................. 27
Table 2-2 Condition Assessment Scale for Uzarski 1993 ............................................................ 28
Table 2-3: Pairwise Comparison - Saaty's Fundamental Scale ..................................................... 35
Table 2-4: Average random consistency index (R.I.) ................................................................... 36
Table 3-1: Railway Track Defects Severity levels ....................................................................... 45
Table 4-1: Rail Internal defects ..................................................................................................... 52
Table 4-2: Rail Surface Defects .................................................................................................... 52
Table 4-3: Rail Wear Defects ....................................................................................................... 53
Table 4-4: Sleeper Condition Defects ........................................................................................... 54
Table 4-5: Ballast Profile Defects ................................................................................................. 56
Table 4-6: Drainage Defects ......................................................................................................... 56
Table 4-7: Geometry Defects ........................................................................................................ 57
Table 4-8: Insulated Rail Joints Defects ....................................................................................... 58
Table 4-9: Questionnaire Statistics ............................................................................................... 60
Table 4-10 Sleepers to Insulated Rail Joints Comparison Statistics ............................................. 61
Table 4-11: Railway Track Defects Severity levels ..................................................................... 63
Table 5-1 Railway Infrastructure Defects Hierarchy .................................................................... 70
Table 5-2 Weight Determination .................................................................................................. 74
Table 5-3: Condition Assessment Scale ....................................................................................... 76
Table 5-4: Rails Defects Severities at speed 20 km/hr ................................................................. 77
Table 5-5: Rails Defects Severities at speed 40 km/hr ................................................................. 78
Page 12
Page xii
Table 5-6: Limits of the fuzzy process Severity Levels ............................................................... 80
Table 5-7: Conditions of Case Study Number One ...................................................................... 82
Table 5-8: Condition of Case Study Number 2 ............................................................................ 83
Table 6-1 Example From the Database ......................................................................................... 90
Page 13
Page xiii
LIST OF FIGURES
Figure 1-1: Research Methodology Flow Chart ........................................................................... 18
Figure 2-1 Broken Rail Causes ..................................................................................................... 31
Figure 2-2 Frequency of accident cause and train derailments, 2001–2010................................. 32
Figure 2-3: Typical Fuzzy Process Output. .................................................................................. 38
Figure 3-1: Research Methodology Flow Chart ........................................................................... 42
Figure 4-1: Types of Data Collected ............................................................................................. 50
Figure 4-2 Online Survey Sample................................................................................................. 59
Figure 4-3 Years of Experience of Respondents Distribution ...................................................... 60
Figure 4-4 Case 1 photos of Different Segments ......................................................................... 65
Figure 4-5 Case 2 Photos Describing Deferent Segment of The Track ........................................ 66
Figure 5-1: Railway infrastructure Hierarchy ............................................................................... 69
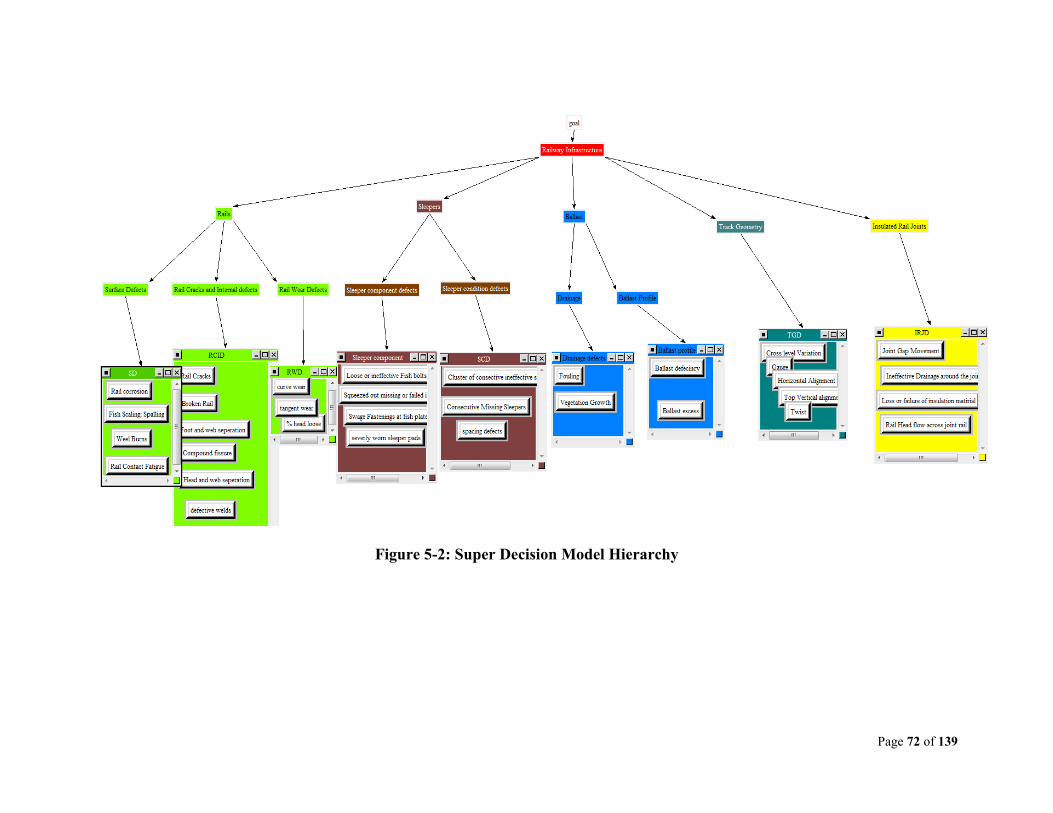
Figure 5-2: SuperDecision Model Hierarchy ................................................................................ 72
Figure 5-3 Case 1 Sensitivity Analysis ......................................................................................... 84
Figure 5-4 Case 1 Sensitivity Analysis ......................................................................................... 85
Figure 6-1 Automate Tool Flow Chart ......................................................................................... 89
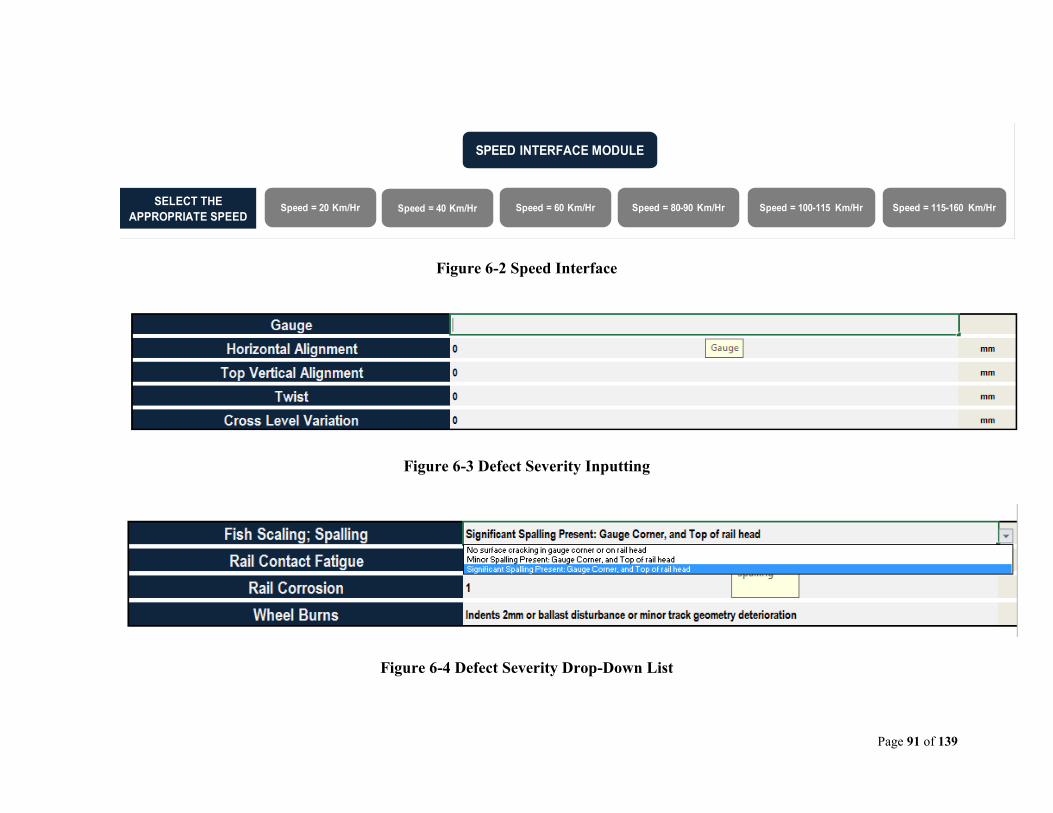
Figure 6-2 Speed Interface ............................................................................................................ 91
Figure 6-3 Defect Severity Inputting ............................................................................................ 91
Figure 6-4 Defect Severity Drop-Down List ................................................................................ 91
Figure 6-5 Condition Assessment Interface .................................................................................. 93
Page 14
Page 14 of 139
1CHAPTER I: INTRODUCTION
1.1 Overview
A solid infrastructure contributes to the improvement of economy and the development of
civilizations. As part of city infrastructure, railways play a pivotal role in the transportation of
both passenger and goods. Besides, railways are one of the most economical modes of
transportations due to their energy efficiency. Railway infrastructure is a collection of different
components from different types of materials such as rails, sleepers (ties), ballast, insulated rail
joints and rail connections such as tie plates and anchors. Railway infrastructure is always under
continuous loading, high-speed trains, severe weather condition, etc. These factors are liable to
defects, which can gradually propagate and cause major failures in the railway system – leading
to safety concerns, delays and economic losses. According to the United States Federal Railroad
Administration Office of Safety Analysis, track defects are the second major cause of accidents
on railways in the US. The first major cause of railway accidents is attributed to human error
(FRA, 2005). The poor management decisions about rail accidents, caused by the lack of rail
inspection, are significant, are not reported by FRA, but only by the National Transportation
Safety Board (NTSB). Therefore, railway infrastructure should be always monitored and
maintained to avoid major problems. Railway infrastructure maintenance is costly given that it is
equipment-oriented. Besides, the continuous demand for higher speed trains and heavier axle
loads and tonnage makes it even more challenging to keep the tracks in good condition – calling
for building new practices.
A wide range of railway infrastructure inspection techniques has been used to investigate the
condition of the track. The common practice for conducting railway infrastructure investigation
Page 15
Page 15 of 139
nowadays is using the ultrasonic, track recording cars and laser scanners. The main inspection
technique used in railways is visual inspections done by experts to assess the track condition.
Condition assessment is a necessary part of asset management and it is of paramount importance
to guarantee the accuracy, credibility and efficiency of the assessment as decisions are taken
accordingly. Most railway infrastructure condition assessment techniques available in the market
are limited either in terms of components or techniques, resulting in an incomplete representation
of the railway infrastructure condition. Therefore, there is a need for a comprehensive, robust,
and standardized railway infrastructure condition assessment model that represents the effect of
the defects in an objective and credible manner.
1.2 Problem Statement
Railway Infrastructure had a GPA of C+ stated by the ASCE report card issued in 2013
(Herrmann and Andrew W 2013). Railways are experiencing an increasing demand, as both an
energy-efficient freight transportation option and a viable city-to-city passenger service.
Railways transport 43% of the US intercity freight and about one-third of U.S. exports (e.g.,
wheat and coal). Railroad freight tonnage growth is estimated to increase up to 22% by 2035,
rising from 12.5 billion tons to 15.3 billion tons. Passenger railways have also an increasing
demand, as the 2012 statistics shows an increase of 20% in the number of passengers since 2000,
with an annual increase of 468 million passengers. Maintaining adequate infrastructure
conditions to keep up with the expanding passenger and freight needs is a challenge in creating a
competitive railway transportation system. Since 1980s, $500 billion have been spent on railway
infrastructure. Capital investment includes maintaining, upgrading and adding tracks to the
existing infrastructure (Herrmann and Andrew W 2013). Railway infrastructure is a mix of
various components, each made of different types of material. A large number of defects
Page 16
Page 16 of 139
however are associated with those various components. The condition assessment models are
limited. Some assess railway track geometry condition individually and a few evaluate the
structural condition of the tracks. They exclusively use the visual inspection evaluation of the
track and are limited to certain types of tracks (Sadeghi and Askarinejad 2011). A lot of
inspection technologies are used for the railway infrastructure inspection. They are however
expensive and not well interpreted, making track assessment a hard and time-consuming process.
Different variables such as train speeds, axle load, etc. affect the integrity of the railway
infrastructure. Defect measurements and assessment criteria vary as well due to the different
nature and types of material of the railway infrastructure components.
1.3 Research Objectives
The main objective of this research is to create a comprehensive railway assessment model that
tackles uncertainty in the other models. The sub-objectives can be summarized as follows:
Identify the condition assessment criteria of various railway components.
Analyze the factors that affect the railway infrastructure deterioration.
Develop a defect-based condition assessment model for railway infrastructure.
Build a condition grading scale for all the railway components.
Establish an automated tool for the developed railway infrastructure condition assessment
model.
1.4 Research Methodology
The aim of this research is to create a comprehensive railway infrastructure condition assessment
model that covers the limitations of the previously developed models. To develop this model, the
Page 17
Page 17 of 139
literature on the previously developed models, condition assessment manuals, experts’ opinions,
available mathematical tools and decision-making methods have been reviewed. Figure 1.1
represents the research methodology flow chart. In terms of thesis organization, this research
starts with literature review, studies the collected data, then goes through the model development
and finalizes its outcome with the credibility testing of the developed model.
The following steps describe the research methodology in details:
The work done on railway infrastructure condition assessment are reviewed.
The different defects, defect categories and components that occur in railway
infrastructure are determined.
A hierarchy of the defects and their categories with respect to their components are
described.
The severity levels and the condition assessment grading scales are defined.
The relative weights of various components, defect categories and defects are determined
using the Analytical Network Process (ANP).
Aggregating the severities and the weights for the components, defects categories and
defects to define the condition using Weighted Sum Mean (WSM) Technique
A detailed condition assessment model that would tie condition scores to protective and
proactive actions is developed.
Page 18
Page 18 of 139
Start
Data collection
Defects types
(Litriture)
Defects weights
(ANP)
Defects severities
(Specifications)
Literature
Review
Condition
Assessment
Model
Model
Implementation
END
Automated Tool
Figure 1-1: Research Methodology Flow Chart
Data were collected from various manuals for defect types and categories determination and a
survey was developed and distributed to gather experts’ opinions for the relative importance
weights of the defects, defect categories and the components. The developed tool was applied to
two case studies provided by Canarail Company, the results of the implementation were
Page 19
Page 19 of 139
compared with those of the provided cases. In conclusion, an advanced spreadsheet was
developed to visualize the model capabilities and create a user-friendly interface.
1.5 Thesis Organization
This thesis consists of six chapters, best summarized as follows:
Chapter I introduces the thesis topic with an overview of the subject. It discusses the importance
of railway history, maintenance, statistics, inspection techniques and available practices. Then,
the problem is stated and the research objectives are set. Moreover, a brief workflow of the
research is provided to show where the research is heading.
Chapter II includes a summary of the reviewed literature, serving as a background to build this
model. It reviews the main inspection technologies used in the condition assessment of the
railway infrastructure as well as the manuals used in railway asset management. Moreover, it
reviews the previous research in the field of railway condition assessment. Finally, it summarizes
the multi-criteria decision making (MCDM) techniques to develop the model.
Chapter III provides a detailed explanation of the research model. The railway infrastructure
components, defects and their categories are discussed. After that, a verified defect hierarchy is
created and presented. Then, the fuzzy membership model to transform the linguistic assessment
into a numerical one is presented. The condition assessment is defined using the Australian
standards. Additionally, the Analytic Network Process in collaboration with the Weighted Sum
Model Approach is used for aggregation purposes and to determine a crisp value that represents
the whole asset.
Page 20
Page 20 of 139
Chapter IV delivers the data collection methodology. Three data types are collected for this
research: 1. Defect types, collected by using the existing manuals; 2. Components and defect
weights, collected through a survey (conducted both on-line and in hard copy and distributed to
experts); 3. Defect severities, collected from available manuals.
Chapter V illustrates the model development and the implementation of different adopted
techniques. Firstly, the model hierarchy is presented and the main two sets of input, the weights
and the severities are defined. Then, the aggregation and the model development are provided.
Finally, two case studies are used to validate the developed model.
Chapter VI describes the developed automated tool. It also visualizes the features and
capabilities of the automated tool in terms of input and output. Finally, it contains some
screenshots of the user-friendly automated tool and some other visualization reports issued by
the automated tool.
Chapter VII wraps up the thesis with research conclusions and outcomes. In addition, it
summarizes the main research contributions to both industry and academic fields. Finally, it sorts
out the research limitations and provides some recommendations as a direction for future
researchers.
Page 21
Page 21 of 139
2CHAPTER II: LITERATURE REVIEW
2.1 Overview
This chapter summarizes the extensive literature review for railway asset management. The main
inspection techniques used in the field of railway condition assessment are first highlighted. The
main railway infrastructure manuals and specifications are reviewed for a better understanding of
railway system. This chapter also summarizes the previous similar researches and the Multi-
Criteria Decision Making techniques employed in the model development.
2.2 Railway Infrastructure Inspection Techniques
Several inspection techniques are used in condition assessment, each with its usages, advantages,
disadvantages and technical challenges. Railway infrastructures are a mix of different
components from different materials, requiring different technologies to asses each. Most of the
railway inspections are visual inspections done by experts. This technique is expensive and time-
consuming. Along with visual inspection, other techniques such as ultrasonic and laser
technologies are used.
2.2.1 Visual Inspection
Visual inspection is one of the most used techniques today. Visual inspection is done by experts
while walking along the tracks, searching for defects and recording them in inspection sheets.
This method costs a lot of money and time. An average of 10 km of track per day is inspected by
this technique. (Esvald 2001)
Page 22
Page 22 of 139
2.2.2 Camera Inspection
The idea of automated visual systems is based on the use of high-speed cameras capable of
gathering video images of the railway infrastructure as they move over it. The captured images
are analyzed automatically by a special image analysis software. Software analysis is done by the
identification of components or defects detected by cross-correlation techniques while the data
are classified in a supervised learning scheme. The speed of operation can vary from 60 km/h to
320 km/h, depending on the nature of the inspection. The camera inspection does not gather any
internal defects (Barragan et al. 2011).
2.2.3 Track Geometry Cars
Track geometry defects are the main reason for high dynamic forces developing between the
train and the rails. A track geometry car, also known as a track recording car, is an automated
track inspection vehicle to inspect the track for any geometrical defects without obstructing
normal railroad operations. Some of the measured parameters are position, curvature, gauge,
alignment of the track and cross-level variation. The cars use a variety of sensors and measuring
systems to create a profile of the track with the corresponding defects. Track recording cars can
speed up to 200 km/h. (Grassie 2008)
2.2.4 Ultrasonic
Ultrasonic inspection was introduced to railway industry in 1927 by Dr. Elmer Sperry who built
a massive rail inspection car for the American Railway Association. Ultrasonic works by
transmitting a beam of ultrasonic energy into the rails. The reflected energy from the transmitted
ultrasonic beam is then collected by transducers. The amplitude of the collected reflections can
provide information regarding the state of the rails. Ultrasonic shows high accuracy of 90-95%.
The speeds of up to 65km/h, however, are operated at 45km/h for safety and accuracy reasons.
Page 23
Page 23 of 139
This technique has limitations in highly cold weather conditions when ice interferes with the
testing (Seringlion 2005). Heavy lubrication can affect results by producing an intervening
interface (Esvald 2001) (Ph Papaelias et al. 2008)
2.2.5 LIDAR
LIDAR technology has been applied to the railway industry to measure and map the surface of
the track and the ballast profile in particular. LIDAR (Light Detection and Ranging or Laser
Imaging Detection and Ranging) technology uses optical remote sensing technology that
measures the distance or other properties of targets by using laser light and analyzing the
reflected light. Georgetown Rail Equipment Company (GREX) created the BallastSaver system,
which is a LIDA- based track inspection system inspecting the railway infrastructure at a speed
up to 20 mph and calculating ballast deficiencies along tracks of any desired length. (Zarembski
2013)
2.2.6 Ground Penetrating Radar (GPR)
GPR technique has been used in railways to inspect the Ballast, which uses radar pulses to image
the substructure of the track (Ballast) and to map the bottom of the ballast and top of the
subgrade sections of the track structure. The GPR assesses the foul ballast conditions and
drainage problems hidden beneath the ballast surface as well as air voids, water inclusions and
other cases of inhomogeneity (Esvald 2001). GPR antennas are attached to hi-rail cars and can
assess tracks with speeds up to 180km/hr.
2.2.7 Laser Crack Measurement System (LCMS)
Laser Crack Measurement System (LCMS) Inspection Technique uses two high-performance 3D
laser profilers that can measure complete transverse railway infrastructure profiles with 1mm
resolution at high speeds. LCMS is economical and can be readily mounted on a hi-rail vehicle
Page 24
Page 24 of 139
owned by every rail transit agency (Metari 2013). Based on a 3D map generated by LCMS, the
rail gauge can be measured, detecting missing or broken fasteners and identifying cracks in
concrete ties.
2.3 Railway Infrastructure Manuals
The inspection of railway infrastructure is a primary task in the process of condition assessment
of the assets and planning maintenance programs. Condition assessment is used in the decision-
making process and in setting maintenance and rehabilitation to extend the service life of the
assets. Therefore, several manuals and codes have been generated by different countries and
companies to attain this goal. Manuals describe the inspection methods, defects, defect limits and
safety standards that should be taken into consideration for maintaining the safety of the goods
and passengers. The manuals such as the American Railway Engineering and Maintenance-Of-
Way Association (AREMA) (AREMA 2010), Transport Canada Track Safety Regulations
(Transport Canada 2012), the US Federal Railway Administration (FRA) (Office of Railroad
Safety 2014), and RailCorp Engineering Manual — Track from Australia have been carefully
reviewed (Wilson, 2011).
2.3.1 AREMA
American Railway Engineering and Maintenance-Of-Way Association (AREMA Manual)
consists of data, plans, principles and economic practices of engineering, design and construction
of railways (AREMA 2010). This manual is developed by AREMA technical committees in the
US. The AREMA Manual cannot be used as a maintenance manual since the development of
standards or criteria for the maintenance of railways, roads, tracks and structures has always been
considered the prerogative of individual railways, based on the nature and characteristics of their
Page 25
Page 25 of 139
plants and operations as well as the specific characteristics of the geographical region(s) where
they operate.
2.3.2 FRA
Federal Railroad Administration Manual developed by the Office of Railroad Safety at the US
Department of Transportation consists of design aspects, inspection techniques and defects that
occur; it also includes the safety standards of railways (Office of Railroad Safety 2014). The
manual consists of minimum safety standards and cannot be used for maintenance issues.
2.3.3 Canada Track Safety Standards
Transport Canada Track Safety Manual includes the safety standards of the tracks, the defects
that occur in the railway infrastructure and the inspection techniques approved by the Ministry of
Transport, Infrastructure and Communities. The manual describes the minimum safety standards
that describe the maximum severity levels for the defects. This manual cannot be used for
maintenance purposes (Transport Canada 2012).
2.3.4 RailCorp Engineering Manual
RailCorp in Australia developed a collection of manuals for the different components, inspection
technique defects, maintenance techniques and designs for railway infrastructure. The different
manuals are available online under the name of TMC manuals. These manuals are adopted for
and are mostly used in this research to define the defects and the defect severities. The two most
used manuals are TMC 203 Track Inspection (Wilson 2013) and TMC 224 Rail Defects and
Testing (Wilson, 2011). TMC 203 Track Inspection consists of requirements, processes and
guidelines for the management of track assets and inspection activities. It also provides operating
limits for track condition measurements and required mandatory actions when the limits are
Page 26
Page 26 of 139
reached. The TMC 224 Rail Defects and Testing manual describes the rail defects, rail defect
limitations and inspection techniques for the rail assessments.
2.4 Previous Research on Railway Infrastructure
Previous researches have been reviewed for a better understanding of the asset management of
railway infrastructure, condition assessment, maintenance planning, etc. The following two
works summarize the researches on condition assessment from the structural point of view, the
assessment of the components, rails, sleepers, ballast, etc. Sadeghi and Askarinejad (2011) have
developed a quality index to assess the structural condition of the track based on the visual
inspection technique. The tracks are divided into four components, i.e. rails, ballast, sleepers and
fasteners. The weighted deduction density model was adopted to develop the quality index for
each component of the track. So, four indices are developed: rail quality index (RQI), ballast
quality index (BQI), sleepers quality index (SQI) and fasteners quality index (FQI); and the
overall condition is track quality index (TQI). The indices are based on the defects and their
severities. Table 2-1 illustrates the three severity levels (low, moderate and high) and their
descriptions used in the indices, where low represents a good track condition with minimum
defects, moderate represents defects that may or may not cause any operation restrictions or
delays and high represents defects that cause operating restrictions on the track, preventing train
operation and causing safety concerns. To organize the maintenance actions, the track line is
divided into management sections and the management sections are further divided into
segments to aid in the evaluation of structural conditions by the visual inspection of the selected
segments (Sadeghi and Askarinejad 2011). The report developed by the US Army for railway
infrastructure condition assessment is a development of condition indices for low volume
railroad tracks. Table 2-2 illustrates the scale used in all the indices where the scale ranges from
Page 27
Page 27 of 139
0 to 100 and is divided into seven condition categories from excellent (85-100%) to failed level
(0-10%). The excellent level is for very few defect presence, when the track function is not
impaired and no immediate work action is required, but routine or preventive maintenance could
be scheduled for accomplishment. The failed level shows extreme deterioration throughout
nearly all or the entire track, when track is no longer functional and major repair, complete
restoration or total reconstruction is required. Several indices are developed to describe the
condition of each component in the railway infrastructure. Weighted Deduct-Density Model has
been utilized to develop the following indices: Rail and Joints Condition Index (RJCI), Tie
Condition Index (TCI), Ballast and Subgrade Condition Index (BSCI) and the aggregated
condition index of the components indices is Track Structure condition Index (TSCI), the TSCI
was developed using regression technique (Uzarski 1993).
Table 2-1 Severity Levels (Sadeghi and Askarinejad 2011)
Severity level Description
Low Distresses that do not affect train operation
Moderate Distresses that may or may not cause an operating restriction on
the track
High Distresses that cause operating restrictions on the track and may
prevent train operation
Page 28
Page 28 of 139
Table 2-2 Condition Assessment Scale for Uzarski 1993
Category index Condition Description
Excellent 100 - 85 Very few defects. Track function is not impaired. No immediate
work action is required, but routine or preventive maintenance
could be scheduled for accomplishment.
Very Good 70 - 85 Minor deterioration. Track function is not impaired. No immediate
work action is required. But, routine or preventive maintenance
could be scheduled for accomplishment.
Good 55 - 70 Moderate deterioration. Track function may be somewhat
impaired. Routine maintenance or minor repair may be required.
Fair 40 - 55 Significant deterioration. Track function is impaired, but not
seriously. Routine maintenance or minor repair is required.
Poor 25 - 40 Severe deterioration over a small percentage of the track. Less
severe deterioration may be present in other portions of the track.
Track function is seriously impaired. Major repair is required.
Very Poor 10 - 25 Critical deterioration has occurred over a large percentage or
portion of the track. Less severe deterioration may be present in
other portions of the track. Track is barely functional. Major repair
or less than total reconstruction is required.
Failed 0 -10 Extreme deterioration has occurred throughout nearly all or the
entire track. Track is no longer functional. Major repair, complete
restoration, or total reconstruction is required.
Here, the condition assessment is discussed from a geometrical point of view. Madejski and
Grabczyk (2002) have developed the five-parameter defectiveness (W5), a parameter to assess the
geometrical condition of the track. The parameter is a result of the aggregation of the 5
parameters, each representing one of the five geometrical defects, i.e. twist, horizontal deviation,
gauge, vertical alignment and the cross level variation defectives. Each parameter is a ratio of the
Page 29
Page 29 of 139
sum of the length when the acceptable limits for the defects are exceeded by the total length of
the section. The evaluation data can be gathered by the geometry track measurements done by
the manual equipments, microprocessor-based portable instruments and geometry recording cars
(Madejski and Grabczyk 2002). Indian Railway defines the assessment of the geometrical
condition of the track by the Track Geometry Index (TGI), using the standard deviation of the
geometrical defects (Mundrey 2003). Polish Railways highlights the frequency of track
inspection, using the geometry cars. It states that the inspection should take place as minimum as
twice a year and the frequency changes with the degree of curvature. For example, curves with a
radius less than 350m should be inspected at least three times a year. Also, Polish Railways
developed a synthetic track quality coefficient (J) to assess the geometry condition. The standard
deviation is firstly used as a basic measurement for different geometry defects and the J-
coefficient is a result of the average value of the standard deviations of the defects (Madejski and
Grabczyk 2002). Swedish National Railway has developed a quality Q index to define the
geometry condition of the track. The standard deviation of the left and right profiles of the track
and the geometry defects are used to assess these components. The condition is defined by
dividing the standard deviation of the existing condition over the allowable value of the standard
deviation based on track categories (Anderson 2002). Sadeghi and Askarinejad (2012) have
developed a methodology to correlate between the tracks’ structural conditions and the data
obtained from the automated inspections such as the track recording cars used to inspect the
track geometry condition. The neural network is employed to explore relationships between the
geometry data and the track structural defects to develop a model that predicts track structural
conditions by using the geometry recording cars without the need for visual inspection to save
both time and economic losses (Sadeghi and Askarinejad 2012). Ferreira and Murray (1997)
Page 30
Page 30 of 139
highlight the main causes of railway infrastructure deterioration, i.e. dynamic loads, train speed,
axle loads and environmental factors. They also discuss maintenance decision support systems
and maintenance optimization techniques for railway infrastructure (Ferreira and Murray 1997).
Here, some of the researches to enhance and optimize the use of inspection technologies are
reviewed. Li-jun (2009) discusses GPR technology used in the substructure assessments (Ballast
and Subgrade) of railway infrastructure. GPR can be utilized to find borders between the ballast
and the subgrade and it assesses contaminated ballast with fine materials (fouling), moisture
content and subgrade conditions, depending on the frequency of the antenna and data
dispensation techniques. According to Li-jun, the overall excellence of the data gathered by the 2
GHz antennas is more accurate than that of the 400 MHz one. The higher the moisture content of
the ballast, the better for GPR to identify the fouled ballast; and the sampling interval
approximately has no effect on the quality of the GPR data collected when it changes in a small
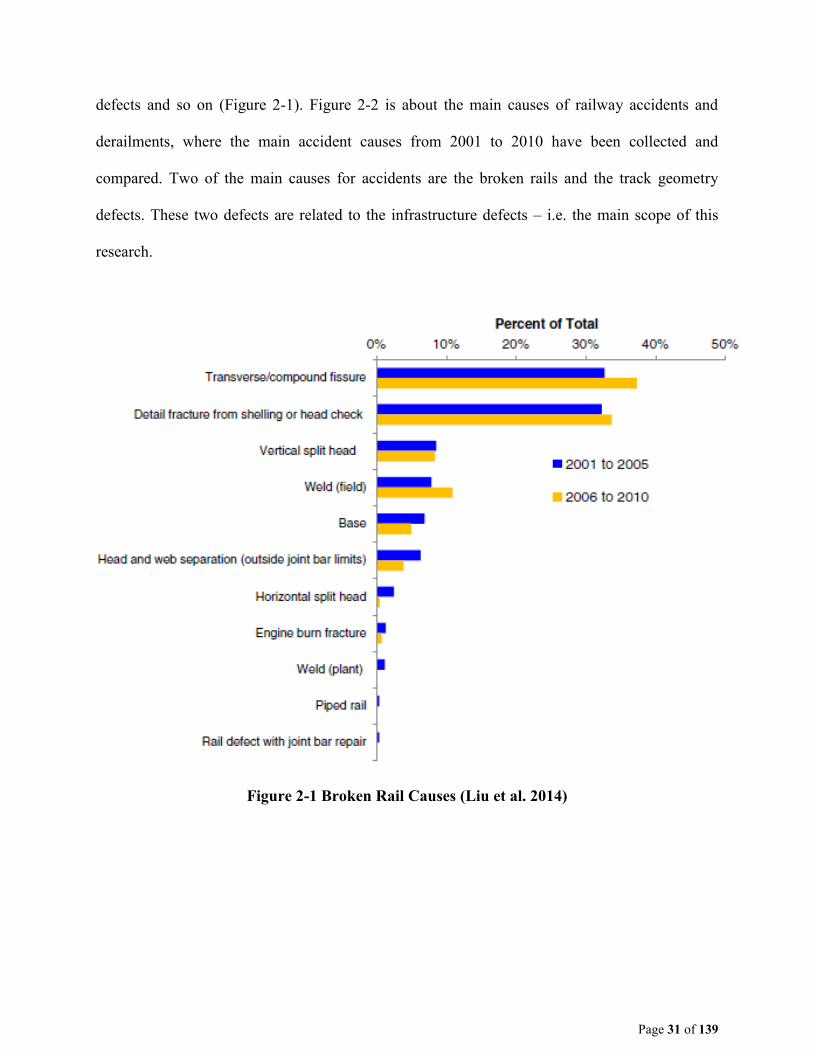
range (Li-jun 2009). Liu et al. (2014) address the development of an analytical model to talk
about the trade-offs between the various factors related to rail defect inspection frequency, to
maximize railway safety and productivity. The results show that the ideal inspection frequency
varies with different reasons such as traffic density, rail age, inspection technology reliability and
other factors. Liu et al. highlight the main causes of railway accidents, i.e. broken rails. They
have also developed models to calculate different costs associated with broken rails, i.e. the costs
of inspection, maintenance and derailments (Liu et al. 2014). Figure 2-1 illustrates the main
causes of broken rails as the main cause of railway accidents (Liu et al. 2014). The main causes
have been found by analyzing the defects for two time intervals: (2001-2005) and (2006-2010).
The analysis gives similar results for the two time intervals, showing that the main cause of this
major defect is the transverse/compound fissure, followed by the fractures caused by surface
Page 31
Page 31 of 139
defects and so on (Figure 2-1). Figure 2-2 is about the main causes of railway accidents and
derailments, where the main accident causes from 2001 to 2010 have been collected and
compared. Two of the main causes for accidents are the broken rails and the track geometry
defects. These two defects are related to the infrastructure defects – i.e. the main scope of this
research.
Figure 2-1 Broken Rail Causes (Liu et al. 2014)
Page 32
Page 32 of 139
Figure 2-2 Frequency of accident cause and train derailments, 2001–2010 (Liu et al. 2014)
Page 33
Page 33 of 139
The researches reviewed below deal with various deterioration models that predict the
degradation of railway infrastructure. Sadeghi and Askarinejad (2010) have developed a
deterioration model that has two formats. One model is developed to predict the geometry
degradation of the track and the other is developed to predict the structural degradation of the
track. The data have been collected and analyzed for over two years, for approximately 100 km
of railway line. The geometric data are collected by the track recording cars and the structural
defects are collected by the visual inspections. The main parameters that influence the chosen
track degradation are the axle loads, track maintenance status, speed and track quality. As the
analysis shows, the geometry conditions of the track have a higher rate of degradation compared
with the structural condition of the track and the tracks in bridges, curve-bridges and turnouts
deteriorate at a higher rate, when compared with straight lines. The collected data in this study
are limited to a speed of 100 km/h while data on materials and environmental factors are not
available. The structural models are also limited to the visual inspection (Sadeghi and
Askarinejad 2010). Zhang et al. (2000) have developed a deterioration model to predict the
structural condition of the track. The model uses different methodologies to predict railway
infrastructure deterioration by using an integrated track degradation model (ITDM) via
mechanistic techniques to predict track degradation. The model is a combination of sub-models
that predict single-part deteriorations i.e. rails, sleepers and ballast. The rail model is developed
to predict wear defects in the rails. The axle loads, the degree of curvature and the hardness of
rail material are chosen as the main factors that affect rail wear. The sleeper model defines
deterioration by the damage intensity factor, the factor that is based on the loading cycles and
environmental factors. The ballast model predicts the settlement that occurs on the track. The
Page 34
Page 34 of 139
model assumption is that the track modulus is a key parameter in predicting track behavior under
passing traffic, affecting track deflections calculations (Zhang et al. 2000).
2.5 Multi-Criteria Decision-making
In infrastructure asset management, a lot of multi-criteria decision-making techniques are used
for a robust decision. The common uses of the decision-making techniques are to combine
technical information with experts’ opinions. These techniques combine data and weights of
several alternatives by aggregating the results of each to reach a single index that would
represent the condition of the asset (Kabir et al. 2014).
2.5.1 The Analytic Network Process
The Analytic Network Process (ANP) technique was developed by Saaty in 1996 as a
development of the Analytic Hierarchy Process (AHP) also developed by Saaty in 1980s
(Görener 2012). The AHP is a multi-decision making technique that uses a pairwise comparison
matrix to result in ratio scales and therefore priorities based on the decision-maker’s judgments
(Büyükyazıcı and Sucu 2003) who provides a hierarchical representation of complicated
decision-making problems. The Analytic Network Process (ANP) is a generalization of AHP,
accounting for interdependencies and interactions between criteria and sub-criteria in which a
hierarchical structure is not a must.
In AHP/ANP, pairwise comparisons between different elements or criteria in the same group are
done by experts’ opinions. The degree of importance of one factor over the other with respect to
a major criterion or a common group is done by judgments from experts or decision-makers. The
ANP method works by organizing the different elements or criteria in hierarchies or feedback
networks. ANP then performs pairwise comparisons between the different components of the
Page 35
Page 35 of 139
problem to define the relative importance weights. After that, an unweighted supermatrix is
created by including the relative importance weight for the different elements and their criteria.
ANP is an extension of the AHP to include the weighted supermatrix, considering the
interdependencies among different elements in the network. Finally, the developed weighted
supermatrix is multiplied by itself until the limit supermatrix is reached where the final local
priorities corresponding to the global ones are attained (Yang et al. 2008). The pairwise
comparison is conducted by distributing a questionnaire. Table 2-3 illustrates Saaty’s (1-9) scale
the questionnaire is developed based on. The scale is 1 to 9 where each number represents a
comparison level. So, 1 represents an equal importance and 9 represents an extreme importance.
The odd numbers represent a level and the even numbers represent an intermediate value.
Table 2-3: Pairwise Comparison - Saaty's Fundamental Scale
Importance Degree of Importance Explanation
Two attributes with equal
1 Equal Importance contribution to the
objective
3 Moderate Importance Judgment slightly favors
one activity over the other
5 Strong Importance Judgment strongly favors
one activity over the other
An activity is favored
7 Very Strong Importance very strongly over
another; its dominance is
demonstrated in practice
The evidence favoring
9 Extreme Importance one activity over the other
is of the highest possible
order of affirmation.
2,4,6,8 Intermediate values that signify (Weak, Moderate Plus, Strong Plus, and (Very, Very Strong).
Reciprocals If activity i is given, one of the above numbers representing its importance over another activity j, then j
has the reciprocal value when compared with i.
Page 36
Page 36 of 139
In performing the pairwise comparison, the reciprocal property in AHP/ANP states that if an
element x is given an importance of “j” when compared to element y, then element y can be
given an importance of 1/j when compared to element x with respect to a common property. In
performing the pairwise comparisons, it is important to check for the consistency property
through calculating the consistency index (CI) and then the consistency ratio (CR) to test the
judgments. The pairwise comparison matrix is said to be consistent if CR is <0.1.
𝐶𝑅 =𝐶𝐼
𝑅𝑎𝑛𝑑𝑜𝑚 𝐼𝑛𝑑𝑒𝑥 …………………………………………………………………………….. (1)
CI =λ−n
n−1 ………………………………………………………………………………………. (2)
where λ is the eigenvalue of the pairwise comparison matrix and n is the matrix size. Table 2-4
shows the average random index values recommended by Saaty, where the random index is a
number related to the size of the matrix. For example, for the matrix with a size of 4, the related
random index is 0.89.
Table 2-4: Average random consistency index (R.I.) (Saaty et al. 2012)
N 1 2 3 4 5 6 7 8 9 10
Random consistency index 0 0 0.52 0.89 1.11 1.25 1.35 1.40 1.45 1.49
(R.I.)
2.5.2 The Fuzzy Set Theory
An extensive variety of real life issues should be solved in an objective manner for trustworthy
results. Such issues, for the most part, include physical procedures that are accompanied by
ambiguity. The fuzzy set theory developed by Zadeh (1965) as a mathematical representation
deals with uncertainties that are not of statistical nature. Since its development, fuzzy decision-
making has been applied to many fields such as civil engineering (Salah 2012).
Page 37
Page 37 of 139
(i) Fuzzy Relations
In an arrangement of data, a traditional set is characterized as one that has certain limits without
uncertainty. Meanwhile, the fuzzy set, introduced by Zadeh (1965), is defined as a set with
ambiguous boundaries due to its uncertain properties. The transition of a component in an
established set is very much characterized. However, the transition of a component in a fuzzy set
is through a membership with a defined function that would depict the uncertainty in the
component's properties. In a fuzzy set, the same component might be a member of another fuzzy
set in a similar universe since there is fragmented data, unlike the classical set in which the
components would have a full membership, i.e. 0 or 1. Some of the standard fuzzy operations are
the combination, intersection and completion of the fuzzy sets.
(ii) Fuzzification and Defuzzification
Fuzzification and defuzzification are two major procedures related to the use of fuzzy sets.
Fuzzification is defined as the process of translating available data from linguistic terms (e.g.
high, low, very low, etc.) into membership functions (Wong and So 1995). However,
defuzzification is defined as the procedure where the aggregated output or the overall
membership functions are translated back into a crisp (non-fuzzy) value, which is the opposite of
fuzzification (Mamdani 1974). Figure 2-3 represents the output of a fuzzy procedure; the output
is the combination of two or more fuzzy memberships. For example, suppose that a fuzzy output
comprises of two components: (1) a trapezoidal membership function shape and (2) a triangular
membership function shape. The combination of these two membership functions is C=C1∪C2.
This combination uses the maximum operator as the outer envelope of the combination of the
two shapes. Also, the output fuzzy membership can be the union of more than two membership
Page 38
Page 38 of 139
functions with shapes other than triangular and trapezoidal but the union procedure is the same
(Ross 2009). After defuzzification, a fuzzy number can be represented by a crisp value.
Figure 2-3: Typical Fuzzy Process Output: (A) First Part of Fuzzy Output; (B) Second Part
of Fuzzy Output; And (C) Union of Both Components (Ross, 2009).
2.5.3 Weighted Sum Model
The weighted sum model (WSM) is one of the best known and simplest multi-criteria decision
analysis (MCDA)/ multi-criteria decision-making technique model (Florian Helff 2016). WSM is
mostly used in multi-objective optimization problems. It works by combining different
objectives and weights related to different alternatives to create a single value or a score for each
alternative to make them comparable. WSM uses the formulas below. In these formulas, the
WSM-score for an alternative Ai denoted as Ai WSM−score is calculated by adding the
multiplications of a weight Wj with its corresponding value aij. This value can be any type of
value, a cost or a severity for a defect. The best alternative will be chosen based on its WSM
score; the highest WSM score (A∗ WSM−score) represents the best alternative.
Page 39
Page 39 of 139
𝐴𝑖𝑊𝑆𝑀−𝑠𝑐𝑜𝑟𝑒 = ∑ 𝑊𝑗𝑎𝑖𝑗
𝑛𝑗=1 ………………………………………………………………….. (1)
𝐴∗𝑊𝑆𝑀−𝑠𝑐𝑜𝑟𝑒 = 𝑚𝑎𝑥𝑖 ∑ 𝑊𝑗𝑎𝑖𝑗
𝑛𝑗=1 …………………………………………………………….. (2)
2.6 Summary and Limitations of Previous Research Works
So far, the various inspection techniques for railway infrastructure inspection have been
discussed. The major manuals for railway asset management and condition assessment are also
reviewed. Moreover, this chapter has summarized the previous research on the condition
assessment of railway infrastructure. It has also referred to several MCDM tools including the
fuzzy set theory, the analytic network process and the weighted sum model, in line with what this
research aims to achieve.
In conclusion, most of the available inspection techniques are assessing individual components
or they assess a certain type of defects and they use expertise and human judgment. Therefore, it
is important to define a condition assessment model that would account for these limitations and
to incorporate the different inspection techniques. Reviewing the different MCDM techniques
shows that the fuzzy synthetic evaluation is an important technique that can be used to uniform
and translate all the different defect severities measuring criteria. Also, the Analytic Network
Process technique is used to determine the weights of different components and defects.
Moreover, the weighted sum model technique has been utilized in many research works and has
been validated. Therefore, it is used in this research as an aggregation tool.
After reviewing the previous condition assessment models and previous academic research,
many limitations have been encountered with regards to the condition assessment of railway
infrastructure. Most of the current models assess the track geometry condition, which is a small
Page 40
Page 40 of 139
part of the various defects and components of the railway infrastructure, relying on one
inspection technique, which is the track recording car. Moreover, the rest of the condition
assessment models are limited to a certain component or a certain type of a track. Some models
use one inspection technique such as GPR to assess the substructure of the tracks or they only
use the ultrasonic to assess only the rail. None of the reviewed works take into consideration the
different speed levels or classes of the railway tracks.
Page 41
Page 41 of 139
3CHAPTER III: RESEARCH METHODOLOGY
3.1 Overview
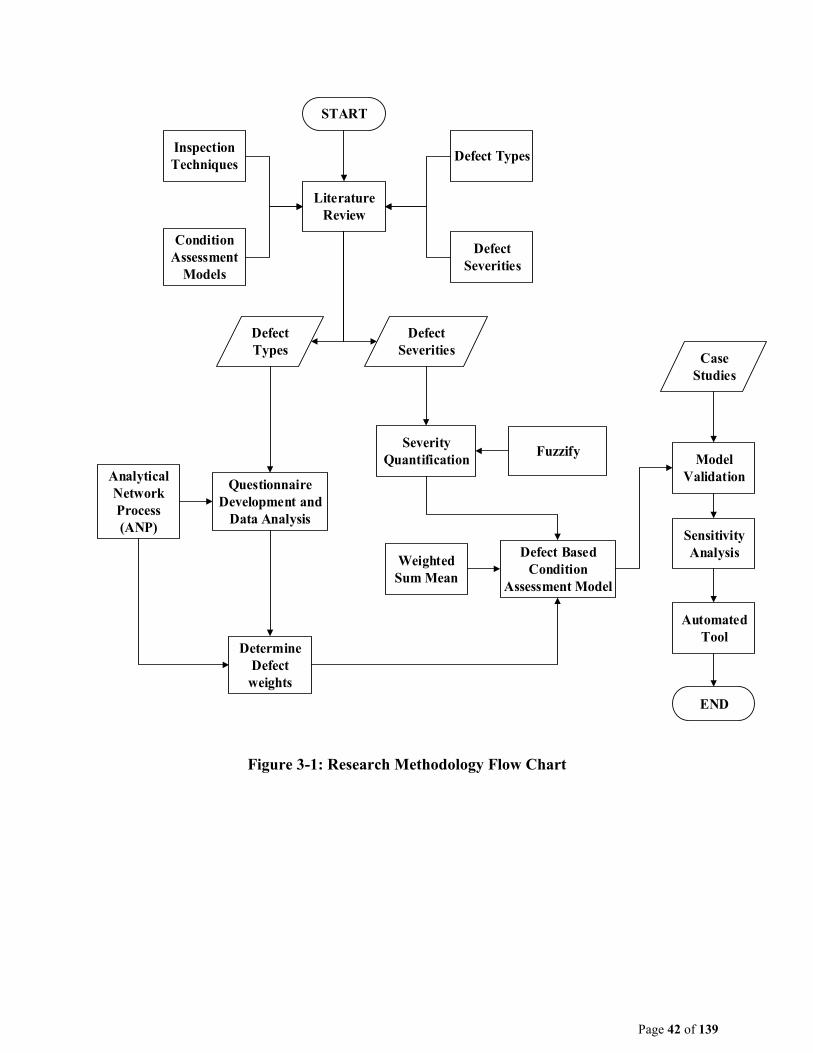
This chapter provides an overview of the research methodology as shown in Figure 3-1. It
consists of the flow chart of the research as well as the used techniques and data resources. The
first type of data in this research is the defects types and their nature and the second type of data
is the defect severities. The third type is the weights of these defects, the components and the
defect categories. This chapter also discusses the model development. The originality of this
work is portrayed in the objective manner of classifying defects and in minimizing uncertainty
through aggregation. Due to the importance of railway transportation in the family of
infrastructures, a comprehensive knowledge of the defects is required for a reliable assessment
algorithm. Therefore, this research explores the defects corresponding to all the railway
infrastructure components in an objective manner to address the subjectivity and uncertainty in
the current condition assessment models.
In this research, railway infrastructure is divided into five main components. It comprises of the
Rails, Sleepers (Ties), Ballast, Track Geometry and the Insulated Rail Joints. The defects in each
component are classified into certain categories, which are created based on the nature of the
defects. Consequently, the relative importance weights of these components, defect categories
and defects are obtained by delivering online and hard copy surveys to experts and professionals
in this area. After obtaining the weights, the defect severities are fuzzified to uniform the
different classifications of defect severities. Finally, both the weights and the severities are
aggregated using the Weighted Sum Mean Technique to result in the desired condition. This
model is finally interpreted into an automated tool.
Page 42
Page 42 of 139
START
Literature
Review
Inspection
Techniques
Condition
Assessment
Models
Defect Types
Defect
Severities
Defect
Types
Defect
Severities
Analytical
Network
Process
(ANP)
Questionnaire
Development and
Data Analysis
Determine
Defect
weights
Severity
Quantification
Defect Based
Condition
Assessment Model
Weighted
Sum Mean
Model
Validation
Case
Studies
Sensitivity
Analysis
END
Fuzzify
Automated
Tool
Figure 3-1: Research Methodology Flow Chart
Page 43
Page 43 of 139
3.2 Data Collection
The first type of collected data is the defects type and their nature. Manuals, books and research
papers are used to collect all the defects encountered in railway infrastructure. A collection of 90
different defects associated with the different components is provided. These defects have been
sent to experts to summarize them and choose the main defects. A collection of 35 defects is
used in building the model. The second data type is the defect severities, for which online and
print manuals, advised by professionals, are reviewed. The third data type is the defect weights,
found based on a questionnaire. This questionnaire has been distributed to engineers in Canada.
Moreover, case studies in the form of inspection sheets are provided by Canarail, the Canadian-
based company.
3.3 Model Development
The developed model contains three sub-models: Analytic Network Process Model (weights),
Fuzzy Synthetic Evaluation Model (severity) and Weighted Sum Mean Model (aggregation). To
build the model, the railway infrastructure is divided into five components (Rails, Sleepers,
Ballast, Track Geometry and Insulated Rail Joint) and the defects associated with these
components are categorized based on the similarities of the defects. The standard Fuzzy
Synthetic Evaluation that comprises both the fuzzification and the defuzzification is adopted to
uniform all the different defect criteria and to translate the linguistic grading scale into numerical
values. The weighted sum mean model is used to aggregate the weights and the severities, in
order to find the desired goals of this research, i.e. to find the condition.
Page 44
Page 44 of 139
3.3.1 Weight Determination via the Analytic Network Process (ANP)
This model is adopted to obtain the weights corresponding to the components, the defects
categories and the defects. The goal is defined as the railway infrastructure in which its overall
condition will be affected by the condition of defects and components. After defining all the
defects and the hierarchy, pairwise comparisons are built in three directions to consider the
interdependencies of the following criteria:
Between the sub-criteria: Defects.
Between the main criteria: Components
Between the main criteria and the goal: Components and the Railway Infrastructure.
The steps below describe the procedure of ANP to find the weights for defect types, their
categories and components.
1. Both online and paper questionnaires are developed based on Saaty’s (1-9) scale shown
in Table 2-3.
2. The questionnaire is distributed to collect experts’ opinions.
3. Each questionnaire is analyzed individually to find the weights corresponding to it, using
the “SuperDecisions” software.
4. An average value is taken in all the questionnaires to find the weights.
3.3.2 Defect Severity Quantification
The defect severities grading scale along with the defect severities used in this research have
been adopted from an Australian manual called Track Inspection TMC 203 (Wilson 2013) and
TMC 224 Rail Defects and Testing (Wilson 2011). A six level condition grading scale is defined
to describe the different levels of the defect severities. Each level has its own planning time for
Page 45
Page 45 of 139
the inspection and the maintenance action. Table 3-1 describes the six levels of defect severities
from normal where the track is in good condition and no maintenance is needed to emergency 1
where the track is in its worst condition and maintenance is needed before the next train passage.
Each level is described and an inspection and maintenance time is recommended.
Table 3-1: Railway Track Defects Severity Levels (TMC 203)
Response Category Inspect and verify response Action
Emergency 1 (E1) Prior to passage of next train Prior to passage of next train
Emergency 2 (E2)
Within 2 hours or before the
next train, whichever is the
greater
Within 24 hours
Priority 1 (P1) Within 24 hrs Within 7 days
Priority 2 (P2) Within 7 days Within 28 days
Priority 3 (P3) Within 28 days Program for repair
Normal (N) Nil Routine inspection
Fuzzy membership functions of defect indicators are applied in this model to uniform the
different defect criteria and to translate the linguistic condition assessment grading scales into
numerical values. This model is developed through the following steps:
1. Condition assessment grades (severity) are defined as fuzzy sets (subsets of the universe).
2. Defect severities are deduced from the Australian manuals.
Page 46
Page 46 of 139
3. Severity quantification is done based on the analysis of the defect severities.
4. The severities are fuzzified based on their common property.
5. Triangular membership function has been used and the upper and lower boundaries of
each subset are known.
6. Fuzzy membership functions are applied to all defects and the six severity levels.
3.3.3 Condition Assessment Model
The model is developed by the fuzzy synthetic evaluation technique that includes fuzzification,
aggregation and defuzzification. After defining the two main input sets, which are the weights
and defects severities, the WSM approach is adopted to aggregate these two input sets to find the
desired condition. The WSM approach is applied to find the condition, using the following steps:
1. The corresponding weights and severities for each defect are collected and organized.
2. The first level of the condition is the defect condition, created as a result of multiplication
of the defect weight and its own severity using equation 1. There will be 35 conditions
related to the 35 defects.
𝐶𝑖 = 𝑊𝑖 ∗ 𝑆𝑖 ………………………………………………………………….. (1)
where Ci is defect i condition, Wi is the weight of defect i and Si is defect i severity.
3. The second step is repeated for all defects to calculate each condition.
4. The second level of condition is the defect category condition. It is a result of aggregating
all the defect conditions that are in the same category. Equation 2 represents the
mathematical formulation representing the aggregation step. The weight of each defect is
multiplied by its severity, divided by the maximum severity the defect reaches.
Page 47
Page 47 of 139
𝐶𝑐 = ∑ 𝑊𝑖 ∗ 𝑆𝑖
𝑆 𝑖𝑚𝑎𝑥
𝑛𝑖=1 …………………………………………………... (2)
where Cc is the defect category condition, Wi is the weight of defect i, Si is defect i
severity, Simax is the maximum severity level defect i reaches and n is the number of
defects for one defect category.
5. Step 4 is repeated for all defect categories to find their corresponding condition.
6. The component condition is a result of aggregation of each component’s defect category
condition. Equation 3 represents the mathematical formulation representing the
component condition. The weight of the defect category is multiplied by its condition
from the previous step.
𝐶𝑝 = ∑ 𝑊𝑗 ∗ 𝐶𝑐𝑗𝑚𝑗=1 ………………………………………………………… (3)
where Cp is component condition, Wj is the weight of defect category j, Ccj is defect
category j condition and m is the number of defect categories.
7. The final level of condition is the overall infrastructure condition. The infrastructure
condition is a result of aggregation of the component condition. Equation 4 illustrates the
aggregation step. The weight of components is multiplied by their corresponding
condition found before.
𝐶𝐼 = ∑ 𝑊𝑘 ∗ 𝐶𝑝𝑘
𝐿𝑘=1 ……...……………………………………………….. (4)
where Cl is the infrastructure condition, Cpk is component k condition, Wk is the weight
of component k and L is the number of components, i.e. 5 components.
Page 48
Page 48 of 139
3.3.4 Model Testing
Model testing is a major step in model development. Model testing is done to check the integrity
of the developed model. Therefore, two case studies have been used. The data is provided in
excel files of field inspection reports, done by experts using visual inspection techniques. The
case studies are segments of railway tracks with different speed levels. The data is provided by
Canarail Company in Montreal, Canada. The case studies are implemented in the model and the
results are compared with those of the original decision.
3.4 Railway Condition Assessment Automated Tool
The railway infrastructure condition assessment automated tool consists of six different speed
levels of the track to assess the condition of the railway infrastructure for all of its classes. Each
speed level has its own spreadsheet since the severities of the defects change with the speed.
Each spreadsheet includes all the components, defects and defect categories. The overall
condition is based on the five components. The developed spreadsheet is a user-friendly interface
that helps the user obtain the respective conditions through incorporating the defects obtained
from the inspection sheets done by the inspectors or the inspection technologies. The automated
tool is developed through Microsoft Excel in which the fuzzy membership functions of each
defect, the ANP weights and the severities driven from the specifications, the WSM aggregation
technique and the defuzzification approach are all incorporated into this model. The spreadsheet
gives a detailed condition, overall condition, defect category condition and component condition,
helping decision- makers in the process of planning for maintenance and rehabilitation.
Page 49
Page 49 of 139
3.5 Summary
This chapter has elaborated the research methodology used to build the condition assessment
model for railway infrastructure. In brief, the model development goes through several stages.
Starting with the collection and categorization of defects types, the components are studied in
terms of their nature, their material and the factors affecting their life cycle. Then, the condition
grading scale and defect severities (S) are defined. Moreover, the analytic network process
model is adopted to find the defects, defect categories and component weights (W). ANP is also
used for the interdependency of the sub-criteria and the main criteria, the interdependency of the
main criteria themselves and the interdependency of the main criteria with respect to the goal.
Furthermore, fuzzy synthetic evaluation is utilized to uniform the different criteria of the defects
and to translate the linguistic condition rating systems into numerical values. Consequently, the
Weighted Sum Mean approach is used to aggregate the defect weights W and the defect
severities S to find the railway infrastructure condition.
Page 50
Page 50 of 139
4CHAPTER IV: DATA COLLECTION
4.1 Introduction
This research has so far reviewed several sources to give a better understanding of railway
infrastructure. A number of railway infrastructure condition assessment manuals are studied to
elaborate on different ways of railway infrastructure condition assessment. Also, several
previous researches are reviewed to help in developing this model. Figure 4-1 illustrates the
types of the collected data to build this model. The data is divided into three types (defect types,
categories and components, defect weights and defect severities). The following sections discuss
the collected data in details.
Data Collected
Defect Categories and
Types
Components and Defect
Weights (ANP) Defect Severities
Defect Hierarchies Interdependencies Fuzzy Universe Thresholds
Figure 4-1: Types of Data Collected
4.2 Components, Defect Categories and Defects
This section presents the different components, defect categories and defects related to railway
infrastructure, based on the reviewed literature. Over ninety different defects have been
encountered, summarized to thirty-five defects based on experts’ opinions on the main defects
Page 51
Page 51 of 139
that inflict railway infrastructure. Railway infrastructure is composed of five main components,
i.e. rails, sleepers (ties), ballast, track geometry and insulated rail joints. Their defects are
categorized in form of a comprehensive hierarchy to represent railway infrastructure.
4.2.1 Rail Defects
The rail defects are divided into three main categories, rail internal defects, surface defects and
rail wear defects.
I. Rail internal defects
Table 4-1 lists the main rail internal defects with a brief description for each. The internal
defects in a rail segment are used to interpret the rails’ physical condition and their
severity. Examples are broken rails as one of the most railway accident causes,
compound fissures as progressive fractures in the rails head, defective welds
representing the defects in the weld areas for continuous welded tracks, foot and web
separations, head and web separations and the rail cracks that propagates and can deform
into severe defects if not maintained properly.
II. Surface defects
Table 4-2 lists the main rail surface defects along with a brief description for each. The
surface defects in a rail segment are used to interpret the rails surface condition and their
severity. Examples are fish scaling, spalling as the cracking and chipping of the rail
surface, rail contact fatigue as thin cracks appearing at the gauge corner of the rail, rail
corrosion and wheel burns.
Page 52
Page 52 of 139
Table 4-1: Rail Internal Defects (AREMA, 2010) (Kumar 2006) (Wilson, TMC 203 Track
Inspection, 2013) (Wilson, TMC 224 Rail Defects and Testing, 2011)
Defect Definition
Broken rail A lateral break in the rail.
Compound Fissure
A progressive fracture in the rail head that originates as a
horizontal separation turning up and down or in both directions,
to form a transverse separation substantially at right angles to the
running surface. Compound fissures may include multiple
horizontal or vertical planes.
Defective Welds A field or plant weld containing any discontinuities or pockets.
Foot and Web separation A crack that occurs in the foot and web fillet area; it is a
progressive crack along the fillet.
Head and Web separation A progressive fracture, longitudinally separating the head from
the web of the rail at the head fillet area.
Rail cracks Cracks that propagate in the rails, as hidden most of the time.
Table 4-2: Rail Surface Defects (AREMA, 2010) (Kumar 2006) (Wilson, TMC 203 Track
Inspection, 2013) (Wilson, TMC 224 Rail Defects and Testing, 2011) (RailCorp 2012)
Defect Definition
Fish Scaling; Spalling Cracking and chipping of the rail surface; spalling is a
progression of head checking and flaking.
Rail Contact fatigue
Thin cracks appearing at the gauge corner of the rail, appearing
most often on the outer rails of curves and sometimes on tangent
rails but infrequently on low rails.
Rail Corrosion
Corrosion is the disintegration of the rail starting at the surface,
from chemical decay, mainly oxidation (rusting). As it
progresses, it often forms irregular pits and cavities, or it
develops cracks in the rail web or the base.
Wheel Burns Defects that form on the running surface of the rails.
Page 53
Page 53 of 139
III. Rail Wear Defects
Table 4-3 lists the main rail wear defects along with a brief description for each. Three
main defects are curve wear, tangent wear and head loss percentage. The rail wear
defects in a rails segment are used to interpret the rail wear condition and its severity.
Rail wear is one of the most common defects in rails, needing continuous lubrication to
avoid these defects. Rail wear defects can be resolved by rail grinding technology.
Table 4-3: Rail Wear Defects (AREMA, 2010) (Wilson, TMC 203 Track Inspection, 2013)
(Wilson, TMC 224 Rail Defects and Testing, 2011) (RailCorp 2012)
Defect Definition
Head Loss Max % Percentage loss of the head part of the rail due to the grinding
or the movement of the train
Curve Wear Separation or cutting of the rail due to friction and abnormal
heavy loads
Tangent Wear Separation or cutting of the rail due to friction and abnormal
heavy loads
4.2.2 Sleeper (Tie) Defects
The sleeper defects are divided into two main categories: Sleeper Condition Defects and
Sleepers Component Defects. The sleeper condition defects are divided based on the
nature of the sleepers, concrete sleepers and timber sleepers.
I. Sleeper Condition Defects
Table 4-4 lists the main sleeper condition defects for both concrete and timber sleepers
along with a brief description for each. The sleeper condition defects are used to interpret
the sleeper conditions and their severity. Based on the sleeper condition defects, the
nature of the sleepers are divided into two groups: concrete sleepers and timber sleepers.
The concrete sleeper defects are called general sleeper defects because the timber sleeper
Page 54
Page 54 of 139
defects can be described by the concrete defects, such as spacing defects. According to
the timber sleeper defects specifications, when the sleeper defects reach a certain
percentage, the specifications refers to the concrete sleepers defects of clusters of
consecutive ineffective sleepers. The main sleeper in the cluster of consecutive
ineffective sleepers is that a number of sleepers are not in a good condition and they are
not supporting the rails properly.
II. Sleeper Components Defects
Table 4-5 illustrates the sleeper component defects with a brief description for each. The
sleeper component defects describe the condition of the sleeper components connected to
the rails such as insulators, pads and bolts. Defects such as squeezed, missing or failed
insulators are caused by continuous loading, worn sleeper pads and their higher dynamic
loads, loose or missing bolts, etc.
Table 4-4: Sleeper Condition Defects (AREMA, 2010) (Wilson, 2013) (Zakeri and Rezvani
2012)
Sleeper Type Defects Definition
General sleepers defects Consecutive Missing Sleepers Defective sleepers in a row
Spacing Spacing deviation between
sleepers
Clusters of Consecutive
Ineffective Sleepers
Ineffective sleepers not
functioning their proposed
[what?]
Timber sleepers defects Ineffective Timber Sleepers at
Joints
Defective sleepers at joints
areas
General Condition
Description Timber Sleepers
The percentage of defective
sleepers
Page 55
Page 55 of 139
Table 4-5: Sleeper Components Defects (AREMA, 2010) (Wilson, TMC 203 Track
Inspection, 2013) (Zakeri and Rezvani 2012)
Defects Definition
Squeezed out missing or
failed insulators
Insulation failed due to continues loading; the failure could be
that the insulation materials are squeezed between the steel
components of the insulation system or could be missing.
Severely worn sleeper pads Becoming worn with time, due to the continuous loading, and
increases the dynamic loading
Loose or Ineffective Fish
Bolts
Shear failure of bolts caused by electrolysis/corrosion; due to
corrosion and electrolysis within a few months of installation,
i.e. when the insulator sleeve breaks due to shear failure and
corrosion
Swage Fastenings at Fish-
Plated Joint
Becoming loose with time, due to the continues loading,
increasing the dynamic loading
4.2.3 Ballast Defects
The ballast defects are divided into two main categories: Ballast profile and drainage.
I. Ballast Profile
Table 4-5 illustrates ballast profile defects with a brief description for each. Ballast
profile defects are used to interpret the ballast amount, their profile condition and their
severity. Two ballast profile defects have been chosen here, the ballast deficiency that
signifies insufficient amounts of ballast that causes geometry-related issues. Excess
ballast also signifies extra amounts of ballast that might interfere with the passing trains
and can cause issues for the signaling devices.
Page 56
Page 56 of 139
II. Drainage
Table 4-6 explains the main two defects that cause drainage blockage. Drainage defects
in a ballast are used to interpret the ballast drainage property conditions and their
severity. There are two main causes for ballast drainage blockage: One is the fouling that
shows ballast blockage caused by fine materials filling the voids. The other is vegetation
growth in the ballast system, which blocks the voids and trap water in the tracks.
Table 4-5: Ballast Profile Defects (Sadeghi and Askarinejad 2010) (Esvald, 2001)
Defects Definition
Ballast deficiency Loose ballast from the track, causing geometry defects and
poor sleeper support by the ballast, e.g. cracking of sleepers
and bearers, excessive vertical sleeper movement or track
pumping
Excess Ballast Too much ballast on track; ballast can foul the signaling
equipment, especially at points and train stops. It can also foul
rolling stock and cause tripping of trains track sections where
the ballast profile may interfere with the operation of
infrastructure (e.g. signals or switches) or rolling stock.
Table 4-6: Drainage Defects (Lim 2004) (Esvald 2001)
Defects Definition
Fouling Fine material fills the voids between the ballast particles,
causing lake of drainage in the track; this will trap water in the
track.
Vegetation Growth When found in the ballast area, it indicates fouled ballast and
result in poor drainage.
4.2.4 Track Geometry Defects
Table 4-7 explains five geometry defects, i.e. gauge, twist, cross-level variation and
horizontal and vertical alignment deviation. Geometry defects, with their unified nature,
Page 57
Page 57 of 139
fall into one category. Geometry defects are one of the main concerns in the railway
industry since they are the second main cause of railway accidents (Liu, et al. 2014).
Gauge is the distance between the rails and the horizontal and vertical alignments are the
profile of the track, twist and cross-level variations, showing the difference in the level of
the two rails.
Table 4-7: Geometry Defects (Esvald, 2001) (AREMA, 2010) (Canada, 2012)
Defects Definition
Gauge Distance measured between the two parallel rails; gauge is
measured between points on the gauge face (or inside) of the
rails, 16 mm below the top.
Horizontal alignment Position of the track or rail in the horizontal plane; it is
expressed as being tangent or curved alignment and is
measured in a straight track by stretching a 62’ string between
two points along the gauge corner of the rail.
Top (vertical alignment) Is the track layout on the vertical plane? This can be thought of
as the elevation view, i.e. the side view of the track to show
track elevation. In track geometry, the vertical layout involves
concepts such as cross-level, cant and gradient.
Cross-level variation Difference in the level of the two rails at a single point along
the track.
Twist Variation in actual track cross-level (i.e. the difference in the
level of the two rails) over a defined length; the twist is to be
assessed by two criteria. The short twist is measured over 2 m
and the long twist is measured over 14 m.
4.2.5 Insulated Rail Joints Defects
Table 4-8 illustrates the defects in insulated rail joints with a description of each. The insulated
rail joints, with their unified nature, fall into one category. The insulated rail joint is an important
component in signaling train movements to ensure safety in railway crossings. Four main defects
Page 58
Page 58 of 139
in this component have been encountered: Loss or failure of the insulated materials, causing
signaling failures; joint gap movement; ineffective drainage around the joint, causing water
trapping; and rail head flow around the joints causing a gap between the two connected rails.
Table 4-8: Insulated Rail Joints Defects (Wilson, 2013)
Defects Definition
Loss or failure of insulation
material
Insulation material visibly cracked or disintegrated;
components fail to insulate (generally causing signal failure)
Joint Gap Movement Insulation key being squeezed out; joint pulling apart -visible
gap at insulation key, joint pulling apart -bent bolts
Ineffective Drainage
around Joint
Water lying in joint vicinity, water contacting a rail foot near
joints
Railhead flow across joint
Rail
Flow on either rail with potentials to provide a gap between
rail ends
4.3 Weight Data Collection
This research has adopted the analytic network process to find the components, defect categories
and defect weights. This process has been specifically chosen to account for the interdependency
of sub-criteria (defects), criteria (defect categories and defects) and each other. A questionnaire
has been developed and distributed first, both in hard copy and online. The online questionnaire
has been developed based on “http://www.surveyexpression.com” – the website that allows the
user to build and distribute questionnaires. The site provides a detailed analysis of the filled
questionnaires. Both surveys consist of six parts with a total of 66 questions. The general
question is as follows: What is the relative importance of element (X) over an element (Y) with
respect to element (C). The first part in the survey is a general pairwise comparison of the
components and defect categories with respect to the set goal. The second part is a pairwise
comparison of the rails defect categories and defects. The third part is a pairwise comparison of
Page 59
Page 59 of 139
the sleepers defect categories and defects. The fourth part is a pairwise comparison of the ballast
defect categories and defects. The fifth part is a pairwise comparison of the track geometry
defects. The final part is a pairwise comparison of the insulated rail joints defects. Figure 4.2
shows a sample of the online survey with part of the comparison between the components. The
full hard copy survey can be found in Appendix A.
Figure 4-2 Online Survey Sample
4.3.1 Questionnaire Response Statistics
Table 4-9 shows the statistics based on the survey given to more than 50 experts, managers and
engineers in railway engineering and construction in Canada. Fifteen questionnaires are
collected, one is neglected due to giving the same answer for all the questions and the majority
has been filled by engineers with varying years of experience in the field. Figure 4-3 shows the
Page 60
Page 60 of 139
distribution of respondents’ number of years of experience, where 64% of the questionnaires are
filled by engineers with more than 20 years of experience – providing more reliable results. 14%
of the questionnaires are from respondents with 6-10 years, 7% with 11-16 years and 15% with
less than 5 years of engineering experience.
Table 4-9: Questionnaire Statistics
Figure 4-3 Years of Experience of Respondents Distribution
Survey Numbers
Sent 50
Received 15
Discarded 1
Considered 14
Page 61
Page 61 of 139
4.3.2 Questionnaire Analysis
To analyze the surveys, the responses are checked for the credibility of the questionnaires and for
being used in the process of weight determination. The responses to 66 questions are reviewed
and their corresponding statistics are provided. The questions are based on pairwise comparisons,
as mentioned earlier and the comparisons are between two components or two defect categories
or defects. They have two sides: Whether element X is more important than element Y or
element Y is more important than element X. 95% of the questions are one-sided. An average of
76% of the responses to the same question is one sided, meaning that the answers to the same
question has the same point of view when it comes to which element is more important than the
other. Table 4-10 illustrates an example for the questions as well as their response statistics. The
example question compares the sleeper component (X) to the insulated rail joint component (Y)
with respect to ballast (C). 85.8% of the responses take the side of the sleepers and the majority
says that the ballast is more important than the insulated rail joints.
Table 4-10 Sleepers to Insulated Rail Joints Comparison Statistics
4.4 Defect Severities
Different sources have been carefully reviewed to define defect severities. These sources have
been advised by experts such as the Transport Canada Track Safety Regulations (Transport
Canada 2012) and the US Federal Railway Administration (FRA) Regulations (Office of
Comparison
elements
(X)
SLEEPERS
WITH RESPECT TO (C)
BALLAST
(Y) INSULATED
RAIL JOINTS
DOI DEGREE OF IMPORTANCE
DOI # 9 7 5 3 1 3 5 7 9
# Of Ques 1 1 6 3 1 0 1 1 0
% Of Ques 7.1% 7.1% 43% 21.5% 7.1% 0 7.1% 7.1% 0
Page 62
Page 62 of 139
Railroad Safety 2014). Neither of these Canadian and American manuals are useful for this
research. The FRA and Transport Canada establish the minimum safety standards for various
classes of track. They are commonly referred to as URGENT limits. If and when a track section
reaches these limits, the operating railway is obligated to implement the appropriate corrective
action immediately to protect rail traffic. These manuals cannot be used as a maintenance manual
since the development of standards or criteria for the maintenance of railways, track and
structures has always been the prerogative of individual railways, based on the nature and
characteristics of their plant and operations and the specific characteristics of the geographical
region or regions through which they operate. Therefore, each major railway company in Canada
uses their own standards.
The Canadian companies’ specifications for defect severities use three levels of severity where
the first is the priority level followed by the near urgent. The maximum severity level is urgent,
when the urgent level is the same as the urgent limits from transport Canada. This research does
not use Canadian maintenance manuals for confidentiality reasons. Besides, several other
condition assessment scales have been mentioned earlier in section 2.4, i.e. previous research
works on railway infrastructure.
Two online Australian manuals are used in this research to define the desired severities.
Developed by RailCorp Engineering, they are TMC 203 Track Inspection (Wilson 2013) and
TMC 224 Rail Defects and Testing (Wilson 2011). Table 4-11 illustrates the six level condition
grading scale developed by Railcorp and used in this research. The best track condition is
defined as normal and represents the first severity level and the worst condition is defined as
emergency one (E1) condition where maintenance is required before the passage of the next
Page 63
Page 63 of 139
train. Each level of the condition grading scale recommends an inspection and variation time
along with the required maintenance
The severity of the railway infrastructure defects changes with the speed level of the track. It
means that the same defect can be more dangerous when the speed of the track is higher. So, six-
speed levels are taken into consideration. Different defects have different criteria and different
ways of measurement. Some defects reach more severe levels than others. As an example,
broken rails reach emergency 1 level while ballast fouling reaches priority 1 level. To uniform
the different defect severities, defuzzification technique is adopted as mentioned in Chapter 3.
Figure 4-4 illustrates an example for the short twist defect severities when severities are divided
by the six levels of condition grading scale, marked by their color codes. It shows how the defect
severities change with speed and how to determine the exact condition based on the collected
data.
Table 4-11: Railway Track Defects Severity levels (TMC 203)
Response Category Inspect and verify response Action
Emergency 1 (E1) Prior to passage of next train Prior to passage of next train
Emergency 2 (E2)
Within 2 hrs or before the next
train, whichever is the greater
Within 24 hrs
Priority 1 (P1) Within 24 hrs Within 7 days
Priority 2 (P2) Within 7 days Within 28 days
Priority 3 (P3) Within 28 days Program for repair
Normal (N) Nil Routine inspection
Page 64
Page 64 of 139
Figure 4-4: Twist Defect Severity (TMC 203)
4.5 Case Studies
Model implementation and validation is a major step in the model development process.
Validation is the step where model credibility and reliability are checked. In this important step,
case studies of the existing railway infrastructure inspection sheets or data are provided by means
of inspection technologies along with the experts’ analyses and the final decision. For desired
case studies, the railway industry in Canada has been contacted and two case studies have been
provided by Canarail Company in Montreal, Quebec.
4.5.1 Case Study 1
The first case study is a class 1 track with a 20 km/h speed limit with 65 km of the existing track
located in Ontario, Canada. The inspection is done by experts and the inspection sheets and the
final decision are provided. The track has a lot of fouled ballast and a high percentage of the
wooden sleepers are defective. The final decision is a sleeper rehabilitation program. Pictures in
figure 4-5 describe different components of different milepost tracks. While (A) describes a
Page 65
Page 65 of 139
tangent part of the track showing the main components, (B) shows fouled ballast and (C)
prescribes some defective sleepers.
Figure 4-5 Case 1 photos of Different Segments (A) Tangent Part of the Track
(B) Fouled Ballast (C) Defective Sleepers
4.5.2 Case Study 2
The second case study is a class 5 track with a 150 km/h speed limit with 25 km of tracks also
located in Ontario, Canada. The inspection is done by experts and the inspection sheets and the
final decision are provided. The track does not show any deficiencies and only a small
Page 66
Page 66 of 139
percentage of the sleepers are defective. No maintenance plans are taken while the sleepers
should be monitored. Pictures in figure 4-6 describe different components of different milepost
tracks. (A) Describes a tangent part of the track that shows the main components, (B) shows
railway switches and (C) prescribes excess ballast covering sleepers.
Figure 4-6 Case 2 Photos Describing Deferent Segment of The Track (A) Tangent Segment
of the Track (B) Switch (C) Ballast Covering the Sleepers.
Page 67
Page 67 of 139
4.6 Summary
This chapter provides the data collection procedure in this research. The first type of the
collected data is the components, defect categories and defects, investigated and well understood.
The second type of the collected data is the surveys distributed among professionals for credible
pairwise comparisons, to obtain the components, defect categories and defect weights. Moreover,
various sources are reviewed to define the defect severities in the fuzzy set model. Finally, case
studies are collected for the purpose of model implementation and testing.
Page 68
Page 68 of 139
5CHAPTER V: MODEL DEVELOPMENT AND
IMPLEMENTATION
5.1 Introduction
This chapter outlines the use of techniques explained in the previous ones to develop the defect-
based condition assessment model through results, implementation and validation. Here, the
constructed defect hierarchy of the railway infrastructure components and their defects are first
presented. Then, the relative importance weights are discussed and analyzed. The relative
weights include components, defect categories and defects. Additionally, the condition grading
assessment scale and the defect severities are demonstrated. Furthermore, this chapter presents
the fuzzy membership functions adopted to uniform the different defect criteria. Consequently,
the aggregation process that uses weighted sum mean is explained through examples and the
defuzzification process. Finally, this chapter discusses the implementation of the case studies as
well as the model’s verification and validation.
5.2 Model Hierarchies
To discuss the railway infrastructure and provide a hierarchy to apply the models mentioned
beforehand, the model is divided into five main components, rails, sleepers (ties), ballast, track
geometry and insulated rail joints – each with zero to three defect categories. Figure 5.1
describes a railway infrastructure hierarchy for the five main components with each component
defect category, as an example, showing the sleeper component with its two defect categories,
sleeper components and sleeper condition defects.
Page 69
Page 69 of 139
Figure 5-1: Railway Infrastructure Hierarchy
5.2.1 Railway Infrastructure Defects Hierarchy
Table 5-1 illustrates the railway infrastructure defect hierarchy that consists of the main five
components – rails, sleepers, ballast, track geometry and insulated rail joints – as well as their
defect categories and the corresponding defects of each. Several manuals are reviewed and
professionals are consulted to define the main defects that occur in railway infrastructures. A
summary of 35 defects has been chosen to build the desired defect-based condition assessment
model. The two timber sleeper defects are not mentioned in the table below due to the similar
nature and description of the concrete defects. Therefore, the concrete sleeper defects are used to
describe the sleeper defects. A full and detailed description of the components, defect categories
and defects can be found in chapter 4 on data collection.
Railway infrastructure
Rails
Surface defects
Rail cracks and internal defects
Rail wear defects
sleepers(ties)
sleeper component
Sleeper Condition Defects
Ballast
Drainage
Ballast profile
Insulated Rail Joints
insulated rail joints defects
Track geometry
geometry defects
Page 70
Page 70 of 139
Table 5-1 Railway Infrastructure Defects Hierarchy
Parts Defects Categories Defects
Rails
Surface defects
Fish Scaling; Spalling
Rail Contact fatigue
Rail Corrosion
Wheel Burns
Rail cracks and internal
defects
Broken rail
Compound Fissure
Defective Welds
Foot and Web separation
Head and Web separation
Rail cracks
Rail wear
Head Loss Max %
Curve Wear
Tangent Wear
Ballast
Ballast Profile Excess Ballast
Ballast deficiency
Drainage Fouling
Vegetation Growth
Sleepers (Ties)
Sleepers Condition Defects
Clusters of Consecutive Ineffective Sleepers
Consecutive Missing Sleepers
Spacing
Sleepers Components
Defects
Loose or Ineffective Fish Bolts
Severely worn sleeper pads
Squeezed out missing or failed insulators
Swage Fastenings at Fish-Plated Joint
Geometry Geometry
Gauge
Horizontal alignment
Top Vertical alignment
Twist
Cross-level variation
Insulated Rail
Joints Insulated Rail Joints
Loss or failure of insulation material
Joint Gap Movement
Ineffective Drainage around Joint
Railhead flow across joint Rail
Page 71
Page 71 of 139
5.3 Weights (W)
This research adopts the Analytic Network Process (ANP) to compute the relative importance
weights of the components, defect categories and defects using the previously mentioned defect
hierarchies. This analysis takes fourteen surveys into account. Due to the large number of
defects, “SUPER DECISIONS” software is employed to find the weights. Figure 5-3 shows the
defect hierarchy built in “SUPER DECISIONS” software for the survey analysis. The hierarchy
gathers the components, defect categories and defects. The answers from the fourteen
questionnaires are the input for the “SUPER DECISIONS” software. The fourteen questionnaires
are input individually into the software and the associated weight matrices are extracted. After
extracting all the weights from the questionnaires, an average value of the weights (W) is used in
the aggregation process.
Three levels of weights based on the three levels hierarchy are found. The first level is
components weights, defect category weights and defect weights. Table 5-5 summarizes all the
three level weights. The component weights analysis shows that the sleepers have the highest
weight (27%) followed by track geometry (26%), ballast (18%), rails (16%) and insulated rail
joints (13%) with the lowest weight among the components.
The rail defect weights show that the rail internal defects have the highest weight (41%). The
surface defects with a weight of (35%) has the second highest and the wear defects (24%) has the
lowest weight. This result is reasonable as the internal defects are a major cause of accidents.
Moreover, in the internal defects category, broken rails are given the highest weight (26%).
These results are logical since the broken rails are considered one of the worst kinds of defects.
Page 72
Page 72 of 139
Figure 5-2: Super Decision Model Hierarchy
Page 73
Page 73 of 139
For surface defects, all defects have almost equal weights. On the other hand, the curve wear has
the highest weight (53%). This is a reasonable result since the curve defects are more severe than
the ones in the tangent areas.
The sleeper condition defects are given a relatively higher weight, i.e. (63%), than the sleeper
component defects, i.e. (37%). Both the clusters of consecutive ineffective sleepers and the
general condition describing timber sleepers are considered the same due to their common
definition in terms of a defect. The first one is for concrete or it can describe the timber sleepers
when the percentage of defective timber sleepers exceeds a certain level. The sleeper pads have
the highest weight among the sleeper components, showing that the pads are the most important
part in the connection between the rails and the sleepers.
As the results of the ballast weight extraction show, the drainage defects outweigh the ballast
profile defects with a weight of 55%, compared to a 45% – which is not of a great difference.
The fouling defect of 62% has a higher weight than the vegetation growth, showing that the fine
materials are more effective than the vegetation in terms of blocking the drainage feature of the
ballast. The analysis shows that the ballast deficiency of 79% outweighs the ballast excess of
21% in terms of ballast profile defects.
The twist defect has the highest weight among all the geometry defects. The joint gap movement
has the highest weight among all the defects in the insulated rail joints.
Page 74
Page 74 of 139
Table 5-2 Weight Determination
Component Wk Defects Categories Wj Defects Wi Wi global
Rails 16%
Surface defects 35%
Fish Scaling; Spalling 28% 1.57%
Rail Contact fatigue 21% 1.18%
Rail Corrosion 24% 1.34%
Wheel Burns 26% 1.46%
Total (∑) 100% 0%
Rail cracks and
internal defects 41%
Broken rail 26% 1.71%
Compound Fissure 15% 0.98%
Defective Welds 8% 0.52%
Foot and Web separation 18% 1.18%
Head and Web separation 18% 1.18%
Rail cracks 15% 0.98%
Total (∑) 100% 0%
Rail wear 24%
Head Loss Max % 32% 1.23%
Curve Wear 53% 2.04%
Tangent Wear 14% 0.54%
Total (∑) 100% Total (∑) 100% 0%
Ballast 18%
Ballast Profile 45%
Excess Ballast 21% 1.70%
Ballast deficiency 79% 6.40%
Total (∑) 100% 0%
Drainage 55% Fouling 62% 6.14%
Vegetation Growth 38% 3.76%
Total (∑) 100% Total (∑) 100% 0%
Sleepers
(Ties) 27%
Sleepers Condition
Defects 63%
Clusters of Consecutive Ineffective Sleepers 52% 8.85%
Consecutive Missing Sleepers 34% 5.78%
Spacing 13% 2.21%
Total (∑) 100% 0%
Sleepers Components
Defects 37%
Loose or Ineffective Fish Bolts 21% 2.10%
Severely worn sleeper pads 45% 4.50%
Squeezed out missing or failed
insulators 20% 2.00%
Swage Fastenings at Fish-Plated Joint 14% 1.40%
Total (∑) 100% Total (∑) 100% 0%
Geometry 26% Geometry 100%
Gauge 27% 7.02%
Horizontal alignment 15% 3.90%
Top Vertical alignment 11% 2.86%
Twist 32% 8.32%
Cross-level variation 16% 4.16%
Total (∑) 100% Total (∑) 100% 0%
Insulated
Rail Joints 13% Insulated Rail Joints 100%
Loss or failure of insulation material 20% 2.60%
Joint Gap Movement 45% 5.85%
Ineffective Drainage around Joint 21% 2.73%
Railhead flow across joint Rail 14% 1.82%
Total (∑) 100% Total (∑) 100% Total (∑) 100% 100%
Page 75
Page 75 of 139
5.4 Defect Severity (S)
Defect severity is the second main input in the model development. Defect severity is the degree
of impact of a defect on a component or a system. Different sources have been reviewed to
define defect severities, some sources have been found online and others have been advised by
experts as previously mentioned in Chapter Four. The main sources to define the severities and
the condition assessment grading scales are TMC 203 Track Inspection (Wilson 2013), TMC 224
Rail Defects and testing manuals (Wilson 2011) developed by Railcorp in Australia. Table 5-3
shows the assessment scale that consists of six severity levels, from normal level where the track
is safe with no maintenance required to emergency 1 (E1) as the most severe level with a
maintenance plan required before the next train passage. The assessment scale recommends both
the appropriate inspection and action times for each severity level.
The defect severities for each defect are divided into the six levels of condition assessment
scales, based on the defect’s impact on the railway infrastructure. Different defects have different
levels of impact, with some defects reaching emergency 1 severity level while other defects do
not reach that level. Broken rail defect reaches emergency 1 level while ballast fouling reaches
priority 1 level. The severity of defects changes with the speed level of the track, meaning that
the same defect can have a higher level of impact when the speed of the track increases. The
manuals define the six-speed levels with which the tracks operate. The severities are collected
and organized for different defects and different speed levels. Table 5-4 and 5-5 below are an
example of rail defect severity for two different speed levels. Rail defect severities are
represented by the six levels of condition assessment grading scale as an example of the broken
rail defect. If the spacing between the two parts of the broken rail is less than 50 mm, the
condition is priority 1 and if the spacing is 100mm or greater, the condition is emergency 1.
Page 76
Page 76 of 139
Table 5-4 shows the defect severities of rail component for tracks with speed 20 km/h and Table
5-5 shows the defect severities of rail component for tracks with speed 40 km/h. All defect
severities for the different speed levels can be found in Appendix B.
Table 5-3: Condition Assessment Scale (TMC 203)
Response Category Inspect and verify response Action
Emergency 1 (E1) Prior to passage of next train Prior to passage of next train
Emergency 2 (E2)
Within 2 hrs or before the next
train, whichever is the greater
Within 24 hrs
Priority 1 (P1) Within 24 hrs Within 7 days
Priority 2 (P2) Within 7 days Within 28 days
Priority 3 (P3) Within 28 days Program for repair
Normal (N) Nil Routine inspection
Page 77
Page 77 of 139
Table 5-4: Rails Defects Severities at speed 20 km/hr
PartsDefects
CategoriesDefects N P3 P2 P1 E2 E1
Fish Scaling;
Spalling
No surface
cracking in gauge
corner or on rail
head
Minor Spalling Present:
Gauge Corner, and
Top of rail head
Significant Spalling
Present: Gauge
Corner, and Top of
rail head
Rail Contact
fatigue
No visible cracking
on rail headCracks visible
Cracks 1mm deep or
TDS potentially
hidden during
ultrasonic testing
TDM potentially hidden
during ultrasonic testing
TDL potentially hidden
during ultrasonic testing
Rail Corrosion >15 13-15 <13
Wheel Burns No Wheel BurnsIndents or Head Flow
Visible
Indents 1mm or signs
of minor ballast
disturbance
Indents 2mm or ballast
disturbance or minor track
geometry deterioration
Broken rail 0-50 51-100 >100
Compound
Fissure4.9% or less 5% to 69.9% 70% to 99.9% 1
Defective Welds 40 to 56 57 to 90 over 90
Foot and Web
separation20 to 40 41 to 75 76 to 150 Over 150
Head and Web
separation20 to 75 76 to 200 over 200
Rail cracks <4 4 to 10 >10
Head Loss Max
%0.55
Curve Wear 52 48
Tangent Wear 32 26
Rails
Surface defects
Rail cracks and
internal defects
Rail wear
Page 78
Page 78 of 139
Table 5-5: Rails Defects Severities at speed 40 km/hr
PartsDefects
CategoriesDefects N P3 P2 P1 E2 E1
Fish Scaling; Spalling
No surface cracking
in gauge corner or
on rail head
Minor Spalling Present:
Gauge Corner, and
Top of rail head
Significant Spalling
Present: Gauge
Corner, and Top of
rail head
Rail Contact fatigueNo visible cracking
on rail headCracks visible
Cracks 1mm deep or
TDS potentially
hidden during
ultrasonic testing
TDM potentially
hidden during
ultrasonic testing
TDL potentially hidden
during ultrasonic testing
Rail Corrosion >15 13-15 <13
Wheel Burns No Wheel BurnsIndents or Head Flow
Visible
Indents 1mm or signs
of minor ballast
disturbance
Indents 2mm or
ballast disturbance or
minor track geometry
deterioration
Broken rail 0-50 51-100 >100
Compound Fissure 4.9% or less 5% to 69.9% 70% to 99.9% 1
Defective Welds 40 to56 57 to 90 over 90
Foot and Web
separation20 to 40 41 to 75 76 to 150
Head and Web
separation20 to 75 76 to 200 over 200
Rail cracks <4 4 to 10 >10
Head Loss Max % 0.55
Curve Wear 52 48
Tangent Wear 26 32
Rails
Surface defects
Rail cracks and
internal defects
Rail wear
Page 79
Page 79 of 139
5.4.1 Severities Quantification
After collecting all defect severities and defining all different measuring criteria for different
defects, this research uses the defuzzification technique to uniform all defect criteria and to
translate the linguistic condition assessment grading scales into quantitative scores. The
membership function used in the defuzzification process is the triangular membership function
that fits the used data. Firstly, defuzzification is done on the six levels of severity, by defining
them with a 0-10 grading scale. The grading scale for each level of severity is defined by
analyzing the geometry and the ballast deficiency defects severity. The geometry defects and the
ballast deficiency are chosen because these defects have numerical values describing their
severities and cover all the defect severity levels using the weighted percentage technique. Table
5-6 is an example of the weighted percentage applied to the ballast deficiency to find the grading
scale and the score for each level of severity. The severities are translated into a score from 1 to
10 by dividing the permissible limits for the severity level by the maximum permissible level.
After finding each level grading scale, the mean value for each grading scale is used to define the
score for each level. The weighted percentage is applied to all geometry defects and the ballast
deficiency for all the six-speed levels.
Table 5-6: Weighted percentage of the ballast deficiency defect severity for track speed of
20km/h.
Severity
Level N P3 P2 P1 E2 E1 Sum
Severity 0-4 4-8 8-12 12-14 14-17 17-19
4 4 4 2 3 2 19
2.1 2.1 2.1 1.1 1.6 1.1 10
Grading
scale 0-2.1 2.1-4.2 4.2-6.3 6.3-7.3 7.3-8.9 8.9-10
score 1.05 3.15 5.25 6.8 16.2 9.45
Page 80
Page 80 of 139
Table 5-7 shows the grading scale and the score of the six severity levels deduced from the
weighted percentage analysis done on the defects. Where each level is given a grading scale and
a score defined as the average value of the grading scale. i.e. the Normal N level were given a
grading scale of 0 to 3 and the score that represent this level and will be used to define it is 1.5,
were this value will be used in the aggregation process, and correspondingly the table shows the
grading scale and the scores of all other levels in the same way. When the six severity levels with
their corresponding numerical scores are defined, and since all defects are defined based on the
same condition assessment levels of severity, these scores are distributed for all defects at all
speed levels.
Table 5-7: Limits of the fuzzy process Severity Levels
Severity grading scale score
N 0 – 3 1.5
P3 3 – 5 4
P2 5 - 6.5 5.75
P1 6.5 – 8 7.25
E2 8 - 9.5 8.75
E1 9.5 - 10 9.75
Page 81
Page 81 of 139
5.5 Defect-based Condition Assessment Model
After collecting and quantifying the defect severities (S) and finding all the weights (W) for the
components, defect categories and defects, the Weighted Sum Mean Technique is employed as a
comprehensive aggregation method. As mentioned before, the model is divided into a hierarchy
of components followed by defect categories and defects, to define and calculate the railway
infrastructure condition. The aggregation process and its equations are explained in Chapter
Three, the Condition Assessment Model section. The main equation is C=W*S where C is
condition, W is weight and S is severity. There are three levels of condition based on the three
levels of hierarchy, the defect categories condition, the component condition and, finally, the
overall condition, describing the railway infrastructure.
When the condition is computed in percentage by the WSM model, the step of translating this
percentage back to a linguistic grading scale (example: 22% to Normal (N)) is called
fuzzification. The limits defining the severity levels at this step is the same as those for severity
quantification in Table 5-7. Moreover, the resulting condition would be used by project
managers, engineers, decision-makers and practitioners, to decide on maintenance and
rehabilitation programs.
5.5 Model Implementation: Case Study and Validation
One of the main components in the model development is the implementation of the model to
real case studies with real data of inspections and final decisions. This is done to check the
model’s applicability and credibility. This is done in two case studies from Ontario, Canada, and
provided by Canarail Company.
Page 82
Page 82 of 139
5.5.1 Case Study 1
The first case is 40 miles of track located in Ontario, Canada. It is a class 1 track with the
operation speed of 20km/h. The data format is an excel file summarizing the experts’ inspection
sheets (visual inspection). The tie rehabilitation programs are planned by the experts since the
ties and ballasts are in bad condition. The data is put into the developed model for each milepost
and the conditions of the defect category, the component and the overall condition of the railway
infrastructure are found. Table 5-8 shows the obtained conditions where the overall condition is
Priority 3 (P3), indicating the need for a repair program. As the model gives a detailed condition
describing the state of components and their defects categories, the analysis shows that both the
ballast and the sleepers are in bad condition and require maintenance, as shown in Table 5-8.
Both the decision and the output of the model give the same results.
Table 5-8: Conditions of Case Study Number One
5.5.2 Case Study 2
The case is a track of 15 miles, located in Ontario, Canada, a class 5 track with an operation
speed of 150km/h, considered in the 6th speed category. The data format is the same as in the 1st
case. The experts’ inspection sheets (visual inspection) are summarized. The decision provided
by the experts state that no maintenance is needed because the track is in good condition and
there are a few ineffective sleepers. The data is put into the developed model for each milepost
and the conditions of the defect categories component and the overall condition are found. Table
Rails 16% N
Ballast 18% P2
Sleepers (Ties) 27% P1
Geometry 26% N
Insulated Rail Joints 13% N
Railway
Infrastructure P3
Page 83
Page 83 of 139
5-9 shows that the overall condition the model provides is Normal (N), indicating that no actions
need to be taken. The component conditions show all the components except sleepers in a normal
condition level and Priority 3 for the sleepers. Both the decision and the condition give the same
results.
Table 5-9: Condition of Case Study Number 2
5.6 Sensitivity Analysis
In an attempt to test the robustness of the developed model and its sensitivity to changes in the
weight values, a sensitivity analysis is conducted with respect to the components of railway
infrastructure. It is conducted to test the relationship between the weights of the components and
the overall condition of the infrastructure. It also shows the degree to which any change in the
input (i.e. the weights) could affect the potential output.
In the methodology of the sensitivity analysis, each component weight changes individually, in
six ways and with 5% intervals, i.e. -15%, -10%, 5%, 0, 5%, 10% and 15%. The six intervals
change each component weight and the changes in the condition are measured. This
methodology is applied to rails, ballast, sleepers, geometry and insulated rail joints based on the
two case studies’ results.
Figure 5-3 illustrates the results of the sensitivity analysis applied to the first case study. It shows
the overall condition changing corresponding to the change of the component weights. In the
Rails 16% N
Ballast 18% N
Sleepers (Ties) 27% P3
Geometry 26% N
Insulated Rail Joints 13% N
Railway
Infrastructure N
Page 84
Page 84 of 139
first case study, the rails, geometry and insulated rail joints have the same condition as these
components’ condition is normal and the sleepers have Priority 1 and ballasts have Priority 2
conditions. The analysis shows that the effect of the rail has a slight difference when it is
compared to the equal effect that the geometry and the insulated rail joints have on the condition.
The effects of the sleeper weight change shows the highest slope since it has the highest
condition among the components. The ballast shows the second highest slope but the change in
the condition is not severe. The overall condition is not affected by high changes. The condition
does not jump to a different level for all the scenarios and the overall condition stays at Priority
3. The x axis represents the change in the weight and the y axis represents the difference in
percentage of the overall condition.
Figure 5-3 Case 1 Sensitivity Analysis
-8%
-6%
-4%
-2%
0%
2%
4%
6%
8%
-15 -10 -5 0 5 10 15
case 1 sensitivity of the overall condition to the weights of components
Rails Ballast Sleepers Geometry Insulated Rail Joints
Page 85
Page 85 of 139
Figure 5-4 illustrates the results of the sensitivity analysis applied to the second case study. It
shows the change of the overall condition, corresponding to the change of the component
weights. In the first case study, the rails, geometry, ballast and insulated rail joints have the same
condition while the condition of these components is Normal and the sleepers have the Priority 3
condition. The analysis shows that the effect of the rail has a slight difference compared to the
equal effect that geometry, the ballast and the insulated rail joints have on the condition. The
change in the sleeper weight effects show the highest slope since it has the highest condition
among the components. The x axis represents the change in the weight and the y axis represents
the difference in the percentage of the overall condition.
Figure 5-4 Case 1 Sensitivity Analysis
-5%
-4%
-3%
-2%
-1%
0%
1%
2%
3%
4%
5%
-15 -10 -5 0 5 10 15
case 2 sensitivity of the overall condition to the weights of the components
Rails Ballast Sleepers Geometry Insulated Rail Joints
Page 86
Page 86 of 139
6CHAPTER VI: CONDITION ASSESSMENT AUTOMATED TOOL
6.1 Introduction
After developing the defect-based railway infrastructure condition assessment model and
incorporating all of its components and defects, putting this model into practice is significant. In
the implementation process, one main task is to run this work in an easy and comprehensible
way. Therefore, this model has been implemented in Excel, with all the input and output
incorporated into it. Firstly, a comprehensive database including the two main input data sets, the
weights of the components, defect categories and defects and the defect severities have been
extracted from the specification for the six-speed levels. The tool includes the severity
quantification limits used to translate the severities into numerical scores. Moreover, the whole
aggregation process through the WSM approach is done in this framework. Six main condition
assessment spreadsheets for the six-speed levels are created. The input data for the developed
sheets are the inspection sheets, data gathered by the inspection technologies or both. The tool
allows users, practitioners, decision-makers and managers to determine the railway infrastructure
condition. It gives a detailed condition, an overall condition, component condition and defect
category condition, through inputting the available defect severities as indicated in the model.
6.2 Database
To develop the automated tool based on the needs, a comprehensive database is first built to
gather all the assessment criteria. The database consists of the two main input sets based on
which the model is developed, the weights (W) and the severities (S) for the six speed levels of
Page 87
Page 87 of 139
the track. Table 6-1 is an example of the database, showing the weights and the severities
corresponding to rails for 20km/h tracks.
6.3 Automated Condition Assessment Model
The railway infrastructure condition assessment automated tool consists of six spreadsheets
based on the six-speed levels. Each spreadsheet consists of the components, their defect
categories and defects to assess the condition of railway infrastructure. To find the desired
condition, the spreadsheets consist of all the calculation and aggregation procedures. If and then
formats are used to determine the severity levels of each defect, based on the entered values
compared to the values defined in the database. When the defect severities are defined, the
aggregation procedure between the severities and the corresponding weights is also interpreted in
the spreadsheets through the aggregation process mentioned in the previous chapters. The
calculated condition is a three-level condition: The defect category condition, the component
condition and the overall condition.
The developed spreadsheets allow users to fill the collected defect severities. Due to the different
measurement criteria, two different ways to fill the collected data are developed: a drop down list
for the defects with a linguistic description for the severities and a space to fill the quantitative
severities. Figure 6-3 shows users trying to fill the gauge defect severity from the inspection
sheets. Figure 6-4 shows the drop-down list for fish scaling spalling defect severity.
Figure 6-5 illustrates the condition assessment interface that consists of all the component, defect
categories and defects concerning the railway infrastructure. This is the interface where the
severities can be input and the conditions change automatically while the users fill the defect
severities gathered through the inspection techniques.
Page 88
Page 88 of 139
The developed tool is a user-friendly interface helping users obtain the respective conditions
through incorporating the defects. The defects can be taken from the experts’ inspection sheets,
data gathered by inspection technologies or both. The steps below describe the procedures to
obtain the desired condition.
1. The first spreadsheet is the speed interface where the user can choose the speed of the
track that will be assessed. Figure 6-2 represents the speed interface showing the six-
speed levels from the minimum speed of the tracks, i.e. 20km/h, to 160km/h.
2. Step 1 will take the user to the condition assessment spreadsheet of the chosen speed.
3. Start filling the defect severities; some defects have a drop down list to choose from and
the users can fill the severity in the rest.
4. Repeat the steps above for all of the desired components and their corresponding defect
families.
5. The condition changes automatically while the users fill the collected severities.
6. When all the severities are filled, the users can save the condition under its milepost.
Figure 6-1 represents the steps and the procedures of using the automated tool. The flow
chart highlights the steps mentioned earlier. It starts by choosing the speed and finishes with
the choices to exit or to proceed to the next milepost.
Page 89
Page 89 of 139
Choose Speed
Start
60 km/hr20 km/hr100-115
Km/hr
80-90
Km/hr40 km/hr
115-160
km/hr
Relative Condition
Assessment Interface
Enter Mile PostInput Defect
severities Data
Defect Categories
Condition
Component
Condition
Infrastructure
Condition
Save Condition
Results
EndNext
Milepost
Exit Or
Proceed?EXITPROCEED
Figure 6-1 Automate Tool Flow Chart
Page 90
Page 90 of 139
Table 6-1 Example From the Database Showing the Main Inputs for Rail for Track Speed 20Km/Hr.
PartsParts
Weights
Defects
Categories
Defects
Categorie
s Weights
Defects Weights N P3 P2 P1 E2 E1
Fish Scaling;
Spalling28%
No surface cracking
in gauge corner or
on rail head
Minor Spalling
Present: Gauge
Corner, and Top of
rail head
Significant Spalling
Present: Gauge
Corner, and Top of
rail head
Rail Contact
fatigue21%
No visible cracking
on rail headCracks visible
Cracks 1mm deep
or TDS potentially
hidden during
ultrasonic testing
TDM potentially
hidden during
ultrasonic testing
TDL potentially
hidden during
ultrasonic testing
Rail Corrosion 24% >15 13-15 <13
Wheel Burns 26% No Wheel BurnsIndents or Head
Flow Visible
Indents 1mm or
signs of minor ballast
disturbance
Indents 2mm or
ballast disturbance
or minor track
geometry
deterioration
Total (∑) 100%
Broken rail 26% 0-50 51-100 >100
Compound
Fissure15% 4.9% or less 5% to 69.9% 70% to 99.9% 1
Defective
Welds8% 40 to 56 57 to 90 over 90
Foot and
Web
separation
18% 20 to 40 41 to 75 76 to 150 Over 150
Head and
Web
separation
18% 20 to 75 76 to 200 over 200
Rail cracks 15% <4 4 to 10 >10
Total (∑) 100%
Head Loss
Max %32% 0.55
Curve Wear 53% 52 48
Tangent Wear 14% 32 26
Total (∑) 100% Total (∑) 100%
Surface defects 35%
Rail cracks and
internal defects41%
Rail wear 24%
Rails 16%
Page 91
Page 91 of 139
Figure 6-2 Speed Interface
Figure 6-3 Defect Severity Inputting
Figure 6-4 Defect Severity Drop-Down List
SELECT THE
APPROPRIATE SPEED
SPEED INTERFACE MODULE
Speed = 20 Km/Hr Speed = 40 Km/Hr Speed = 60 Km/Hr Speed = 80-90 Km/Hr Speed = 100-115 Km/Hr Speed = 115-160 Km/Hr
Page 92
Page 92 of 139
Parts Defects Categories Defect Defect Severity Units
Fish Scaling; Spalling No surface cracking in gauge corner or on rail head N/A
Rail Contact Fatigue TDL potentially hidden during ultrasonic testing N/A
Rail Corrosion 1 mm
Wheel Burns Indents 2mm or ballast disturbance or minor track geometry deterioration N/A
Broken Rail 120 mm
Compound Fissure 100% %
Defective Welds 0 mm
Foot and Web Separation 200 mm
Head and Web Separation 0 mm
Rail cracks 200,000 mm
Head Loss Max. Percentage 100% %
Curve Wear 0 mm
Tangent Wear 8 mm
Excess Ballast Profile as specified N/A
Ballast defecincy 2 mm
FoulingMinimal fines in ballast, Fines in ballast, visible contamination on
surface of ballastN/A
Vegitation Growth Highly vegetated that cause water being trapped in the ballast N/A
Clusters of Consecutive Ineffective Sleepers 0 Number
Consecutive Missing Sleepers 6 Number
Spacing 40,000 mm
Loose or Ineffective Fish Bolts No N/A
Severely worn sleeper pads Yes N/A
Squeezed out missing or failed insulators Yes N/A
Swage Fastenings at Fish-Plated Joint Yes N/A
Gauge 0 mm
Horizontal Alignment 0 mm
Top Vertical Alignment 0 mm
Twist 0 mm
Cross Level Variation 100 mm
E2
Categories Score Parts Score
NGeometry
P3
Sleepers (Ties)
E2
Sleepers Condition
Defects
Sleepers
Componant
Defects
P2
P1
Ballast
P2
Ballast Profile
Drainage
N
RailsP1
E1
Surface Defects
Rail cracks and
internal defects
Rail Wear
E2
Page 93
Page 93 of 139
Figure 6-5 Condition Assessment Interface
Loss or Failure of Insulation Material Components fail to insulate (generally causing signal failure) N/A
Joint Gap Movement Gap between rails < 6mm; Joint pulling apart - bent bolts N/A
Ineffective Drainage around Joint Water contacting foot of rail near joint N/A
Rail Head Flow across Joint RailFlow on either rail with potential to provide < 4mm gap (mechanical), or <
3mm gap (glued) between rail endsN/A
Rails 16% E2
Ballast 18% P3
Sleepers (Ties) 27% P1
Geometry 26% N
Insulated Rail Joints 13% E1
P2Railway Infrastructure
Insulated Rail Joints E1
Back to Speed Interface Proceed to Next Speed
Page 94
Page 94 of 139
6.4 Summary
This chapter presents the railway infrastructure condition assessment tool in a user-friendly and
practical interface. The collected data and the adopted techniques are all incorporated in this
automated tool through Excel sheets. The tool includes fuzzification and the defuzzification of
the sevirities values, the obtained ANP relative importance weights and the weighted sum mean
aggregation process. The input in this model is the defect severities through predefined criteria.
The output is three-level conditions: The first condition is the defect category condition; then, the
result of the first level condition aggregation is the component condition and the final level is the
overall condition. Moreover, the adopted condition grading scale is also incorporated into this
model along with color coding for each linguistic condition. To conclude, this automated tool is
designed for all users from practitioners to decision-makers who perform railway condition
assessment in a practical and user-friendly manner.
Page 95
Page 95 of 139
7CHAPTER VII: CONCLUSIONS AND RECOMMENDATIONS
7.1 Research Overview
As one of the main infrastructural elements for countries, railways play a key role in the
development of the civilizations in terms of passengers and goods transport. Like any other
infrastructure, railway infrastructure suffers from extensive deterioration due to continuous
loading, high train speeds, frequent weather changes, improper maintenance, lack of inspection
and uncertain condition judgments. According to the US Federal Railroad Administration Office
of Safety Analysis (Administration 2014), track defects are the second major cause of railway
accidents in the US. The first major cause of railway accidents is human error, as reported.
Although not reported by FRA, it is acknowledged by the National Transportation Safety Board
(NTSB) that poor management of rail accidents is caused by the lack of proper rail inspections.
In order to reduce the major causes of railway accidents and minimize human errors, several
condition assessment models have been developed. However, most of these models have certain
limitations, like the lack of structure-based condition assessment models in most cases.
Therefore, this research develops a new model for railway infrastructure condition assessment,
using fuzzy synthetic evaluation. This model targets practitioners, inspectors, engineers,
managers and decision-makers and facilitates the prioritization of the maintenance and
rehabilitation work.
To build this model, the infrastructure of the railway is divided into five main components, rails,
sleepers (ties), ballast, track geometry and insulated rail joints. Then, defects concerning each of
the above-mentioned components are categorized based on the nature of defects. Moreover,
online and hard copy questionnaires are developed for experts’ opinions to define the relative
Page 96
Page 96 of 139
importance weight of the components, defects categories and defects. Based on the fourteen
collected surveys, an ANP model has been created using SuperDecisions software to find the
weights. Furthermore, defect severities have been gathered through Australian manuals.
Accordingly, fuzzy membership functions are developed to uniform the different defect
measuring criteria and to define the linguistic severity levels with numerical values. The output
of the fuzzy membership functions are used along with the ANP weights as input in the
developed WSM to aggregate the severities and the weights, to find the condition for the defect
categories, the components and the overall aggregated condition. Finally, fuzzification is used to
translate the outputs of the WSM back to a linguistic condition, to be used by decision-makers
for rehabilitation purposes.
7.2 Research Conclusions
The following conclusions can be deduced from the development, implementation and testing of
this research:
Based on the questionnaire analysis, most of the professional participants in this study
share one point of view when it comes to the comparison between two components,
defect categories and defects; this shows the credibility of the weights.
Based on the weight analysis, the sleepers have the highest weight (27%) among the
components, followed by geometry weight with a slight difference (26%) and then, the
ballast, rail and insulated rail joints with the weights of 18%, 16%, 13% – respectively.
The rail internal defect category, with a weight of 41%, has the highest weight among the
rail defect categories; the highest defect weight in this category is the broken rail with a
Page 97
Page 97 of 139
weight of 26%. This result makes sense since the broken rails are one of the main causes
of railway accidents.
The sleeper condition defects have a higher weight (63%) than the sleeper component
defects (37%) and the clusters of consecutive ineffective sleeper defects have the highest
weight (52%).
The drainage defects in the ballast has a higher weight (55%) than the profile defects
(45%) and the highest weight among the defects goes to the fouling (62%).
The twist defect has the highest weight (32%) among all the geometry defects.
The joint gap movement has the highest weight among all the defects that occur in the
insulated rail joints.
The implementation of two case studies to validate the developed model shows similar
results when they are compared with the actual results. Based on the results in Case 1, the
sleepers and the ballast are in a dire condition, which means maintenance is required and
the decision provided on the case studies are the same. Based on the results in Case 2, the
track is in good condition and the sleepers have minor defects only, which does not affect
the integrity of the track. The provided decision indicates the same situation.
The model gives Emergency 1 condition if all defects are in their worst condition, even if
these conditions do not reach Emergency 1 as individuals.
The developed model gives a detailed condition of the defect categories, the components
and an overall condition to help managers and decision-makers in choosing the precise
maintenance and rehabilitation actions. Otherwise, the overall condition can be
misleading as it is defined by five components.
Page 98
Page 98 of 139
The sensitivity analysis shows that the change of the component weights doesn’t have a
considerable influence on the overall condition.
7.3 Research Contributions
This study has made the following contributions through the development of the new railway
condition assessment model, including but not limited to:
Developing a railway infrastructure defect hierarchy, including components, defect
categories and defects that cover the main components and defects.
Developing a condition assessment model that covers six different speed levels of the
railway system.
Incorporating interdependency among the component, defect categories and defects.
Developing a fuzzy synthetic evaluation model, including a customized WSM working
platform to aggregate the weights and severities.
Developing a railway infrastructure condition assessment spreadsheet, using Excel to
cover the six speed levels of the tracks and to cover all different components and their
defects for deducing an index that represents the whole railway infrastructure.
7.4 Research Limitations
This developed model has the following limitations:
The model is based on a firm defect hierarchy that, if changed, would require the ANP
model and WSM model change as well.
Page 99
Page 99 of 139
The fuzzy membership functions are calculated based on structured sets of input, e.g.
defect severities. When different criteria are used, the model input has to change.
The model does not take any deterioration factors into account.
Only fourteen questionnaires are collected.
7.5 Future Work Recommendations
The model has been developed to accomplish the research objectives set in this study. When
developed, the model has been implemented in case studies and its accuracy is proved by the
results. However, the model can be expanded further. The ways to enhance the model and
advance it are as follows:
7.5.1 Enhancements
Other case studies with various component conditions to cover all possibilities can be
used for the validation and a better understanding of the developed model. Other railway
industries could be reached since the case studies used to validate this model are limited
to a certain condition that circles around Normal and Priority 2. Besides, neither of the
case studies use geometry data.
Other railway infrastructure components and defects, such as subgrade, can be added to
the model. This will give a better representation of the track condition and cover a wider
range of components and defects.
More experts can be reached to participate in the data collection stage, leading to a wider
range of feedback and experience. As previously mentioned, the weight calculation has
been based on fourteen sets of feedback from engineers in Canada. Besides, a larger
variety of track supervisors, e.g. in maintenance and construction, can be approached.
Page 100
Page 100 of 139
7.5.2 Extensions
More inspection technologies can be incorporated in the developed model to obtain
accurate defect measurements. The development of new technologies and advancing the
existing ones are always in progress.
The spreadsheet can be developed to read the collected data from the track recording cars
and other inspection technologies directly and automatically without the need for users to
interpret them manually; this will save time and provision more accurate results.
A condition prediction model can be designed, in which historical inspection sheets are
imported and analyzed automatically using this mode. The historical data condition can
be found by the existing model and the conditions will be analyzed to predict the
deterioration process. As a result, time and money on data preparation could be saved
rather than wasted.
The developed model can be integrated with a rehabilitation and maintenance
methodology through mapping each defect to its most suitable maintenance method. As a
result, time is saved and more accurate decisions are made.
A risk assessment model can be developed based on the developed condition assessment
model. So is the prediction model to determine the risks of delaying the maintenance and
to have a full life cycle of the railway infrastructure condition.
Page 101
Page 101 of 139
REFERENCES
Anderson, M. (2002). Strategic planning of track maintenance. Department of
Infrastructure, Borlänge, Sweden.
AREMA. (2013). American railway engineering and maintenance-of-way association.
Manual for railway engineering, American Railway Engineering and Maintenance-of-
Way Association, Lanham, Maryland.
Barragan, A., Cembrero, P., Caceres, N., and Schubert, F. (2011). Automated and cost
effective railway infrastructure maintenance. ACEM-Rail – 265954, Málaga, Spain.
Büyükyazici, M., and Sucu, M. (2003). “The analytic hierarchy and analytic network
processes.” CRITERION, 1, c1.
Cerniglia, D., Garcia, G., Kalay, S., and Prior, F. (2006). “Application of laser induced
ultrasound for rail inspection.” Proceedings of the World Congress in Railway Research.
Montreal, Canada.
Esveld, C. (2001). Modern railway track, 2nd Edition. MRT-productions Zaltbommel,
The Netherlands, Delft, Netherlands.
Federal Railway Association. (2011). “Office of Railway Safety Reports.” Rail
Equipment Accidents and Incidents Reports, <http:// safetydata.fra.dot.gov/
officeofsafety/ default.aspx> (Dec. 25, 2016).
Ferreira, L., and Murray, M. H. (1997). “Modelling rail track deterioration and
maintenance: current practices and future needs.” Transport Reviews, Taylor & Francis,
17(3), 207–221.
Page 102
Page 102 of 139
Görener, A. (2012). “Comparing AHP and ANP: an application of strategic decisions
making in a manufacturing company.” International Journal of Business and Social
Science, Centre for Promoting Ideas, USA, 3(11).
Grassie, S. L., and Kalousek, J. (1993). “Rail corrugation: characteristics, causes and
treatments.” Proceedings of the Institution of Mechanical Engineers, Part F: Journal of
Rail and Rapid Transit, SAGE Publications Sage UK: London, England, 207(1), 57–68.
Hassankiadeh, S. J. (2011). “Failure analysis of railway switches and crossings for the
purpose of preventive maintenance.” KTH Royal Institute of Technology. Stockholm,
Sweden.
Herrmann, Andrew W. (2013) “ASCE 2013 Report Card for America's Infrastructure. “
In IABSE Symposium Report, vol. 99, no. 33, pp. 9-10. International Association for
Bridge and Structural Engineering, Washington, USA.
Helff, F., Gruenwald, L., and d’Orazio, L. (2016). “Weighted Sum Model for Multi-
Objective Query Optimization for Mobile-Cloud Database Environments.” EDBT/ICDT
Workshops. Bordeaux, France.
Kabir, G., Sadiq, R., and Tesfamariam, S. (2014). “A review of multi-criteria decision-
making methods for infrastructure management.” Structure and Infrastructure
Engineering, Taylor & Francis, 10(9), 1176–1210.
Kumar, S. (2006). “A study of the rail degradation process to predict rail breaks.” Luleå
tekniska universitet, Division of Operation and Maintenance Engineering. Luleå,
Sweden.
Lim, W. L. (2004). “Mechanics of railway ballast behavior.” University of Nottingham,
Department of Civil Engineering. Nottingham, United Kingdom.
Liu, X., Lovett, A., Dick, T., Rapik Saat, M., and Barkan, C. P. L. (2014). “Optimization
of Ultrasonic Rail-Defect Inspection for Improving Railway Transportation Safety and
Efficiency.” Journal of Transportation Engineering, American Society of Civil Engineers,
140(10), 4014048.
Page 103
Page 103 of 139
Madejski, J., and Grabczyk, J. (2002). “Continuous geometry measurement for
diagnostics of tracks and switches.” International Conference on Switches: Switch to
Delft. Delft University of Technology. Delft, Netherlands
Mamdani, E. H. (1974). “Application of fuzzy algorithms for control of simple dynamic
plant.” Proceedings of the Institution of Electrical Engineers, 1585–1588.
Metari, S. (2013). Automatic Track Inspection Using 3D Laser Profilers 1 to Improve
Rail Transit Asset Condition Assessment and State of Good Repair – A Preliminary
Study. Transportation Research Board 93rd Annual Meeting. No. 14-2342. 2014.
Mundrey, J. (2003). Railway track engineering, 3rd Edition. McGraw-Hill Publishing.
New Delhi, India.
Office of Railroad Safety. (2014). Federal Railroad Administration Track and Rail and
Infrastructure Integrity Compliance Manual. Federal Railroad Administration,
Washington, DC, United States of America.
Ph Papaelias, M., Roberts, C., and Davis, C. L. (2008). “A review on non-destructive
evaluation of rails: state-of-the-art and future development.” Proceedings of the
Institution of Mechanical Engineers, Part F: Journal of Rail and rapid transit, SAGE
Publications Sage UK: London, England, 222(4), 367–384.
RailCorp, T. M. C. (2012). “226: Rail Defects Handbook.” RailCorp Engineering
Manual, Sydney, Australia.
Ross, T. J. (2009). Fuzzy logic with engineering applications, 3rd Edition. John Wiley &
Sons. Chichester, West Sussex, United Kingdom.
Sadeghi, J. M., and Askarinejad, H. (2011). “Development of track condition assessment
model based on visual inspection.” Structure and Infrastructure Engineering, Taylor &
Francis, 7(12), 895–905.
Page 104
Page 104 of 139
Sadeghi, J., and Askarinejad, H. (2012). “Application of neural networks in evaluation of
railway track quality condition.” Journal of mechanical science and technology, Springer,
26(1), 113–122.
Salah, A. (2012). Fuzzy Set-based Contingency Estimating and Management. Concordia
University, MSc Dissertation, Department of Building, Civil and Environmental
Engineering, Montreal, QC Canada.
Su, L. (2009). “Rail track condition assessment using ground penetrating radar.”
Proceeding of AusRAIL PLUS conference 2009, 17-19 November 2009, Adelaide, South
Australia.
Transport Canada. (2012). Rules Respecting Track Safety. TC E-54. Ottawa, ON.
Canada.
Uzarski, D. R. (1993). Development of Condition Indexes for Low Volume Railroad
Track. USA: US Army Corps of engineering. Technical Report No.FM-93/14, USACER
(1993). Washington, D.C., United States.
Wilson, A. (2011). TMC 224 Rail Defects and Testing Version 4.5. RailCorp
Engineering, Sydney, Australia.
Wilson, A. (2013). TMC 203 Track Inspection Version 5.3. RailCorp Engineering,
Sydney, Australia.
Wong, K. C., and So, A. T. P. (1995). “A fuzzy expert system for contract decision
making.” Construction Management and Economics, Taylor & Francis, 13(2), 95–103.
Yang, C. L., Chuang, S. P., Huang, R. H., and Tai, C. C. (2008). “Location selection
based on AHP/ANP approach.” Industrial Engineering and Engineering Management,
2008. IEEM 2008. IEEE International Conference on, 1148–1153.
Zakeri, J.-A., and Rezvani, F. H. (2012). “Failures of railway concrete sleepers during
service life.” International Journal of Construction Engineering and Management,
Scientific & Academic Publishing, 1(1), 1–5.
Page 105
Page 105 of 139
Zarembski, A. M., Grissom, G. T., and Euston, T. L. (2013). “Use of ballast inspection
technology for the prioritization, planning and management of ballast delivery and
placement.” American Railway Engineering Association Annual Conference,
Indianapolis, IN.
Zheng, Y.-P., and Mak, A. F. T. (1996). “An ultrasound indentation system for
biomechanical properties assessment of soft tissues in-vivo.” IEEE transactions on
biomedical engineering, IEEE, 43(9), 912–918.
Page 106
Page 106 of 139
APPENDICEIES
Appendix A
Questionnaire
Page 107
Page 107 of 139
Defect - Based Condition Assessment Model of Railway infrastructure
Online survey: http://www.surveyexpression.com/Survey.aspx?id=bd6d6d6f-3670-4f65-91e5-2eb9cd5c7543
Dear Sir/Madam
It is of great appreciation that you would take some time to fill the following questionnaire. The purpose is to identify the relative importance and effect of the elements, components, and defects affecting the integrity of Railway infrastructure condition. The questionnaire is used for an academic research under the supervision of Dr. Tarek Zayed at Concordia University, Montreal, Canada, to build a defect-based condition assessment model for Railway infrastructure. Based on literature review, the following is a hierarchy of defects that helps answering various questions.
Railway infrastructure
Rails
Surface defects
Rail cracks and internal defects
Rail wear defects
sleepers(Rail ties)
Concrete sleeper component
Sleeper Condition Defects
Ballast
Drainage
Ballast Breakdown
Ballast profile
Insulated Rail Joints
insulated rail joints defects
Track geometry
geometry defects
Page 108
Page 108 of 139
PART (1) : GENERAL INFORMATION:
1. How do you describe your occupation? Organization Manager
Construction Manager
Project Manager
Others __________________
2. Which best describes your working experience? Less than 5 years 6 -10 years
11 – 15 years 16 – 20 years
More than 20 years
3. How do you describe your organization?
Public Owner Consultant NGOs
International Agency Implementing Agency Others ________________
PART (2): PAIRWISE COMPARISON In an attempt to determine the degree of importance of defects affecting the Railway infrastructure condition, kindly fill the tables in the next pages by ticking () in the appropriate box from your point of view: Example:
Example: In the table below consider comparing “Rails” (Criterion X) with “Sleepers” (Criterion Y) with respect to the “Railway infrastructure”
Criterion (X)
Degree of Importance
Criterion (Y)
Remarks
(9)
Absolu
te
(7)
Very
Str
on
g
(5)
Str
on
g
(3)
Modera
te
(1)
Equ
al
(3)
Modera
te
(5)
Str
on
g
(7)
Very
Str
on
g
(9)
Absolu
te
Railway infrastructure
Rails
Sleepers
Ballast
If you consider that Rails is more important than Sleepers and the degree
of this importance is Strong, then tick () here
If you consider that both the Rails and Sleepers have Equal importance, then tick
() here
If you consider that Sleepers is more important than Rails and the degree of
this importance is Absolute, then tick () here
Page 109
Page 109 of 139
1) Pairwise Comparison between Elements and Components with respect to Goal: Railway
With respect to “Railway infrastructure” how important is criterion “X” or “Y” when compared to each other?
Criterion (X)
Degree of Importance
Criterion (Y)
Remarks (9
) A
bsolu
te
(7)
Very
Str
on
g
(5)
Str
ong
(3)
Mode
rate
(1)
Equ
al
(3)
Mode
rate
(5)
Str
ong
(7)
Very
Str
on
g
(9)
Absolu
te
Railway infrastructure
Rails
Ballast
Sleepers Insulated rail joints Track geometry
Rails
Surface defects
Rail cracks and internal defects
Rail wear defects
Ballast
Drainage
Ballast profile
Ballast Breakdown
Sleepers
Concrete sleeper component
Sleeper Condition Defects
Rails
Ballast
Sleepers Insulated rail joints Track geometry
Sleepers
Rails
Ballast Insulated rail joints Track geometry
Ballast
Sleepers
Rails Insulated rail joints Track geometry
Track geometry
Insulated rail joints
Rails Sleepers Ballast
Insulated rail joints
Track geometry
Rails Sleepers Ballast
Page 110
Page 110 of 139
Rails Rails
Rail cracks and internal defects Defective Welds
Broken rail
Bolt Hole Cracks
Head and Web separation
Foot and Web separation
Compound Fissure
Piped Rail
Crushed Head
surface defects Rail Corrosion
Fish Scaling; Spalling
Rail Contact fatigue
Wheel Burns
Notches
Surface Squats
Rail wear defects Curve Wear
Tangent Wear
Head Loss Max %
Criterion (X)
Degree of Importance
Criterion (Y)
Remarks
(9)
Absolu
te
(7)
Very
Str
on
g
(5)
Str
ong
(3)
Mode
rate
(1)
Equ
al
(3)
Mode
rate
(5)
Str
ong
(7)
Very
Str
on
g
(9)
Absolu
te
Rail cracks and internal defects
Surface defects Rail wear defects
Rail wear defects
Surface defects Rail cracks and internal defects
Surface Defects
Rail wear defects
Rail cracks and internal defects
Rail cracks and internal defects
Rail Cracks
Defective Welds
Broken rail
Bolt Hole Cracks
Head and Web separation
Foot and Web separation
Compound Fissure
Surface Defects
Rail Corrosion
Fish Scaling, Spalling
Rail Contact fatigue
Wheel Burns
Page 111
Page 111 of 139
Ballast:
Ballast
Profile defects
Ballast deficiency
Excess Ballast
Drainage
vigitation growth
Ballast fouling
Ballast breakdown
Breakage of the Sharp Edge
Plastic Deformation in
Ballast
Surface Squats
Notches
Rail wear defects
Tangent Wear Curve Wear
Head Loss Max %
Criterion (X)
Degree of Importance
Criterion (Y)
Remarks
(9)
Absolu
te
(7)
Very
Str
on
g
(5)
Str
ong
(3)
Mode
rate
(1)
Equ
al
(3)
Mode
rate
(5)
Str
ong
(7)
Very
Str
on
g
(9)
Absolu
te
Ballast profile
Drainage Ballast Breakdown
Ballast Breakdown
Drainage Ballast profile
Drainage
Ballast Breakdown Ballast profile
Ballast profile
Ballast deficiency Excess Ballast
Ballast Breakdown
Breakage of the Sharp Edge
Plastic Deformation in Ballast
Drainage
Vegetation Growth Ballast fouling
Page 112
Page 112 of 139
Sleepers: Sleepers
sleeper components defects Squeezed out missing or failed insulators
Severely worn sleeper pads
Loose or Ineffective Fish Bolts
Swage Fastenings at Fish-Plated Joint
Sleeper Condition Defects Consecutive Missing Sleepers
Spacing
Clusters of Consecutive Ineffective Sleepers
Rail Movement relative to sleeper, including effect of rail
Timber sleepers defects Ineffective Timber Sleepers at Joints
General Condition Description Timber Sleepers
Criterion (X)
Degree of Importance
Criterion (Y)
Remarks
(9)
Absolu
te
(7)
Very
Str
on
g
(5)
Str
ong
(3)
Mode
rate
(1)
Equ
al
(3)
Mode
rate
(5)
Str
ong
(7)
Very
Str
on
g
(9)
Absolu
te
Sleepers
sleeper component defects
Sleeper Condition Defects
Sleeper condition defects
Clusters of Consecutive Ineffective Sleepers
Consecutive Missing Sleepers
Spacing
Rail Movement relative to sleeper, including effect of rail roll
Sleeper component defects
Loose or Ineffective Fish Bolts
Squeezed out missing or failed insulators
Swage Fastenings at Fish-Plated Joint
Severely worn sleeper pads
Timber Sleeper defects
General Condition Description Timber Sleepers
Ineffective Timber Sleepers at Joints
Page 113
Page 113 of 139
Track Geometry: Geometry defects
Gauge
Horizontal alignment
Top Vertical alignment
Twist
Cross level variation
Insulated Rail Joints: Insulated Rail Joints Defects
Loss or failure of insulation material
Joint Gap Movement
Ineffective Drainage around Joint
Rail head flow across joint Rail
Loss or failure of insulation material
Criterion (X)
Degree of Importance
Criterion (Y)
Remarks
(9)
Absolu
te
(7)
Very
Str
on
g
(5)
Str
ong
(3)
Mode
rate
(1)
Equ
al
(3)
Mode
rate
(5)
Str
ong
(7)
Very
Str
on
g
(9)
Absolu
te
Track geometry
Cross level variation
Gauge
Horizontal alignment
Top Vertical alignment
Twist
Criterion Degree of Importance Criterion
Page 114
Page 114 of 139
Thank You for Filling this Questionnaire.
Contact Me at:
Laith El-khateeb, BSCE, Graduate Research Assistant
Department of Building, Civil and Environmental Engineering, Concordia University, Montreal, QC
Email: [email protected]
Phone: (514) 848-2424 ext. 7091
(X)
(9)
Absolu
te
(7)
Very
Str
on
g
(5)
Str
ong
(3)
Mode
rate
(1)
Equ
al
(3)
Mode
rate
(5)
Str
ong
(7)
Very
Str
on
g
(9)
Absolu
te
(Y)
Remarks
Insulated Rail Joints
Joint Gap Movement
Loss or failure of insulation material
Ineffective Drainage around Joint
Rail head flow across joint Rail
Loss or failure of insulation material
Page 115
Page 115 of 139
Appendix B
Defects Severities
Page 116
Page 116 of 139
Defects Severities
Speed 20 km/hr
Page 117
Page 117 of 139
Parts
Defects
Categorie
s
Defects N P3 P2 P1 E2 E1
Fish
Scaling;
Spalling
No surface
cracking in
gauge
corner or
on rail
head
Minor
Spalling
Present:
Gauge
Corner,
and Top of
rail head
Significant
Spalling
Present:
Gauge
Corner,
and Top of
rail head
Rail
Contact
fatigue
No visible
cracking
on rail
head
Cracks
visible
Cracks
1mm deep
or TDS
potentially
hidden
during
ultrasonic
testing
TDM
potentially
hidden
during
ultrasonic
testing
TDL
potentially
hidden
during
ultrasonic
testing
Rail
Corrosion>15 13-15 <13
Wheel
Burns
No Wheel
Burns
Indents or
Head Flow
Visible
Indents
1mm or
signs of
minor
ballast
disturbanc
e
Indents
2mm or
ballast
disturbanc
e or minor
track
geometry
deteriorati
on
Broken rail 0-50 51-100 >100
Compound
Fissure
4.9% or
less
5% to
69.9%
70% to
99.9%1
Defective
Welds40 to 56 57 to 90 over 90
Foot and
Web
separation
20 to 40 41 to 75 76 to 150 Over 150
Head and
Web
separation
20 to 75 76 to 200 over 200
Rail cracks <4 4 to 10 >10
Head Loss
Max %0.55
Curve
Wear52 48
Tangent
Wear32 26
Speed 20 Km/hour
Rails
Surface
defects
Rail cracks
and
internal
defects
Rail wear
Page 118
Page 118 of 139
Excess
Ballast
Profile as
specified
Surplus
ballast in
excess of
specified
profile
exists
Potential to
interfere
with
correct
function of
track
Ballast
defecincy0-6 6-12 >12
Fouling
Minimal
fines in
ballast,
Fines in
ballast,
visible
contaminat
ion on
surface of
ballast
Ballast
fouled by
fines and
debris
Saturated
Ballast
visibly
pumping
and unable
to maintain
track within
geometry
maintenanc
e limits
Vegitation
Growth
Minimum
vegetation
Some
vegetation
are
blocking
the voids
Highly
vegetated
that cause
water being
trapped in
the ballast
Clusters of
Consecuti
ve
Ineffective
Sleepers
0-2 3 4 5 >5
Consecuti
ve
Missing
Sleepers
0 1 2 >2
Spacing <900 mm 900-1200 1200-1500 >1500
Loose or
Ineffective
Fish Bolts
No Yes
Severely
worn
sleeper
pads
No Yes
Squeezed
out
missing or
failed
insulators
No Yes
Swage
Fastenings
at Fish-
Plated
Joint
No Yes
Sleepers
(Ties)
Sleepers
Condition
Defects
Sleepers
Componan
t Defects
Ballast
Ballast
Profile
Drainage
Page 119
Page 119 of 139
Geometr
y
Geometr
y
Gauge 21-30 31-32 33-34 35-37 >3
7
Horizontal
alignment >39 40-48 49-52 53-54
>5
4
Top
Vertical
alignment
0-30 31-32 33-34 35-40 >4
0
Twist <52 53-59 60-64 65-70 >7
0
Cross
level
variation
<60 61-66 67-71 72-75 >7
5
Insulated
Rail
Joints
Insulated
Rail
Joints
Loss or
failure of
insulation
material
No
insulation
material
failure
Insulation
material
visibly
cracked or
disintegrated
Component
s fail to
insulate
(generally
causing
signal
failure)
Joint Gap
Movemen
t
No joint
closing
Insulation
key being
squeezed
out; Joint
pulling apart
- visible gap
at insulation
key
Gap between
rails < 6mm;
Joint pulling
apart - bent
bolts
Ineffectiv
e
Drainage
around
Joint
No
ineffectiv
e drainage
Water lying
in joint
vicinity
Water
contactin
g foot of
rail near
joint
Rail head
flow
across
joint Rail
No head
flow
Flow on
either rail
with
potential to
provide <
6mm gap
(mechanical)
, or < 4mm
gap (glued)
between rail
ends
Flow on
either rail
with
potential to
provide <
4mm gap
(mechanical)
, or < 3mm
gap (glued)
between rail
ends
Page 120
Page 120 of 139
Defects Severities
Speed 40 km/hr
Page 121
Page 121 of 139
PartsDefects
CategoriesDefects N P3 P2 P1 E2 E1
Fish
Scaling;
Spalling
No surface
cracking in
gauge
corner or on
rail head
Minor
Spalling
Present:
Gauge
Corner, and
Top of rail
head
Significant
Spalling
Present:
Gauge
Corner, and
Top of rail
head
Rail Contact
fatigue
No visible
cracking on
rail head
Cracks
visible
Cracks 1mm
deep or
TDS
potentially
hidden
during
ultrasonic
testing
TDM
potentially
hidden
during
ultrasonic
testing
TDL
potentially
hidden
during
ultrasonic
testing
Rail
Corrosion>15 13-15 <13
Wheel
Burns
No Wheel
Burns
Indents or
Head Flow
Visible
Indents 1mm
or signs of
minor ballast
disturbance
Indents 2mm
or ballast
disturbance
or minor
track
geometry
deterioration
Broken rail 0-50 51-100 >100
Compound
Fissure
4.9% or
less
5% to
69.9%
70% to
99.9%1
Defective
Welds40 to56 57 to 90 over 90
Foot and
Web
separation
20 to 40 41 to 75 76 to 150
Head and
Web
separation
20 to 75 76 to 200 over 200
Rail cracks <4 4 to 10 >10
Head Loss
Max %0.55
Curve Wear 52 48
Tangent
Wear26 32
Rails
Surface
defects
Rail cracks
and internal
defects
Rail wear
Speed 40 Km/hour
Page 122
Page 122 of 139
Excess
Ballast
Profile as
specified
Surplus
ballast in
excess of
specified
profile exists
Potential to
interfere with
correct
function of
track or
Ballast
defecincy0-6 6-13 13-16 >16
Fouling
Minimal fines
in ballast,
Fines in
ballast,
visible
contaminatio
n on surface
of ballast
Ballast
fouled by
fines and
debris
Ballast
visibly
pumping
and unable
to maintain
track within
geometry
maintenance
limits
Vegitation
Growth
minimum
vegetation
some
vegetation
are blocking
the voids
highly
vegetated
that cause
water being
trapped in
the ballast
Clusters of
Consecutive
Ineffective
Sleepers
0-2 3 4 5 >5
Consecutive
Missing
Sleepers
Nil 1 2 >2
Spacing <900 mm 900-1200 1200-1500 >1500
Loose or
Ineffective
Fish Bolts
N Y
Severely
worn
sleeper
pads
N Y
Squeezed
out missing
or failed
insulators
N Y
Swage
Fastenings
at Fish-
Plated Joint
N Y
Sleepers
Condition
Defects
Sleepers
Componant
Defects
Ballast
Ballast
Profile
Drainage
Sleepers
(Ties)
Page 123
Page 123 of 139
Gauge 21-28 29-30 31-32 33-34 35-37 >37
Horizontal
alignment>29 30-39 40-48 49-52 53-54 >54
Top Vertical
alignment0-27 28-30 31-32 33-34 35-40 >40
Twist <46 47-52 53-59 60-64 65-70 >70
Cross level
variation<55 56-60 61-66 67-71 72-75 >75
Loss or
failure of
insulation
material
No
insulation
material
failure
Insulation
material
visibly
cracked or
disintegrated
Components
fail to
insulate
(generally
causing
signal
failure)
Joint Gap
Movement
No joint
closing
Insulation
key being
squeezed
out; Joint
pulling apart
- visible gap
at insulation
key
Gap
between
rails < 6mm;
Joint pulling
apart - bent
bolts
Ineffective
Drainage
around Joint
No
ineffective
drainage
Water lying
in joint
vicinity
Water
contacting
foot of rail
near joint
Rail head
flow across
joint Rail
No head
flow
Flow on
either rail
with potential
to provide <
6mm gap
(mechanical
), or < 4mm
gap (glued)
between rail
ends
Flow on
either rail
with potential
to provide <
4mm gap
(mechanical
), or < 3mm
gap (glued)
between rail
ends
Insulated
Rail Joints
Insulated
Rail Joints
Geometry Geometry
Page 124
Page 124 of 139
Defects Severities
Speed 60km/hr
Page 125
Page 125 of 139
PartsDefects
CategoriesDefects N P3 P2 P1 E2 E1
Fish
Scaling;
Spalling
No surface
cracking in
gauge
corner or on
rail head
Minor
Spalling
Present:
Gauge
Corner, and
Top of rail
head
Significant
Spalling
Present:
Gauge
Corner, and
Top of rail
head
Rail Contact
fatigue
No visible
cracking on
rail head
Cracks
visible
Cracks 1mm
deep or
TDS
potentially
hidden
during
ultrasonic
testing
TDM
potentially
hidden
during
ultrasonic
testing
TDL
potentially
hidden
during
ultrasonic
testing
Rail
Corrosion>15 13-15 <13
Wheel
Burns
No Wheel
Burns
Indents or
Head Flow
Visible
Indents 1mm
or signs of
minor ballast
disturbance
Indents 2mm
or ballast
disturbance
or minor
track
geometry
deterioration
Broken rail 0-50 51-100 >100
Compound
Fissure
4.9% or
less
5% to
69.9%
70% to
99.9%1
Defective
Welds40 to 56 57 to 90 over 90
Foot and
Web
separation
20 to 40 41 to 75 76 to 150 Over 150
Head and
Web
separation
20 to 75 76 to 200 over 200
Rail cracks <4 4 to 10 >10
Head Loss
Max %0.55
Curve Wear 52 48
Tangent
Wear32 26
Speed 60 Km/hour
Rails
Surface
defects
Rail cracks
and internal
defects
Rail wear
Page 126
Page 126 of 139
Excess
Ballast
Profile as
specified
Surplus
ballast in
excess of
specified
profile exists
Potential to
interfere with
correct
function of
track
Ballast
defecincy0-6 6-10 10-14 >14
Fouling
Minimal fines
in ballast,
Fines in
ballast,
visible
contaminatio
n on surface
of ballast
Ballast
fouled by
fines and
debris
Ballast
visibly
pumping
and unable
to maintain
track within
geometry
maintenance
limits
Vegitation
Growth
Minimum
vegetation
Some
vegetation
are blocking
the voids
Highly
vegetated
that cause
water being
trapped in
the ballast
Clusters of
Consecutive
Ineffective
Sleepers
0-2 3 4 5 >5
Consecutive
Missing
Sleepers
Nil 1 2 >2
Spacing <900 mm 900-1200 1200-1500 >1500
Loose or
Ineffective
Fish Bolts
No Yes
Severely
worn sleeper
pads
No Yes
Squeezed
out missing
or failed
insulators
No Yes
Swage
Fastenings at
Fish-Plated
Joint
No Yes
Sleepers
(Ties)
Sleepers
Condition
Defects
Sleepers
Componant
Defects
Ballast
Ballast
Profile
Drainage
Page 127
Page 127 of 139
Gauge 21-26 27-28 29-30 31-32 33-37 >37
Horizontal
alignment>20 21-29 30-39 40-48 49-54 >54
Top Vertical
alignment0-24 25-27 28-30 31-32 33-40 >40
Twist <40 41-46 47-52 53-59 60-70 >70
Cross level
variation<50 51-55 56-60 61-66 67-75 >75
Loss or failure
of insulation
material
No
insulation
material
failure
Insulation
material
visibly
cracked or
disintegrated
Components
fail to
insulate
(generally
causing
signal
failure)
Joint Gap
Movement
No joint
closing
Insulation
key being
squeezed
out; Joint
pulling apart
- visible gap
at insulation
key
Gap
between
rails < 6mm;
Joint pulling
apart - bent
bolts
Ineffective
Drainage
around Joint
No
ineffective
drainage
Water lying
in joint
vicinity
Water
contacting
foot of rail
near joint
Rail head flow
across joint
Rail
No head
flow
Flow on
either rail
with potential
to provide <
6mm gap
(mechanical
), or < 4mm
gap (glued)
between rail
ends
Flow on
either rail
with potential
to provide <
4mm gap
(mechanical
), or < 3mm
gap (glued)
between rail
ends
Geometry
Insulated
Rail Joints
Insulated
Rail Joints
Geometry
Page 128
Page 128 of 139
Defects Severities
Speed 80 km/hr
Page 129
Page 129 of 139
PartsDefects
CategoriesDefects N P3 P2 P1 E2 E1
Fish
Scaling;
Spalling
No surface
cracking in
gauge
corner or on
rail head
Fish Scaling
present:
Gauge
Corner, and
Top of rail
head
Minor
Spalling
Present:
Gauge
Corner, and
Top of rail
head
Significant
Spalling
Present:
Gauge
Corner, and
Top of rail
head
Rail Contact
fatigue
No visible
cracking on
rail head
Cracks
visible
Cracks 1mm
deep or
TDS
potentially
hidden
during
ultrasonic
testing
TDM
potentially
hidden
during
ultrasonic
testing
TDL
potentially
hidden
during
ultrasonic
testing
Rail
Corrosion>15 13-15 <13
Wheel
Burns
No Wheel
Burns
Indents or
Head Flow
Visible
Indents 1mm
or signs of
minor ballast
disturbance
Indents 2mm
or ballast
disturbance
or minor
track
geometry
deterioration
Broken rail 0-50 51-100 >100
Compound
Fissure
4.9% or
less
5% to
69.9%
70% to
99.9%1
Defective
Welds40 to 56 57 to 90 over 90
Foot and
Web
separation
20 to 40 41 to 75 76 to 150 Over 150
Head and
Web
separation
20 to 75 76 to 200 over 200
Rail cracks <4 4 to 10 >10
Head Loss
Max %0.55
Curve Wear 52 48
Tangent
Wear32 26
Speed 80-90 Km/hour
Rails
Surface
defects
Rail cracks
and internal
defects
Rail wear
Page 130
Page 130 of 139
Excess
Ballast
Profile as
specified
Surplus
ballast in
excess of
specified
profile exists
Potential to
interfere with
correct
function of
track
Ballast
defecincy0-4 4-8 8-12 12-16 >16
Fouling
Minimal fines
in ballast,
Fines in
ballast,
visible
contaminatio
n on surface
of ballast
Ballast
fouled by
fines and
debris
Ballast
visibly
pumping
and unable
to maintain
track within
geometry
maintenance
limits
Vegitation
Growth
Minimum
vegetation
Some
vegetation
are blocking
the voids
Highly
vegetated
that cause
water being
trapped in
the ballast
Clusters of
Consecutive
Ineffective
Sleepers
0-2 3 4 5 >5
Consecutive
Missing
Sleepers
Nil 1 2 >2
Spacing <900 mm 900-1200 1200-1500 >1500
Loose or
Ineffective
Fish Bolts
No Yes
Severely
worn
sleeper
pads
No Yes
Squeezed
out missing
or failed
insulators
No Yes
Swage
Fastenings
at Fish-
Plated Joint
No Yes
Drainage
Sleepers
(Ties)
Sleepers
Condition
Defects
Sleepers
Componant
Defects
Ballast
Ballast Profile
Page 131
Page 131 of 139
Gauge 21-22 23-26 27-28 29-30 31-37 >37
Horizontal
alignment>15 16-20 21-29 30-39 40-54 >54
Top Vertical
alignment0-20 21-24 25-27 28-30 31-40 >40
Twist <35 36-40 41-46 47-52 53-70 >70
Cross level
variation<40 41-50 51-55 56-60 60-75 >75
Loss or
failure of
insulation
material
No
insulation
material
failure
Insulation
material
visibly
cracked or
disintegrated
Components
fail to
insulate
(generally
causing
signal
failure)
Joint Gap
Movement
No joint
closing
Insulation
key being
squeezed
out; Joint
pulling apart
- visible gap
at insulation
key
Gap
between
rails < 6mm;
Joint pulling
apart - bent
bolts
Ineffective
Drainage
around Joint
No
ineffective
drainage
Water lying
in joint
vicinity
Water
contacting
foot of rail
near joint
Rail head
flow across
joint Rail
No head
flow
Flow on
either rail
with potential
to provide <
6mm gap
(mechanical
), or < 4mm
gap (glued)
between rail
ends
Flow on
either rail
with potential
to provide <
4mm gap
(mechanical
), or < 3mm
gap (glued)
between rail
ends
Geometry
Insulated
Rail Joints
Insulated Rail
Joints
Geometry
Page 132
Page 132 of 139
Defects Severities
Speed 100-115 km/hr
Page 133
Page 133 of 139
PartsDefects
CategoriesDefects N P3 P2 P1 E2 E1
Fish Scaling;
Spalling
No surface
cracking in
gauge
corner or on
rail head
Fish Scaling
present:
Gauge
Corner, and
Top of rail
head
Minor
Spalling
Present:
Gauge
Corner, and
Top of rail
head
Significant
Spalling
Present:
Gauge
Corner, and
Top of rail
head
Rail Contact
fatigue
No visible
cracking on
rail head
Cracks
visible
Cracks 1mm
deep or
TDS
potentially
hidden
during
ultrasonic
testing
TDM
potentially
hidden
during
ultrasonic
testing
TDL
potentially
hidden
during
ultrasonic
testing
Rail
Corrosion>15 13-15 <13
Wheel BurnsNo Wheel
Burns
Indents or
Head Flow
Visible
Indents 1mm
or signs of
minor ballast
disturbance
Indents 2mm
or ballast
disturbance
or minor
track
geometry
deterioration
Broken rail 0-50 51-100 >100
Compound
Fissure
4.9% or
less
5% to
69.9%
70% to
99.9%1
Defective
Welds40 to 56 57 to 90 over 90
Foot and
Web
separation
20 to 40 41 to 75 76 to 150 Over 150
Head and
Web
separation
20 to 75 76 to 200 over 200
Rail cracks <4 4 to 10 >10
Head Loss
Max %0.55
Curve Wear 52 48
Tangent
Wear32 26
Rail cracks
and internal
defects
Rail wear
Rails
Surface defects
Speed 100-115 Km/hour
Page 134
Page 134 of 139
Excess
Ballast
Profile as
specified
Surplus
ballast in
excess of
specified
profile exists
Potential to
interfere with
correct
function of
track
Ballast
defecincy0-4 4-8 8-10 10-16 16
Fouling
Minimal fines
in ballast,
Fines in
ballast,
visible
contaminatio
n on surface
of ballast
Ballast
fouled by
fines and
debris
Ballast
visibly
pumping
and unable
to maintain
track within
geometry
maintenance
limits
Vegitation
Growth
Minimum
vegetation
Some
vegetation
are blocking
the voids
Highly
vegetated
that cause
water being
trapped in
the ballast
Clusters of
Consecutive
Ineffective
Sleepers
0-2 3 4 5 >5
Consecutive
Missing
Sleepers
Nil 1 2 >2
Spacing <900 mm 900-1200 1200-1500 >1500
Loose or
Ineffective
Fish Bolts
No Yes
Severely
worn sleeper
pads
No Yes
Squeezed
out missing
or failed
insulators
No Yes
Swage
Fastenings at
Fish-Plated
Joint
No Yes
Sleepers
(Ties)
Sleepers
Condition
Defects
Sleepers
Componant
Defects
Ballast
Ballast Profile
Drainage
Page 135
Page 135 of 139
Gauge <21 21-22 23-26 27-28 29-34 >35
Horizontal
alignment>13 13-15 16-20 21-29 30-52 >52
Top Vertical
alignment0-16 17-20 21-24 25-27 28-34 >34
Twist <32 32-36 36-40 41-46 47-64 >65
Cross level
variation<36 36-40 41-50 51-55 56-71 >71
Loss or
failure of
insulation
material
No
insulation
material
failure
Insulation
material
visibly
cracked or
disintegrated
Components
fail to
insulate
(generally
causing
signal
failure)
Joint Gap
Movement
No joint
closing
Insulation
key being
squeezed
out; Joint
pulling apart
- visible gap
at insulation
key
Gap
between
rails < 6mm;
Joint pulling
apart - bent
bolts
Ineffective
Drainage
around Joint
No
ineffective
drainage
Water lying
in joint
vicinity
Water
contacting
foot of rail
near joint
Rail head
flow across
joint Rail
No head
flow
Flow on
either rail
with potential
to provide <
6mm gap
(mechanical
), or < 4mm
gap (glued)
between rail
ends
Flow on
either rail
with potential
to provide <
4mm gap
(mechanical
), or < 3mm
gap (glued)
between rail
ends
Geometry Geometry
Insulated
Rail Joints
Insulated Rail
Joints
Page 136
Page 136 of 139
Defects Severities
Speed 115-160 km/hr
Page 137
Page 137 of 139
PartsDefects
CategoriesDefects N P3 P2 P1 E2 E1
Fish
Scaling;
Spalling
No surface
cracking in
gauge
corner or on
rail head
Fish Scaling
present:
Gauge
Corner, and
Top of rail
head
Minor
Spalling
Present:
Gauge
Corner, and
Top of rail
head
Significant
Spalling
Present:
Gauge
Corner, and
Top of rail
head
Rail Contact
fatigue
No visible
cracking on
rail head
Cracks
visible
Cracks 1mm
deep or
TDS
potentially
hidden
during
ultrasonic
testing
TDM
potentially
hidden
during
ultrasonic
testing
TDL
potentially
hidden
during
ultrasonic
testing
Rail
Corrosion>15 13-15 <13
Wheel
Burns
No Wheel
Burns
Indents or
Head Flow
Visible
Indents 1mm
or signs of
minor ballast
disturbance
Indents 2mm
or ballast
disturbance
or minor
track
geometry
deterioration
Broken rail 0-50 51-100 >100
Compound
Fissure
4.9% or
less
5% to
69.9%
70% to
99.9%1
Defective
Welds40 to 56 57 to 90 over 90
Foot and
Web
separation
20 to 40 41 to 75 76 to 150 Over 150
Head and
Web
separation
20 to 75 76 to 200 over 200
Rail cracks <4 4 to 10 >10
Head Loss
Max %0.55
Curve Wear 52 48
Tangent
Wear32 26
Speed 115-160 Km/hour
Rails
Surface
defects
Rail cracks
and internal
defects
Rail wear
Page 138
Page 138 of 139
Excess
Ballast
Profile as
specified
Surplus
ballast in
excess of
specified
profile exists
Potential to
interfere with
correct
function of
track
Ballast
defecincy0-4 4-8 8-10 10-16 16
Fouling
Minimal fines
in ballast,
Fines in
ballast,
visible
contaminatio
n on surface
of ballast
Ballast
fouled by
fines and
debris
Ballast
visibly
pumping
and unable
to maintain
track within
geometry
maintenance
limits
Vegitation
Growth
Minimum
vegetation
Some
vegetation
are blocking
the voids
Highly
vegetated
that cause
water being
trapped in
the ballast
Clusters of
Consecutive
Ineffective
Sleepers
0-2 3 4 5 >5
Consecutive
Missing
Sleepers
Nil 1 2 >2
Spacing <900 mm 900-1200 1200-1500 >1500
Loose or
Ineffective
Fish Bolts
No Yes
Severely
worn
sleeper
pads
No Yes
Squeezed
out missing
or failed
insulators
No Yes
Swage
Fastenings
at Fish-
Plated Joint
No Yes
Ballast
Ballast
Profile
Drainage
Sleepers
(Ties)
Sleepers
Condition
Defects
Sleepers
Componant
Defects
Page 139
Page 139 of 139
Gauge <21 21-22 23-26 27-32 >33
Horizontal
alignment>13 13-15 16-20 21-48 >48
Top Vertical
alignment0-16 17-20 21-24 25-32 >32
Twist <32 32-36 36-40 41-59 >59
Cross level
variation<36 36-40 41-50 51-66 >66
Loss or
failure of
insulation
material
No
insulation
material
failure
Insulation
material
visibly
cracked or
disintegrated
Components
fail to
insulate
(generally
causing
signal
failure)
Joint Gap
Movement
No joint
closing
Insulation
key being
squeezed
out; Joint
pulling apart
- visible gap
at insulation
key
Gap
between
rails < 6mm;
Joint pulling
apart - bent
bolts
Ineffective
Drainage
around Joint
No
ineffective
drainage
Water lying
in joint
vicinity
Water
contacting
foot of rail
near joint
Rail head
flow across
joint Rail
No head
flow
Flow on
either rail
with potential
to provide <
6mm gap
(mechanical
), or < 4mm
gap (glued)
between rail
ends
Flow on
either rail
with potential
to provide <
4mm gap
(mechanical
), or < 3mm
gap (glued)
between rail
ends
Geometry
Insulated
Rail Joints
Insulated
Rail Joints
Geometry