Page 1
Department of Mechanical Engineering
Knowledge. Innovation. Leadership. www.me.iastate.edu
Department of Mechanical Engineering
Knowledge. Innovation. Leadership. www.me.iastate.edu
Hydrodynamic Characterization of 3D Fluidized Beds Using
Noninvasive TechniquesJoshua B. Drake
Department of Mechanical EngineeringIowa State University
Ames, IowaOctober 25, 2011
Department of Mechanical Engineering
Page 2
Department of Mechanical Engineering
Knowledge. Innovation. Leadership. www.me.iastate.edu
Department of Mechanical Engineering
Knowledge. Innovation. Leadership. www.me.iastate.edu
Outline
• Fluidization and Fluidized Bed Overview
• Experimental Setup
• Selected results• Repeatability and uniformity• Local gas holdup comparisons• Annular hydrodynamic
structure comparisons
• Conclusions and future work
Page 3
Department of Mechanical Engineering
Knowledge. Innovation. Leadership. www.me.iastate.edu
Department of Mechanical Engineering
Knowledge. Innovation. Leadership. www.me.iastate.edu
• Thesis committee: • Dr. Heindel, Dr. Hu, Dr. Nelson, Dr. Olsen, Dr. Subramaniam
• Portions of this work were supported by Conoco-Phillips
• The X-ray facility used in this research was funded by the National Science Foundation under award number CTS-0216367 and Iowa State University
Acknowledgements
Page 4
Department of Mechanical Engineering
Knowledge. Innovation. Leadership. www.me.iastate.edu
Department of Mechanical Engineering
Knowledge. Innovation. Leadership. www.me.iastate.edu
Fluidization and Fluidized Bed Overview
Department of Mechanical Engineering
Page 5
Department of Mechanical Engineering
Knowledge. Innovation. Leadership. www.me.iastate.edu
Department of Mechanical Engineering
Knowledge. Innovation. Leadership. www.me.iastate.edu
Fluidization Terms
• Fluidization: passing a gas vertically through a granular material until it achieves fluid-like properties
• Superficial gas velocity (Ug): volumetric gas flow rate divided by the column cross-sectional area
• Minimum fluidization velocity (Umf): the superficial gas velocity at which the particle drag is counterbalanced by gravity causing the bed to become homogeneously fluidized
• Gas holdup (e): the amount of volumetric gas in the system
Page 6
Department of Mechanical Engineering
Knowledge. Innovation. Leadership. www.me.iastate.edu
Department of Mechanical Engineering
Knowledge. Innovation. Leadership. www.me.iastate.edu
Fluidized Bed Applications
• Gas Catalytic Reactions• Reaction takes place on the surface of the catalyst with the gas phase• Fluidized Catalytic Cracking and Fischer-Tropsch processes
• Gas-Phase Reactions• Solids used as a heat carrier for either heat exchange or a reaction• Thermal cracking and coking processes
• Gas-Solid Reactions• Both gas and solids are the reactants• Coal combustion and gasification, biomass pyrolysis and gasification, and
roasting and calcination
• Physical Processes• No chemical reaction takes place• Drying, heat exchange, and coating
Page 7
Department of Mechanical Engineering
Knowledge. Innovation. Leadership. www.me.iastate.edu
Department of Mechanical Engineering
Knowledge. Innovation. Leadership. www.me.iastate.edu
Multiphase Flow Measurement
• Observational data:• Gas Holdup and Solids Concentrations• Bubble Size and Velocity• Liquid and Solid Velocities
• Techniques:• Global – system as a whole• Local – specific locations within the system• Invasive – destructive• Noninvasive – nondestructive
Page 8
Department of Mechanical Engineering
Knowledge. Innovation. Leadership. www.me.iastate.edu
Department of Mechanical Engineering
Knowledge. Innovation. Leadership. www.me.iastate.edu
Experimental setup
Department of Mechanical Engineering
Page 9
Department of Mechanical Engineering
Knowledge. Innovation. Leadership. www.me.iastate.edu
Department of Mechanical Engineering
Knowledge. Innovation. Leadership. www.me.iastate.edu
Fluidized bed geometry
10.2 cm ID reactor 15.2 cm ID reactor
Page 10
Department of Mechanical Engineering
Knowledge. Innovation. Leadership. www.me.iastate.edu
Department of Mechanical Engineering
Knowledge. Innovation. Leadership. www.me.iastate.edu
Fluidized bed geometry
61 cm
30 cm
15 cm
Freeboard chamber
Reactor chamber
Aeration plate
Plenum
Air inlet
Pressure tap
Side air injection port
61 cm
30 cm
15 cm
10.2 cm 15.24 cm
Page 11
Department of Mechanical Engineering
Knowledge. Innovation. Leadership. www.me.iastate.edu
Department of Mechanical Engineering
Knowledge. Innovation. Leadership. www.me.iastate.edu
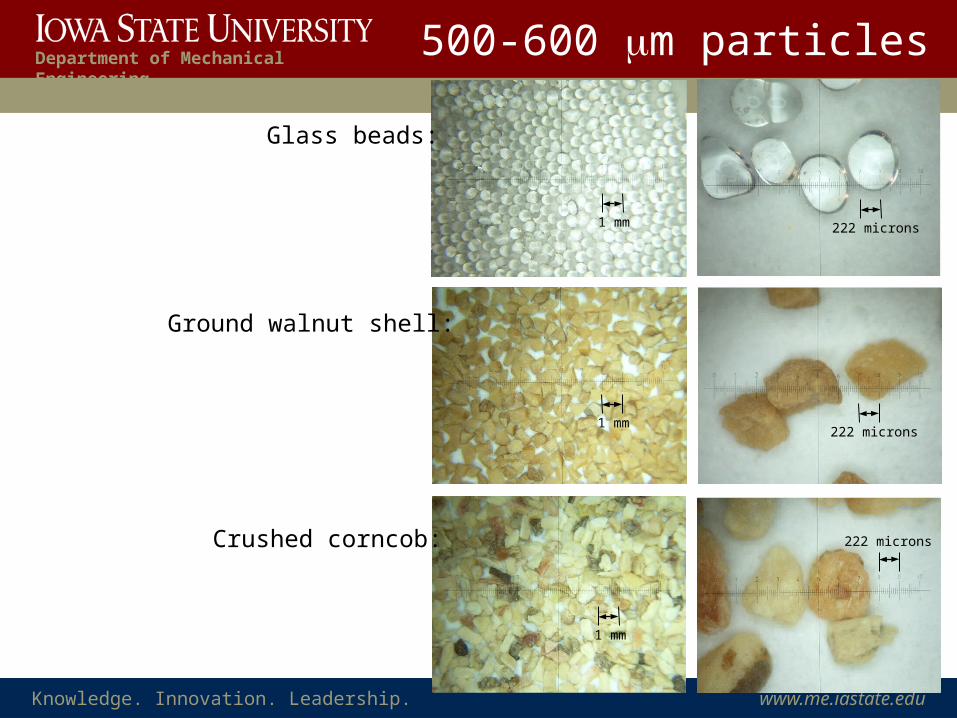
222 microns1 mm
222 microns
222 microns
1 mm
1 mm
500-600 mm particlesGlass beads:
Ground walnut shell:
Crushed corncob:
Page 12
Department of Mechanical Engineering
Knowledge. Innovation. Leadership. www.me.iastate.edu
Department of Mechanical Engineering
Knowledge. Innovation. Leadership. www.me.iastate.edu
Geldart’s Classification (Geldart, 1973)
Fluidized bed material
• Bed Materials• Glass Beads• Density: 2600 kg/m3
• Diameter: 500-600 µm• Ground Walnut Shell• Density: 1200-1400 kg/m3
• Diameter: 500-600 µm• Crushed corncob• Density: 800-1200 kg/m3
• Diameter: 500-600 µm
• Geldart type B particles
• Materials sifted multiple times
0.1
1
10
10 100 1000(r
parti
cle
-rga
s) x
10-3
[kg/
m3 ]
dparticle [mm]
C
A
BD
GlassWalnut
Corncob
Page 13
Department of Mechanical Engineering
Knowledge. Innovation. Leadership. www.me.iastate.edu
Department of Mechanical Engineering
Knowledge. Innovation. Leadership. www.me.iastate.edu
CsI phosphor screen & CCD camera
Lead shutters
Rotation ring
Test stand
15.2 cm fluidized bed reactor (in imaging region)
Image intensifier & CCD camera
X-ray sources
FB setup in XFloViz facility
(Heindel et al. 2008)
Page 14
Department of Mechanical Engineering
Knowledge. Innovation. Leadership. www.me.iastate.edu
Department of Mechanical Engineering
Knowledge. Innovation. Leadership. www.me.iastate.edu
X-ray CT imaging
X-ray source (cone beam)
Single CT slice location
Object to image
Rotate source/detector pair or objectMultiple radiographs from different projections are reconstructed to show internal details of object cross-section
CT slice (2D; time averaged)
X-ray detector (imaging device coupled to a CCD camera)
Multiple CT slices “stacked” together to generate a 3-D image
(Heindel et al. 2008)
Page 15
Department of Mechanical Engineering
Knowledge. Innovation. Leadership. www.me.iastate.edu
Department of Mechanical Engineering
Knowledge. Innovation. Leadership. www.me.iastate.edu
Beam hardening calibrations
• X-ray attenuation of low energy X-rays is typically much larger than for high energy X-rays causing portions of the CT to have false signals of lower density
• Aluminum and copper filters placed in front of the X-ray source reduce low energy X-rays
• Analysis of the X-ray attenuation behavior in the observed material at various thicknesses is completed yielding a fifth-order polynomial curve fit applied to all CTs of the observed material
Uncorrected image Corrected image
Page 16
Department of Mechanical Engineering
Knowledge. Innovation. Leadership. www.me.iastate.edu
Department of Mechanical Engineering
Knowledge. Innovation. Leadership. www.me.iastate.edu
Calculating Gas Holdup
• Time-average gas holdup can be calculated from local voxel intensities for the dynamic system (I), a gas-only system (Ig), and the solid particle (Ip):
• Use static bulk bed intensity (Ib) to replace particle intensity:
• Assume homogeneous granular material for bulk density:
• Rearranging yields time-average gas holdup from measured quantities:
pg
g p
I II I
e
b pgb
g p
I II I
e
bgb
p
1 re
r
( )b g gbg
g b
I I I II I
ee
Page 17
Department of Mechanical Engineering
Knowledge. Innovation. Leadership. www.me.iastate.edu
Department of Mechanical Engineering
Knowledge. Innovation. Leadership. www.me.iastate.edu
X-ray CT slices
• CTs show local time-average gas holdup anywhere within the imaging region• Cylinder 10.2 cm or 15.2 cm in diameter by ~23 cm high with a ~0.4 mm resolution
• 2-D “slices” extracted from CT data
• CT slice locations:
3D Image x-slice y-slice
z-slice
Inje
ction
por
t
xyz
Page 18
Department of Mechanical Engineering
Knowledge. Innovation. Leadership. www.me.iastate.edu
Department of Mechanical Engineering
Knowledge. Innovation. Leadership. www.me.iastate.edu
Selected results
Department of Mechanical Engineering
• Repeatability and uniformity• Local gas holdup comparisons• Annular hydrodynamic structure comparisons
Page 19
Department of Mechanical Engineering
Knowledge. Innovation. Leadership. www.me.iastate.edu
Department of Mechanical Engineering
Knowledge. Innovation. Leadership. www.me.iastate.edu
Minimum fluidization velocity without side-air injection
• Umf decreases with:• Material density
• As material density decreases, energy needed to move particulate decreases
Glass Beads Walnut Shell Corncob Glass Beads Walnut Shell CornUmf,0 Average (cm/s) 21.7 18.4 17.1 20.2 16.3 16.8Qmf,0 Average (L/min) 105.3 89.3 83.2 220.6 178.4 183.7
10.2 cm FB 15.2 cm FB
Page 20
Department of Mechanical Engineering
Knowledge. Innovation. Leadership. www.me.iastate.edu
Department of Mechanical Engineering
Knowledge. Innovation. Leadership. www.me.iastate.edu
Gas holdup repeatability test conditions
• Reactor ID:• 15.24 cm
• Flow conditions:• Ug = 1.50 and 3.00Umf each without side-air
injection
• Bed materials:• Glass beads• Crushed walnut shell
• Five tests completed at each Ug with each bed material
• Quantitative e data shown across the bed at various heights bisecting the bed through the side-air port
(Drake and Heindel, 2011a)
Page 21
Department of Mechanical Engineering
Knowledge. Innovation. Leadership. www.me.iastate.edu
Department of Mechanical Engineering
Knowledge. Innovation. Leadership. www.me.iastate.edu
Gas holdup repeatability results for walnut shell and glass beads
00.10.20.30.40.50.60.70.80.9
11.11.21.31.41.5
0 0.1 0.2 0.3 0.4 0.5 0.6 0.7 0.8 0.9 1
h/D
[-]
Gas Holdup [-]
Test 1Test 2Test 3Test 4Test 5
Glass BeadsD = 15.24 cmUg = 1.50UmfQs = 0.00Qmf
00.10.20.30.40.50.60.70.80.9
11.11.21.31.41.5
0 0.1 0.2 0.3 0.4 0.5 0.6 0.7 0.8 0.9 1
h/D
[-]
Gas Holdup [-]
Test 1Test 2Test 3Test 4Test 5
Glass BeadsD = 15.24 cmUg = 3.00UmfQs = 0.00Qmf
00.10.20.30.40.50.60.70.80.9
11.11.21.31.41.5
0 0.1 0.2 0.3 0.4 0.5 0.6 0.7 0.8 0.9 1
h/D
[-]
Gas Holdup [-]
Test 1Test 2Test 3Test 4Test 5
Walnut ShellD = 15.24 cmUg = 1.50UmfQs = 0.00Qmf
00.10.20.30.40.50.60.70.80.9
11.11.21.31.41.5
0 0.1 0.2 0.3 0.4 0.5 0.6 0.7 0.8 0.9 1
h/D
[-]
Gas Holdup [-]
Test 1Test 2Test 3Test 4Test 5
Walnut ShellD = 15.24 cmUg = 3.00UmfQs = 0.00Qmf
Ug = 1.5Umf Ug = 3Umf
Gla
ss B
eads
Wal
nut S
hell
(Drake and Heindel, 2011a)
Page 22
Department of Mechanical Engineering
Knowledge. Innovation. Leadership. www.me.iastate.edu
Department of Mechanical Engineering
Knowledge. Innovation. Leadership. www.me.iastate.edu
Gas holdup repeatability results for glass beads
0.0
0.1
0.2
0.3
0.4
0.5
0.6
0.7
0.8
0.9
1.0
-1.0 -0.8 -0.6 -0.4 -0.2 0.0 0.2 0.4 0.6 0.8 1.0
Gas H
oldu
p [-]
r/R [-]
x-z Test 1 y-z Test 1x-z Test 2 y-z Test 2x-z Test 3 y-z Test 3x-z Test 4 y-z Test 4x-z Test 5 y-z Test 5
Glass BeadsD = 15.24 cmUg = 1.50UmfQs = 0.00Qmfh = 0.50D 0.0
0.1
0.2
0.3
0.4
0.5
0.6
0.7
0.8
0.9
1.0
-1.0 -0.8 -0.6 -0.4 -0.2 0.0 0.2 0.4 0.6 0.8 1.0
Gas H
oldu
p [-]
r/R [-]
x-z Test 1 y-z Test 1x-z Test 2 y-z Test 2x-z Test 3 y-z Test 3x-z Test 4 y-z Test 4x-z Test 5 y-z Test 5
Glass BeadsD = 15.24 cmUg = 3.00UmfQs = 0.00Qmfh = 0.50D
0.0
0.1
0.2
0.3
0.4
0.5
0.6
0.7
0.8
0.9
1.0
-1.0 -0.8 -0.6 -0.4 -0.2 0.0 0.2 0.4 0.6 0.8 1.0
Gas H
oldu
p [-]
r/R [-]
x-z Test 1 y-z Test 1x-z Test 2 y-z Test 2x-z Test 3 y-z Test 3x-z Test 4 y-z Test 4x-z Test 5 y-z Test 5
Glass BeadsD = 15.24 cmUg = 1.50UmfQs = 0.00Qmfh = 1.00D 0.0
0.1
0.2
0.3
0.4
0.5
0.6
0.7
0.8
0.9
1.0
-1.0 -0.8 -0.6 -0.4 -0.2 0.0 0.2 0.4 0.6 0.8 1.0
Gas H
oldu
p [-]
r/R [-]
x-z Test 1 y-z Test 1x-z Test 2 y-z Test 2x-z Test 3 y-z Test 3x-z Test 4 y-z Test 4x-z Test 5 y-z Test 5
Glass BeadsD = 15.24 cmUg = 3.00UmfQs = 0.00Qmfh = 1.00D
Ug = 1.5Umf Ug = 3Umf
h =
0.5D
h =
1D(Drake and Heindel, 2011a)
Page 23
Department of Mechanical Engineering
Knowledge. Innovation. Leadership. www.me.iastate.edu
Department of Mechanical Engineering
Knowledge. Innovation. Leadership. www.me.iastate.edu
Gas holdup uniformity test conditions
• Reactor ID:• 15.24 cm
• Flow conditions:• Ug = 1.50 and 3.00Umf
without side-air injection
• Bed materials:• Glass beads• Ground walnut shell
• One test completed at each Ug with each bed material
• Quantitative e data shown across the bed at various heights bisecting the bed along each angle indicated
(Drake and Heindel, 2011a)
Page 24
Department of Mechanical Engineering
Knowledge. Innovation. Leadership. www.me.iastate.edu
Department of Mechanical Engineering
Knowledge. Innovation. Leadership. www.me.iastate.edu
Gas holdup uniformity results @ h = 0.75D
0.0
0.1
0.2
0.3
0.4
0.5
0.6
0.7
0.8
0.9
1.0
-1.0 -0.8 -0.6 -0.4 -0.2 0.0 0.2 0.4 0.6 0.8 1.0
Gas H
oldu
p [-]
r/R [-]
15 deg 105 deg30 deg 120 deg45 deg 135 deg60 deg 150 deg75 deg 165 deg90 deg 180 deg
Glass BeadsD = 15.24 cmUg = 1.50UmfQs = 0.00Qmfh = 0.75D 0.0
0.1
0.2
0.3
0.4
0.5
0.6
0.7
0.8
0.9
1.0
-1.0 -0.8 -0.6 -0.4 -0.2 0.0 0.2 0.4 0.6 0.8 1.0
Gas H
oldu
p [-]
r/R [-]
15 deg 105 deg30 deg 120 deg45 deg 135 deg60 deg 150 deg75 deg 165 deg90 deg 180 deg
Glass BeadsD = 15.24 cmUg = 3.00UmfQs = 0.00Qmfh = 0.75D
0.0
0.1
0.2
0.3
0.4
0.5
0.6
0.7
0.8
0.9
1.0
-1.0 -0.8 -0.6 -0.4 -0.2 0.0 0.2 0.4 0.6 0.8 1.0
Gas H
oldu
p [-]
r/R [-]
15 deg 105 deg30 deg 120 deg45 deg 135 deg60 deg 150 deg75 deg 165 deg90 deg 180 deg
Walnut ShellD = 15.24 cmUg = 1.50UmfQs = 0.00Qmfh = 0.75D 0.0
0.1
0.2
0.3
0.4
0.5
0.6
0.7
0.8
0.9
1.0
-1.0 -0.8 -0.6 -0.4 -0.2 0.0 0.2 0.4 0.6 0.8 1.0
Gas H
oldu
p [-]
r/R [-]
15 deg 105 deg30 deg 120 deg45 deg 135 deg60 deg 150 deg75 deg 165 deg90 deg 180 deg
Walnut ShellD = 15.24 cmUg = 3.00UmfQs = 0.00Qmfh = 0.75D
Ug = 1.5Umf Ug = 3Umf
Gla
ss B
eads
Wal
nut S
hell
(Drake and Heindel, 2011a)
Page 25
Department of Mechanical Engineering
Knowledge. Innovation. Leadership. www.me.iastate.edu
Department of Mechanical Engineering
Knowledge. Innovation. Leadership. www.me.iastate.edu
Gas holdup uniformity results @ h = 0.25D
0.0
0.1
0.2
0.3
0.4
0.5
0.6
0.7
0.8
0.9
1.0
-1.0 -0.8 -0.6 -0.4 -0.2 0.0 0.2 0.4 0.6 0.8 1.0
Gas H
oldu
p [-]
r/R [-]
15 deg 105 deg30 deg 120 deg45 deg 135 deg60 deg 150 deg75 deg 165 deg90 deg 180 deg
Glass BeadsD = 15.24 cmUg = 1.50UmfQs = 0.00Qmfh = 0.25D 0.0
0.1
0.2
0.3
0.4
0.5
0.6
0.7
0.8
0.9
1.0
-1.0 -0.8 -0.6 -0.4 -0.2 0.0 0.2 0.4 0.6 0.8 1.0
Gas H
oldu
p [-]
r/R [-]
15 deg 105 deg30 deg 120 deg45 deg 135 deg60 deg 150 deg75 deg 165 deg90 deg 180 deg
Glass BeadsD = 15.24 cmUg = 3.00UmfQs = 0.00Qmfh = 0.25D
0.0
0.1
0.2
0.3
0.4
0.5
0.6
0.7
0.8
0.9
1.0
-1.0 -0.8 -0.6 -0.4 -0.2 0.0 0.2 0.4 0.6 0.8 1.0
Gas H
oldu
p [-]
r/R [-]
15 deg 105 deg30 deg 120 deg45 deg 135 deg60 deg 150 deg75 deg 165 deg90 deg 180 deg
Walnut ShellD = 15.24 cmUg = 1.50UmfQs = 0.00Qmfh = 0.25D 0.0
0.1
0.2
0.3
0.4
0.5
0.6
0.7
0.8
0.9
1.0
-1.0 -0.8 -0.6 -0.4 -0.2 0.0 0.2 0.4 0.6 0.8 1.0
Gas H
oldu
p [-]
r/R [-]
15 deg 105 deg30 deg 120 deg45 deg 135 deg60 deg 150 deg75 deg 165 deg90 deg 180 deg
Walnut ShellD = 15.24 cmUg = 3.00UmfQs = 0.00Qmfh = 0.25D
Ug = 1.5Umf Ug = 3Umf
Gla
ss B
eads
Wal
nut S
hell
(Drake and Heindel, 2011a)
Page 26
Department of Mechanical Engineering
Knowledge. Innovation. Leadership. www.me.iastate.edu
Department of Mechanical Engineering
Knowledge. Innovation. Leadership. www.me.iastate.edu
Local gas holdup test conditions
• Reactor ID:• 10.16 cm and 15.24 cm
• Flow conditions:• Ug = 1.25, 1.50, 1.75, and 2.00Umf
Qs = 0.00, 0.05, 0.10, 0.15, and 0.20Qmf
• Bed materials:• Glass beads• Ground walnut shell• Crushed corncob
• One test completed at each Ug and Qs in each reactor with each bed material
• Quantitative and qualitative e data shown across the bed at various heights bisecting the bed through the side-air port
(Drake and Heindel, 2011b)
Page 27
Department of Mechanical Engineering
Knowledge. Innovation. Leadership. www.me.iastate.edu
Department of Mechanical Engineering
Knowledge. Innovation. Leadership. www.me.iastate.edu
CT ImagesG
lass
bea
ds @
Ug =
2U
mf a
nd Q
s = 0
.2Q
mf
(Drake and Heindel, 2011b)
Page 28
Department of Mechanical Engineering
Knowledge. Innovation. Leadership. www.me.iastate.edu
Department of Mechanical Engineering
Knowledge. Innovation. Leadership. www.me.iastate.edu
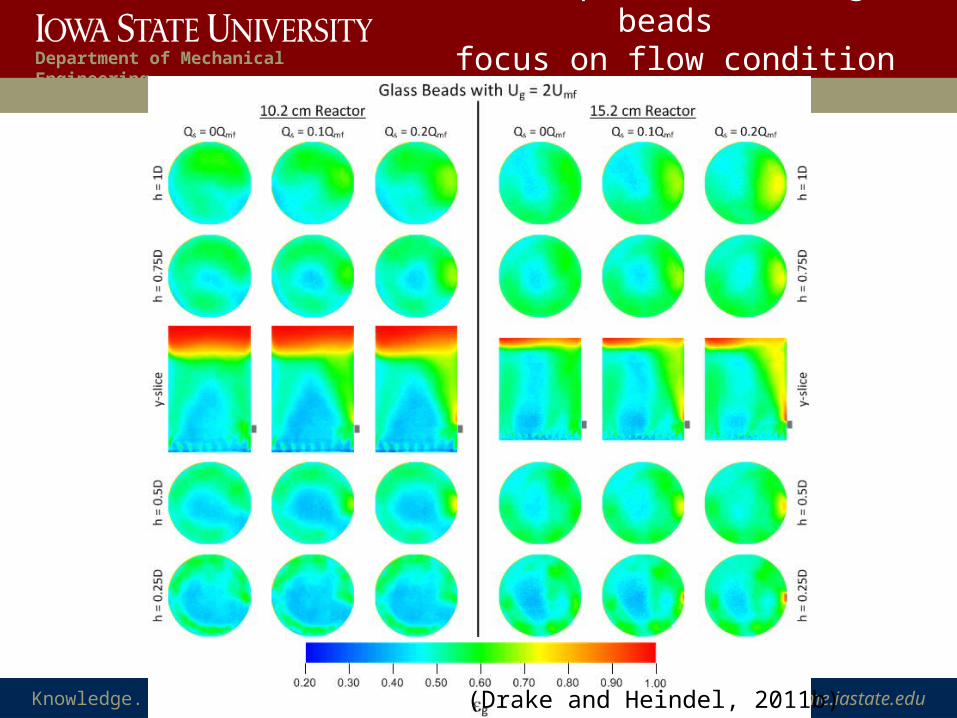
Gas holdup results for glass beads
focus on flow condition variation
(Drake and Heindel, 2011b)
Page 29
Department of Mechanical Engineering
Knowledge. Innovation. Leadership. www.me.iastate.edu
Department of Mechanical Engineering
Knowledge. Innovation. Leadership. www.me.iastate.edu
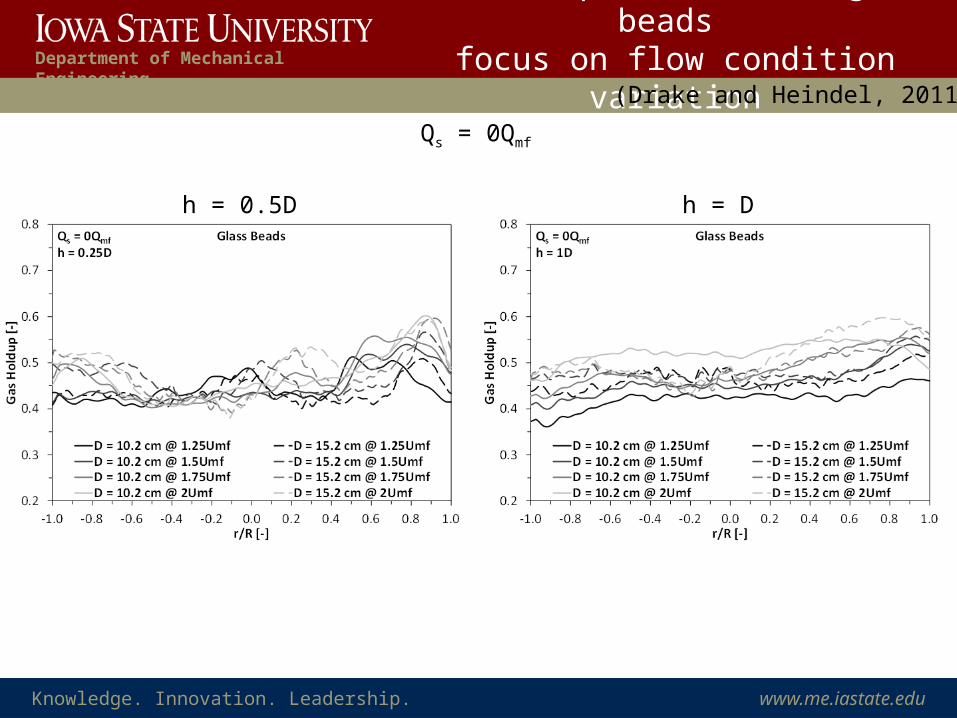
Gas holdup results for glass beads
focus on flow condition variationUg = 1.5Umf
h = 0.5D h = D
(Drake and Heindel, 2011b)
Page 30
Department of Mechanical Engineering
Knowledge. Innovation. Leadership. www.me.iastate.edu
Department of Mechanical Engineering
Knowledge. Innovation. Leadership. www.me.iastate.edu
Gas holdup results for glass beads
focus on flow condition variation
(Drake and Heindel, 2011b)
Page 31
Department of Mechanical Engineering
Knowledge. Innovation. Leadership. www.me.iastate.edu
Department of Mechanical Engineering
Knowledge. Innovation. Leadership. www.me.iastate.edu
Gas holdup results for glass beads
focus on flow condition variationQs = 0Qmf
h = 0.5D h = D
(Drake and Heindel, 2011b)
Page 32
Department of Mechanical Engineering
Knowledge. Innovation. Leadership. www.me.iastate.edu
Department of Mechanical Engineering
Knowledge. Innovation. Leadership. www.me.iastate.edu
Gas holdup results for bed material variation
(Drake and Heindel, 2011b)
Page 33
Department of Mechanical Engineering
Knowledge. Innovation. Leadership. www.me.iastate.edu
Department of Mechanical Engineering
Knowledge. Innovation. Leadership. www.me.iastate.edu
Gas holdup results for bed material variation
h = 0.75D
Ug =
2U
mf
Ug =
1.5
Um
f
Qs = 0Qmf Qs = 0.1Qmf
(Drake and Heindel, 2011b)
Page 34
Department of Mechanical Engineering
Knowledge. Innovation. Leadership. www.me.iastate.edu
Department of Mechanical Engineering
Knowledge. Innovation. Leadership. www.me.iastate.edu
Annular gas holdup test conditions
• Reactor ID:• 10.16 cm• 15.24 cm
• Flow conditions:• Ug = 1.25, 1.50, 1.75, and 2.00Umf
Qs = 0.00, 0.05, 0.10, 0.15, and 0.20Qmf
• Bed materials:• Glass beads• Ground walnut shell• Crushed corncob
• One test completed at each Ug and Qs in each reactor with each bed material
• Annularly averaged e data shown as qualitative 2D maps and quantitative plots of half the bed
(Drake and Heindel, 2011c)
Page 35
Department of Mechanical Engineering
Knowledge. Innovation. Leadership. www.me.iastate.edu
Department of Mechanical Engineering
Knowledge. Innovation. Leadership. www.me.iastate.edu
Data smoothing
• Local time-average gas holdup is averaged along concentric annular rings from the bed center to the reactor wall at all heights
• Noise in the averages increases as r → 0
• Noise is smoothed using a curve fitting function
(Drake and Heindel, 2011c)
Page 36
Department of Mechanical Engineering
Knowledge. Innovation. Leadership. www.me.iastate.edu
Department of Mechanical Engineering
Knowledge. Innovation. Leadership. www.me.iastate.edu
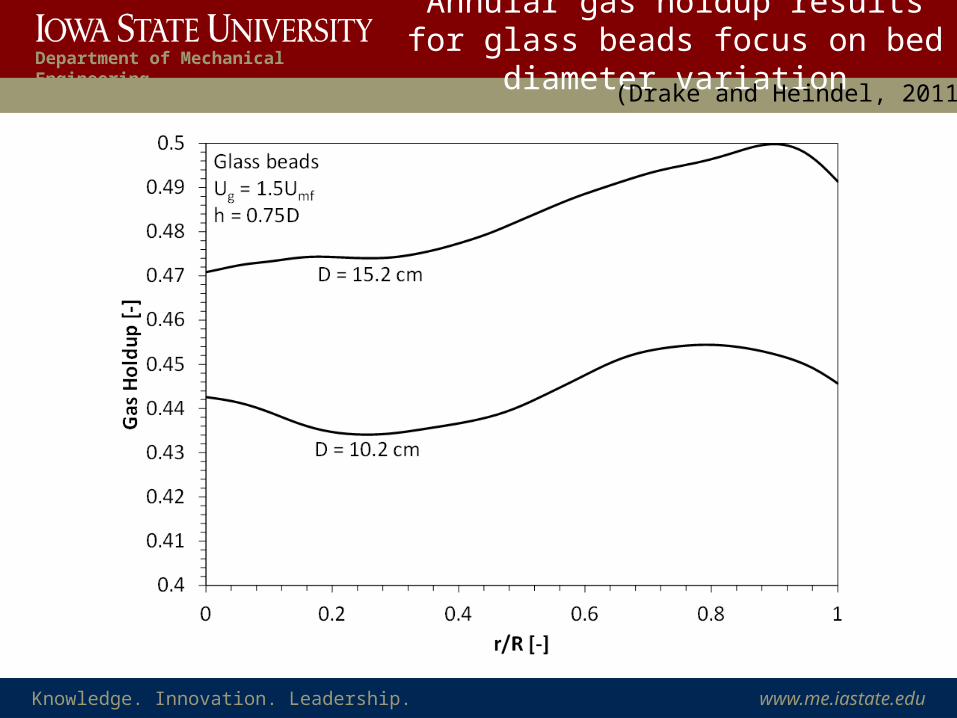
Annular gas holdup results for glass beads focus on bed
diameter variation(Drake and Heindel, 2011c)
Page 37
Department of Mechanical Engineering
Knowledge. Innovation. Leadership. www.me.iastate.edu
Department of Mechanical Engineering
Knowledge. Innovation. Leadership. www.me.iastate.edu
Annular gas holdup results for glass beads focus on bed
diameter variation(Drake and Heindel, 2011c)
Page 38
Department of Mechanical Engineering
Knowledge. Innovation. Leadership. www.me.iastate.edu
Department of Mechanical Engineering
Knowledge. Innovation. Leadership. www.me.iastate.edu
Annular gas holdup results for glass beads focus on flow
condition variation(Drake and Heindel, 2011c)
Page 39
Department of Mechanical Engineering
Knowledge. Innovation. Leadership. www.me.iastate.edu
Department of Mechanical Engineering
Knowledge. Innovation. Leadership. www.me.iastate.edu
Annular gas holdup results for glass beads focus on flow
condition variationGlass beads
Ug = 2Umf varying h h = 0.75D varying Ug
(Drake and Heindel, 2011c)
Page 40
Department of Mechanical Engineering
Knowledge. Innovation. Leadership. www.me.iastate.edu
Department of Mechanical Engineering
Knowledge. Innovation. Leadership. www.me.iastate.edu
Annular gas holdup results for bed material variation
D =
10.
2 cm
Ug =
2U
mf
Ug =
1.5
Um
f(Drake and Heindel, 2011c)
Page 41
Department of Mechanical Engineering
Knowledge. Innovation. Leadership. www.me.iastate.edu
Department of Mechanical Engineering
Knowledge. Innovation. Leadership. www.me.iastate.edu
Annular gas holdup results for bed material variation
(Drake and Heindel, 2011c)
Page 42
Department of Mechanical Engineering
Knowledge. Innovation. Leadership. www.me.iastate.edu
Department of Mechanical Engineering
Knowledge. Innovation. Leadership. www.me.iastate.edu
Conclusions and future work
Department of Mechanical Engineering
Page 43
Department of Mechanical Engineering
Knowledge. Innovation. Leadership. www.me.iastate.edu
Department of Mechanical Engineering
Knowledge. Innovation. Leadership. www.me.iastate.edu
• Calculating local time-average gas holdup using X-ray CTs is highly repeatable
• Fluidization uniformity increases with bed height• Causes:
• Increased mixing
• Local time-average gas holdup is affected by changes in Ug, Qs, bed material density, and jetting• Causes:
• Increased mixing• A decrease in the amount of energy needed to move bed particles
• The only significant changes in εg due to changes in reactor size are from differences in circulation patterns and average bed heights• Causes:
• Major losses from wall effects
Conclusions
Page 44
Department of Mechanical Engineering
Knowledge. Innovation. Leadership. www.me.iastate.edu
Department of Mechanical Engineering
Knowledge. Innovation. Leadership. www.me.iastate.edu
• Four different annular hydrodynamic structures can be identified• Aeration jetting• Bubble coalescence regions• Bubble rise paths• Particle shear zones
• Annular hydrodynamic structures change shape, size, and location due to changes in Ug, bed diameter, and bed material density.
• 2D local time-average annular gas holdup maps can be used as benchmarks for computational fluid dynamic simulation validation and comparison
Conclusions
Page 45
Department of Mechanical Engineering
Knowledge. Innovation. Leadership. www.me.iastate.edu
Department of Mechanical Engineering
Knowledge. Innovation. Leadership. www.me.iastate.edu
• X-ray Particle Tracking Velocimetry• Could help with reactor design and scale up for different processes• Could help validate circulation patterns in the bed
• Possible problems:• Increased Ug will make image capture of the particle difficult, in turn, increasing
particle detection error• Low Ug increases the particles chances of becoming trapped between jets from the
aeration plate
Future work
Page 46
Department of Mechanical Engineering
Knowledge. Innovation. Leadership. www.me.iastate.edu
Department of Mechanical Engineering
Knowledge. Innovation. Leadership. www.me.iastate.edu
• X-ray Bubble Tracking Velocimetry• Could help with reactor design and scale up for different processes• Could help validate gas flow patterns through the bed
• Possible problems:• Increased Ug will make image capture of bubbles difficult, in turn, increasing bubble
detection error• Bubble overlap• Poor virtual bubble reconstruction assumptions
Future work
Page 47
Department of Mechanical Engineering
Knowledge. Innovation. Leadership. www.me.iastate.edu
Department of Mechanical Engineering
Knowledge. Innovation. Leadership. www.me.iastate.edu
Journal PapersDrake, J. B. and Heindel, T. J., (2011). “Comparisons of annular hydrodynamic structures in 3D fluidized beds using X-ray CT.” Journal of Fluids Engineering, In Review.
Drake, J.B. and Heindel, T. J. (2011). “Comparisons of gas holdup in cold flow fluidized beds.” Chemical Engineering Science, To Appear.
Drake, J.B. and Heindel, T. J. (2011). “The repeatability and uniformity of 3D fluidized beds.” Powder Technology 213, 148-154.
Min, J., Drake, J. B., Heindel, T. J., and Fox, R. O. (2010). "Experimental validation of CFD simulations of a lab-scale fluidized-bed reactor with and without side-gas injection." AIChE Journal 56: 1434-1446.
Ford, J. J., Heindel, T. J., Jensen, T. C., and Drake, J. B. (2008). "X-ray computed tomography of a gas-sparged stirred-tank reactor." Chemical Engineering Science 63(8): 2075-2085.
Page 48
Department of Mechanical Engineering
Knowledge. Innovation. Leadership. www.me.iastate.edu
Department of Mechanical Engineering
Knowledge. Innovation. Leadership. www.me.iastate.edu
Conference PapersDrake, J. B., Kenney, A. L., Morgan, T. B., Heindel, T. J. (2011). “Developing tracer particles for X-ray particle tracking velocimetry.” ASME-JSME-KSME Joint Fluids Engineering Conference 2011, Hamamatsu, Shizuoka, Japan.
Heindel, T. J., Jensen, T. C., Drake, J. B., McCormick, N., and Riveland, M. L. (2010). “3D X ray CT imaging of ‐cavitation from a butterfly valve.” 7th International Conference on Multiphase Flow, Tampa, FL, United states.
Drake, J. B., Tang, L., and Heindel, T. J. (2009). “X-ray particle tracking velocimetry in fluidized beds.” 2009 ASME Fluids Engineering Division Summer Conference, Vail, CO, United States.
Drake, J. B., and Heindel, T. J. (2009). “Repeatability of gas holdup in a fluidized bed using x-ray computed tomography.” 2009 ASME Fluids Engineering Division Summer Conference, Vail, CO, United States.
Drake, J. B., Franka, N. P., and Heindel, T. J. (2008). “Developing X-ray particle tracking velocimetry for applications in fluidized beds.” 2008 ASME International Mechanical Engineering Congress and Exposition, Boston, MA, United States.
Meyer, T. R., Schmidt, J. B., Nelson, S. M., Drake, J. B., Janvrin, D. M., and Heindel, T. J. (2008). “Three-dimensional spray visualization using X-ray computed tomography.” ILASS Americas, 21st Annual Conference on Liquid Atomization and Spray Systems. Orlando, FL, United States.
Franka, N. P., Drake, J. B., and Heindel, T. J. (2008). “Minimum fluidization velocity and gas holdup in fluidized beds with side port air injection.” ASME Fluids Engineering Division Summer Meeting, Jacksonville, FL, United States.
Page 49
Department of Mechanical Engineering
Knowledge. Innovation. Leadership. www.me.iastate.edu
Department of Mechanical Engineering
Knowledge. Innovation. Leadership. www.me.iastate.edu
Hydrodynamic Characterization of 3D Fluidized Beds Using
Noninvasive TechniquesJoshua B. Drake
Department of Mechanical EngineeringIowa State University
Ames, Iowa
Department of Mechanical Engineering