DEFINING THE HYDROCARBON LEAKAGE ZONE AND THE POSSIBLE ACCUMULATION MODEL FOR MARINE GAS HYDRATES IN A SALT TECTONIC DRIVEN COLD SEEP: EXAMPLES FROM WOOLSEY MOUND, MC118, NORTHERN GULF OF MEXICO Antonello Simonetti * * * * , James H. Knapp and Camelia C. Knapp Department of Earth and Ocean Sciences University of South Carolina 701 Sumter St., EWS Building. Columbia, SC 29208 USA Leonardo Macelloni and Carol B. Lutken Mississippi Mineral Research Institute School of Engineering, University of Mississippi 111 Brevard Hall. University (MS), 38677 USA ABSTRACT This study presents the results of efforts to characterize the hydrocarbon leakage zone and the possible accumulation model for marine hydrates at Woolsey Mound, in the northern Gulf of Mexico. This site is known for hydrocarbon venting at the seafloor in a location dominated by salt tectonics, making it a very dynamic and complex hydrocarbon system. Therefore, we adopted an innovative approach integrating three seismic datasets at different levels of resolutions, including: 3D oil-industry standard seismic collected in 2000, a high-resolution sub-surface\deep-receiver single channel seismic data and a 2D very high-resolution chirp data, collected in 2006 and 2005, respectively. Seismic interpretation reveals the presence of two salt bodies whose tops reach 0.6 sec TWTT b.s.f. Salt tectonics generate an extended network of faults, some of which connecting the salt bodies with the seafloor (master faults). The higher resolution seismic data show several wipe- out zones along the master faults and seafloor pockmarks and craters are located immediately above them. Also, seafloor pockmarks and craters appear to be bound in the subsurface by high- amplitude, negative anomalies at constant depth of 0.2 sec TWTT b.s.f., interpreted as free gas. Since pockmarks and craters provide pathways for hydrocarbons to escape into the water column, their related sub-surface seismic anomalies may indicate free gas at the base of the gas hydrate stability zone (GHSZ). Hence, the depth where these bright-spots are imaged could indicate a thermo-baric boundary above which gas hydrate may form and remain stable temporarily. Here, periodical migrations of gases and other fluids may perturb the GHSZ in terms of temperature and pressure, resulting in a lack of a classical BSR. Moreover, a radial fault-fracture complex, only detectable in the high resolution data, seems to deliver gas/fluids upwards into the GHSZ from shallower hydrocarbon reservoirs. Finally, some preliminary results related to a recent Jumbo Piston Coring cruise over Woolsey Mound will be presented as well. Keywords: gas hydrates, hydrocarbon leakage zone, amplitude anomalies, seismic resolution * Corresponding author: USA Phone: (803) 447- 4614 E-mail: [email protected]Proceedings of the 7th International Conference on Gas Hydrates (ICGH 2011), Edinburgh, Scotland, United Kingdom, July 17-21, 2011.
Transcript
DEFINING THE HYDROCARBON LEAKAGE ZONE AND THE POSSIBLE ACCUMULATION MODEL FOR MARINE GAS HYDRATES IN A SALT
TECTONIC DRIVEN COLD SEEP: EXAMPLES FROM WOOLSEY MOUND, MC118, NORTHERN GULF OF MEXICO
Antonello Simonetti∗∗∗∗, James H. Knapp and Camelia C. Knapp Department of Earth and Ocean Sciences
University of South Carolina 701 Sumter St., EWS Building. Columbia, SC 29208
USA
Leonardo Macelloni and Carol B. Lutken Mississippi Mineral Research Institute
School of Engineering, University of Mississippi 111 Brevard Hall. University (MS), 38677
USA
ABSTRACT This study presents the results of efforts to characterize the hydrocarbon leakage zone and the possible accumulation model for marine hydrates at Woolsey Mound, in the northern Gulf of Mexico. This site is known for hydrocarbon venting at the seafloor in a location dominated by salt tectonics, making it a very dynamic and complex hydrocarbon system. Therefore, we adopted an innovative approach integrating three seismic datasets at different levels of resolutions, including: 3D oil-industry standard seismic collected in 2000, a high-resolution sub-surface\deep-receiver single channel seismic data and a 2D very high-resolution chirp data, collected in 2006 and 2005, respectively. Seismic interpretation reveals the presence of two salt bodies whose tops reach 0.6 sec TWTT b.s.f. Salt tectonics generate an extended network of faults, some of which connecting the salt bodies with the seafloor (master faults). The higher resolution seismic data show several wipe-out zones along the master faults and seafloor pockmarks and craters are located immediately above them. Also, seafloor pockmarks and craters appear to be bound in the subsurface by high-amplitude, negative anomalies at constant depth of 0.2 sec TWTT b.s.f., interpreted as free gas. Since pockmarks and craters provide pathways for hydrocarbons to escape into the water column, their related sub-surface seismic anomalies may indicate free gas at the base of the gas hydrate stability zone (GHSZ). Hence, the depth where these bright-spots are imaged could indicate a thermo-baric boundary above which gas hydrate may form and remain stable temporarily. Here, periodical migrations of gases and other fluids may perturb the GHSZ in terms of temperature and pressure, resulting in a lack of a classical BSR. Moreover, a radial fault-fracture complex, only detectable in the high resolution data, seems to deliver gas/fluids upwards into the GHSZ from shallower hydrocarbon reservoirs. Finally, some preliminary results related to a recent Jumbo Piston Coring cruise over Woolsey Mound will be presented as well.
Proceedings of the 7th International Conference on Gas Hydrates (ICGH 2011), Edinburgh, Scotland, United Kingdom, July 17-21, 2011.
INTRODUCTION In order to define a geological-geophysical model of the Mississippi Canyon Block 118 hydrates/carbonate mound subsurface (fig.1) and characterize the underlying plumbing system, an innovative approach has been adopted: three different multiple-resolution seismic datasets have been integrated. The datasets used are: 3D oil-industry high quality seismic data collected in 2000 by TGS - Nopec, pseudo-3D high resolution sub-surface deep-receiver single channel seismic data (SSDR) collected in 2006 and 2D very high resolution autonomous underwater vehicle (AUV)-borne chirp data, collected in 2005. Penetration depth, as well as the vertical seismic resolution, are different for each dataset, spanning from thousands of meters (penetration) and 50m (vertical resolution) for the oil industry data, to 40m and 0.1m for the Chirp Sub-bottom Profiler. The SSDR system, which can image up to hundreds of meters below the seafloor with a vertical resolution of about 1m, bridges the gap between oil industry data and chirp data, exactly where the gas hydrates stability zone is present. Several authors, including [1], [2], [3] have pointed out the importance of imaging and understanding a hydrocarbon natural leakage zone in its entirety: from the root - where the hydrocarbon fluids may form - through the top where hydrocarbon fluids escape. At the present, the root is well-imaged, due to the effort and technological advances of the oil industry; the top, is poorly understood. The approach we adopted, therefore, can provide, an innovative, multi-scale image of sub-surface settings/environments, that helps to better define the upward thermogenic gas-fluid migration process, and the possible accumulation mechanism of solid hydrates within the GHSZ. Most interpretations presented are based on shapes and spatial distribution of typical seismic anomalies (i.e. gas chimneys, bright spots, wipe-out zones) and not on detailed acoustic and rocks physics investigations. DATA AND METHODOLOGY The MC118 hydrates mound subsurface has been imaged using three different seismic data sets: • High quality 3D oil industry multichannel seismic data from TGS-Nopec; • Surface Source Deep Receiver (SSDR) single channel system pseudo 3D volume; • AUV-borne Chirp Sub-bottom Profiler.
Figure 1. Geographic location of MC118 on the
northern slope of the Gulf of Mexico. The three data sets embrace a wide spectrum of penetration depth and vertical resolution, providing an innovative multi-scale image of the geological setting beneath the hydrates mound (fig.2). The initial step in data analysis was the creation of a fully integrated Kingdom Suite seismic interpretation project. Accurate combination of the multiple datasets in the same time-space volume required calibration of the reflection points’ spatial distribution and normalization of the dataset seafloor reflection time. The first was accomplished via statistical analysis of the cross point misfit; the second by referring all the seafloor reflection point times to the AUV seafloor bathymetry. Further, in order to provide visual control of possible hydrocarbon leakage at the seafloor, high resolution mound bathymetry, high resolution mound reflectivity, and spatial distribution at the seafloor of the bio-geological facies, commonly related to hydrocarbon seeping and venting (i.e. bacterial mats, authigenic carbonate, chemosynthetic community, etc), have been integrated into the seismic volume (fig.3). Successive steps in the seismic datasets analysis have been completed, including detailed picking of the following features:
Figure 2. Woolsey Mound has been investigated using three different dataset: high quality 3D oil industry multichannel seismic data from TGS Nopec; surface source deep receiver (SSDR) single channel system pseudo 3D volume and AUV-borne CHIRP sub-bottom profiler. Their different vertical resolution provides a multi-scale image of the sub-surface beneath the mound.
Figure 3. Seafloor back-scatter map, relevant biological habitat and sediment distribution of the mound. A) Undisturbed pelagic mud typical of the mound's periphery. B) Area covered by chemoautotrophic clams; C) Authigenic carbonate nodules; d) Bacterial mat (Beggiatoa sp.); E, F, G Area paved by Authigenic carbonate crusts and slabs; H) Gas venting from the seafloor, I) The Sleeping Dragon, the largest complex carbonate hydrates outcrop ever imaged on the seafloor; L) Hydrate dike. (Courtesy of S. Caruso, Fugro ltd)
• Relevant seismic horizons (with particular effort to trace seismic horizons that represent the same stratigraphic level in different datasets)
• Faults and fractures • Seismic anomalies such as discontinuity
zones, wipeout zones, bright spots - phase reversal (adopting the classification of Løseth et al., (2009), focused on seismic expressions of leakage structures).
Since 2001, Woolsey Mound has been investigated extensively by geological cores. These cores (mainly gravity cores with maximum penetration of about 7m) were collected for sedimentlogical and geochemical studies, and relevant results can be found in [4], [5]. In January 2011, a dedicated cruise of Jumbo Piston Coring (JPC - maximum penetration 20m) was carried out to ground truth specific targets within the mound previously identified on seismic data. RESULTS AND DISCUSSION Seismic data interpretation reveals a scenario dominated by a salt body (fig.4) whose top extends to 0.6 sec TWTT beneath the seafloor (b.s.f.). Faults and fractures system Salt tectonics generates an extensive network of faults and fractures; however, few of them connect the salt body with the seafloor carbonate/hydrate mound (fig.4).
Figure 4. Salt dome and master faults from 3D standard seismic data.
Where these “master faults” intersect the seafloor, there is evidence for diagnostic features of hydrocarbon leakage, such as: craters and pockmarks, gas hydrates, authigenic carbonates, active vents and chemosynthetic communities. In particular, the south-east crater complex lies on the top of the yellow master fault, the south-west crater complex is related to the magenta master fault, while the north-west complex lies on top of the blue and red master faults as depicted in figure 4. Besides the master faults recognized on oil industry data, a much more complex system of faults and fractures emerged from the evaluation of high resolution SSDR data (fig.5.).
Figure 5. High resolution SSDR data allow discrimination of a minor radial fault complex undetectable on 3D standard seismic data. These minor tectonic elements traced by carefully picking the fine-scale seismic horizons have a radial pattern orientation, reflecting upward movement of the underlying salt-body. We suggest that this radial fault-fracture complex is an integral part of MC118's plumbing system. For example, comparing one fault across the three datasets, it is possible observe how it appears to be blind in the 3D data, it seems to displace sediment in the SSDR data, and it shows as reaching the sea floor on the very high resolution CHIRP data (fig.6).
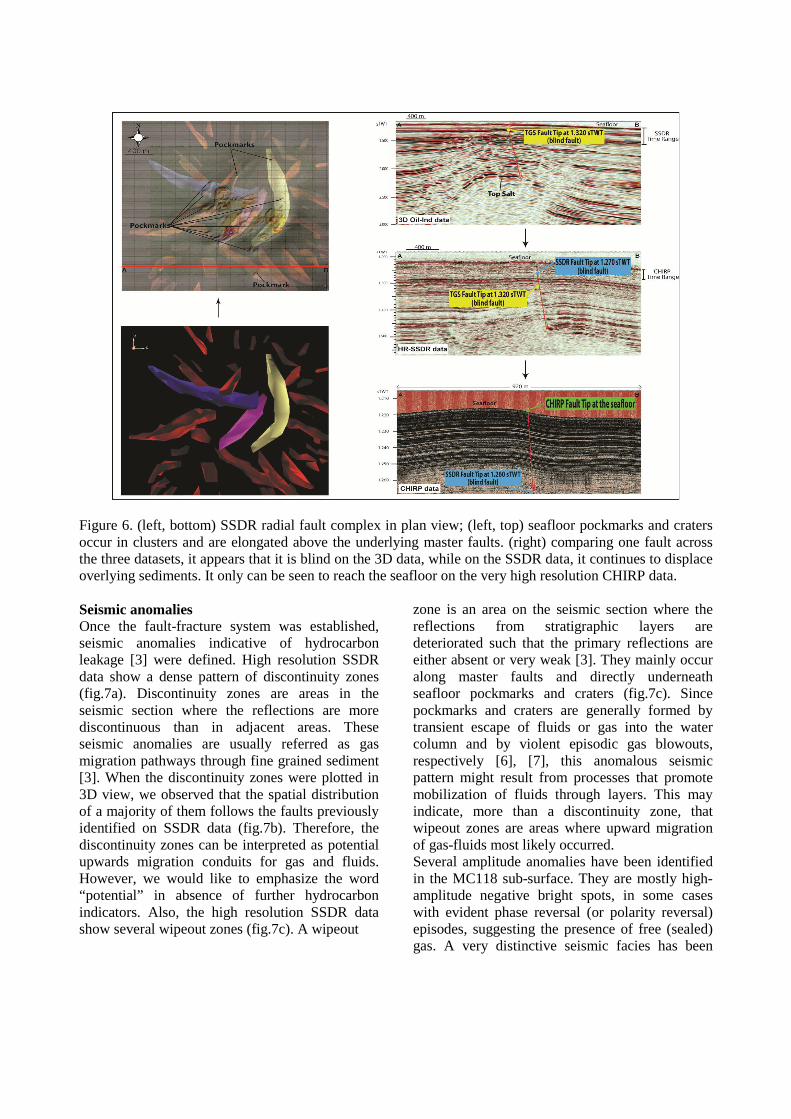
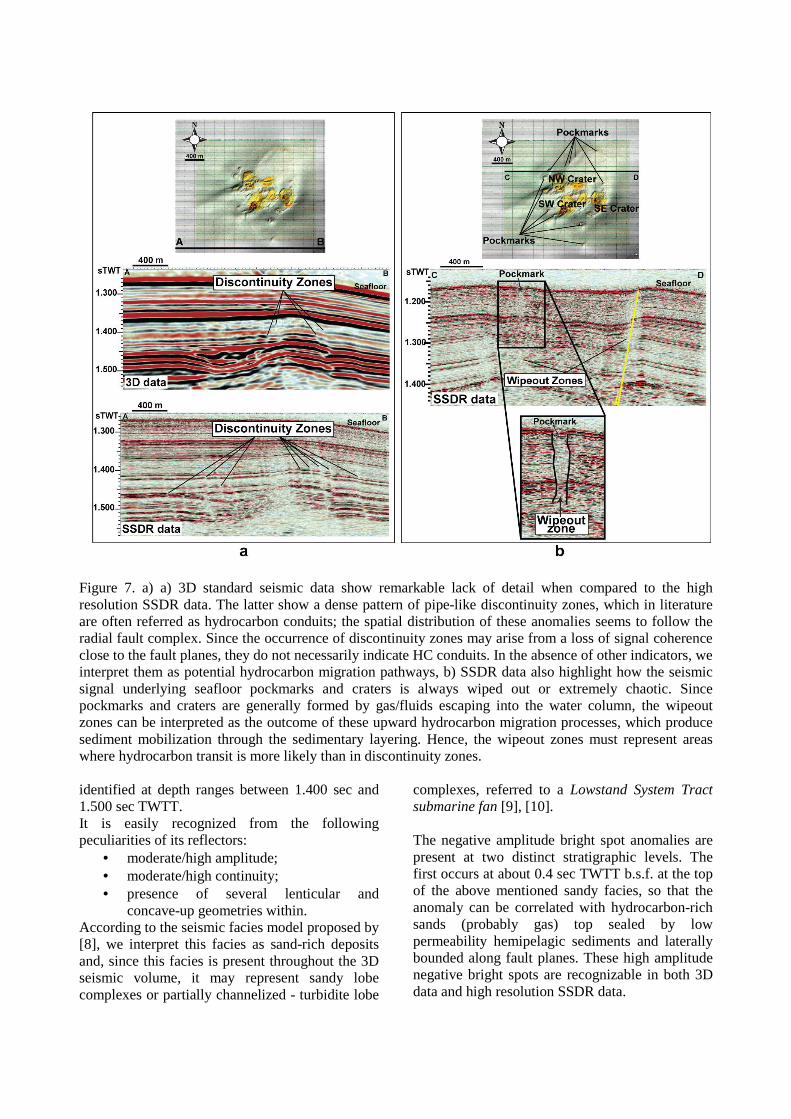
Figure 6. (left, bottom) SSDR radial fault complex in plan view; (left, top) seafloor pockmarks and craters occur in clusters and are elongated above the underlying master faults. (right) comparing one fault across the three datasets, it appears that it is blind on the 3D data, while on the SSDR data, it continues to displace overlying sediments. It only can be seen to reach the seafloor on the very high resolution CHIRP data. Seismic anomalies Once the fault-fracture system was established, seismic anomalies indicative of hydrocarbon leakage [3] were defined. High resolution SSDR data show a dense pattern of discontinuity zones (fig.7a). Discontinuity zones are areas in the seismic section where the reflections are more discontinuous than in adjacent areas. These seismic anomalies are usually referred as gas migration pathways through fine grained sediment [3]. When the discontinuity zones were plotted in 3D view, we observed that the spatial distribution of a majority of them follows the faults previously identified on SSDR data (fig.7b). Therefore, the discontinuity zones can be interpreted as potential upwards migration conduits for gas and fluids. However, we would like to emphasize the word “potential” in absence of further hydrocarbon indicators. Also, the high resolution SSDR data show several wipeout zones (fig.7c). A wipeout
zone is an area on the seismic section where the reflections from stratigraphic layers are deteriorated such that the primary reflections are either absent or very weak [3]. They mainly occur along master faults and directly underneath seafloor pockmarks and craters (fig.7c). Since pockmarks and craters are generally formed by transient escape of fluids or gas into the water column and by violent episodic gas blowouts, respectively [6], [7], this anomalous seismic pattern might result from processes that promote mobilization of fluids through layers. This may indicate, more than a discontinuity zone, that wipeout zones are areas where upward migration of gas-fluids most likely occurred. Several amplitude anomalies have been identified in the MC118 sub-surface. They are mostly high-amplitude negative bright spots, in some cases with evident phase reversal (or polarity reversal) episodes, suggesting the presence of free (sealed) gas. A very distinctive seismic facies has been
Figure 7. a) a) 3D standard seismic data show remarkable lack of detail when compared to the high resolution SSDR data. The latter show a dense pattern of pipe-like discontinuity zones, which in literature are often referred as hydrocarbon conduits; the spatial distribution of these anomalies seems to follow the radial fault complex. Since the occurrence of discontinuity zones may arise from a loss of signal coherence close to the fault planes, they do not necessarily indicate HC conduits. In the absence of other indicators, we interpret them as potential hydrocarbon migration pathways, b) SSDR data also highlight how the seismic signal underlying seafloor pockmarks and craters is always wiped out or extremely chaotic. Since pockmarks and craters are generally formed by gas/fluids escaping into the water column, the wipeout zones can be interpreted as the outcome of these upward hydrocarbon migration processes, which produce sediment mobilization through the sedimentary layering. Hence, the wipeout zones must represent areas where hydrocarbon transit is more likely than in discontinuity zones. identified at depth ranges between 1.400 sec and 1.500 sec TWTT. It is easily recognized from the following peculiarities of its reflectors:
• moderate/high amplitude; • moderate/high continuity; • presence of several lenticular and
concave-up geometries within. According to the seismic facies model proposed by [8], we interpret this facies as sand-rich deposits and, since this facies is present throughout the 3D seismic volume, it may represent sandy lobe complexes or partially channelized - turbidite lobe
complexes, referred to a Lowstand System Tract submarine fan [9], [10]. The negative amplitude bright spot anomalies are present at two distinct stratigraphic levels. The first occurs at about 0.4 sec TWTT b.s.f. at the top of the above mentioned sandy facies, so that the anomaly can be correlated with hydrocarbon-rich sands (probably gas) top sealed by low permeability hemipelagic sediments and laterally bounded along fault planes. These high amplitude negative bright spots are recognizable in both 3D data and high resolution SSDR data.
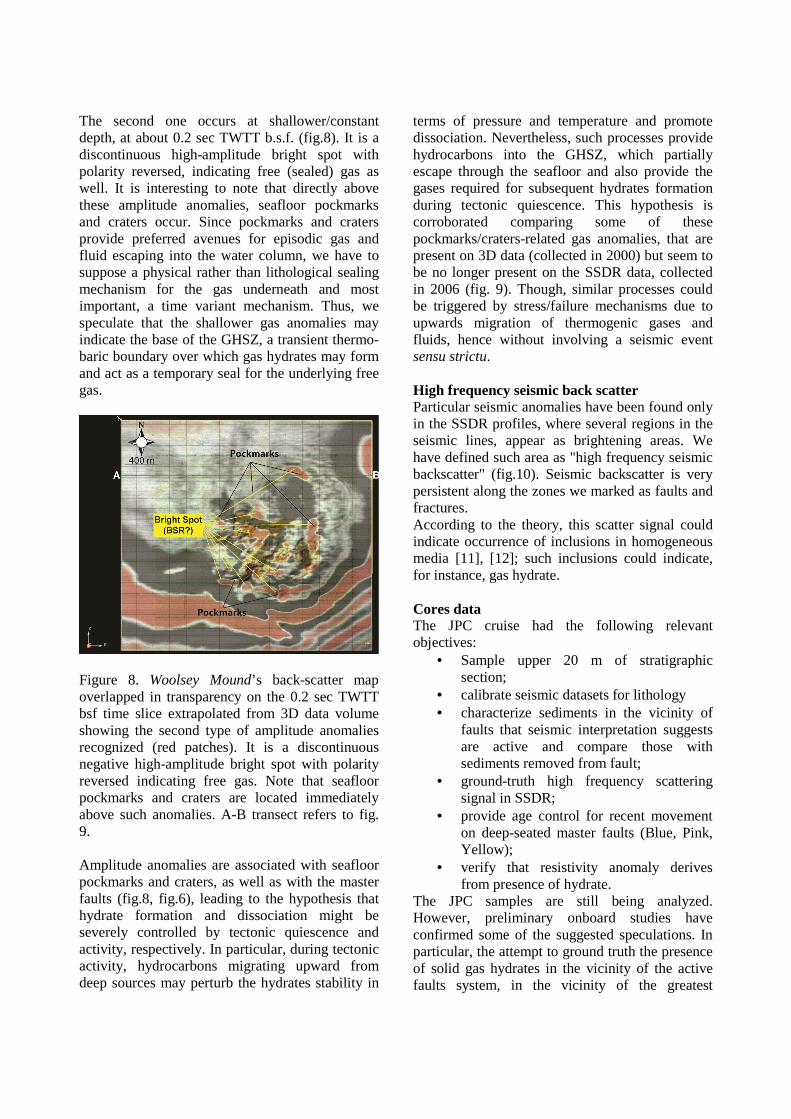
The second one occurs at shallower/constant depth, at about 0.2 sec TWTT b.s.f. (fig.8). It is a discontinuous high-amplitude bright spot with polarity reversed, indicating free (sealed) gas as well. It is interesting to note that directly above these amplitude anomalies, seafloor pockmarks and craters occur. Since pockmarks and craters provide preferred avenues for episodic gas and fluid escaping into the water column, we have to suppose a physical rather than lithological sealing mechanism for the gas underneath and most important, a time variant mechanism. Thus, we speculate that the shallower gas anomalies may indicate the base of the GHSZ, a transient thermo-baric boundary over which gas hydrates may form and act as a temporary seal for the underlying free gas.
Figure 8. Woolsey Mound’s back-scatter map overlapped in transparency on the 0.2 sec TWTT bsf time slice extrapolated from 3D data volume showing the second type of amplitude anomalies recognized (red patches). It is a discontinuous negative high-amplitude bright spot with polarity reversed indicating free gas. Note that seafloor pockmarks and craters are located immediately above such anomalies. A-B transect refers to fig. 9. Amplitude anomalies are associated with seafloor pockmarks and craters, as well as with the master faults (fig.8, fig.6), leading to the hypothesis that hydrate formation and dissociation might be severely controlled by tectonic quiescence and activity, respectively. In particular, during tectonic activity, hydrocarbons migrating upward from deep sources may perturb the hydrates stability in
terms of pressure and temperature and promote dissociation. Nevertheless, such processes provide hydrocarbons into the GHSZ, which partially escape through the seafloor and also provide the gases required for subsequent hydrates formation during tectonic quiescence. This hypothesis is corroborated comparing some of these pockmarks/craters-related gas anomalies, that are present on 3D data (collected in 2000) but seem to be no longer present on the SSDR data, collected in 2006 (fig. 9). Though, similar processes could be triggered by stress/failure mechanisms due to upwards migration of thermogenic gases and fluids, hence without involving a seismic event sensu strictu. High frequency seismic back scatter Particular seismic anomalies have been found only in the SSDR profiles, where several regions in the seismic lines, appear as brightening areas. We have defined such area as "high frequency seismic backscatter" (fig.10). Seismic backscatter is very persistent along the zones we marked as faults and fractures. According to the theory, this scatter signal could indicate occurrence of inclusions in homogeneous media [11], [12]; such inclusions could indicate, for instance, gas hydrate. Cores data The JPC cruise had the following relevant objectives:
• Sample upper 20 m of stratigraphic section;
• calibrate seismic datasets for lithology • characterize sediments in the vicinity of
faults that seismic interpretation suggests are active and compare those with sediments removed from fault;
• ground-truth high frequency scattering signal in SSDR;
• provide age control for recent movement on deep-seated master faults (Blue, Pink, Yellow);
• verify that resistivity anomaly derives from presence of hydrate.
The JPC samples are still being analyzed. However, preliminary onboard studies have confirmed some of the suggested speculations. In particular, the attempt to ground truth the presence of solid gas hydrates in the vicinity of the active faults system, in the vicinity of the greatest
resistivity anomaly previously found [13] and where the high frequency scatter had been individuated on SSDR data was successful. Figure 10 shows JPC1 and JPC3 cores locations. JPC1 was intended to sample a portion of the subsurface where SSDR data highlighted recent growth section along the blue fault (note the difference in
thickness of the yellow section between JPC1 and JPC3) and the high frequency scatter, while JPC3 was located over a "normal" spot where, based on our predictions, gas hydrates should not have been present. Figure 11 shows pictures of the JPC1 while being recovered aboard the research vessel
Figure 9. Time variant mechanism proposed for processes observed at the Woolsey Mound’s GHSZ. During tectonic activity, upwardly transient hydrocarbon migrating from deep sources may perturb hydrate stability in terms of pressure and temperature, causing dissociation. Such processes provide a supply of hydrocarbons into the GHSZ. These partially escape through the seafloor and in part lead to a subsequent hydrates formation during tectonic quiescence. The new gas hydrate formation provides the sealing mechanism for free gas coming from below the GHSZ, until a new fault-related venting (hydrate dissociation) episode occurs. This hypothesis is corroborated by some of the pockmark-related gas anomalies (rectangular area in yellow), that are present on the 3D data (collected in 2000) but seem to be no longer present on the SSDR data, collected in 2006.
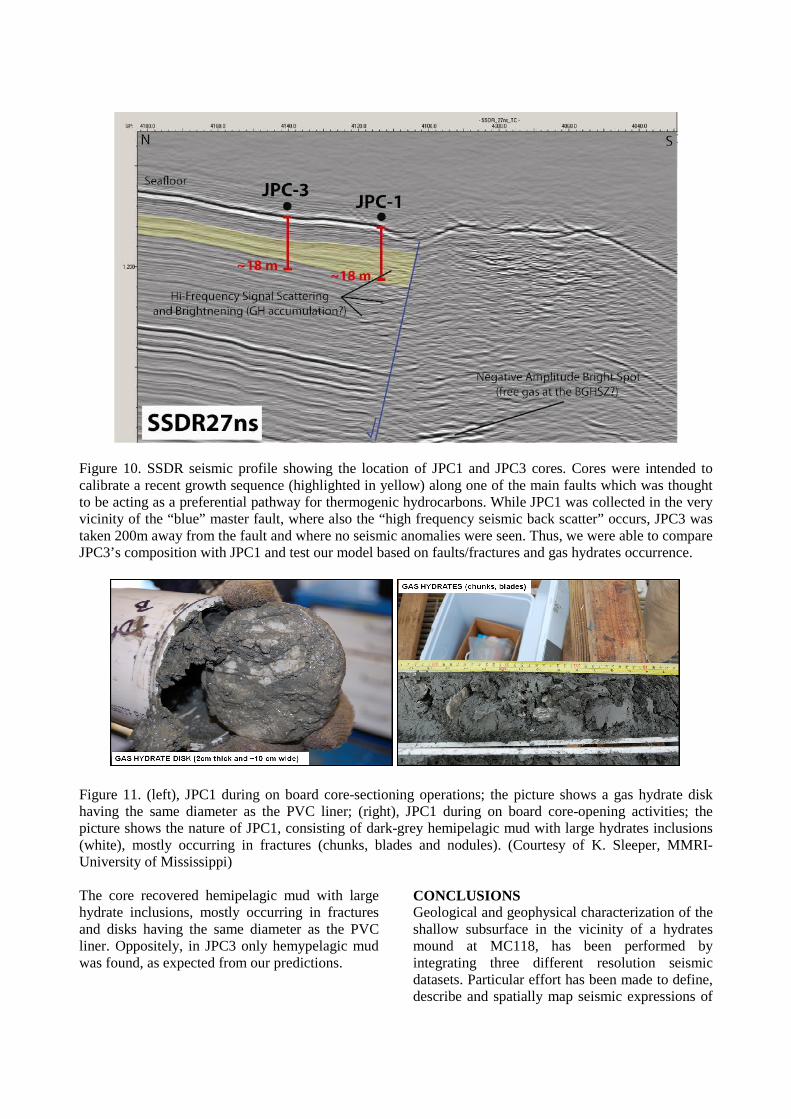
Figure 10. SSDR seismic profile showing the location of JPC1 and JPC3 cores. Cores were intended to calibrate a recent growth sequence (highlighted in yellow) along one of the main faults which was thought to be acting as a preferential pathway for thermogenic hydrocarbons. While JPC1 was collected in the very vicinity of the “blue” master fault, where also the “high frequency seismic back scatter” occurs, JPC3 was taken 200m away from the fault and where no seismic anomalies were seen. Thus, we were able to compare JPC3’s composition with JPC1 and test our model based on faults/fractures and gas hydrates occurrence.
Figure 11. (left), JPC1 during on board core-sectioning operations; the picture shows a gas hydrate disk having the same diameter as the PVC liner; (right), JPC1 during on board core-opening activities; the picture shows the nature of JPC1, consisting of dark-grey hemipelagic mud with large hydrates inclusions (white), mostly occurring in fractures (chunks, blades and nodules). (Courtesy of K. Sleeper, MMRI-University of Mississippi) The core recovered hemipelagic mud with large hydrate inclusions, mostly occurring in fractures and disks having the same diameter as the PVC liner. Oppositely, in JPC3 only hemypelagic mud was found, as expected from our predictions.
CONCLUSIONS Geological and geophysical characterization of the shallow subsurface in the vicinity of a hydrates mound at MC118, has been performed by integrating three different resolution seismic datasets. Particular effort has been made to define, describe and spatially map seismic expressions of
the hydrocarbon leakage, preeminent cause of the mound formation. Seismic data show that the MC118 hydrate mound subsurface geology is dominated by the presence of a salt body, "rooted" in the deep portions of the adjoining basin to the NW, at depths consistent with the Gulf of Mexico models of hydrocarbon generation. Upward salt movement generates a radiating pattern of faults and fractures that represents the hydraulic conduits where thermogenic hydrocarbon may migrate. This faults/fractures network appears much more complex when observed over the three datasets at different degrees of resolution. Oil industry data display few master faults nucleating at the salt dome and intersecting the seafloor. Where these intersections occur, craters and pockmarks form. Amplitude anomalies or “bright spots” at multiple stratigraphic levels occur in close spatial association with the master fault system, suggesting that hydrocarbons are migrating from the deep reservoirs via the faults and accumulate in the shallow subsurface where favorable hydraulic conditions are met. Hydrates accumulation along fractures and faults might also be indicated by a particular anomaly in the SSDR data, defined as high-frequency seismic scatter. Occurrences of hydrate and/or free gas in otherwise homogenous fine-grained sediment would constitute local variations in sediment compressibility (J. Caruthers, pers. com.). Such variations would generate inhomogeneities in the acoustic speed of propagation and serve to scatter particular frequencies within the spectrum of the seismic signal. Such evidence appears to be confirmed by geological samples, and solid gas hydrates inclusions have been found in cores targeting the high frequency scatter. SSDR data also suggest that, small fault networks, not resolvable in the oil industry data, also contribute to the hydraulic continuity between the stratigraphically separated bright spots. Comparison of coincident profiles from the TGS‐Nopec 3D seismic volume and the 2D high resolution SSDR seismic survey suggests that the geophysical signature of the subsurface at MC118 exhibits transience on the scale of years. These two seismic surveys were collected with significantly different acquisition parameters (particularly frequency and sample rate) approximately six years apart. Although the seismic response and corresponding images look considerably different, stratigraphic and structural
geometries can readily be correlated between the two datasets. While many high amplitude (bright spot), negative polarity features within the 3D volume exhibit a similar identifiable amplitude anomaly on SSDR data, there appear to be other areas where anomalies present on the 3D data (collected in 2000) are no longer present on the SSDR data (collected in 2006). One interpretation of these relationships is that fluid venting, along one or more of the shallow fault systems, has modified the subsurface fluid distribution to the degree where these changes are detectable with standard industry seismic techniques. This study supports the following conclusions:
• Gas hydrates in the Gulf of Mexico are controlled by a highly heterogeneous stability field both laterally and vertically, leading to the general paucity of BSRs [14].
• Seismic methodology should have the capability (resolution) to image different targets that may indicate presence of hydrates in the subsurface.
• Gas hydrate formation is segmented laterally along faults which are likely upwards migration pathways for thermogenic hydrocarbons.
• Gas hydrate formation and dissociation vary temporally in the vicinity of active faults, and hydrates can temporarily seal underlying free gases.
• Seafloor pockmarks and craters mark periodic/transient dissociation and venting of hydrate along associated underlying fault systems.
• Discontinuous, shallow (~100m bsf), negative high-amplitude and polarity-reversed reflectors, spatially correlated with faults, mark free gas at the base of the hydrate stability field and may represent the Gulf of Mexico’s peculiar BSR.
• Apparent temporal changes in seismic images of the subsurface are correlated with periodic/transient fluid expulsion (and hydrate dissociation/dissolution).
ACKNOWLEDGEMENTS Authors are thankful to TGS-NOPEC for the permission to show the 3D data. We thank C&C Technologies for the acquisition of the CHIRP data and the Mississippi Mineral Resources
Institute for the acquisition of SSDR data. We also thank Lookout Geophysical Company, for providing the software used for processing the SSDR data, and SMT for licensing the Kingdom Suite package used in seismic interpretations. Finally, we would like to be thankful to the staff of the Mississippi Mineral Resources Institute for coordinating off-shore activities and cruises on board of the R/V Pelican and R/V Brooks McCall. This project has been supported by the Gulf of Mexico Hydrates Research Consortium through funds provided by DOI Bureau of Ocean Energy Regulation Management and Enforcement, DOE National Energy Technology Laboratory, and DOC-NOAA’s National Institute for Undersea Science and Technology.
REFERENCES [1] Hardage B.H., Roberts H.H., Gas Hydrates in the Gulf of Mexico: What and Where is the seismic target? The Leading Edge, Vol. 25, No. 5, pp.566-571, 2006. [2] Mazzini A., Ivanov M. K., Nermoen., Bahr A., Bohrmann G., Svensen H., Planke S., Complex plumbing system in the near subsurface: Geometries of authigenic carbonates from Dolgovskoy Mound (Black Sea) constrained by analogue experiments. Marine and Petroleum Geology, 25, pp. 457-472, 2008. [3] Løseth, H., M. Gading, L. Wensaas, Hydrocarbon leakage interpreted on seismic data. Marine and Petroleum Geology, 26, 1304-1319, 2009. [4] Lapham, L. L., J. P. Chanton, C. S. Martens, K. Sleeper, and J. R. Woolsey, Microbial activity in surficial sediments overlying acoustic wipe-out zones at a Gulf of Mexico cold seep. Geochemistry, Geophysics, Geosystems, 9 (6), 2008. [5] Ingram, W.C., S.R. Meyers, C.A. Brunner, C.S. Martens, Late Pleistocene-Holocene sedimentation surrounding an active seafloor gas-hydrate and cold-seep field on the Northern Gulf Of Mexico Slope. Marine Geology, 278, pp. 43-53, 2010.
[6] Hovland, M., Judd, A.G., Seabed Pockmarks and Seepages. Impact on Geology, Biology and the Marine Environment. Graham and Trotman, Ltd., London, 293 pp., 1988. [7] Løseth, H., Wensaas, L., Arntsen, B., Hanken, N., Basire, C., Graue, K., 1000 M Long Gas Blow-Out Pipes. Extended abstract. EAGE, Amsterdam, 2001. [8] Galloway, W. E., and R. T. Buffler, Gulf Basin Depositional Synthesis Project, <http://www.ig.utexas.edu/research/projects/gbds/gbds.htm>, Accessed February 22, 2004, 2004. [9] Van Wagoner, J. C., R. M. Jr. Mitchum, H. W. Posamentier, And P. R. Vail, Part2: Key definitions of sequence stratigraphy: AAPG Studies in Geology, 27, p. 11-14, 1987. [10] Posamentier, H. W., And P. R. Vail, Eustatic controls on clastic deposition II sequence and systems tract models: SEPM Special Publication 42, p. 125-154, 1988. [11] Anderson, A.L., Hampton L.D., Acoustic of gas-bearing sediments I and II. Journal of Acoustic Society of America, Vol. 67(6), pp. 1865-1903, 1980.
[12] Anderson, A.L. Abegg F., Hawkins J.A., Duncan, M.E., Lyons A.P., Bubble populations and acoustic interaction with the gussy floor of Eckernforde Bay. Continental Shelf Research, Vol. 18, pp. 1807-1838, 1998. [13] Dunbar, J., A. Gunnell, P. Higley, M. Lagmanson, Seafloor resistivity investigation of methane hydrate distribution in Mississippi Canyon, Block 118, Gulf of Mexico, (expanded abstract), Symposium on the Application of Geophysics to Engineering and Environmental Problems, v. 23, p. 835-844, 2010. [14] Knapp, J.H., Knapp C.C., Macelloni L., Simonetti A., Lutken, C.B., Subsurface Structure and Stratigraphy of a Transient, Fault-Controlled Thermogenic Hydrate System at MC-118, Gulf of Mexico. AAPG Annual Meeting Transactions, New Orleans (LA) April 11 - April 14, 2010.


![In Search of Martian Craters - NASA · Home > User Resources > Sensing Our Planet > In Search of Martian Craters In Search of Martian Craters [1] by Laurie J. Schmidt September 20,](https://static.documents.pub/doc/80x56/5adeabc97f8b9ad66b8bd352/in-search-of-martian-craters-nasa-user-resources-sensing-our-planet-in-search.jpg)


