Page 1
Department of Product and Production Development CHALMERS UNIVERSITY OF TECHNOLOGY Gothenburg, Sweden 2015
Definition and Visualisation of Statistical Data
from a Monitoring and Inspection System Development of an interface that presents statistical data from a Machine
Vision System in a Production unit
Master of Science Thesis in the Master Degree programmes,
Production Engineering and System, Control and Mechatronics
SANDRA BAUMGARTNER
ALBERT LAWENIUS
Page 2
Department of Product and Production Development CHALMERS UNIVERSITY OF TECHNOLOGY Gothenburg, Sweden 2015
Page 3
Department of Product and Production Development CHALMERS UNIVERSITY OF TECHNOLOGY Gothenburg, Sweden 2015
Definition and Visualisation of Statistical Data
from a Monitoring and Inspection System
Development of an Interface that presents statistical data
from a Machine Vision System in a Production unit
SANDRA BAUMGARTNER
ALBERT LAWENIUS
Examiner and supervisor, Chalmers: Cecilia Berlin
Department of Product and Production Development
CHALMERS UNIVERSITY OF TECHNOLOGY
Gothenburg, Sweden 2015
Page 4
Department of Product and Production Development CHALMERS UNIVERSITY OF TECHNOLOGY Gothenburg, Sweden 2015
Definition and Visualisation of Statistical Data from a Monitoring and Inspection
System
Development of an Interface that presents statistical data from a Machine Vision System in a
Production unit
© SANDRA BAUMGARTNER, ALBERT LAWENIUS, 2015.
Examiner and supervisor: Cecilia Berlin
Chalmers University of Technology
Department of Product and Production Development
SE-412 96 Gothenburg, Sweden
Phone + 46 (0)31-772 1000
Cover: An illustration of how the classification algorithm Manto performs quality assurance.
Further explained in sub-chapter 1.3 Consat Quidance Vision.
Page 5
Department of Product and Production Development CHALMERS UNIVERSITY OF TECHNOLOGY Gothenburg, Sweden 2015
Acknowledgements
This report, Definition and Visualisation of Statistical Data from a Monitoring and Inspection
System, is written as a master thesis by two students from the master degree programmes
Production Engineering and System, Control and Mechatronics at Chalmers University of
Technology. The project was issued by Consat Engineering AB located in Partille, Sweden.
The project is intended to improve an existing Machine Vision System developed by Consat
Engineering AB. Both by recommendations on areas of improvements as well as enhance
the interface of the Machine Vision System. Further, the report presents an example of how
to visualise production statistics in the interface.
First, the authors specially want to thank our examiner and supervisor Cecilia Berlin,
assistant professor at Chalmers University of Technology, for her enthusiasm and dedication
for this thesis.
We would also like to thank Peter Hammersberg, professor at Chalmers University of
Technology, for counseling regarding production statistics with interest.
Last but not least, thanks to our supervisors at Consat Engineering AB, Andreas Svensson
and Lars-Åke Johansson, and to Emil Brandt for introducing the issue.
Thanks to all the participants from the three companies, without your opinions the outcome of
this project would not have been the same.
Sandra Baumgartner and Albert Lawenius, Gothenburg January 2015
Page 6
Department of Product and Production Development CHALMERS UNIVERSITY OF TECHNOLOGY Gothenburg, Sweden 2015
Abstract
Automated production lines are commonly seen in Swedish industries to provide the
customer with low prices and short delivery times. However the speed of the automated
production lines demands the quality control to not only be repeatable and accurate but also
to be fast. There are various options available to automatically ensure quality today. One
alternative is Machine Vision System which could be used to quickly ensure quality of the
process or product.
The purpose of this project was to investigate development potentials for an existing Machine
Vision System. The system could be compared to the human eye and brain that has the
complexity to recognize patterns and deviation. The Machine Vision System developed by
Consat Engineering AB was mainly used for quality control, inspection and robot positioning.
The project focused on how production statistics could be visualised in the Machine Vision
System´s interface. The methods used in order to collect data were observations and
interviews with participants from three companies. The development of the final result
focused on visualisation of production statistics at one of the companies.
The result of this project was a concept model that presented how production statistics could
be visualised and a list with development potentials based on data from interviews and
observations.
Keywords: production statistics, statistical process control, SPC, snowball recruitment,
interviews, observations, data collection, concept model, interface, machine vision,
monitoring system.
Page 7
Department of Product and Production Development CHALMERS UNIVERSITY OF TECHNOLOGY Gothenburg, Sweden 2015
Nomenclature
Beneficiaries Identified users of the concept model
Concept model
Visualisation of statistical data integrated in Consat Quidance Vision interface
Consat Consat Engineering AB
CQV Consat Quidance Vision
DMAIC Define-Measure-Analyse-Improve-Control, improvement methodology in Six Sigma projects
DPMO Defect part per million opportunities
HTML HyperText Markup Language
MVS Machine Vision System
PLC Programmable Logic Controller
Process The machine, and hardware, that holds the process of producing a product
SIPOC Suppliers, Inputs, Process, Outputs and Customers
Stakeholder Representative affected by a development of the CQV interface
Statement Expression from the participants in the interviews and observations
PDCA Plan-Do-Check-Act a four step method for control and continuous improvements within an organization
Page 8
Department of Product and Production Development CHALMERS UNIVERSITY OF TECHNOLOGY Gothenburg, Sweden 2015
Table of contents
1. Introduction ..................................................................................................................... 1
1.1. Background ............................................................................................................. 1
1.2. Machine Vision ........................................................................................................ 3
1.3. Consat Quidance Vision .......................................................................................... 4
2. Project definition ............................................................................................................. 8
2.1. Pre-study ................................................................................................................. 8
2.2. Purpose and Goal ..................................................................................................10
2.3. Delimitations...........................................................................................................10
2.4. Problem definition ..................................................................................................10
3. Methodology ..................................................................................................................11
3.1. Research approach ................................................................................................11
3.2. Data collection ........................................................................................................12
3.2.1. Snowball recruitment .......................................................................................12
3.2.2. Qualitative data collection ...............................................................................13
3.3. Analysis of the collected data .................................................................................14
3.3.1. KJ analysis ......................................................................................................14
3.3.2. Function analysis ............................................................................................15
3.3.3. Specification of requirements ..........................................................................15
3.4. Synthesis ...............................................................................................................16
4. Theory ...........................................................................................................................17
4.1. Design for the human .............................................................................................17
4.2. Collect statistical data .............................................................................................18
4.3. Graphs ...................................................................................................................18
4.4. Production statistics ...............................................................................................20
4.4.1. Six Sigma ........................................................................................................20
4.4.2. Statistical Process Control...............................................................................22
Page 9
Department of Product and Production Development CHALMERS UNIVERSITY OF TECHNOLOGY Gothenburg, Sweden 2015
5. Results ..........................................................................................................................27
5.1. Stakeholders ..........................................................................................................27
5.2. Interviews ...............................................................................................................28
5.2.1. Quality department ..........................................................................................28
5.2.2. Manager ..........................................................................................................30
5.2.3. Process Engineer 1 .........................................................................................31
5.2.4. Process Engineer 2 .........................................................................................32
5.2.5. Novice Operators ............................................................................................34
5.2.6. Experienced Operator .....................................................................................35
5.3. Observations ..........................................................................................................36
5.3.1. Company B .....................................................................................................36
5.3.2. Company C .....................................................................................................39
6. Analysis .........................................................................................................................41
6.1. KJ analysis .............................................................................................................41
6.2. Function list ............................................................................................................42
6.3. Function tree and specification of requirements .....................................................43
7. Synthesis .......................................................................................................................45
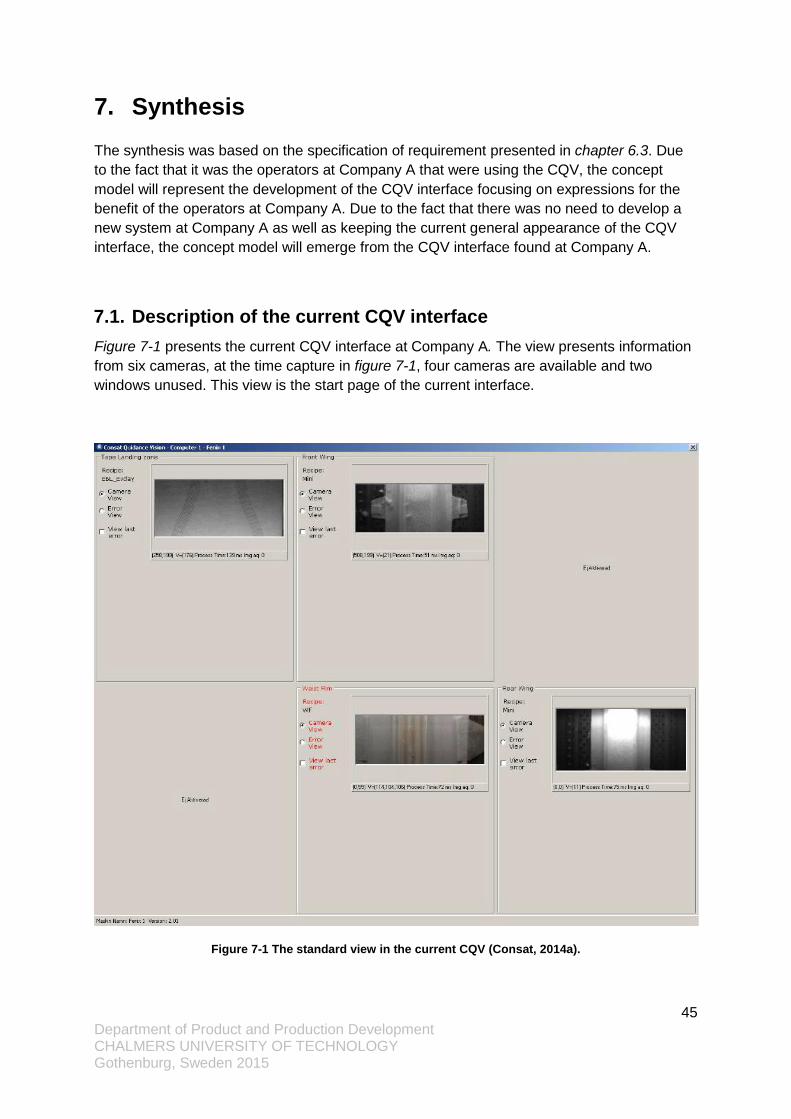
7.1. Description of the current CQV interface ................................................................45
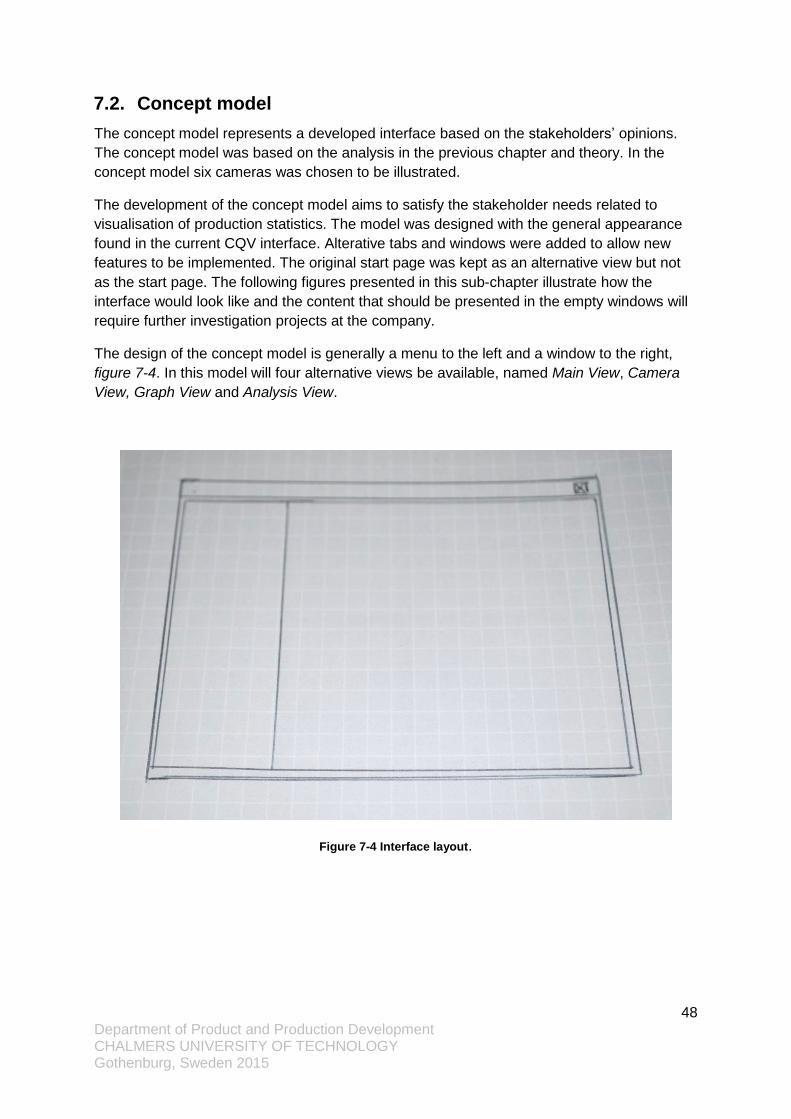
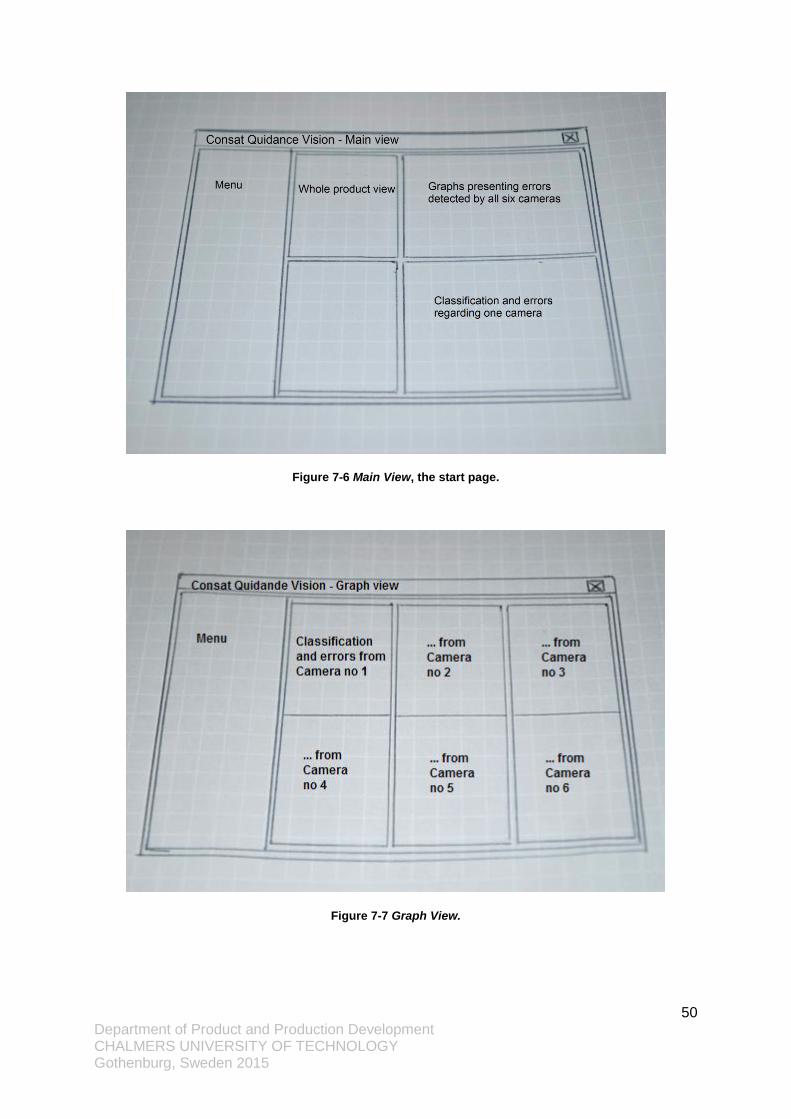
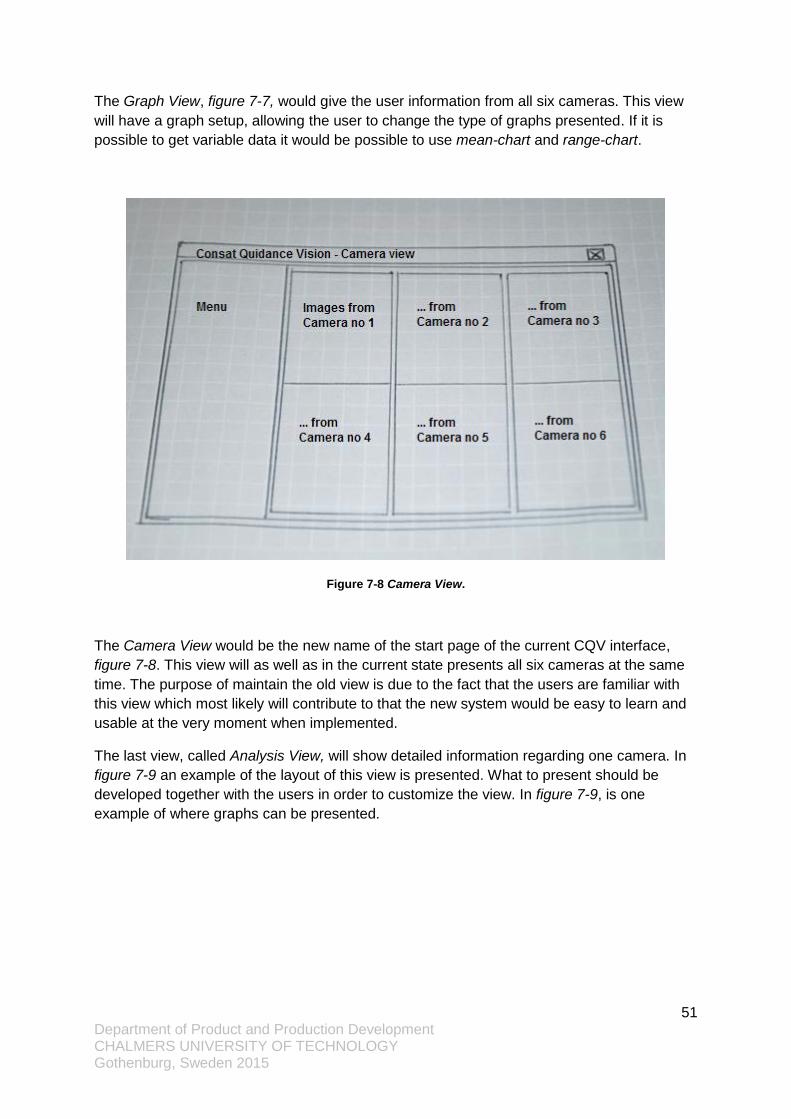
7.2. Concept model .......................................................................................................48
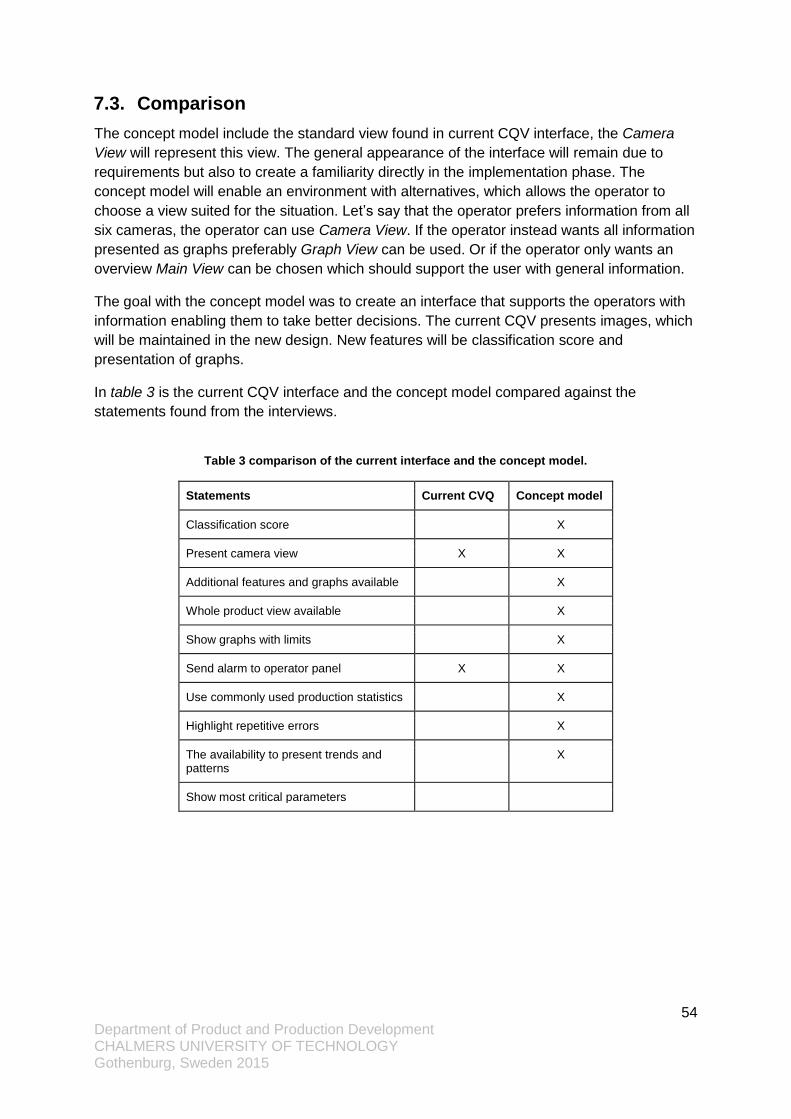
7.3. Comparison ............................................................................................................54
8. Discussion .....................................................................................................................55
8.1. Data collection and analysis ...................................................................................55
8.2. The concept model .................................................................................................56
8.3. Further development ..............................................................................................57
9. Conclusion.....................................................................................................................58
10. References ....................................................................................................................59
A. Interview template ............................................................................................................
B. Sorted statements from the KJ analysis ............................................................................
C. Six Sigma .........................................................................................................................
D. Statistical process control .................................................................................................
Page 10
1 Department of Product and Production Development CHALMERS UNIVERSITY OF TECHNOLOGY Gothenburg, Sweden 2015
1. Introduction
Automation today is commonly seen in Swedish industries. A common system used to
ensure repetitive quality inspection is machine vision. Machine vision can control a process
and at the same time supply the user with a lot of data in a short period of time (USTECH,
2013).
The increased passion for collecting parameters in Swedish companies seems to be a part of
the future, hand in hand as the technology develops. Today´s society is all the time logging
and saving data in order to map and predict trends and events, as the outbreak of a flu or
equalise the utilisation of the wireless phone lines (Vetenskapens värld, 2014). But collecting
data not only mean that the ability to find trends and patterns emerge, the use of statistical
tools are necessary in order to handle large quantities of data.
1.1. Background
This project was conducted by two students from Chalmers University of Technology within
the master programmes of Production Engineering and System, Control and Mechatronics.
The project was issued by Consat Engineering AB, an engineering agency located in Partille,
Sweden.
The purpose was to deliver a foundation for further development of an existing Machine
Vision System (MVS) developed by Consat. The MVS goes by the name Consat Quidance
Vision (CQV) and was installed at various industries in Sweden, mainly used for quality
control, inspection and robot positioning. The goal with this project was to find improvement
potentials for the CQV and to present a concept to visualise production statistics in the CQV
interface.
This project emerged due to customers’ interest in further development of the CQV interface.
One customer, that at the time was using CQV for quality inspection at their production unit,
had expressed that they would be interested in developing the CQV interface for usability
and presentation of production statistics. The focus was to determine if production statistics
was of interest and how this would be presented in the CQV interface. The standard view of
the interface found at the company is presented in figure 1-1.
Page 11
2 Department of Product and Production Development CHALMERS UNIVERSITY OF TECHNOLOGY Gothenburg, Sweden 2015
Figure 1-1 The standard view in the current CQV interface (Consat, 2014a).
Two other customers were also of interest to investigate in this project due to their interest in
developing the CQV platform.
A requirement from Brandt (2014) and Svensson. A (2014) was that the developed interface
should have the same general appearance as the current CQV interface, see figure 1-1.
Consat wanted the project to determine potential development areas for their MVS as well as
present one example of a developed interface based on opinions found at one customer.
The representatives from the companies were predefined by Consat. All three companies
were manufacturing companies with production units located in Sweden.
Page 12
3 Department of Product and Production Development CHALMERS UNIVERSITY OF TECHNOLOGY Gothenburg, Sweden 2015
1.2. Machine Vision
Machine vision is a technology which can replace or work as a complement to manual
measurement. A MVS operates with inputs from sensors and cameras, figure 1-2, and
delivers a result based on predefined limits. This technology can be found in many different
areas such as parking assistance in a car or surveillance system in a shopping mall. The
goal of using machine vision in a production unit is to improve the throughput and yield but
also to ensure product quality (Sick IVP, 2006).
Figure 1-2 General solution of a production line using machine vision (USTECH, 2013).
A conventional MVS operates with 2D images but a variety of other applications exists. 3D
images can be established with a 2D image together with measurements of the object,
conventionally performed by laser (Sick IVT, 2006).
Commonly white light is used to illuminate the object but it exist applications were white light
is not sufficient. Detection of adhesives could be illuminated with is one application where
white light preferably could be replaced by UV light that highlights the adhesives (Johansson,
2014).
Machine vision can operate with a variety of algorithms. Counting pixels (measure), digital
filters (highlight a specific part), edge finding, blob analysis (measure centroid, area, length
and orientation of an object) and pattern matching (comparison of objects) are a few that are
commonly used for image processing (Sick IVP, 2006).
Outputs from the MVS could be sent to a picking robot, a PLC or other types of systems. The
output to a picking robot could be coordinates which tells the robot where to operate, this can
Page 13
4 Department of Product and Production Development CHALMERS UNIVERSITY OF TECHNOLOGY Gothenburg, Sweden 2015
be referred as guidance. The output could also be information about a non-approved product
and used as a quality assurance in a production line, this is referred as quality (Sick IVP,
2006).
Fabel (1997) presents the reason to why machine vision has become popular in production
units are because quality inspection is repetitive and requires accurate measurement. A
monitoring system can handle big amount of data in a short period of time and performs
decisions based on equal criteria every time. A MVS can not only contribute to adequate
decisions it can also detect what is impossible for the human eye, referring to infrared light,
x-ray and magnetism (Fabel, 1997).
1.3. Consat Quidance Vision
Consat has developed a flexible MVS called Consat Quidance Vision (CQV). The word
Quidance can be read out as Quality and Guidance. CQV is a fully scalable platform that in
the manner of desire allows different tasks and tools to be combined and offers a platform
with almost unlimited possibilities according to Brandt (2014). Application areas for the CQV
platform are mainly quality control, inspection and robot positioning. With quality inspection
both classification and measurement application can be covered, and combined quality
inspection and robot positioning can be used for increased functionality (Consat, 2014a).
The hardware of CQV is in general a computer, a grayscale and/or a colour camera, light
panels, network adapter and a display, illustrated in figure 1-3. The cameras are triggered
with a trigger signal from a PLC when the product is passing the cameras. If the image is
classified as “not ok” the vision system will send an error signal to the PLC which allows it to
track the defect products and remove them from the production process (Consat, 2014a).
Figure 1-3 General schedule of CQV
CQV is installed at a number of clients in different type of industries where both robot
positioning and quality inspection were in use. CQV has the ability save images of defect
products to enable optimization of the production unit. Furthermore, CQV has a standard
Computer
PLC Interface
Camera Network
Image &
Decision
Image Image
Decision
Page 14
5 Department of Product and Production Development CHALMERS UNIVERSITY OF TECHNOLOGY Gothenburg, Sweden 2015
user interface that provides the user with information from the process, and offers the user to
control and adjust production process to some extent (Consat, 2014a).
CQV commonly operates with an algorithm called Manto. This algorithm uses reference
images to decide whether a product is correct or not. This can be compared to manual
inspection comparing one product to already approved products. Figure 1-4 illustrates how
Manto can detect “ok bears” and “not ok bears”. Below the decision surface are bears that
are similar to the “ok” bears but sorted out due to the fact that they are incomplete (Consat,
2014a).
Figure 1-4 Manto classifies “ok” and “not ok” products (Consat, 2014a).
CQV was designed to handle several algorithms. One other algorithm used besides Manto is
Blob detection. The Blob algorithm delivers information of an image which makes it possible
to calculate length, area, location and orientation of an object (Consat, 2014a). Example of
this is presented in figure 1-5 where Blob has been used for calculate picking points for 5
products.
Page 15
6 Department of Product and Production Development CHALMERS UNIVERSITY OF TECHNOLOGY Gothenburg, Sweden 2015
Figure 1-5 Blob has calculated picking points, marked with red dots (Consat, 2014a).
When the system has processed an image, with Manto and/or the Blob detection algorithm,
the system presents the output in the CQV. The CQV interface presents the last captured
image. If a “not ok” product is found the image of the product will be shown in the View last
error, see figure 1-6. The image will be saved and an error history is available even after the
error occurred (Consat, 2014a).
Figure 1-6 Interface of camera view and the last error view in CQV (Consat, 2014a).
Page 16
7 Department of Product and Production Development CHALMERS UNIVERSITY OF TECHNOLOGY Gothenburg, Sweden 2015
The error view presents stored images in a chronologic list, figure 1-7. This provides the user
with an overview of recent production problems.
Figure 1-7 Error view with a chronological list.
Page 17
8 Department of Product and Production Development CHALMERS UNIVERSITY OF TECHNOLOGY Gothenburg, Sweden 2015
2. Project definition
This chapter aims to clarify the projects purpose and goal. The customer that expressed
interest in developing the CQV interface was visited at the beginning of this project. The visit
represents a pre-study with the purpose to enhance details and depth regarding the CQV
system installed at the customer’s production unit. This customer will further be mentioned as
Company A. Supplied perception from the pre-study contributed to the development of the
template used for interviews conducted at the same company, presented in chapter 5.
The goal of the pre-study was to explore the CQV at Company A by investigate the following
topics:
The stakeholders
Significant information related to the industry, precision and quality regarding their
process and product
Where machine vision could be found
Commonly used production statistics
2.1. Pre-study
Company A was a manufacturing company located in Sweden. At the plant seven automated
production lines were installed operating 24/7 except for special holidays. Each production
line had three operators in each of their five shifts. The production lines had the capacity of
producing between 500 and 1200 products every minute.
The final product consisted of a number of raw materials that was merged together in the
production process. At the end of the process the products were packed into plastic bags
and cartons and stored in their local warehouse. The process was almost fully automated
except for the raw material supply which was handled manually by the operators. At various
places in the process were cameras, connected to the CQV, installed to perform quality
inspection directly when the raw material was merged onto the product. The CQV´s purpose
was to decide with the Manto algorithm (Manto is explained in 1.3 CQV) about the condition
of the product directly in the CQV interface and the operator panel.
If CQV detected a deviation in quality a notification was sent to both CQV interface and to the
operators’ panel, both screens were located close to the production unit. The operator panel
was the main screen used by the operators to find information regarding the production unit,
where also alarms detected by the CQV were presented. If an error was presented in the
operator panel, the operators could decide whether to stop the production and try to find the
cause or ignore the notification. Major errors forced the production process to automatically
slow down or to shut down, to get the machine up and running again the operators needed to
find the cause of the error and restore it manually.
The operators were responsible to perform manually tests every 15 minute on four complete
products, tensile and strain testing, to ensure quality. Test necessary to perform due to the
fact that current quality system was not used to detect those parameters. These results were
Page 18
9 Department of Product and Production Development CHALMERS UNIVERSITY OF TECHNOLOGY Gothenburg, Sweden 2015
sent to another department, the quality department. A drawback with the manually performed
tests was that it left the product incomplete which made it impossible to redo the test.
The pre-study involved a meeting and a supervised tour at the production plant with the
determined representative, a process engineer, referred as P2 (2014c). The process
engineer was responsible for one of the production lines where the CQV was installed for
quality inspection.
The process engineer provided the researchers with potential stakeholders for visualisation
of production statistics in the CQV interface:
Operators
Quality department
Process engineers
Manager of the production unit
Commonly used production statistics were Six Sigma and statistical process control.
Figure 2-1 Illustration of the product produced by Company A.
The product consisted of one back sheet with four panels, two placed in the front and two in
the back of the product, figure 2-1. A core filled with absorbing mass was mounted directly on
the back sheet and along the sides were elastic threads attached with adhesives.
The adhesive process was controlled by a pump. The core mass was filled directly onto the
back sheet of the product. The final products were then time stamped and packed in plastic
bags in batches of 20. Last step was to pack an amount of plastics bags into a carton box.
The time stamps were added on both the plastic bags and the cartons.
Page 19
10 Department of Product and Production Development CHALMERS UNIVERSITY OF TECHNOLOGY Gothenburg, Sweden 2015
2.2. Purpose and Goal
The purpose and goal with this project was to deliver a foundation for future development
projects of the CQV platform and to develop a concept model that presents how to visualise
production statistics in the CQV interface.
2.3. Delimitations
This project contained qualitative and empirical studies at three manufacturing companies in
Sweden. The visited companies were predetermined by Consat. Interviews were conducted
at one company and the participants were recruited by company employees. The result of
the interviews worked as a foundation for the development of the CQV interface.
Observations were conducted at two companies. This project resulted in a foundation for
future development project of the CQV based on data acquired from empirical studies at
three companies. This report presents one concept that illustrates how production statistics
could be visualised. This project excludes implementation and investigation of the
delimitations of the CQV platform.
2.4. Problem definition
The pre-study defined that CQV had potential to be used in more areas and be adopted to
benefit the user. The development of the current CQV was conducted without input from the
users. The researchers aimed to find how the CQV could be developed by interviewing and
observing companies that used CQV. This project resulted in a list with sorted statement
based on the interviews and observations. Further this project presents a concept model that
illustrates how to visualise production statistics in the CQV interface.
Page 20
11 Department of Product and Production Development CHALMERS UNIVERSITY OF TECHNOLOGY Gothenburg, Sweden 2015
3. Methodology
This chapter presents the methodology used to fulfil the goals and the purpose of this
project. This chapter includes methodology used for literature review, data collection,
analysis and development of a concept model.
3.1. Research approach
The research was divided in two tracks, figure 3-1. The tracks were conducted in parallel
through the project duration. The first track, literature review consists of theory regarding
production statistics and how to design an interface. The purpose of the literature review was
to gather a theoretical base for this project.
Figure 3-1 Research structure for this project
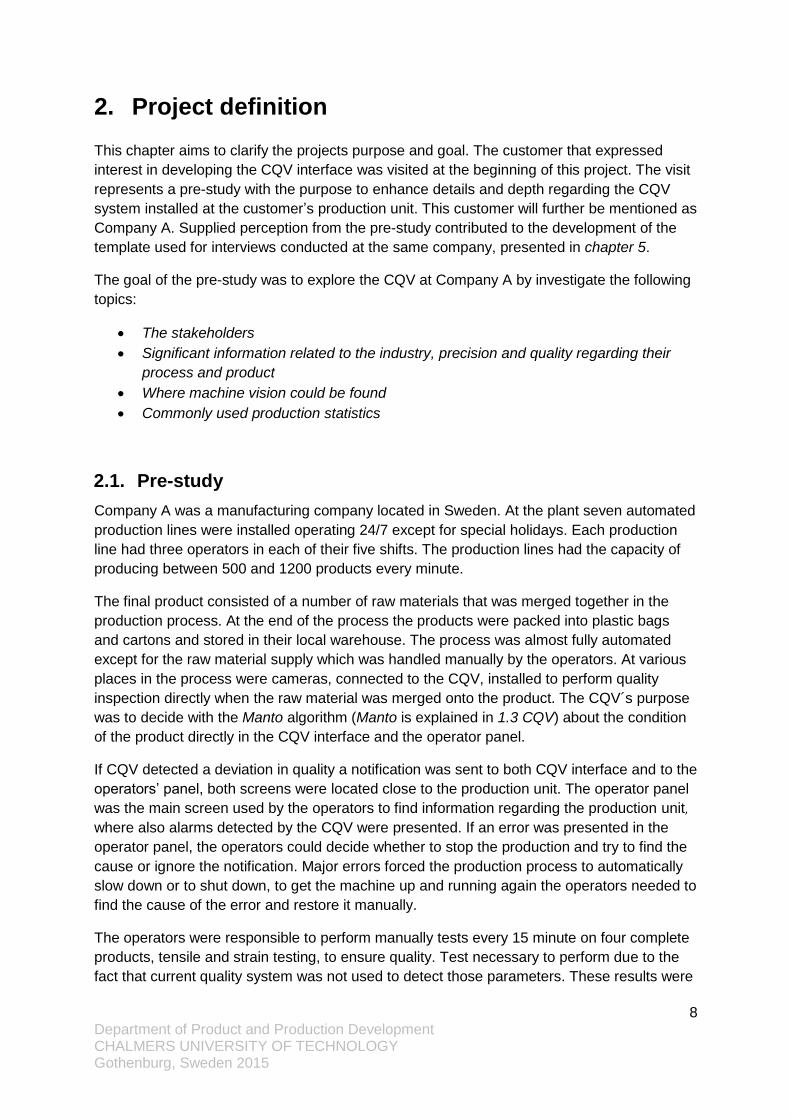
The empirical study was divided into five phases. The pre-study gathered material in order to
design and conduct the data collection. The data collection consisted of two parts, interviews
at Company A and observations at Company B and C. In the analysis were collected
statements from the data collection sorted and mapped in order to find where visualisation of
production statistics was expressed. The analysis included KJ analysis, function analysis and
a development of specification of requirements. The concept model was developed from the
specification of requirements with support from theory gathered in the literature review.
Page 21
12 Department of Product and Production Development CHALMERS UNIVERSITY OF TECHNOLOGY Gothenburg, Sweden 2015
Figure 3-2 Research structure for the empirical study.
3.2. Data collection
The purpose with the data collection was to gather data from the three companies in order to
develop a function list based on empirical studies. This section presents the methodology
used to find requirements and needs from the predetermined participants from the three
companies and from recruited interviewees at Company A.
The data collection included interviews conducted at one company and observations
conducted at two companies. Interviews at Company A, observations at the two other
companies further mentioned as Company B and Company C. The list of statements that
was established contains statements from the interviews and the observations.
3.2.1. Snowball recruitment
To find participants for the interviews related to the production unit at Company A, snowball
recruitment was used. The snowball recruitment method responds to that the determined
representative at Company A recommended company employees for the interviews. Further,
the employees were in their turn recommending other employees. Finally, the chosen
participants for the interviews were employees related to the production unit at Company A,
and also representatives from the identified departments from the pre-study. Snowball
recruitment is time effective and simple but limits the researchers´ overall view of the
distribution of the recruited stakeholders (Explorable, 2009).
The snowball recruitment method was useful to be able to find participants for the interviews
within the time duration of this project. The participants should represent the identified
departments from the pre-study and be connected to the production unit at Company A. It
was not important that the interviewees were familiar with the CQV system due to the fact
that the purpose was to find development potentials beyond the current CQV platform.
Page 22
13 Department of Product and Production Development CHALMERS UNIVERSITY OF TECHNOLOGY Gothenburg, Sweden 2015
3.2.2. Qualitative data collection
Interviews are commonly performed in a structured, unstructured or semi-structured way
(Berlin and Adams, 2014). This project includes semi-structured interviews.
The strategy was to have head questions and allow sub questions and additional topics to
emerge during the interview session. During the sessions the interviewees’ words were
formulated and written down on paper. The data collection aims to find information
expressed by the interviewees. The data collection was conducted with an interview
template, the template can be found in appendix A – Interview template. The interview
template contained questions aiming to investigate the following purposes:
Find general information regarding the interviewees’ work tasks and background
Detect how they work and possible obstacles in their daily work
Find development potentials related to vision
Find commonly used production statistics
Find frequent problems
Find out how information preferably can be presented
The observations at Company B and C were conducted with a supervised tour at their
production unit with the dedicated participants. During the observations information were
gathered from what was visual in the production unit together with discussions and
expressions from the representative. The data collections at Company B and C were not
aiming to observe workers or processes, the aim was to enhance the perspective on how the
companies worked with and potential future use of machine vision.
Page 23
14 Department of Product and Production Development CHALMERS UNIVERSITY OF TECHNOLOGY Gothenburg, Sweden 2015
3.3. Analysis of the collected data
This sub-chapter presents how the analysis of the collected data was performed. The
purpose of the analysis was to develop a function list and a specification of requirements for
the development of a concept model.
Figure 3-3 Structure of the analysis.
The KJ analysis resulted in a list of statements, further derived into functions and finally
resulting in a specification of requirements used for the development of the concept model,
figure 3-3.
3.3.1. KJ analysis
The KJ analysis was developed in the 1960´s by Kawakita Jiro, hence its name, which is
used as a management and planning tool. The transformation of the notes from the
interviews and observations into a sorted list was performed with a KJ analysis (also known
as the affinity method or post-it method). The KJ analysis contributed to sort the statements
and analyse the collected data. The goal was to write down one statement on a post-it and
sort them into themes. Statements found in the data collection were handled individually. The
advantage of using this method is that it starts with evaluating the statement and aims to find
headlines and categories during the analysis session (Bligård, 2011).
Following methodology was used to perform the KJ analysis:
1. Statements were taken from the data collection, collected by interviews and
observations
2. The statements were written down on post-it notes, one statement on each post-it
3. The post-it notes were randomly placed on a table
4. Both researchers were allowed to sort the post-it´s into groups by themes, after
discussions one solution was established
5. The themes were named
6. Additional step, the step 4 was performed again. This step was useful in order to find
master headers for some of the themes
7. The diagram was then complete. Master headers were named, discussed and the
analysis was documented, figure 3-4.
Page 24
15 Department of Product and Production Development CHALMERS UNIVERSITY OF TECHNOLOGY Gothenburg, Sweden 2015
Figure 3-4 Statements written on post-it´s grouped into themes with master header in the KJ analysis.
3.3.2. Function analysis
A goal with this project was to deliver a concept model of a CQV interface. To find functions
that this system should contain a function analysis was made. A function analysis contributes
to find what functions to have, but not how or why (Bligård, 2011). The function analysis was
conducted with the results from the KJ analysis and contributed to the development of a
specification of requirements.
Function list
The goal of the function analysis was to find what functions the concept model should
include. The functions listed were termed with a verb, a noun and possibly a clarification
(Johannesson et al, 2004). The functions were divided into main, necessary and wanted
functions. This should show how important each function was and contribute to a
development of a concept model based on the result from the data collection.
Function tree
A function tree was created to show the relations between the functions. This function tree
graphically expressed the relations and connections between the functions. A movement
upwards in the tree refers to why a function exist, while the movement downwards refers to
how a function is satisfied (Bligård, 2011).
3.3.3. Specification of requirements
The function list was then derived into a specification of requirements, the foundation for the
development of a concept model. A specification of requirements can contribute to that the
established result fulfils the demands of a user (Bligård, 2011). The specification of
requirements was presented in a list with one requirement on each row. Each requirement
was presented with a clarification and a classification, expressing the importance of the
fulfilment of the requirement. The classification was ranked with Must, Necessary and Want
where Must represented the most important and Want the least important requirement to
fulfil.
Page 25
16 Department of Product and Production Development CHALMERS UNIVERSITY OF TECHNOLOGY Gothenburg, Sweden 2015
3.4. Synthesis
A concept model was created based on theory and the specification of requirements. The
goal was to visualise production statistics and the concept model will illustrate one example
in how this could be maintained. The concept model was illustrated with HTML since it was a
suitable way to express the developed interface with the general appearance found in the
current CQV interface. The concept model represents an interface that allows visualisation of
production statistics to be presented.
Page 26
17 Department of Product and Production Development CHALMERS UNIVERSITY OF TECHNOLOGY Gothenburg, Sweden 2015
4. Theory
This chapter presents how to design an interface with the human in mind and theory related
to production statistics. This chapter aims to support the development of the concept model.
4.1. Design for the human
The design of a user interface should enable the user with easy access to the information
needed in order to perform the tasks in a safe and secure way. It should guide and support
the humans cognitive ergonomic and the users´ mental and physical disabilities need to be
taken into account in the design of a user interface.
When designing a system, there are limitations not only from the computer system side but
also from what the human system can handle. The human brain can handle a lot of different
perceptions at the same time, but to be able to create a comfortable environment some
conditions need to be concerned. When designing a new system with new features it can be
hard to directly understand how to use it, therefor it is sufficient to use logics and symbols
which supports the users cognitive ergonomics. Inventing a totally new system can be rather
interesting for the designer but can cause distraction from the purpose of the system for the
users. Good cognitive ergonomics will likely lead to less resistance and easy usage. The
designer should have in mind that a display should help the users to perform their job as
good as possible and not the opposite (Bohgard et al. 2010).
To create an interface with good cognitive ergonomics that draws the attention to the right
place it is essential to use familiar symbols and sounds (Bohgard et al, 2010). People have
their own mind maps in how to read symbols and a development together with the users will
bring an idea of what symbols to use to create a self-explaining environment. Something to
have in mind when choosing colours is in general that no more than four colours should be
used (Bohgard et al. 2010).
The brain creates mental models from situations in daily life, which can be seen as a human
brain algorithm. The human brain is able to process, mix and compare information from
many different senses and decide how to handle information. As for the memory, it is known
that the brain can keep 7 ± 2 items in the short term memory, it is important to design with
this in mind to not force the users to remember things in order to perform their job (Mattsson,
2014).
Things to have in mind in the design phase to support attention, perception, memory and
mental models according Mattsson (2014):
1. Design to minimize the time to find information
2. Keep the information close to where the attention is
3. Use multiple senses such as hearing and sight
4. Present information on correct angled displays with high contrast and good
illumination
5. Design for good readability: font, colour and size of the text
Page 27
18 Department of Product and Production Development CHALMERS UNIVERSITY OF TECHNOLOGY Gothenburg, Sweden 2015
6. Avoid knowledge based information, have in mind that the design should suit a wide
scale of individuals
7. Use redundant information to support the user
8. Avoid having similar symbols and sounds to minimize confusion
9. Design to minimize the use of short-term memory
10. Try to give the users proactive information, forecast the situation
11. Consistent representation
12. Illustrate realism if possible
13. Dynamic information can be reached using movable objects
A system that supports the user can create a work environment where the user is active and
alert (Berlin and Adams, 2014). Overwhelming the user with information will probably not
draw attention to what is important. An agile design, designing in cooperation with the user,
could serve the user with sufficient information in order to take good decisions (Bohgard et
al, 2010). A system should have short term memory support and redundancy to highlight
important information according to Bohgard et al (2009), as well as support the user with
information in a non-complicated way.
4.2. Collect statistical data
When it comes to measuring there is a question of why it is in need of measurement and
what to measure to maintain the requirements that contributes to quality of the process.
Organisations today seem to have a high focus on measuring but it is common that this data
never gets the attention or useless for its purpose (Hammersberg, 2012). Connecting an
object to the process could enable essential data to be related to a certain time capture.
The use of statistics can contribute to detecting patterns and trends that otherwise most likely
would go missing when analysing a big amount of data. A computer is constructed to perform
quick calculations while a human is better to determine if right information is selected. Today
there are algorithms that can detect patterns from large amounts of data (Vetenskapens
värld, 2014). More opportunities are provided when more data is available to base decisions
on as well as the analysis becomes harder. Subgrouping data is one way to handle a big
amount of data (George et al, 2005).
4.3. Graphs
Graphs can be used to present data. The ability to take decisions from a self-explaining
graph will likely contribute to faster decision making. Different data charts can tell different
things. If things are presented correctly a better a more qualitative decision can be taken
(Hammersberg, 2014).
There is various ways to collect data and also options to describe and to visualise data with
the use of statistics. Graphs can be used in ways that gives easy access to information for
the viewer and other can distract and complicate the situation. The selection of control charts
Page 28
19 Department of Product and Production Development CHALMERS UNIVERSITY OF TECHNOLOGY Gothenburg, Sweden 2015
can vary depending on what type of data, example continuous or discrete, that should be
presented.
Time series plots
Time series plot can be used to visualise things that vary over time to also present in which
order they occurred, figure 4-1. A time series plot diagram can be constructed without
advanced statistical software. Another advantage is that it is easy to interpret without deeper
statistic knowledge and gives the possibility to see trends and process variation (George et
al, 2005).
Figure 4-1 Time series plot.
Figure 4-2 Schematic control chart with warning lines.
Page 29
20 Department of Product and Production Development CHALMERS UNIVERSITY OF TECHNOLOGY Gothenburg, Sweden 2015
More diagrams can be found in the book Statistical Process Control written by Oakland
(2008). Lines such as warning lines can be implemented in order indicate deviation in the
system (Oakland, 2008). Figure 4-2 presents a diagram with warning lines in form of upper
control limit (UCL) and lower control limit (LCL).
4.4. Production statistics
This chapter presents commonly used production statistics and work tools included in Six
Sigma and SPC. The sub-chapter aims to give the reader a brief explanation of production
statistics.
4.4.1. Six Sigma
The name Six Sigma is taken from the math where the Greek letter σ (sigma) is used to
denote the spread value of a standard deviation. To reach Six Sigma quality the process
shall have less than 3.4 defects per million opportunities (DPMO) according to eHow (2014).
Six Sigma is a method that can be used for different types of projects such as improvement
projects.
Methodology - DMAIC
Five phases are explained in the Six Sigma methodology to in a structured way handle
problem solving. The five phases are:
Define
Measure
Analyse
Improve
Control
The method is referred as DMAIC. The methodology for improvement projects DMAIC in Six
Sigma requires involvement from the employees at various departments in an organisation in
order to keep the knowledge and continue the development. DMAIC is more detailed
explained in appendix C –Six Sigma.
Measurement System Analysis
The purpose of measure system analysis (MSA) is to determine if the system can generate
quality data, data with required accuracy. It is not uncommon that 30-50% of all
measurement systems found in a company is incapable of delivering accurate or precise
measurement. Gauge R&R, Bias analysis, stability analysis, discriminant analysis and kappa
analysis are all types of MSA. Measurements need to be both accurate and precise.
Accuracy and precision is not the same thing meaning that they have independent properties
(George et al, 2005).
The goal is to have data with absolute accuracy (George et al, 2005). Figure 4-3 illustrates
combinations of accuracy and precision. No 1 in figure 4-3 indicates that the process may be
Page 30
21 Department of Product and Production Development CHALMERS UNIVERSITY OF TECHNOLOGY Gothenburg, Sweden 2015
accurate but imprecise. In no 2, the process is both accurate and precise also referred as
absolute accuracy. In no 3 inaccurate and imprecise, and last no 4 inaccurate but precise.
Figure 4-3 Accuracy and precision (Hammersberg, 2014).
Gauge R&R
Gauge R&R is a statistical tool that evaluates the repeatability and reliability of a
measurement system, meaning that it is used to measure the measurements error in a
process. The ideal is to receive the same result regardless of the person that performs the
measurement.
Repeatability in a measurement system refers to the natural variability that occurs when
measurement are performed under the same conditions. The same condition means when
one person performs the measurement, with the same method and instrument and the same
environmental conditions every time. Reproducibility is the variation that occurs when
different persons perform the measurement with the same instrument, conditions and
techniques (George et al, 2005).
Page 31
22 Department of Product and Production Development CHALMERS UNIVERSITY OF TECHNOLOGY Gothenburg, Sweden 2015
4.4.2. Statistical Process Control
Statistical Process Control (SPC) is not only a toolkit but also a strategy for reducing
variability, cause of most quality problems, product variation, in times of deliveries, possible
ways of doing tasks, in material, attitudes, equipment, maintenance, everywhere in a
systematic way.
Everything in an organisation that;
requires understanding
has variation
must be properly controlled
has a capability
needs improvements
can according to Oakland (2008) be counted as a process.
Control
All too often processes are adjusted after just a single measurement has been performed.
Even if the process is stable it still occurs random and common causes of variation making a
one sample adjustment not sufficient. Oakland (2008) argues that it is essential to take 4 to
12 samples to provide sensitivity which can detect a change of the mean of the process.
From this a suitable corrective action can be taken. If a sampling size is larger than 12 the
range value will lose efficiency due to the values in between highest and lowest are not
presented.
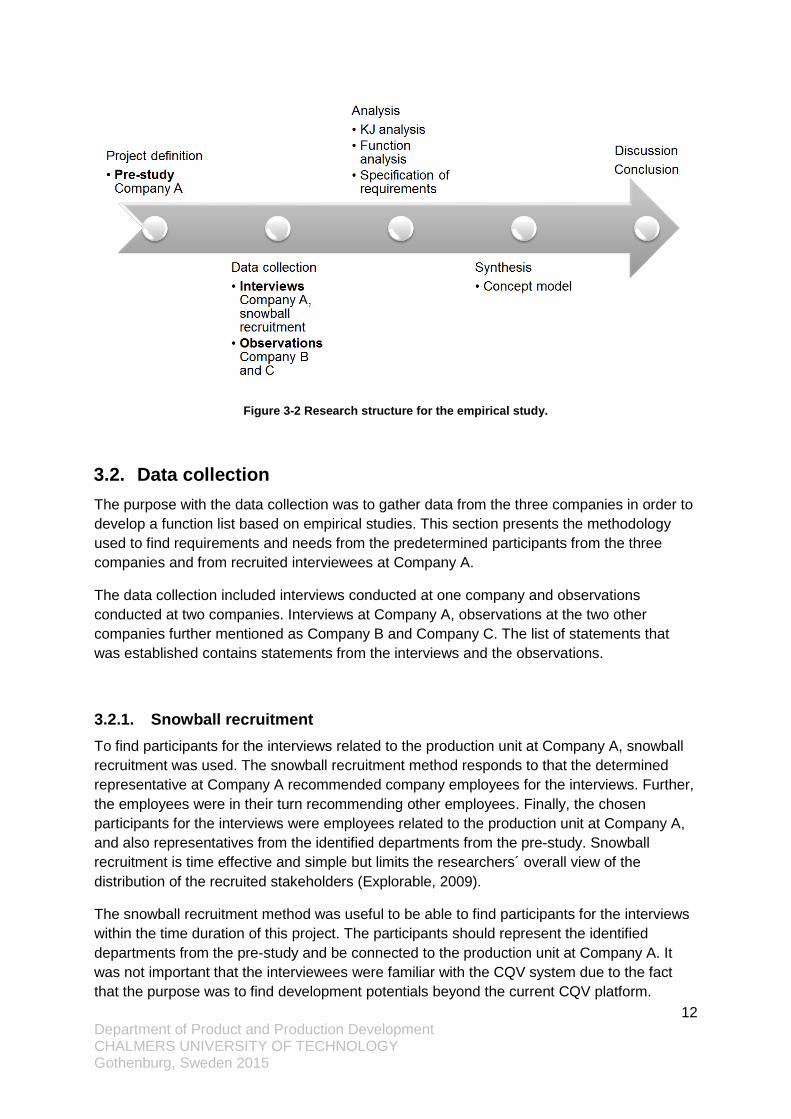
Data collected as variables is presented in a mean and range chart, presented in figure 4-4
respectively figure 4-5. This makes it possible to see if the 𝑋 ̅(sampled mean value) lies in
the range ± 3𝜎. If the process is stable this should be the case. If 𝑋 ̅is in a rising or falling
trend relative to the process mean the process needs to be adjusted, this yields also when
𝑋 ̅is below or above process mean. The process mean is the calculated mean value for the
process.
Page 32
23 Department of Product and Production Development CHALMERS UNIVERSITY OF TECHNOLOGY Gothenburg, Sweden 2015
Figure 4-4 Mean chart.
In the mean chart there are upper action, upper warning, process mean, lower warning, and
lower action line at:
Process mean line : 𝑋 ̿ = 𝐴𝑣𝑒𝑟𝑎𝑔𝑒 𝑜𝑓 �̅�
Upper action line: 𝑋 ̿ +3𝜎
√𝑛
Upper warning line: 𝑋 ̿ +2𝜎
√𝑛
Lower warning line: 𝑋 ̿ −2𝜎
√𝑛
Lower action line: 𝑋 ̿ −3𝜎
√𝑛
where 𝜎 =𝑅 ̅
𝑑𝑛 and 𝑑𝑛 is Hartley´s constant. �̅� is the mean range of a sample and 𝑛 is the
sample size (Oakland, 2008).
Page 33
24 Department of Product and Production Development CHALMERS UNIVERSITY OF TECHNOLOGY Gothenburg, Sweden 2015
Figure 4-5 Range chart.
In the range chart action and warning lines are not symmetric due to range only can be 0 or
higher and will instead be:
Upper action line: 𝐷0.001�̅�
Upper warning line: 𝐷0.025�̅�
Lower warning line: 𝐷0.975�̅�
Lower action line: 𝐷0.999�̅�
If the process is in control:
No mean or range values outside the action limits
No more than 1 in 40 values between warning and action limits
No case where two mean or range values lies after each other outside the same
warning line
No runs or trends of five or more which is in the warning zone or action zone
No runs where more than 6 sample means lies either above or below the process
mean.
No more than 6 samples of the mean being in a rising or falling trend.
Attribute
Collected data in forms of attributes, or in other term Booleans, makes it impossible to use
mean and range charts to control the process. There are two types of control charts to
control a process when having attribute data (Oakland, 2008):
Number of defectives chart
Number of defects chart
Page 34
25 Department of Product and Production Development CHALMERS UNIVERSITY OF TECHNOLOGY Gothenburg, Sweden 2015
The Defectives chart with constant sample size is called np-chart, with samples of varying
size it is called p-charts. Defects chart with same size of sample every time is called c-charts
and with varying sample size called u-charts. Np-chart is used when there is possible to
maintain a constant sample size.
Figure 4-6 np-chart.
The goal with np-charts, figure 4-6, is to present the defectives in a constant sample size n.
The centreline is 𝑛�̅�, warning lines 𝑛�̅� ± 2 √𝑛�̅� (1 − �̅�) and the action line is 𝑛�̅� ±
3 √𝑛�̅� (1 − �̅�) is the proportion defective, �̅� is average value of p (Oakland, 2008).
When it is impossible to maintain constant sample size n a p-chart, figure 4-7, may be used.
It is similar to np-chart but instead of having constant upper action and warning lines moving
depending on the sample size.
Page 35
26 Department of Product and Production Development CHALMERS UNIVERSITY OF TECHNOLOGY Gothenburg, Sweden 2015
Figure 4-7 p-chart.
The p-chart has a centreline �̅�, warning lines �̅� ± 2 √�̅� (1−�̅�
�̅�) and an action line �̅� ±
3 √�̅� (1−�̅�
�̅�). �̅� is the average sampling size. Note, holds only if n is in zone (�̅� ± 25%)
(Oakland, 2008).
Page 36
27 Department of Product and Production Development CHALMERS UNIVERSITY OF TECHNOLOGY Gothenburg, Sweden 2015
5. Results
This chapter presents documentation from six interviews conducted at Company A, and two
observations at Company B and C. This chapter will contain all material collected in the
interviews and observations. At the end of each sub-chapter presents a conclusion named
main points. Preferably those can be studied if the reader wants a quick summary of the
content.
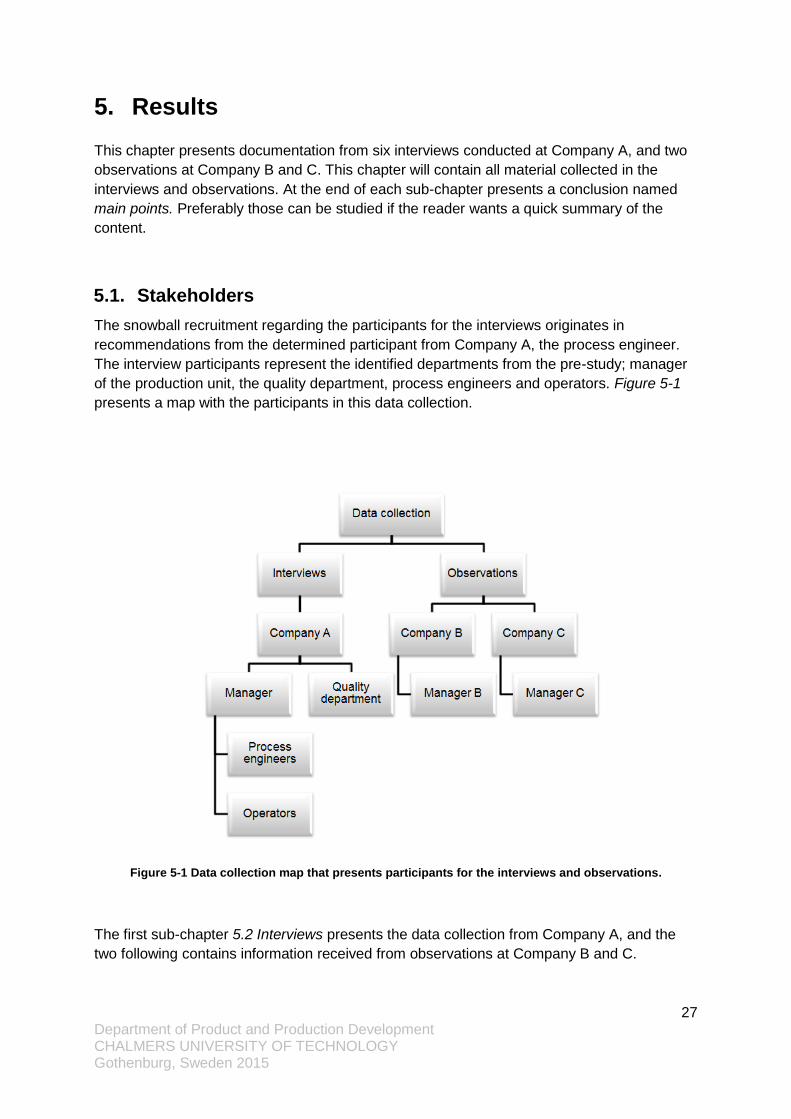
5.1. Stakeholders
The snowball recruitment regarding the participants for the interviews originates in
recommendations from the determined participant from Company A, the process engineer.
The interview participants represent the identified departments from the pre-study; manager
of the production unit, the quality department, process engineers and operators. Figure 5-1
presents a map with the participants in this data collection.
Figure 5-1 Data collection map that presents participants for the interviews and observations.
The first sub-chapter 5.2 Interviews presents the data collection from Company A, and the
two following contains information received from observations at Company B and C.
Page 37
28 Department of Product and Production Development CHALMERS UNIVERSITY OF TECHNOLOGY Gothenburg, Sweden 2015
5.2. Interviews
During the personal meeting with the interviewees was an interview template used to support
the interview. The interview template can be found in appendix A - Interview template. Below
presents the main questions:
How long have you been working here?
Your responsible areas?
Manually performed tasks that preferably could be automatized?
Other areas where machine vision can be used?
Do you think that there are limitations in the CQV system today?
What production statistics do you use/or can be found in your work?
Which problems are repetitive?
Are there any emergent problems?
Do you find it important to have the possibility to predict problems?
How do you want information to be presented on a screen?
The interviewees were interviewed one by one, except for the novice operators where two
operators were interviewed at the same time. Totally six interviews were conducted with
following participants: one from the quality department (sub-chapter 5.2.1), one technical
production manager (sub-chapter 5.2.2), two process engineers (sub-chapter 5.2.3 and
5.2.4) and three operators (two novices in sub-chapter 5.2.5 and one expert in sub-chapter
5.2.6). The interview with the two novice operators will be presented in one sub-chapter.
Following sub-chapter presents the conversation from the interviews, observe that the notes
are written by the researchers.
5.2.1. Quality department
In an email correspondence with Q (2014a) was a list revived. The list presented errors
prioritized based on the company´s biggest cause of complaint:
1. Adhesives on front panels, chunks of adhesive instead of thin lines which damaged
the product
2. Final packaging, holes in the plastic bags
3. Elastic threads were sometimes missing, made the product unusable
4. Hard pieces found in the absorbing mass, no quality control performed on the mass
section
5. Final packaging, time stamp on the product the plastic bags and the carton were
missing
The following text represents the notes taken at the personal meeting with Q (2014b). Q has
worked at Company A for the last 20 years, with a current position that involved quality
control. The interviewee performed improvement projects on daily basis with MiniTab and
Page 38
29 Department of Product and Production Development CHALMERS UNIVERSITY OF TECHNOLOGY Gothenburg, Sweden 2015
PlainQ. MiniTab is a statistical program that serves the user with information in order to take
decisions to improve quality (MiniTab, 2014). PlainQ is statistical software developed by
Company A to assess quality reports, and visualisation of graphs. The interviewee would like
the CQV system to enable variable data, due to the fact that variable data give more
information and can show trends easier than the attribute data.
As the lists of errors presents, product related problem mentioned could be areas where
machine vision preferably could be monitoring according to the interviewee. Collecting
production data is also a future area for machine vision. Parameters from the process
connected to the product could contribute to the ability to see trends and take actions before
errors occurred said Q. In many of the cases the quality department could figure out when an
error is about to occur. The interviewee mentions that, by experience, the quality department
could for example tell that some of the deviation found in quality of the product is due to that
the machine was ramping up when the measuring took place.
The interviewee mentioned other areas where machine vision preferably could be used. In
the current state there was no control of the final product, no control that confirmed that the
final product remained correct before going into the local warehouse. The interviewee
suggested that vision could be used to take a picture of the complete product. Further, an
UV-camera distinguishing chunks of adhesives in the final product was also something that
the interviewee found useful due to their list with customer complaints. Surveillance of
creases in material, due to that creases in the material leads to incomplete joining when
welded or glued. Also the final enclosure of the plastics bags could be monitored, since their
only way to control this in the current state was to open the sealing.
The interviewee was questioned about how to visualise information and answered that the
operators most likely was interested in information that contributed to the possibility to take
fast decisions. Other divisions at Company A such as quality department wanted raw data to
be sent to their existing statistical programs. But the operators might get support by an
interface that gives an alarm if the process strives towards a control limit. Experienced
operators are trained in localizing the error when the process stops.
The tests that the operators performed every 15 minutes as mentioned in pre-study, where
four products were tested in order to ensure the quality in real time. Quality tests were
regarding the panels and measurements of the final product. Once at every time shift, the
operators were measuring the weight of the products to ensure that the absorbing mass in
the core was correct. Quality department also performed tests regarding the products weight,
where five products were measured to distinguish the mean and range in PlainQ. The
company works with MSA on their processes and on the employees that performs the
manual testing. Automated testing would most likely contribute to get a repetitive and
accurate test procedure.
The interviewee expressed the benefit with saving pictures of the final product, for at least
five months but preferably three years. These pictures could later on be used to support the
department of complaints. The possibility with saving the pictures could contribute to
backtrack and allow the company to look at old pictures. The pictures needed to be stamped
with a time stamp, in the current state the local time in the plant were hard to sync with those
Page 39
30 Department of Product and Production Development CHALMERS UNIVERSITY OF TECHNOLOGY Gothenburg, Sweden 2015
stamped on the product. Q states that it was needed to make the sync better in order to
make it enable to backtrack.
In the current state quality department received information about the quality of the product
but received no data from the process. The interviewee mentioned one case where a clutch
to an adhesive pump was not working correctly and this affected the quality of the product.
By supplying the quality department with more data from the process, the quality issue can
be easier to locate. This could also later on lead to improvements projects where they can
increase quality as well as minimize the use of material or power, which also could mean
saving money.
“Measuring means that it is possible to see where improvements can be made.”
The control of the amount of absorbing mass in the core is today measured in a test where
the finished product is submerged into a bath in 30 minutes and then centrifuged. The
amount of mass is then calculated via the weight of the product. If it is possible to see the
amount of absorption mass in the core with machine vision, this could exclude the time
consuming manually performed tests.
Main points
This section sums up the personal meeting with Q. Below are a conclusion presented:
Enable quality assurance for the panels regarding the adhesive process
Collect data from the process regarding the pressure and the number of revolutions in
the adhesive pump
The final product
o Detect chunks of adhesives on the final product
o Control of all parts are included in the final product
The core
o Measure length
o The weight of the absorbing mass
Creases of the material that occurred in the process
Enclosure of the plastic bags
Employees can perform manual tests different
5.2.2. Manager
The personal meeting with a manager of the production unit is presented in this sub-chapter.
The manager (M, 2014) had an education within mechanical engineering and previous
experience from working as an operator, line manager and process engineer at the
company.
To control the production they use software and documents like MiniTab, PlainQ (mentioned
in chapter 5.2.1) with SPC tools. M expressed that if could be beneficial if CQV could report
to PlainQ, this information together with other production parameters could make it possible
to relate errors to a certain parameter in the future. One drawback with PlainQ is that it
cannot handle real-time updates. M thought that machine vision could be used to detect
Page 40
31 Department of Product and Production Development CHALMERS UNIVERSITY OF TECHNOLOGY Gothenburg, Sweden 2015
trends. Collecting process parameters and connect them to the product would allow
improvements such as traceability and standardisation.
Currently the operators received warnings from the process in the operator panel. To find
trends would mean that pattern recognition needs to be handled by the system according to
M. Repetitive problems that occurred were related to the adhesives, the core and the
absorbing mass. M thought that it would be important to also control the final product.
When the interviewee was asked about what to visualise on a screen, the answer was that
showing the most critical parameters would most likely enable the operators to perform on a
higher level. Parameters could be from both the process and product, actual value and set
value could be displayed with a green or red background to express the state of the
parameter. To find which parameters to present and how they war related to other problems
in the process were something that Company A need to further investigate.
M would like to find a reliable setting list that tells how to deal with each situation and from
that improve and eliminate the root cause. A sort of PDCA, called DDS, method was used
with the intendancy to standardise and improve the process related tasks.
At the current state Company A only used machine vision to register product parameters. To
also monitor process parameters was something that the interviewee found interesting. At
the moment the registered parameters from the process were mainly performed manually
which made it impossible to connect it to the product later on.
Main points
Sum up from the interview with a manager at Company A:
The need for graphs may not be important for the operator
Use green and red colours in the main display to get the operators attention and have
more information available if the user wants to find out more
Elimination of manual control of the core and absorbing mass
Control of the final product would also be preferred to ensure quality
Critical parameters could be displayed on a screen for operators, both the actual
value and the set value.
5.2.3. Process Engineer 1
The collected data from the personal meeting with the first interviewed process engineer (P1,
2014). P1 started to work at Company A as an operator and had been working as a process
engineer for almost seven years. The process engineer was responsible to solve problems,
perform improvement projects and to perform test runs on the machines.
When P1 was questioned about problems the answer was that critical and recurrent
problems were regarding the panels and adhesive on the product and in the machine. The
interviewee expressed low credibility for the CQV, for the reason that it just presented “ok” or
“not ok” but gave no information about what the decision was based on. The interviewee
explained that if the CQV validated correctly they need to manually control 60 000 products.
This procedure would be needed to be performed for every new setup, approximately every
Page 41
32 Department of Product and Production Development CHALMERS UNIVERSITY OF TECHNOLOGY Gothenburg, Sweden 2015
eight hour. Analysing 60 000 products manually should take more than four years to perform.
P1 explains that this validation process needed to be performed in another way.
“CQV is complex, therefore it is hard to understand how to use it correctly.”
Another issue with the classification at the current state was that if incorrect images were
classed as a correct image, placed with the “ok” reference images, the result would incorrect.
If the CQV interface could present a variable of a measurement, the classification score, an
angle or a location, it would raise the credibility said P1. Using variables could also mean that
the performed manual measurements could be excluded according the P1.
Using MVS to monitor process parameters could enhance the knowledge about their
process. Together with the information from the PLC and other devices in the process unit
the company would be able to analyse the process according to P1.
P1 explained that there was a benefit of having the saved images stored for at least a year.
This should not only be a support for the customer complaints department but it will also
make it possible to analyse decisions taken by CQV. It gives also the possibility to go back in
history when a new error is found.
The interviewee found it important to find the root cause of a problem, which commonly led to
long lead times due to that data needed to be collected before the analyse begun. A system
that supports the process engineers with parameters would be useful in order to make their
work more effective.
Main points
Conclusion from the personal meeting with a process engineer, where the following topics
were discussed:
Control of the final product could be in use to control the complete product. The
image could be saved in order to enable a picture of the product in customer
complaint situations.
Common that the classification of the CQV does not work properly, high amount of
scrap with no information of why
Validation of the current CQV platform
Variable data is more useful than attribute data
Present score assessment of the classification of an image
CQV is complex, has low credibility and at the current state there was no way to see
how decisions were made
5.2.4. Process Engineer 2
In an email correspondence with process engineer (P2, 2014a), P2 expressed that it would
be beneficial for Company A to have a system that has the ability to indicate recurring errors.
At the current state they already knew applications where this could be useful. In the
quotation below presents a part of the received email where P2 presents two new application
areas for machine vision related to the cutting process for the four panels:
Page 42
33 Department of Product and Production Development CHALMERS UNIVERSITY OF TECHNOLOGY Gothenburg, Sweden 2015
“Let's say we have a failure in a vacuum hose in one of the two applications on an applicator
with 9 applications per lap. This allows the application of the material not be correct at one of
nine. On another occasion it may be wrong every sixth time, then the reason that an error
occurs can be an applicator with six knives where one of the blades is worn out. There is
important information for the operators, because they know where they should begin to
troubleshoot.”
The process engineer explains that the benefit of saving pictures was that it could visualise
things that was unforeseen in the implementation phase. The following sections present the
material from the personal meeting with P2 (2014b). P2 supervised the pre-study tour and
was the most experienced in field of machine vision at Company A.
P2 explained that the current machine vision platform could preferably be developed to cover
more areas. An example of this was the control of the four panels, as mentioned earlier in the
email correspondence. One commonly seen problem was that adhesives end up at the
cutting knives in the machine which resulted in not properly cut panels. Other areas for
machine vision were to detect where the adhesive were mounted or to control the final
product.
The process engineer mentioned how blob algorithms could be used as a compliment or
replacement to Manto. The benefits of using blob algorithm is that this algorithm takes faster
decisions compared to Manto and can be operating directly by implementing limits from the
product specification according to P2. Another benefit of using Blob was the time to base the
decisions, blob takes one millisecond while Manto takes 20 milliseconds according to P2.
Blob also gives an actual value. Adding a graph in the CQV interface that presents the
validation done by Manto would benefit Company A according to P2.
The interviewee said that it would be of high interest to have a system that can identify
patterns which could open up the possibility to forecast errors and deviations. If the CQV
would have possibility to present statistical data from the production it would be useful to
present it in an additional tab in the CQV interface said P2. In this tab, graphs could be
shown and the graph causing the alarm could preferably be prioritized and attention drawing.
Due to the saturated amount of software found in the company today the interviewee found
no need for a new one, rather a something that connected the existing software.
The interviewee returned to talk about the benefit with the blob algorithm. Another benefit
would be to help the operators to restore the process when an error occurred if the interface
supported them with information from the process. The process engineer ended up the
interview by saying:
“I believe that if we measure positions on well-chosen places with good control
limits it is possible to detect problems and act before an error occur”.
Page 43
34 Department of Product and Production Development CHALMERS UNIVERSITY OF TECHNOLOGY Gothenburg, Sweden 2015
Main points
Sum up from the personal meeting with a process engineer at Company A:
Useful to have blob algorithm as complement or to replace Manto
Show the score of classification made by the algorithm
The ability to see trends and patterns
Statistical data of errors, the ability to connect process and product parameters
Graphs could be presented in an additional tab in the CQV interface
No more systems needed at Company A
Manto cannot predict
5.2.5. Novice Operators
This sub-chapter presents the content of the personal meeting with two novice operators
(ON, 2014). These two operators were interviewed at the same time and their individual
expressions are not distinguished. ON had a few weeks of experience from working as
operators in the production unit. The reason for having two interviewees at the same time
were due to the possibility receives opinions from two available employees.
Production personnel had a rotational schedule and changes responsible areas several
times per shift, responsible areas were material supply, quality (measure and tests) and the
process. ON mentioned the importance of the quality of the produced products and that
stops often occurred due to the raw material change.
“Experienced workers may find the cause of the problem that caused the stop quite quickly”
ON said that it was comfortable to have experienced workers around to learn and perform at
a high level, such as supervisors and team leaders.
The manual testing commonly discovered problems that required the process to be adjusted
or in worst case to be shut down to find and eliminate the root cause. If the manual testing
could be excluded and done directly in the process, time spent on tracking faulty products
would be minimized and resulting in decreased amount of waste according to ON.
Commonly errors that made the machine to go down were adhesive on cutting knifes which
resulted in faulty cut edges on the panels.
When a new model was about to be produced, approximately every eight hour, the system
needed to be readjusted. Ramping up or down responded to that the quality of the products
were poor and good quality was only considered when the process was stable. That meant
that a lot of products were wasted every time the process was unstable. Repetitive problems
due to the changeover often related to the final packaging, the cartons as well as change of
raw material. The carton could cause trouble with the vacuum that held the carton in the final
packaging process. Another problem found in production was the time stamp on the plastics
bags. The printer occasionally stopped and there were no control securing that the date
could be found on all plastic bags.
When ON got the question regarding what to present in an interface the answer was that it is
only important to get information when there is deviation in the system.
Page 44
35 Department of Product and Production Development CHALMERS UNIVERSITY OF TECHNOLOGY Gothenburg, Sweden 2015
Main points
The list presents the main points from the personal meeting with two novice operators:
Cutting process for the edges of the panels fails due to adhesive attached on the
cutting knife in the process.
If they could receive a warning only if the process are reaching a limit, it could enable
the operators to act only when needed and prevent an error to occurs.
Highlight graphs and real-time measurements when there is a deviation in the system
5.2.6. Experienced Operator
This sub-chapter presents the material from the personal meeting with an experienced
operator (OE, 2014). OE had worked as operator for three years with main responsible areas
to keep the machine up and running and to fix minor issues.
OE explained that the operators used both the CQV interface and the operator panel. When
the scrap rate went up the operators watched the images generated and visualised in the
CQV interface and on their operator panel to locate the problem. The errors were often
complex and the decision were most commonly based on experience.
The most common error was regarding the panels of the product, the contour cut. Adhesives
often caused the cut to be incorrect, this was an area that OE found interesting to monitor.
A limitation with the current machine vision was that it only could detect if everything was
placed where it was supposed to be, not detect if something was missing. Neither the
possibility to detect if the mounted pieces were firmly attached. Due to the mentioned things,
manual testing needed to be continued at the current state according to OE.
OE would prefer to see graphs, since it would most likely make the job easier and make it
possible to locate the source of the errors. Errors and warnings from the machine vision
should be sent to the existing operator panel. The alarms detected by CQV could preferably
be both warnings and action demands.
Today they perform manual readings of pressure and vacuum in the machine. This related to
the process parameter which is something that preferably could be noticed automatically by
the process.
According to OE 99.9% of all products that were manually tested pass the control but the
interviewee did not know how many “ok” products that Manto classified as “not ok” products.
If it is possible to find the parameters that caused the warnings it would be possible to find
patterns and predict errors before they occur according to OE. But if parameters should be
presented on a screen they should only be presented or to call for attention when deviation
was detected, said the interviewee.
Page 45
36 Department of Product and Production Development CHALMERS UNIVERSITY OF TECHNOLOGY Gothenburg, Sweden 2015
Main points
Sum up from the interview with the experienced operator at Company A:
CQV was used as a tool to detect errors and its root cause
Contour cut of the panels was the most common cause of an error
CQV only examined if parts was located where they were supposed to be
Show graphs to support the operators
Alarms from CQV should be sent to the existing operator panel
Monitor new areas to minimize the manual work
Some parameters important to monitor were the adhesive pump’s pressure and
vacuum
Only call for attention when deviation was detected
5.3. Observations
This chapter presents documentation from the data collection at Company B and C. The
conducted observations were supervised by managers and included a guided tour in the
production unit.
5.3.1. Company B
Company B is a global marketing leading company specialized in clinical nutrition, infusion
therapy and medical technology. The healthcare industry is strictly controlled and inspections
from external agencies representing a specific market, like FDA (2014) for U.S., are
common. Healthcare industries require full control and delivered products must be verified
repetitive times and with specified quality.
At Company B CQV was used for quality control.
Implementing new features that minimizes the amount of manual work was something that
was hard in the healthcare industry according to the manager (MB, 2014). The requirements
of redundant verification in order to ensure standardizations, rules and quality from external
regulations are a big factor to this struggle.
One of the employees had ideas about a future system, or let’s say an interface, one that
could support the operators and explain what to adjust in order to maintain good productivity.
In the future, the algorithms would preferably be self-developing. The employee also
mentioned what is interesting with vision is that it enables data to be stored and analysed in
another way compared to conventional systems.
The manager (MB, 2014) at Company B was responsible for special machines and handled
issues regarding the production both in-house and external. The manager had over ten years
of work experience of special machines and production related work tasks.
The manager found it useful to have an interface with different applications similar to an
application store for mobile phones, figure 5-2. The benefit with this kind of application would
Page 46
37 Department of Product and Production Development CHALMERS UNIVERSITY OF TECHNOLOGY Gothenburg, Sweden 2015
be that the companies and departments can choose what applications that should be
installed at their work station.
Figure 5-2 Illustration of an application store. An exclamation mark informs the user that an update is available for Application 2.
The manager explains that Company B could be in use of a system that collects information
that allows information to be analysed externally. An interface that receives information from
different devices, parameters from let’s say CQV and a PLC, and present all information on
one screen. If the system could send information to a server it would enable easy access to
information externally. And the interface could, like an application store for mobile phones,
tell when a new update is available, see figure 5-2.
One important thing that was mentioned by MB was that the system still needed to be able to
run offline in case of lost internet connection. Making it possible to sync between factories
will also be an advantage for a potential monitoring system. This would make it possible to
have other factories to help and perform maintenance when problems occur.
“Where it happens, it must be seen”
If there is an error somewhere in the production some kind of signal must be given at that
area, example a flashing bright light. It could also be a map over the machines where a red
arrow points at the place where the error occurs giving the operator a fast view of where to
start to solve the problem. It might also be good with an alarm with a text explaining the
Page 47
38 Department of Product and Production Development CHALMERS UNIVERSITY OF TECHNOLOGY Gothenburg, Sweden 2015
problem and its location. All for the reason to keep the user's alert to directly understand
where things occur and how to solve it.
An ideal future system will be self-learning and able to by itself collect the right information to
be able to see trends.
A mobile display would make it easier to bring the control panel and the surveillance
information wherever the operator goes making the operator able to react faster when an
alarm occurs.
The manager mentioned that it could be useful to monitor more than just quality inspection
with a vision system. It could be used to monitor how often an operator needs to correct
something in the production with a camera. Machine vision could also be used to view the
stock status of less frequently used products as a way for the supply chain to plan delivery
and purchases.
Today a line manager at Company B needs to visit the shop floor to note information
regarding the production statistics. An interface that sends reports from the production on
demanded schedule would eliminate the non-value adding tasks that are used today to get
this information.
The manager had some examples of how an interface could look like and pinpointed the
need for an interface that most users can be familiar with. Figure 5-3 presents an interface
based on MB´s opinions (2014).
Figure 5-3 Illustration how tabs can be used to navigate in the interface.
Page 48
39 Department of Product and Production Development CHALMERS UNIVERSITY OF TECHNOLOGY Gothenburg, Sweden 2015
According to the manager the operator, process engineer, line manager and controller could
be stakeholders regarding the development an interface. The manager would like the
developed CQV platform to be delivered with a standard package and have the possibility to
send images to a server.
Other areas that MB found interesting were statistics and measurement that enables the
system to see trends. For example, register how many times an operator controls and
adjusts a certain process or task as mentioned before.
Main points
Sum up from observations at Company B:
Offline availability
Save images on an external database that allows external access
Compatible with other software
CQV as a subscription which informs the user about new updates
5.3.2. Company C
Company C is one of the world's leading companies in the bearing industry. The interviewee
(MC, 2014) was a project manager in the process development department in a factory at
Company C. The factory produced rings for bearings and the products were tagged with an
id number. Company C tried to collect data and connect it to the product´s id to enable
traceability. The level of automation in the factory was considered as very high, not many
tasks besides material supply were handled manually. The manager mentioned that they
have started to work with lights in order to call for the workers attention. A process with a
light that belongs to a vision camera flashing could indicate where the problem has been
detected. Turning off the lights in a process could indicate that it has run out of material or
stopped working.
Machine vision was mainly used for inspection of the rollers surface, as scanners or for robot
position. The manager´s view about machine vision is the possibility to see what is
happening and also that it could monitor mew areas.
The company used statistical methods and software such as Six Sigma, MiniTab and their
own developed software used for specific processes. Collected data should be able to
support analyse of MSA and capability studies and easily be analysed in almost any tool.
The manager also mentioned a new data collection project was established, that should via a
cloud based database collect data, similar to what Volvo (Volvo, 2013) and SAP Hana (SAP,
2014) mentions as “Big Data”. This new project should enable not only future data analysis
for Company C also the possibility to see trends. In a future scenario the big data project
may contribute to the ability to predict future problems and from that control the process in
the ideal way that ensures quality said the interviewee.
“Precision is the hardest thing to handle.”
The interviewee received a question about if it is something lacking when talking about
control and measure, and answered that it is hard to ensure quality of a surface. Also the
Page 49
40 Department of Product and Production Development CHALMERS UNIVERSITY OF TECHNOLOGY Gothenburg, Sweden 2015
variation of sizes of the products is a variable that needs to be included which makes it even
more difficult to create a suitable and predictive quality system. Another quality assurance
was the control of machine setup changeover, where a vision system monitor if the process
was done correctly.
The operators were mainly only interested in the status of the process and as the manager
mentions, “they are the expert of the process”. If an error occurs they have experience that
enables them to operate in the best way. A graph with control limits would enable easy
access to the status of the process for the operators. In an ideal world the system could also
tell exactly what was wrong and how to solve it or automatically solve it before the error
occurred.
Possible stakeholders at Company C according to MC could be a process engineer and a
technician or a person in a similar position as the manager. They would most likely be
interested in raw data. Raw data makes it able to analyse in many ways. It is therefore
important to collect data in a way that makes it possible to analyse it and preferably also
compatible with Kudos or Microsoft Excel.
Main points
Sum up from the visit at company C.
Operators needs easy control to ensure that their process is performing correctly
Graphs with action lines
Highlight problems with light
No more software
The ability to backtrack
Use vision to ensure surface quality
Use vision to ensure the tasks have been performed correctly
Page 50
41 Department of Product and Production Development CHALMERS UNIVERSITY OF TECHNOLOGY Gothenburg, Sweden 2015
6. Analysis
This chapter presents the analysis of the data collection presented in the previous chapter.
The statements found from the interviews and observations were translated and divided into
categories with a KJ analysis. A function list was developed from the KJ analysis and
mapped with a function three. The final result of the analysis was a specification of
requirements, a foundation for the development of a concept model.
6.1. KJ analysis
The KJ analysis was performed with the statements from the data collection. The statements
were grouped into themes and some themes got master headers. The themes, headlines
and statements (written on yellow post-its) are presented in figure 6-1. The documentation
can be found in appendix B – Sorted statements from the KJ analysis.
Figure 6-1 Picture taken at the KJ analysis.
Page 51
42 Department of Product and Production Development CHALMERS UNIVERSITY OF TECHNOLOGY Gothenburg, Sweden 2015
6.2. Function list
The function list was developed from the results of the KJ analysis. The themes named
Statistics and Visualisation were used for further analysis due to the purpose of this project
and the other themes worked as support. Table 1 presents the function list. Each function is
presented with a verbs and a noun, every function has a classification and a clarification
which demonstrates the importance respectively the function.
Table 1 Function list (M=Main function, N=necessary function, W=Wanted function)
Verbs Nouns Classification Clarification
CQV Take Picture M Take picture of the product
Classify Image M Classify the image and send error signal to machine if “not ok”
Extract Data N Withdraw data from image
Find Trends W Detect trends
Presentation Show Image M Show image taken by camera showing the classification and allow error view, present score of the classification
Show Graphs N Show graphs, production statistics, in the CQV interface
Show Parameters
W Present the most critical production parameters, set-/actual value
Reporting Send Alarm M Send all alarms to operator panel
Send Data N Transmit raw data to external user/server
Send Report W Send a customized report with a specific interval
Page 52
43 Department of Product and Production Development CHALMERS UNIVERSITY OF TECHNOLOGY Gothenburg, Sweden 2015
6.3. Function tree and specification of requirements
A function tree was established in order to understand the interaction between the defined
functions in the function list. This function tree, figure 6-2, illustrates what should be included
in the concept model. The function tree illustrates why the functions exist and how they are
fulfilled. It also expresses how the functions support the stakeholders’, presented in chapter
5.1, needs and wants.
Figure 6-2 The function three presenting the relationship of the functions and the stakeholders.
The result of the analysis
Other stakeholders, on the top to the right in figure 6-2 represents as mentioned in the data
collection, other departments at Company A that could benefit from a developed CQV
platform. As a result of the data collection and analyse it is shown that the development of
the CQV interface at Company A will mainly affect the operators. The operators were at the
current state the employees that use the CQV interface, as a complement to the existing
operator panel. Due to this result, the operators are the beneficiaries for the development of
the concept model that represents the CQV interface. But the development of the concept
model also aims to satisfy other beneficiaries, like managers, employees of the quality
department and the process engineers.
The specification of requirements aimed to satisfy the operators and the expressions related
to visualisation and production statistics from the previous analysis. The result is shown in
table 2. Each requirement got a clarification and a classification, demonstrating the purpose
Page 53
44 Department of Product and Production Development CHALMERS UNIVERSITY OF TECHNOLOGY Gothenburg, Sweden 2015
and the importance of the requirement. The requirements found in the analysis were used as
a foundation in the development of the concept model, presented in chapter 7.
Table 2 Specification of requirements (M=Must, N=necessary and W=want).
Requirement Clarification Classification
CQV Classification of image Present classification done by CQV algorithms M
Visual Graphs Show graphs with limits Enabled in separate tab in current CQV
N
W
Trends Express repetitive problems N
Alarm Show alarm only when deviation Show alarm in operator panel Send alarm if process strives towards a limit Send alarm when trend breaks is found
W
M
W
W
Parameters Show most critical parameters W
Design Use the general appearance of the current CQV interface
M
Page 54
45 Department of Product and Production Development CHALMERS UNIVERSITY OF TECHNOLOGY Gothenburg, Sweden 2015
7. Synthesis
The synthesis was based on the specification of requirement presented in chapter 6.3. Due
to the fact that it was the operators at Company A that were using the CQV, the concept
model will represent the development of the CQV interface focusing on expressions for the
benefit of the operators at Company A. Due to the fact that there was no need to develop a
new system at Company A as well as keeping the current general appearance of the CQV
interface, the concept model will emerge from the CQV interface found at Company A.
7.1. Description of the current CQV interface
Figure 7-1 presents the current CQV interface at Company A. The view presents information
from six cameras, at the time capture in figure 7-1, four cameras are available and two
windows unused. This view is the start page of the current interface.
Figure 7-1 The standard view in the current CQV (Consat, 2014a).
Page 55
46 Department of Product and Production Development CHALMERS UNIVERSITY OF TECHNOLOGY Gothenburg, Sweden 2015
The operator can choose between two views for each camera, Camera View or Error View.
The Camera View displays the image, note that Camera View is activated in the four
cameras in figure 7-1, until next one is received from the camera. Due to the high speed
production each camera view will display approximate 13 images of the product every
second, making it look like a movie.
The view can also be extended with View last error, figure 7-2. This extension is showing the
last error until a new one is captured.
Figure 7-2 Last error view for one camera in current CQV interface (Consat, 2014a).
The second view is Error View, shown in figure 7-3. The errors are stored in a chronologic list
were times tamp and error cause is displayed. It is possible to browse in the list and look at
previous errors.
Page 56
47 Department of Product and Production Development CHALMERS UNIVERSITY OF TECHNOLOGY Gothenburg, Sweden 2015
Figure 7-3 Error view with chronological list (Consat, 2014a).
The benefit with the current CQV interface is that it is easy to use, as there is only one main
window that presents information. If the CQV detects a major issue the operator can inspect
the images and locate the issue. The downside of the current CQV interface, according to
the stakeholders’ opinions, is that it does not supply the user with information regarding any
statistics, measurements or score of the classification.
Page 57
48 Department of Product and Production Development CHALMERS UNIVERSITY OF TECHNOLOGY Gothenburg, Sweden 2015
7.2. Concept model
The concept model represents a developed interface based on the stakeholders’ opinions.
The concept model was based on the analysis in the previous chapter and theory. In the
concept model six cameras was chosen to be illustrated.
The development of the concept model aims to satisfy the stakeholder needs related to
visualisation of production statistics. The model was designed with the general appearance
found in the current CQV interface. Alterative tabs and windows were added to allow new
features to be implemented. The original start page was kept as an alternative view but not
as the start page. The following figures presented in this sub-chapter illustrate how the
interface would look like and the content that should be presented in the empty windows will
require further investigation projects at the company.
The design of the concept model is generally a menu to the left and a window to the right,
figure 7-4. In this model will four alternative views be available, named Main View, Camera
View, Graph View and Analysis View.
Figure 7-4 Interface layout.
Page 58
49 Department of Product and Production Development CHALMERS UNIVERSITY OF TECHNOLOGY Gothenburg, Sweden 2015
Following statements were included in the development of the concept model:
Present score of classification done by CQV algorithms
Show graphs with limits
Express repetitive problems
Use the general appearance of the current CQV interface
The statements were the core in the development of the four views. In the concept model will
the Main View be the start page. All four views will present different information based on the
specification of requirements from chapter 6. The views are explained later in in this chapter.
The hierarchy of the concept model and how to navigate is presented in figure 7-5.
Figure 7-5 Presents what information that can be found in each of the four views.
Figure 7-6 presents the new start page called Main View. This view will present information
of the whole product, graphs with detected errors and classification.
Page 59
50 Department of Product and Production Development CHALMERS UNIVERSITY OF TECHNOLOGY Gothenburg, Sweden 2015
Figure 7-6 Main View, the start page.
Figure 7-7 Graph View.
Page 60
51 Department of Product and Production Development CHALMERS UNIVERSITY OF TECHNOLOGY Gothenburg, Sweden 2015
The Graph View, figure 7-7, would give the user information from all six cameras. This view
will have a graph setup, allowing the user to change the type of graphs presented. If it is
possible to get variable data it would be possible to use mean-chart and range-chart.
Figure 7-8 Camera View.
The Camera View would be the new name of the start page of the current CQV interface,
figure 7-8. This view will as well as in the current state presents all six cameras at the same
time. The purpose of maintain the old view is due to the fact that the users are familiar with
this view which most likely will contribute to that the new system would be easy to learn and
usable at the very moment when implemented.
The last view, called Analysis View, will show detailed information regarding one camera. In
figure 7-9 an example of the layout of this view is presented. What to present should be
developed together with the users in order to customize the view. In figure 7-9, is one
example of where graphs can be presented.
Page 61
52 Department of Product and Production Development CHALMERS UNIVERSITY OF TECHNOLOGY Gothenburg, Sweden 2015
Figure 7-9 Analysis View.
Figure 7-10 presents the start page, the Main View, constructed in HTML. On the bottom to
the left presents buttons in a 2x3 table which represent the 6 cameras named FW, LW, ET,
AE, PO and LT. The buttons can preferably have 2 colours, red and green. The colours could
express the state of the parameter. If the user clicks on one of the buttons, in figure 7-10 FW
is chosen, information from this camera will be shown in Camera Info.
Page 62
53 Department of Product and Production Development CHALMERS UNIVERSITY OF TECHNOLOGY Gothenburg, Sweden 2015
Figure 7-10 The main view constructed in HTML.
Additional functions
Based the results from the data collection alarms would preferably be sent to the operator
panel based on the stakeholders’ requirements.
Other features such as shortcuts could preferably be added, but that requires the developers
to adopt those in collaboration with the users. Mouse roll over, when the mouse pointer is
hold over an object, could be used to create a self-explaining interface that most likely will
minimize the need for a user manual or major education in the implementation phase or
when introducing it to new users.
A percentage representing the classification score could be presented in the bottom right
corner at each image.
Page 63
54 Department of Product and Production Development CHALMERS UNIVERSITY OF TECHNOLOGY Gothenburg, Sweden 2015
7.3. Comparison
The concept model include the standard view found in current CQV interface, the Camera
View will represent this view. The general appearance of the interface will remain due to
requirements but also to create a familiarity directly in the implementation phase. The
concept model will enable an environment with alternatives, which allows the operator to
choose a view suited for the situation. Let’s say that the operator prefers information from all
six cameras, the operator can use Camera View. If the operator instead wants all information
presented as graphs preferably Graph View can be used. Or if the operator only wants an
overview Main View can be chosen which should support the user with general information.
The goal with the concept model was to create an interface that supports the operators with
information enabling them to take better decisions. The current CQV presents images, which
will be maintained in the new design. New features will be classification score and
presentation of graphs.
In table 3 is the current CQV interface and the concept model compared against the
statements found from the interviews.
Table 3 comparison of the current interface and the concept model.
Statements Current CVQ Concept model
Classification score X
Present camera view X X
Additional features and graphs available X
Whole product view available X
Show graphs with limits X
Send alarm to operator panel X X
Use commonly used production statistics X
Highlight repetitive errors X
The availability to present trends and patterns
X
Show most critical parameters
Page 64
55 Department of Product and Production Development CHALMERS UNIVERSITY OF TECHNOLOGY Gothenburg, Sweden 2015
8. Discussion
This chapter presents discussions regarding the data collection and analysis, the concept
model as well as suggestions for further development.
8.1. Data collection and analysis
The participants interviewed in this project were recruited by recommendations from the
determined representative at Company A. The snowball recruitment process allows the data
collection to be based on opinions from a selected group. The fact that the researchers
overall view of the distribution of the recruited stakeholder was limited may have contributed
to a concept model only represent a small part of the beneficiaries at Company A. To avoid
this more interviews with randomly selected participants at Company A could preferably be
conducted together with a stakeholder analysis.
The notes collected at the interviews and observations were written by the researchers,
which allow data to be interpreted by the researchers. The result could be that some data is
lost due to the interpretation. The data collection showed that preconceptions on what the
stakeholders may require and need was not always the truth. One of those preconceptions
was that the operators most likely not were interested in graphs, which proved to be false.
Some notes taken explain the need for further investigation, presented in sub-chapter 8.3,
mainly the use of graphs, parameters and how to call for the operators’ attention.
Regarding the list of statements, it is important to note that the quantity of each statement
may be misleading and inaccurate. More interviewees might agree with the statements than
the quantity number tells. This due to that the statements come from open questions and
depending on what the interviewee expressed and found important in the very moment. The
interviews were not aimed to ask direct questions related to others opinions.
Based on the problem definition of this project the beneficiaries were not predetermined and
unable to be found before the analysis was done. No weighting or usability test with the
identified beneficiaries was conducted.
The concept model should represent an interface that presents required information for the
users. Exactly what the concept model views will present, for example which type of graphs
the users prefers, was not included in this project. The concept model was not implemented
neither validated by the potential users such as usability tests.
As a result a whole product view, score of classification and variable data is considered to be
the sharpest requests from Company A, which should end up at the top of the list of what
needs to be developed.
Page 65
56 Department of Product and Production Development CHALMERS UNIVERSITY OF TECHNOLOGY Gothenburg, Sweden 2015
8.2. The concept model
The developed concept model should be able to meet its beneficiaries’ wants and needs.
Maintaining the current CQV´s general appearance and the standard view will give the
operator alternative to explore other ways to find information and at the same time be able to
find support in the old view. This will likely create a familiarity to the new system as well as
minimize the cause of failure in the implementation phase, in comparison to if the system
was newly conceived.
The concept model´s Main View presents more information than the old standard view.
Instead of showing all cameras in one display, the thought was to have one image that
presents the whole product.
As a recommendation, graphs should show defectives and score of classification per sample
in a P-chart and a line chart, to serve the operator with a quick view in order to locate
problems when they occur. If the classification method is changed and variable data can be
achieved mean and range chart is preferred. In the view it is also possible to choose a view
with more information regarding one camera this is done with a list (2x3 buttons). Specific
information regarding one camera is available without the need for changing from the Main
View. This study has a limit of stakeholders interviewed in the data collection and the
selection of graphs may not be the optimal for all potential stakeholders. Theory supports the
selection of graphs in this report.
The Main View presents an overview of the process quality, which will likely contribute to
quick feedback for the operators in the operating the process. The overview will also enable
to trouble shoot when information is shown on one display with P-charts that indicates which
camera triggered the most errors.
Additional views were invented in order to serve the user with sufficient information based on
the situation. If the user feel like it is important to see graphs connected to each camera on
one display the Graph View can be chosen. This view presents graphs, no images, meaning
that it can make it hard for the user to relate an error shown in the graph with the reality. To
decide if this is a view that will be used by the user more interviews and studies will have to
be conducted.
Analysis View should give the user a possibility to analyse the process. The thought was to
give the user a tool to extract more information from the system. The view aims to help in
trouble shooting or analysing the system during operating, both for operators and other
beneficiaries. How and what to present is not included in this project. If this view should be
developed it should be together with the user to achieve better usability.
The thought with presenting the score of the classification in every image is to give the user
an indication of how reliable the decision was. Presenting the classification score in the
picture gives easy access just by looking at the image.
Presenting graphs should enable easy and fast identification of where problems are located
in the process. The graphs were chosen with respect to SPC, used at Company A. Educating
the users in how to use this graphs would be recommended to minimize the resistance and
Page 66
57 Department of Product and Production Development CHALMERS UNIVERSITY OF TECHNOLOGY Gothenburg, Sweden 2015
explain how to use this graphs properly. The SPC graphs also give the possibility to see
trends and send alarm if a deviation is found.
Sending the alarms detected by the CQV to the operator panel will continue, based on the
results from the data collection. Presenting critical parameters were detected in the data
collection but not included in the concept model due to the purpose of this project. This can
be contributed with collaboration with the company to locate which parameters from the
system that is in need to be presented.
8.3. Further development
The purpose of this project was to find development areas for the CQV platform related to
production statistics and visualisation. The data collection confirmed that the CQV platform
have development potentials, not only in the field of visualisation of production statistics.
The researchers found other areas towards a development of the current CQV. The identified
needs at Company A were regarding monitor and collecting more parameters from the
product but also from the process. Investigation what type of information the machine vision
interface should express is something that will require further investigation.
The researchers would like to leave recommendations to the owner of the system to continue
with this process and to further investigate the parameters presented in the list in appendix B
to develop according to the customers suggestions. The data collection indicates that more
areas could be monitored with vision both for the ability to predict and see trends but also to
enable better control over the process. As a suggestion to the owner, CQV could implement
more parameters in order to succeed with the trend identification. The current CQV will need
further investigation in order to express trends and repetitive problems that satisfy the
companies’ requests.
The researchers recommend the future project of this development to be conducted together
with the users. This will likely minimize confusion and resistance in the implementation
phase. This project represents a foundation for further development of the CQV interface and
platform. The researchers will give recommendation for future projects, to collaborate with
the users and involve them early in the project in order to minimize the resistance. In the
implementation phase will it be necessary to consider training and to provide demonstration
of the new system.
The people involved in the data collection were positive to this development and had a lot of
ideas in how to develop the CQV platform and interface to benefit the company. The
researchers ended this project with sending out the documentation from each interview and
observation to the participants, with the purpose to get feedback and comments on the
documentation. The result was considered positive by the participants.
Page 67
58 Department of Product and Production Development CHALMERS UNIVERSITY OF TECHNOLOGY Gothenburg, Sweden 2015
9. Conclusion
The result of this project defines that the CQV platform has development potentials not only
in the areas of visualisation of production statistics from where the concept model was
developed. The list of statements presents improvement potential areas and parameters
aims to support future development projects of both the CQV platform as well as the
interface. The areas of visualisation and production statistics were further used to create a
specification of requirements. The specification of requirements was used as a foundation in
the development of the concept model that presents production statistics in the CQV
interface.
Qualitative and empirical studies were performed at three companies. Interviews were
conducted at one company with stakeholders found via snowball recruitment. Two
companies were visited and the result is presented in list of statements together with the
results from the interviews.
The concept model presents a developed interface based on the stakeholders’ opinions and
literature review. The concept model aims to support the operators to take better decisions
and perform on a higher level. The general appearance and the current standard view will be
maintained in the concept model to create a familiar environment for the users directly at
implementation.
Clearly the CQV platform has development potential. The researchers recommend the
further researchers to develop the platform and interface together with the users and also to
involve them early in the process. More investigation will be in need to define what to present
in the concept model. The three companies investigated in this project were positive to the
development of CQV and collaboration with the companies will most likely contribute to a
sustainable development of the CQV platform and interface.
Page 68
59 Department of Product and Production Development CHALMERS UNIVERSITY OF TECHNOLOGY Gothenburg, Sweden 2015
10. References
Aladwani, M.A. (2001) Change management strategies for successful ERP implementation.
Department of QM and IS, College of Administrative sciences. Business Process
Management Journal, Vol 7. No 3.
Bergman, B and Klefsjö, B. (2010) Quality: from customer needs to customer satisfaction.
3rd ed, Lund: Studentlitteratur AB.
Berlin, C, Adams, C. (2014) Production Ergonomics – Designing Work Systems To Support
Optimal Human Performance [Beta Version 2014]. Course compendium. [Online] Chalmers,
Dept. of Product and Production Development, Göteborg, Sweden. Available from:
https://pingpong.chalmers.se/courseId/3350/courseDocsAndFiles.do?nodeTreeToggleFolder
=1688606 [Accessed 2014-08-08].
Bligård, L-O. (2011) Utvecklingsprocessen ut ett människa-maskinperspektiv. Göteborg,
Reproservice, Chalmers.
Bohgard, M et al. (2010) Arbete och teknik på människans villkor. Stockholm: Prevent.
Burke, R, Kenney, B, Kott, K and Pflueger, K. (2001) Success or Failure: Human Factors in
Implementing New Systems. University of Judaism. Los Angeles, California, USA. Available
from: http://net.educause.edu/ir/library/pdf/EDU0152.pdf [Accessed 2014-07-28].
Brandt, Emil; Vice President at Consat Engineering AB, Partille. 2014.
Brook, Q. (2010) Lean Six Sigma and Minitab, 3rd ed, series 293, United Kingdom: OPEX
resources Ltd.
Consat Engineering AB. (2014a) User Manual Consat Quidance Vision. Consat Engineering
AB. Partille.
Consat Engineering AB. (2014b) CQV_140514_eng. Consat Engineering AB. Partille.
eHow. (2014) Six Sigma Procedures. Available from:
http://www.ehow.com/way_5729361_six-sigma-procedures.html [Accessed 2014-09-22].
Fabel. G. (1997) Machine Vision Systems. QCI International. Available from:
http://www.qualitydigest.com/oct97/html/machvis.html [Accessed 2014-08-05].
FDA. (2014) Inspection Database. Available from:
http://www.fda.gov/ICECI/Inspections/ucm222557.htm [Accessed 2014-09-18].
George, M. L., Maxey, J., Rowlands, D., Price, M. (2005) The Lean Six Sigma Pocket
Toolbook: A Quick Reference Guide to 100 Tools for Improving Quality and Speed. George
Group, McGraw-Hill. Available from:
http://library.books24x7.com.proxy.lib.chalmers.se/toc.aspx?bookid=7767 [Accessed 2014-
09-26].
Hammersberg, P; Associate Professor, Materials and Manufacturing and Technology
Management and Economics, Chalmers. (2014) Meeting, 25 September. 2014-09-25.
Page 69
60 Department of Product and Production Development CHALMERS UNIVERSITY OF TECHNOLOGY Gothenburg, Sweden 2015
Hammersberg, P. (2013) Process capability and measurement system analysis.
Manufacturing Processes HT13, Chalmers.
IGCSE ICT. (2012) Implementing the new system. Available
from: http://www.igcseict.info/theory/8/implem/ [Accessed 2014-07-28].
Johansson, L-Å; Vision expert at Consat Engineering AB, Partille. 2014. 4 August 2014.
Johannesson, H., J.-G. Persson och D. Pettersson (2004). Produktutveckling : effektiva
metoder för konstruktion och design. Stockholm, Liber
Josephson Institute. (2014) The Six Pillars of Character. Available from:
http://charactercounts.org/sixpillars.html [Accessed 2014-08-08].
Mattsson, S (2014) Cognitive ergonomics instructions student slides. Production ergonomics
and work design. Division of Materials and Manufacturing Technology. Chalmers.
Michael. L, George et.al. (2005) The Lean Six Sigma Pocket Toolbook: A Quick Reference
Guide to Nearly 100 Tools for Improving Process Quality, Speed and Complexity.
MiniTab (2014) Features. Available from: http://www.minitab.com/en-
us/products/minitab/features/ [Accessed 2014-10-02].
P1; Process engineer 1 at Company A. (2014) Interview, 16 October. 2014-10-16.
P2; Process engineer 2 at Company A. (2014a) e-mail, 12 August. 2014-08-12.
P2; Process engineer 2 at Company A. (2014b) Interview, 31 October 2014-10-31.
P2; Process engineer 2 at Company A. (2014c) Pre-study, 1 August 2014-08-01.
Oakland, J. (2008) Statistical Process Control. Sixth Edition, Burlington, MA: Butterworth-
Heinemann.
OE; Experienced operator, process operator at Company A. (2014) Interview, 31 October.
2014-10-16.
ON; Novice operators, trainees at Company A. (2014) Interview, 16 October. 2014-10-16.
SAP. (2014) About HANA. Available from: http://www.saphana.com/community/about-hana
[Accessed 2014-10-02].
Sick IVP. (2006) Machine Vision Introduction. Version 2.2. Available from:
http://www.sick.com/uk/en-
uk/home/products/product_portfolio/Documents/Machine%20Vision%20Introduction2_2_web
.pdf [Accessed 06-08-2014].
Explorable. (2009) Snowball Sampling Available from: https://explorable.com/snowball-
sampling [Accessed 2015-01-21].
Svensson, A; Automation Manager at Consat Engineering AB, Partille. 2014.
Svensson, P; Machine Vision Developer at Consat Engineering AB, Partille. 2014.
Page 70
61 Department of Product and Production Development CHALMERS UNIVERSITY OF TECHNOLOGY Gothenburg, Sweden 2015
Q; Quality manager at Company A. (2014a) e-mail, 8 August [2014-08-08].
Q; Quality manager at Company A. (2014b) Interview, 9 October [2014-10-09].
USTECH. (2013) Machine Vision for Factory Automation. Available from: http://www.us-
tech.com/RelId/699485/issearch/dalsa/ISvars/default/Machine_Vision_for_Factory_Automati
on.htm [Accessed: 2014-08-06].
Van Teijlingen, E and Hundley, V. (2001) The importance of pilot studies. Social research
UPDATE, ISSN: 1360-7898, Department of Sociology University of Surrey, United Kingdom.
Available from: http://sru.soc.surrey.ac.uk/SRU35.pdf http://sru.soc.surrey.ac.uk/SRU35.html
[Accessed 2014-07-29-07.
Volvo. (2013) Big data can improve business. Available from:
http://news.volvogroup.com/2013/12/09/big-data-can-improve-business/ [Accessed 2014-10-
02].
M; Technical Production Manager at Company A. (2014) Interview, 16 October. 2014-10-16.
MB; Manager at the Conceptual Engineering department at Company B. (2014) Meeting, 17
September. 2014-09-17.
MC; Manager at the department of Process Development at Company C. (2014) Meeting, 1
October. 2014-10-01.
Vetenskapens värld. (2014) Big Data. Available from:
http://www.svtplay.se/video/2421361/vetenskapens-varld/avsnitt-9-big-data-sa-kartlaggs-
hela-ditt-liv [Accessed: 2014-11-14]
Wickens, C. D. (1984) Engineering psychology and human performance. Columbus, OH:
Merrill. Available from: http://www.psych.wright.edu/~kbennett/teaching/info.htm [Accessed
2014-08-05].
Page 71
i Department of Product and Production Development CHALMERS UNIVERSITY OF TECHNOLOGY Gothenburg, Sweden 2015
A. Interview template
Headline Questions and sub questions Purpose
General How long have you been working here? Your responsible areas?
Aims to find general information regarding the interviewees work tasks and background
Daily work Manually performed tasks that preferably could be automated?
Aims to detect how they work and possible areas to improve related to their daily work.
Vision Other areas where machine vision can
be used?
Do you think that there are limitations in the CQV system today? Please explain how.
Aims to find development potentials related to vision.
Statistics What production statistics do you use/or can be found in your daily work?
Aims to find commonly used production statistics.
Problems Which problems are repetitive? Please explain them. Are there any emergent problems? Do you find it important to have the possibility to predict problems?
Aims to detect most frequent problems.
Presentation How would you like information to be presented on a screen?
Aims to find out how information preferably can be presented.
Page 72
i Department of Product and Production Development CHALMERS UNIVERSITY OF TECHNOLOGY Gothenburg, Sweden 2015
B. Sorted statements from the KJ analysis
List with abbreviations of all stakeholders found in the table below.
Company A Q=Quality department M=Technical Production Manager
P1=Process engineer 1 P2=Process engineer 2 ON=Novice operator x2 OE=Experienced operator
Company B & C MB= Manager at Company B MC= Manager at Company C Owner of the system X=Owner of the system
VISUALISATION Stakeholder Quantity
Compatible with CQV X 1
Send alarm to operator panel P2 OE 2
Show graphs in a separate tab M P2 2
Show graphs with action lines MC OE 2
Show actual-value when it moves from set-value OE 1
Show the 20 most critical process parameters M 1
Show where errors occurs ON 1
Flexible and portable interface MB 1
Highlight problems with light MB MC 2
STATISTICS Stakeholder Quantity
Detect repetitive problems P2 1
Commonly used statistics, SPC and Six Sigma M 1
See trends Q M P1 P2 MC
5
Collect warnings from operator panel M 1
Page 73
ii Department of Product and Production Development CHALMERS UNIVERSITY OF TECHNOLOGY Gothenburg, Sweden 2015
Alarm the operators before the process shuts down M P1 ON 3
Find important parameters related to a certain problem
OE 1
Focus on statistics that can satisfy stakeholders needs and wants
X 1
Alarm if a process strives towards a limit Q OE 2
Enable sufficient data for each department, and send out alarms to whom it concerns
MB MC 2
CQV Stakeholder Quantity
Improvement potential
Variable data instead or as a complement to attribute data
Q P1 2
Use the Blob algorithm instead or as a complement to Manto
P2 1
Validation of CQV P1 1
How to identify if reference images are in their right folder
P1 1
CQV is complicated/complex P1 1
Score value of how well the product relate to an “ok” or “not ok” image
P1 P2 2
Store images for minimum 5 months, preferably 3 years
Q P1 2
No need for more software P2 MC 2
Presents graphs of how well CQV classifies the products, the score value
P1 1
Backtracking availability P2 1
Manto needs to be taught with images, blob can be used directly with units found in product specification
P2 1
Applications
Application store MB 1
Cloud based MB 1
Self-developing MB 1
Automatically adjust the process when CQV MB 1
Page 74
iii Department of Product and Production Development CHALMERS UNIVERSITY OF TECHNOLOGY Gothenburg, Sweden 2015
detect bad parameters
Possibility to save all parameters related to one product, (backtracking)
MC 1
Hard to calibrate Manto, it needs to take good decisions for extreme cases and usual cases.
X 1
Data collection Stakeholder Quantity
Connect process and product parameters M 1
Parameters from PLC M P1 2
Save all error detections found in the operator panel at a certain time (when an error occur)
P2 1
Parameters from the process, ex. the adhesive pumps vacuum, revolution and pressure
Q M OE 3
Interface that enables information from other sources, ex. Codysys, Siemens and PLC to be shown
MB 1
Data type
Raw data Q MC 2
Compatible with other software Q P2 M MC 4
MORE AREAS FOR VISION Stakeholder Quantity
Product related to Company A
Gluing of the panels Q M P1
3
Contour cut of the panels P2 OE 2
Core, length, % of absorption material, lumps Q M 2
Creases in material Q 1
Image of complete product (whole product view), white light
Q M P1 P2 4
Image of complete product (whole product view), UV light
Q M P1 P2 4
Time stamp on product, plastic bag and carton Q ON 2
Elastic threads exists Q 1
Page 75
iv Department of Product and Production Development CHALMERS UNIVERSITY OF TECHNOLOGY Gothenburg, Sweden 2015
Time stamp, synchronize the time stamp with the process/system
Q 1
Final packaging, look for holes and if sealing process that resulted in attaching the products in the process
Q 1
Adhesives attached at areas in the process, ex. at knives and other applications
P1 P2 ON OE
4
Automate manually performed measurements/tests Q ON 2
Environment
Monitor other areas such as counting human movements in a task
MB 1
Use vision to detect it the operators have performed a task in the right way
MC 1
Product related to Company C
Surface quality MC 1
Page 76
i Department of Product and Production Development CHALMERS UNIVERSITY OF TECHNOLOGY Gothenburg, Sweden 2015
C. Six Sigma
Description of DMAIC
Below presents the five phases and the methodology for the DMAIC.
Define
The define phase relates to the question “do we solve the right problem”. The key stage in
the define phase is to discuss and find information to be able to adjust and negotiate the
scope and resources. The purpose of this phase is to define relevant data such as
customers, the scope and information to receive quality for the project. Then validate the
problem definition and goal, and evaluate if the information received is important for the
stakeholders, the business and if it is possible to improve with Lean Six Sigma (DMAIC)
methodologies. Validate the financial benefits and if it is reasonably and if it meets
management’s expectations (George et al, 2005).
Measure
In the measure phase should the process be expressed and mapped in order to be
understood more in detail. To confirm the present flow a value stream map with data related
to the process should be expressed. Evaluate if the inputs and outputs are relevant for this
project and for these customers, and consider how to collect these data in a data collection
plan. How the data analysis will be conducted needs to be planned, what methods will be
used and what tools can be used. This can be modified during the project when the
information is received. In the measurement step is it important to work with tools and
procedures that are correct calibrated in order to get accurate, consistent and reliable data.
Collect data and update the value stream map with received information. To calculate the
lead time Littles Law should be used. Next step is process capability evaluation in this step is
it important to consider if long term or short term variations is used when calculating process
capability, ask the data expert in the company what standards they are following. Obvious
improvements can be implemented, but if the risks are high keep track of how this affects the
system. Non-value-added process steps can be eliminated to improve the capability and time
of the process (George et al, 2005).
Measurement System Analysis, Gauge R&R, Design of Experiments, Time Series Plots, are
tool commonly used in the measurement phase. Some of them are described in the books
written by Brook (2010) and Bergman and Klefsjö (2010). The mentioned measurement
systems and charts are suitable for different type of data.
Analyse
The analyse phase includes finding improvements that is missing in performance in the
current process. The key steps in analyse are finding value-added steps in the process,
determine the improvement level, analyse the process flow, review the collected data from
the measure phase and prioritize to find related parameters. In the last mentioned step can
brainstorming or FMEA be helpful in order to prioritize the data.
Page 77
ii Department of Product and Production Development CHALMERS UNIVERSITY OF TECHNOLOGY Gothenburg, Sweden 2015
Last step is finding additional data to verify the relationships found in the previous step and to
prepare for the improve phase (George et al, 2005).
Improve
This phase involves the planning and test system towards the goal and final solution. The
first step in this phase is to develop potential solutions, where statistical analysis can be used
as a tool in the development. Next step is evaluation and selection of alternatives where
Pugh matrixes and designed experiments can be used. In the design of a new system the
criteria should be weighted in order to evaluate the alternative solutions. In this step is it
Important to be open minded to new solutions and alternatives to find an optimal solution.
Further on, update the value stream map according to the developed solution and plan for a
pilot test. The pilot test could involve simulation or sketches of the new system. Last steps
involve comparison of the old and new system and the development of a full-scale
implementation plan where a more detailed documentation needs to be performed (George
et al, 2005).
Control
Last phase is to complete the project and deliver an improved process together with
procedures for maintaining the improved process. In this steps could actions such as training
and feedback from the developers in order to maintain the new system. Build in performance
targets may contribute to that the users does not return to its old habits, this could mean
empowering the users to improve the system. Feedback about the new system could be
maintained with observations and interactions with the users.
Finally a complete documentation of the project including the teams comments, further
development and lessons learned should be created, this due to contribute to further
improvements and actions. Validation of the system should be conducted several months
after the final implementation (George et al, 2005).
Page 78
i Department of Product and Production Development CHALMERS UNIVERSITY OF TECHNOLOGY Gothenburg, Sweden 2015
D. Statistical process control
Statistical process control, SPC, is not only a tool kit but also a strategy for reducing
variability, cause of most quality problems, product variation, in times of deliveries, possible
ways of doing tasks, in material, attitudes, equipment, maintenance, everywhere in a
systematic way.
Everything in an organisation can be counted as a process, which (Oakland, 2008):
requires understanding
has variation
must be properly controlled
has a capability
needs improvements
Process Understanding
A process is a transformation of inputs into outputs. The inputs can be material, methods,
information, equipment, environment, training or knowledge. While the output can be a
product, service, information or documents. Meaning a function in an organization can be
many processes taking place at the same time. Each process should be individually
analysed by an examination of the inputs and the outputs. This will give a clear picture of
necessary actions to improve quality (Oakland, 2008).
When a process is supposed to be monitored and analysed. The first is to identify what the
process is and which inputs it has as well as outputs. Many processes are easy to
understand. Example, also illustrated in figure D-1: drill a hole, filling cans or compress
tablets. But not all processes are easy to understand, for example customer service, storage
of a product or inputting process to a computer. It is essential to make a scope of a process,
since it will determine not only the needed inputs but also the resultant outputs.
When the process is specified it is possible to create SIPOC stream (Oakland, 2008). A
SIPOC diagram is commonly used early in the design phase to write down important
information and basic elements, this to be able to maintain a high level of quality in the
process. This is a way to create output requirements from customer requirements (George
et.al, 2005). The inputs to the system are all required resources to make the process
possible.
Page 79
ii Department of Product and Production Development CHALMERS UNIVERSITY OF TECHNOLOGY Gothenburg, Sweden 2015
Figure D-1 Description of a SIPOC stream when serving your friend a cup of tea.
To prevent a failure in any transformation it is important the process is defined, inputs and
outputs are properly documented but also determined. An extensive documentation will allow
reliable data from the process to be collected and analysed. From this actions to improve the
process and prevent failure can be preceded (Oakland, 2008).
A systematic study of a defined process through answering four questions (Oakland, 2008,
CH 1.3, PP 17):
Can we do the job correctly? (capability)
Are we doing the job correctly? (control)
Have we done the job correctly? (quality assurance)
Could we do the job better? (improvements)
Variation
Each process has a variation. The variation can in many cases be hard to explain. Take a
sales department at a company, one month the sales outperform their target and the next
month they do not even fill half of their goal. Why?
In a production the system is “in statistical control” or “stable” if and only if common cause is
presented in a process, common cause could be traffic problem, operator performance or
weather, variations unable to control. Sales figures can be a result from common causes of
variations due to the buyers´ physical and emotional variation (Oakland, 2008).
Page 80
iii Department of Product and Production Development CHALMERS UNIVERSITY OF TECHNOLOGY Gothenburg, Sweden 2015
There is also a variation with relatively large magnitudes and often readable. This
variation is called special variations. If the process has this variations the process will be
“out of statistical control” or “unstable”.
The following two questions should be answered to receive an understanding if the process
is possible to meet the question “Can we do this job correctly?” (Oakland, 2008):
Is the process in control? - Are special causes of variation present?
What is the extend of the process variability? - What is the capability when only
common causes of variation are present?
This approach can be applied to both attribute data and variables. It provides a systematic
methodology to examine, control and investigate a process. The variation can be showed in
a schematic control chart. Where the upper and lower control limit will be equal to the biggest
accepted variation (Oakland, 2008).
Control
All too often processes are adjusted after just a single measurement has been performed.
Even if the process is stable it still occurs random and common causes of variation making a
one sample adjustment not sufficient. Oakland (2008) argues that it is essential to take 4 to
12 samples to provide sensitivity which can detect a change of the mean of the process.
From this a suitable corrective action can be taken. If a sampling size is larger than 12 the
range value will lose efficiency due to the values in between highest and lowest are not
presented.
Data collected as variables is presented in a mean and range chart, presented in figure D-3
respectively figure D-4. This makes it possible to see if the 𝑋 ̅(sampled mean value) lies in
the range ± 3𝜎. If the process is stable this should be the case. If 𝑋 ̅is in a rising or falling
trend relative to the process mean the process needs to be adjusted, this yields also when
𝑋 ̅is below or above process mean. The process mean is the calculated mean value for the
process.
Page 81
iv Department of Product and Production Development CHALMERS UNIVERSITY OF TECHNOLOGY Gothenburg, Sweden 2015
Figure D-2 Mean chart.
In the mean chart there are upper action, upper warning, process mean, lower warning, and
lower action line at:
Process mean line : 𝑋 ̿ = 𝐴𝑣𝑒𝑟𝑎𝑔𝑒 𝑜𝑓 �̅�
Upper action line: 𝑋 ̿ +3𝜎
√𝑛
Upper warning line: 𝑋 ̿ +2𝜎
√𝑛
Lower warning line: 𝑋 ̿ −2𝜎
√𝑛
Lower action line: 𝑋 ̿ −3𝜎
√𝑛
where 𝜎 =𝑅 ̅
𝑑𝑛 and 𝑑𝑛 is Hartley´s constant. �̅� is the mean range of a sample and 𝑛 is the
sample size (Oakland, 2008).
Page 82
v Department of Product and Production Development CHALMERS UNIVERSITY OF TECHNOLOGY Gothenburg, Sweden 2015
Figure D-3 Range chart.
In the range chart action and warning lines are not symmetric due to range only can be 0 or
higher and will instead be:
Upper action line: 𝐷0.001�̅�
Upper warning line: 𝐷0.025�̅�
Lower warning line: 𝐷0.975�̅�
Lower action line: 𝐷0.999�̅�
If the process is in control:
No mean or range values outside the action limits
No more than 1 in 40 values between warning and action limits
No case where two mean or range values lies after each other outside the same
warning line
No runs or trends of five or more which is in the warning zone or action zone
No runs where more than 6 sample means lies either above or below the process
mean.
No more than 6 samples of the mean being in a rising or falling trend.
Attribute
Collected data in forms of attributes, or in other term Booleans, makes it impossible to use
mean and range charts to control the process. There are two types of control charts to
control a process when having attribute data (Oakland, 2008):
Number of defectives chart
Number of defects chart
The Defectives chart with constant sample size is called np-chart, with samples of varying
size it is called p-charts. Defects chart with same size of sample every time is called c-charts
and with varying sample size called u-charts. Np-chart is used when there is possible to
maintain a constant sample size.
Page 83
vi Department of Product and Production Development CHALMERS UNIVERSITY OF TECHNOLOGY Gothenburg, Sweden 2015
Figure D-4 np-chart.
The goal with np-charts, figure D-5, is to present the defectives in a constant sample size n.
The centreline is 𝑛�̅�, warning lines 𝑛�̅� ± 2 √𝑛�̅� (1 − �̅�) and the action line is 𝑛�̅� ±
3 √𝑛�̅� (1 − �̅�) is the proportion defective, �̅� is average value of p (Oakland, 2008).
When it is impossible to maintain constant sample size n a p-chart, figure D-6, may be used.
It is similar to np-chart but instead of having constant upper action and warning lines moving
depending on the sample size.
Figure D-5 p-chart.
Page 84
vii Department of Product and Production Development CHALMERS UNIVERSITY OF TECHNOLOGY Gothenburg, Sweden 2015
The p-chart has a centreline �̅�, warning lines �̅� ± 2 √�̅� (1−�̅�
�̅�) and an action line �̅� ±
3 √�̅� (1−�̅�
�̅�). �̅� is the average sampling size. Note, holds only if n is in zone (�̅� ± 25%)
(Oakland, 2008).
Capability
When a process is in statistical control, do not have any special causes of variation
present. It is possible to investigate if the process capability meets the requirements.
This can be done by comparing the tolerances against the variation in the process.
If the tolerance band is wider than the variation, the process has medium to high relative
precision. While if the tolerance band is less than the variation, the process has low
relative precision (Oakland, 2008).
A relative precision index (RPI) can tell if a process has the capability to meet the
tolerances.
𝑅𝑃𝐼 =𝑇𝑜𝑙𝑒𝑟𝑎𝑛𝑐𝑒 𝑟𝑎𝑛𝑔𝑒
�̅�
𝑅𝑃𝐼𝑚𝑖𝑛𝑢𝑚𝑢𝑛 =6
𝐻𝑎𝑟𝑡𝑙𝑒𝑦´𝑠 𝑐𝑜𝑛𝑠𝑡𝑎𝑛𝑡
if 𝑅𝑃𝐼 > 𝑅𝑃𝐼𝑚𝑖𝑛𝑢𝑚𝑢𝑛 the system has capabilities to meet the tolerance requirements
(Oakland, 2008).
𝐶𝑝 index can also be used to find the capabilities of the process. If the 𝐶𝑝 index is
greater than 1 the process has capability (Oakland, 2008).
𝐶𝑝 =( 𝑈𝑝𝑝𝑒𝑟 𝑠𝑝𝑒𝑐𝑖𝑓𝑖𝑐𝑎𝑡𝑖𝑜𝑛 𝑙𝑖𝑚𝑖𝑡𝑠 − 𝐿𝑜𝑤𝑒𝑟 𝑠𝑝𝑒𝑐𝑖𝑓𝑖𝑐𝑎𝑡𝑖𝑜𝑛 𝑙𝑖𝑚𝑖𝑡𝑠 )
6𝜎
If the process is not centred, the mean is not in the middle of USL and LSL, 𝐶𝑝 index
cannot be used. Instead 𝐶𝑝𝑘 index can be used to tell the capabilities of the process.
𝐶𝑝𝑘𝑢 =𝑈𝑆𝐿 − �̿�
3𝜎
𝐶𝑝𝑘𝑙 =�̿� − 𝐿𝑆𝐿
3𝜎
If they are greater than 1 the system has capability, but it is has high level of confidence
first when it is greater than 2. This yields also for 𝐶𝑝 index (Oakland, 2008).
Page 85
viii Department of Product and Production Development CHALMERS UNIVERSITY OF TECHNOLOGY Gothenburg, Sweden 2015
Improvements
SPC recommends the methods using fact rather than feelings when doing
improvements. It includes the never ending improvements cycle plan, do check and act,
PDCA. This approach focuses on suppliers, inputs, control, resources but exclude the
output (Oakland, 2008).
Other methods are pareto analysis, cause and effect analysis but also brainstorming with
affected employees can help to find new improvements. A scatter diagram can be used
to highlight relationships between factors. A commonly used improvement method is the
Six Sigma Define, Measure, Analyse, Improve, and Control (DMAIC) (Oakland, 2008).
Basic tools of SPC
In SPC information and numbers will form the basis for actions and decisions. Therefore a
data recording system is essential. To support the management system with a framework for
recording data. It exist a set of basic tools which may be used to derive maximum use of the
data. In the list below a set of tool to give any organization possibilities to collect, present and
analyse most of its data (Oakland, 2008, CH 1.4, PP 18):
Process flowcharts - What is done?
Check sheets - How often is it done?
Histograms - What does the variation look like?
Graphs - Can the variation be represented in a time series?
Pareto analysis - Which are the big problems?
Cause and effect analysis - What cause the problems?
Scatter diagrams - What are the relationships between factors?
Control charts - Which variations to control and how?