36
1 Peter Fox Data Analytics – ITWS-4600/ITWS-6600/MATP-4450 Group 1, Module 2, January 22, 2018 Introductory Statistics/ Refresher
1
Peter FoxData Analytics – ITWS-4600/ITWS-6600/MATP-4450
Group 1, Module 2, January 22, 2018
Introductory Statistics/ Refresher
Definitions/ topics• Statistic• Statistics• Population and
Samples• Sampling• Distributions and
parameters• Central Tendencies• Frequency• Probability
2
• Significance tests• Hypothesis (null and
alternate)• P-value• Density and cumulative
distributions
Statistic and Statistics• Statistic (not to be confused with Statistics)
– Characteristic or measure obtained from a sample.
• Statistics– Collection of methods for planning experiments,
obtaining data, and then organizing, summarizing, presenting, analyzing, interpreting, and drawing conclusions.
3
4
What is "statistics"?
• The term "statistics" has two common meanings, which we want to clearly separate: descriptive andinferential statistics.
• But to understand the difference between descriptive and inferential statistics, we must first be clear on the difference between populations and samples.
5Courtesy Marshall Ma (and prior sources)
• A population is a set of well-defined objects– We must be able to say, for every object, if it is in the population or
not– We must be able, in principle, to find every individual of the
populationA geographic example of a population is all pixels in a multi-spectral
satellite image
• A sample is a subset of a population– We must be able to say, for every object in the population, if it is in
the sample or not– Sampling is the process of selecting a sample from a populationContinuing the example, a sample from this population could be a set
of pixels from known ground truth points
Populations and samples
6Courtesy Marshall Ma (and prior sources)
• A population = “all” of the data, if you can get it (BIG Data)– This is what is different about the methods you
use
• A sample = “some” of the data, and you may not know how representative it is– This is what limits analysis but certainly the
development of models
Populations and samples
7Courtesy Marshall Ma (and prior sources)
Example:Descriptive "The adjustments of 14 GPS control
points for this orthorectification ranged from 3.63 to 8.36 m with an arithmetic mean of 5.145 m"
Inferential "The mean adjustment for any set of GPS points taken under specified conditions and used for orthorectification is no less than 4.3 and no more than 6.1 m; this statement has a 5% probability of being wrong"
Another example "statistics"?
8Courtesy Marshall Ma (and prior sources)
E.g. Election prediction• Exit polls versus election results
– Human versus cyber• How is the “population” defined here?
• What is the sample, how is it chosen?– What is described and how is that used to
predict?– Are results categorized? (where from, M/F, age)
• What is the uncertainty?– It is reflected in the “sample distribution”– And controlled/ constraints by “sampling theory”
9
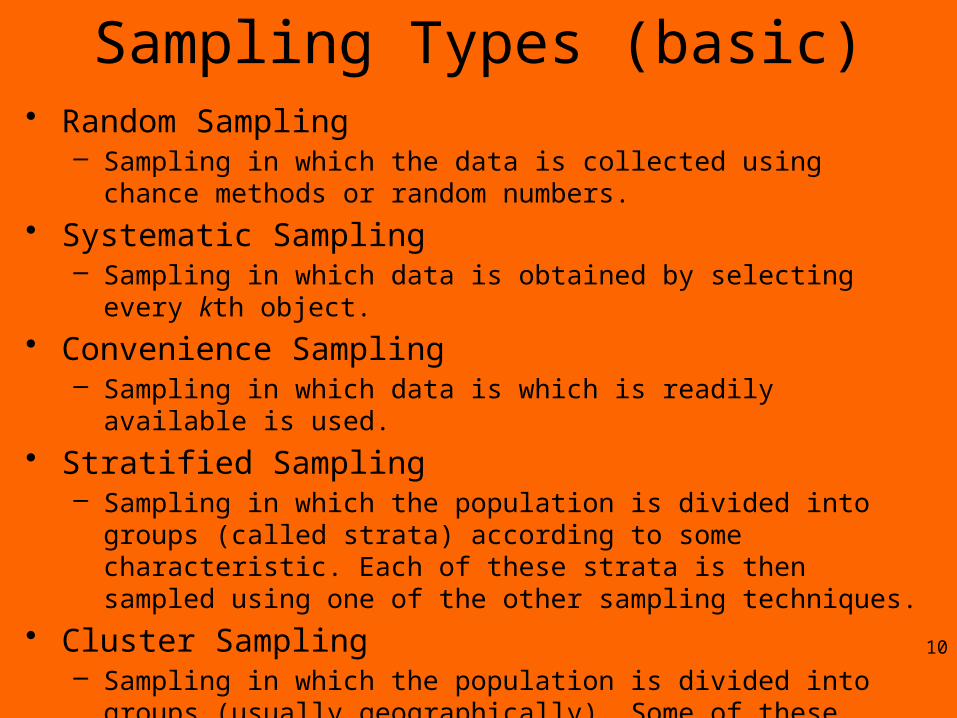
Sampling Types (basic)• Random Sampling
– Sampling in which the data is collected using chance methods or random numbers.
• Systematic Sampling– Sampling in which data is obtained by selecting every kth object.
• Convenience Sampling– Sampling in which data is which is readily available is used.
• Stratified Sampling– Sampling in which the population is divided into groups (called strata)
according to some characteristic. Each of these strata is then sampled using one of the other sampling techniques.
• Cluster Sampling– Sampling in which the population is divided into groups (usually
geographically). Some of these groups are randomly selected, and then all of the elements in those groups are selected. 10
Random Numbers• Can a computer generate a random number?
• Can you?
• Origin – to reduce selection bias!
• In R – many ways – see help on Random {base} and get familiar with set.seed
11
Sampling Theory• See Nyquist–Shannon – for time-series*
• Basically if there are no frequencies greater than x, then you need to sample at 2 x /time unit
• Not well known application: good, better, best– How many samples?
12
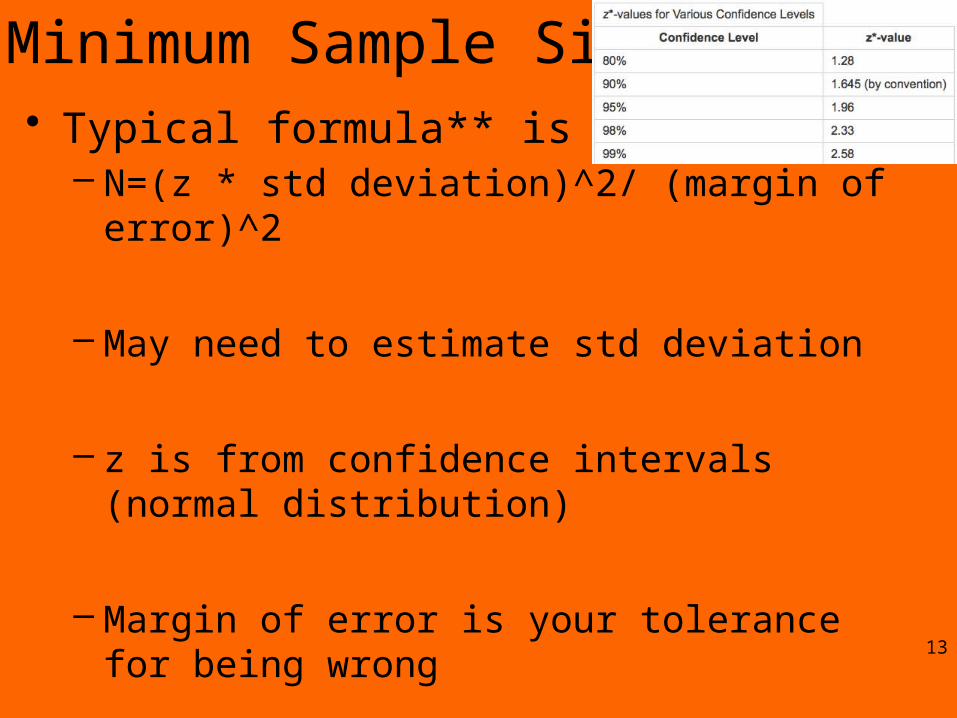
Minimum Sample Size• Typical formula** is
– N=(z * std deviation)^2/ (margin of error)^2
– May need to estimate std deviation
– z is from confidence intervals (normal distribution)
– Margin of error is your tolerance for being wrong
– E.g. for elections ~7000 ! Based on 1% error and 95% confidence…
13
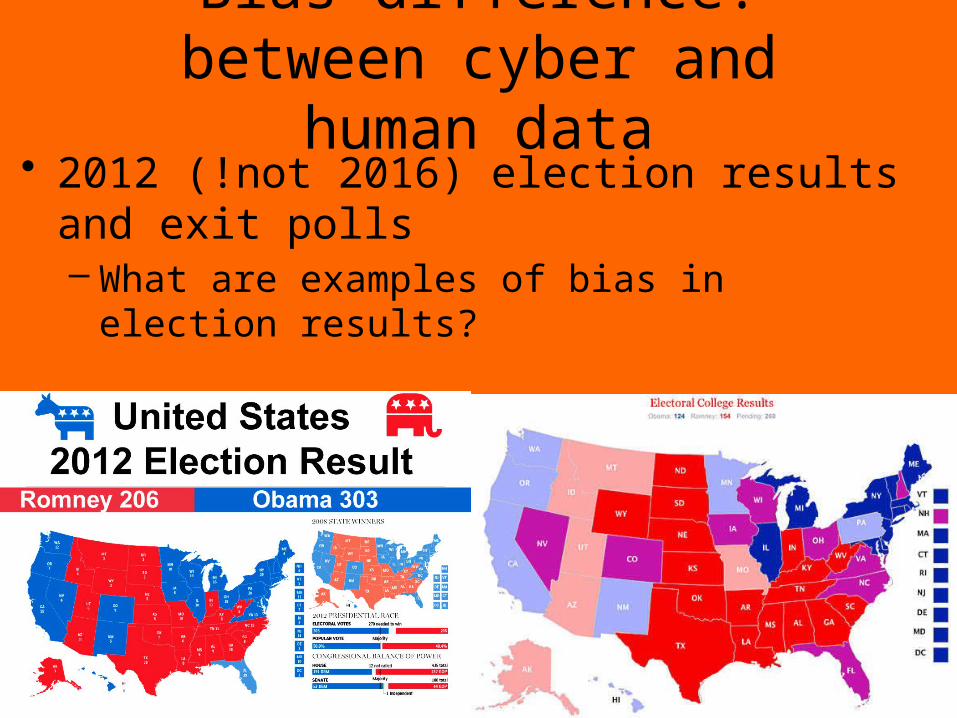
Bias difference: between cyber and human data
• 2012 (!not 2016) election results and exit polls– What are examples of bias in election results?
– In exit polls?
14
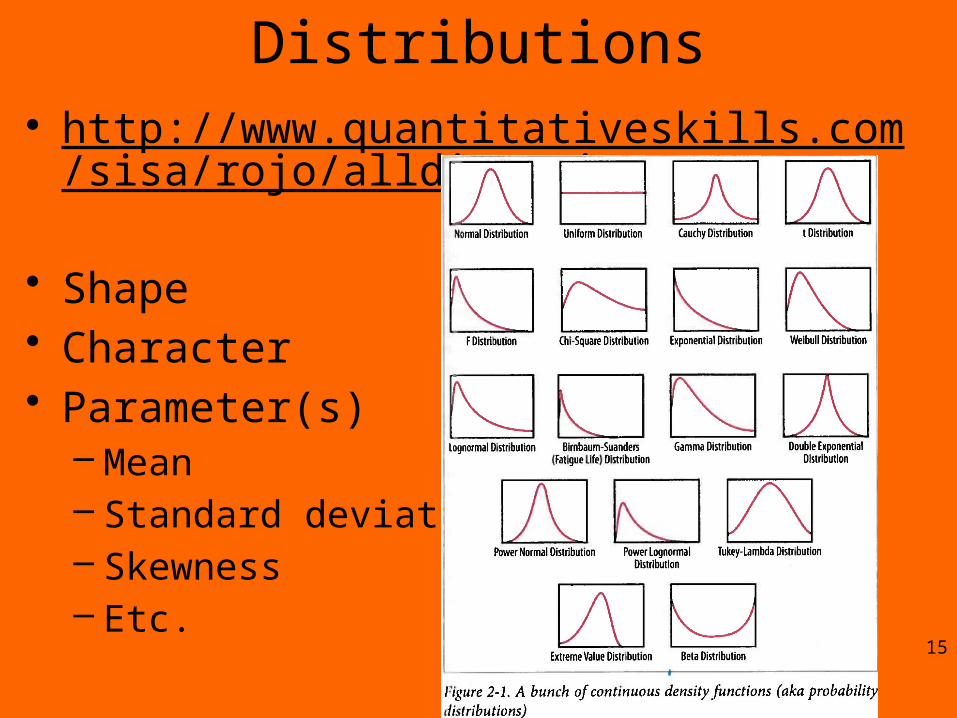
Distributions• http://www.quantitativeskills.com/sisa/rojo/alld
ist.zip
• Shape• Character• Parameter(s)
– Mean– Standard deviation– Skewness– Etc.
15
Plotting these distributions• Histograms and binning
• Getting used to log scales
• Going beyond 2-D
• More of this in lab 1 and module 3
16
In applications• Scipy:
http://docs.scipy.org/doc/scipy/reference/stats.html
• R: http://stat.ethz.ch/R-manual/R-patched/library/stats/html/Distributions.html
• Matlab: http://www.mathworks.com/help/stats/_brn2irf.html
• Excel: see http://aquarius.tw.rpi.edu/html/DA/distribution
17
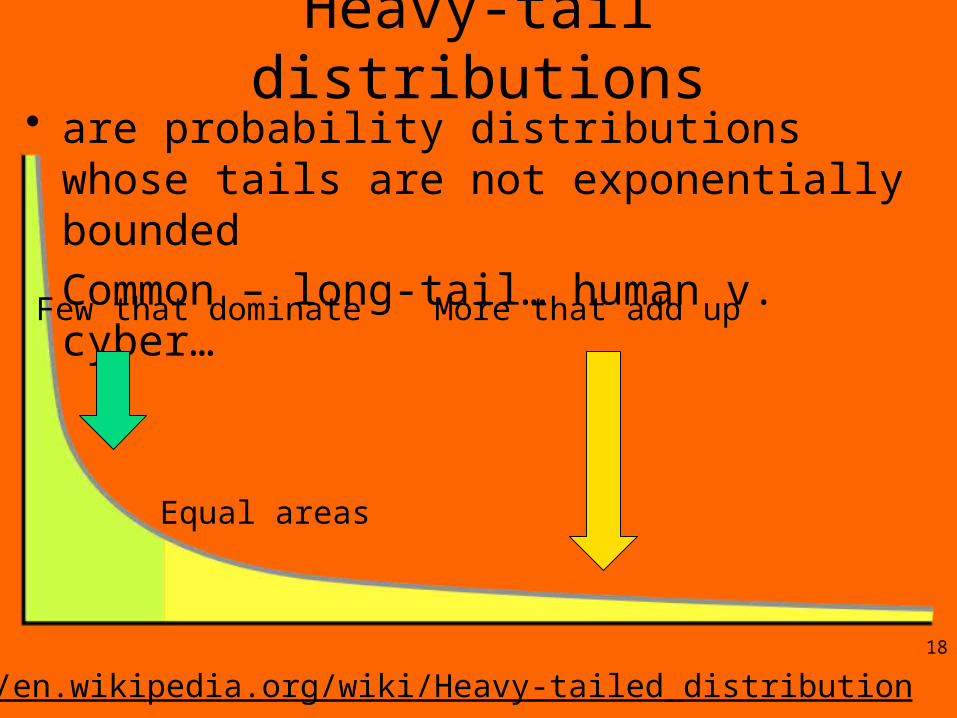
Heavy-tail distributions• are probability distributions whose tails are
not exponentially bounded• Common – long-tail… human v. cyber…
18
Few that dominate More that add up
Equal areas
http://en.wikipedia.org/wiki/Heavy-tailed_distribution
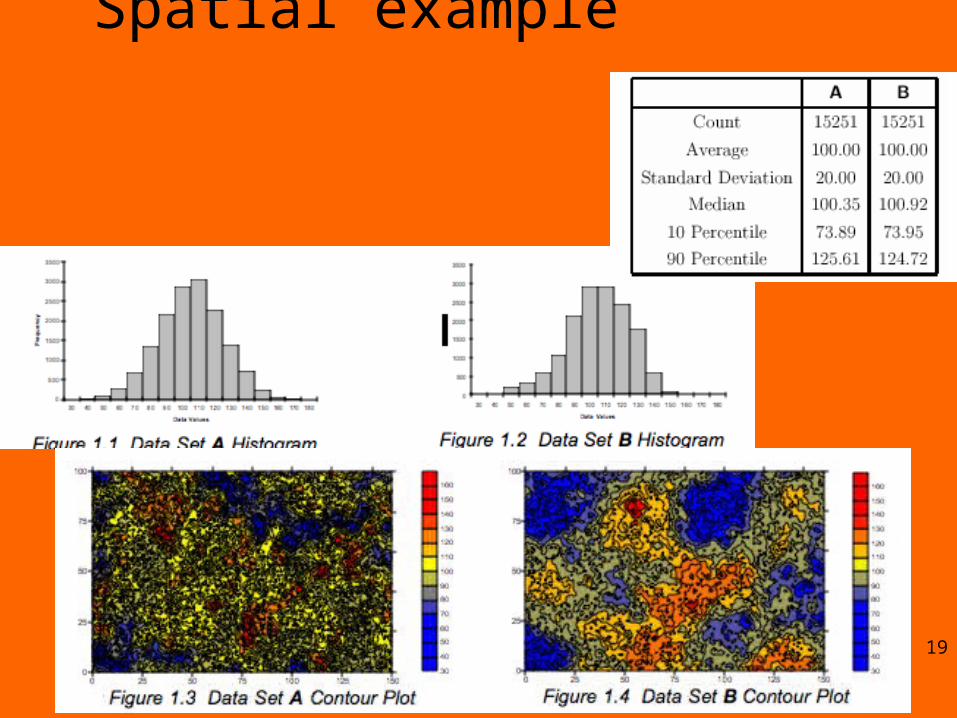
Spatial example
19
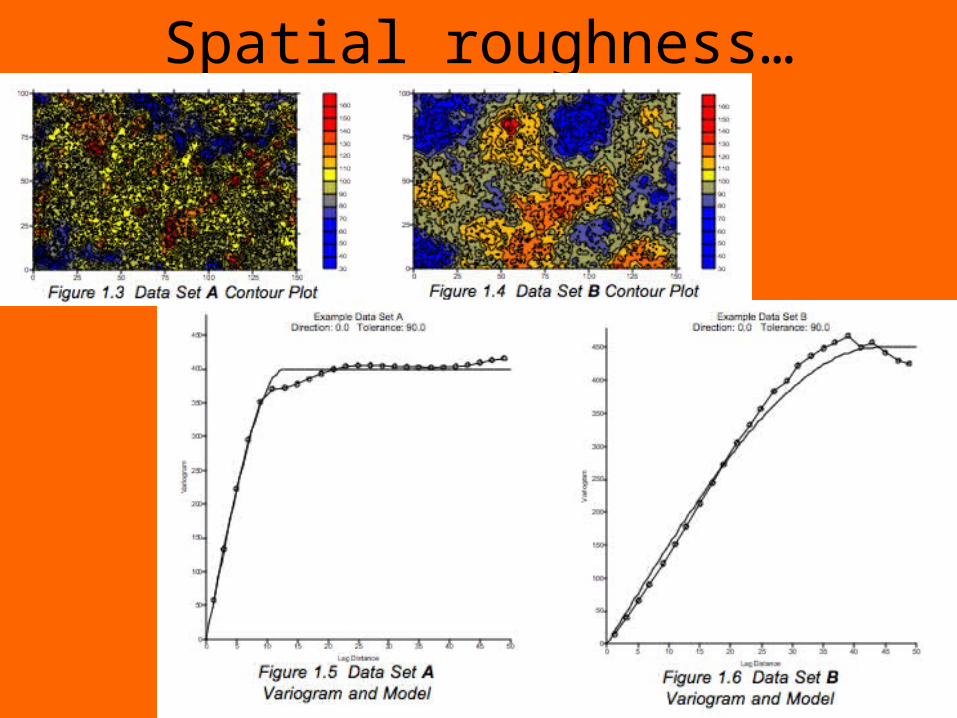
Spatial roughness…
20
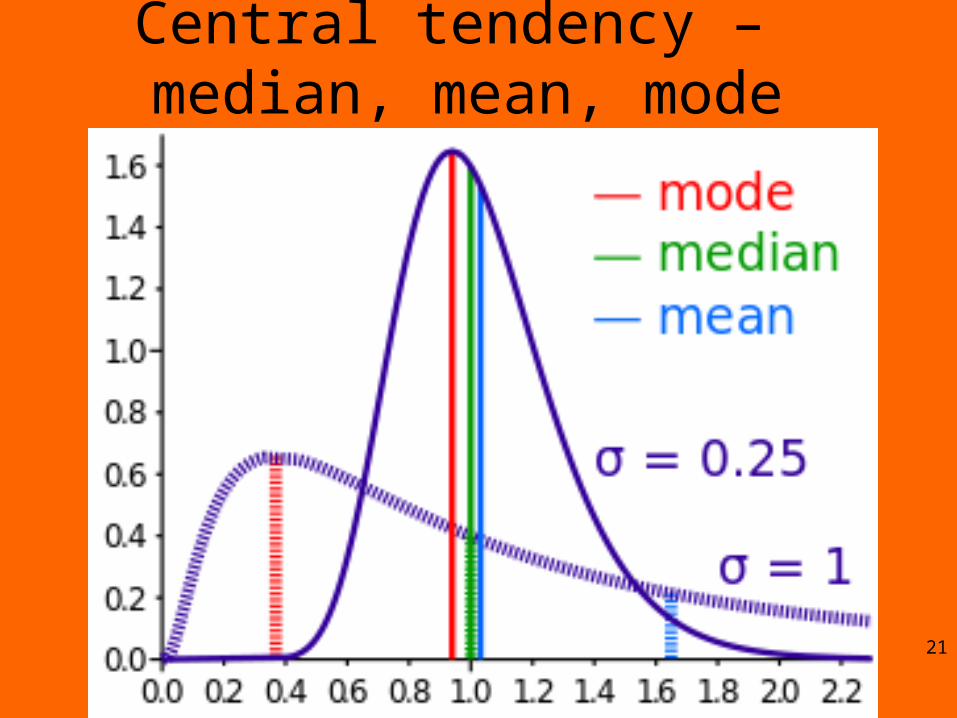
Central tendency – median, mean, mode
21
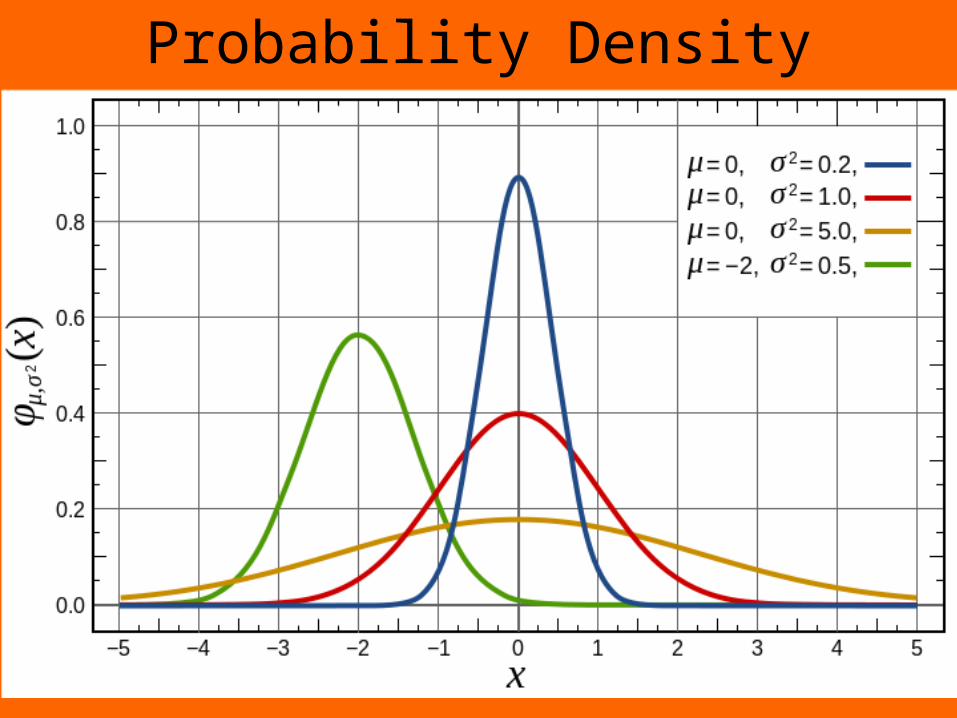
Probability Density
22
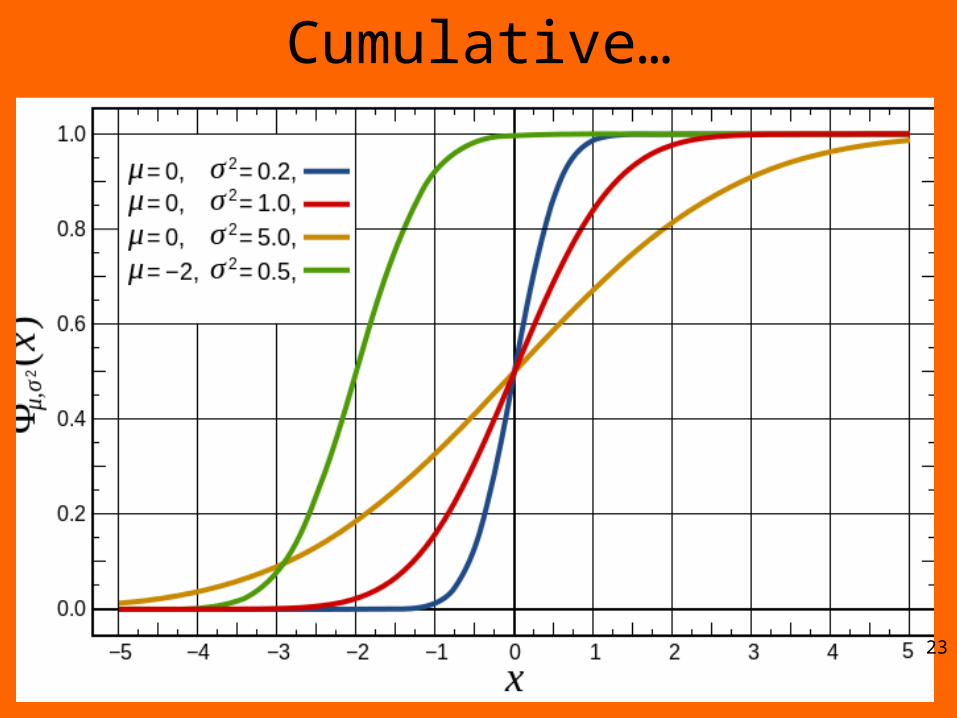
Cumulative…
23
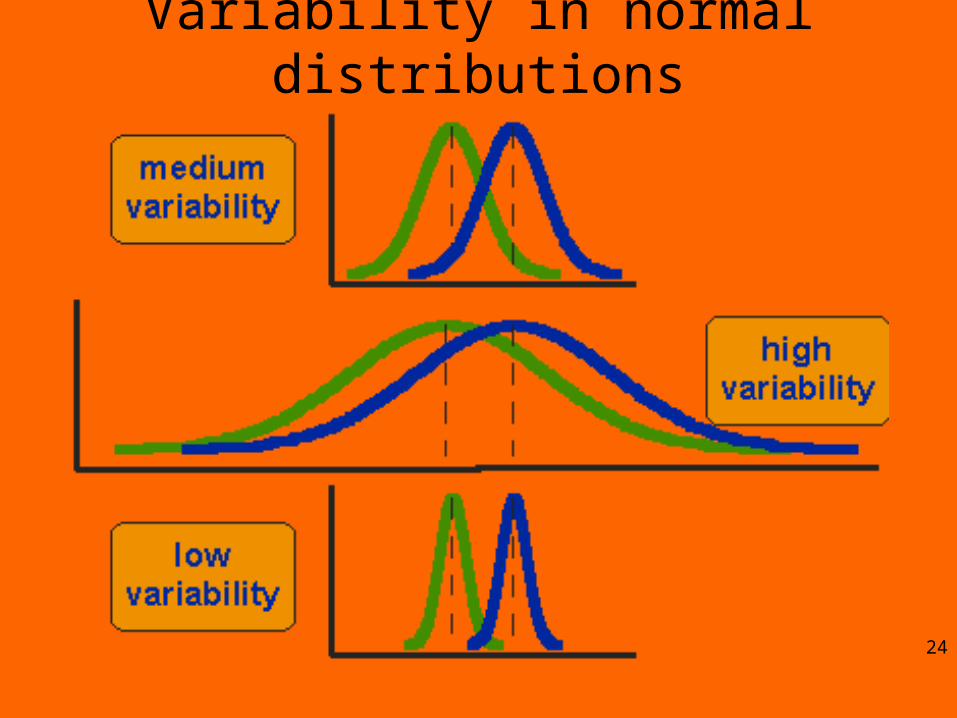
Variability in normal distributions
24
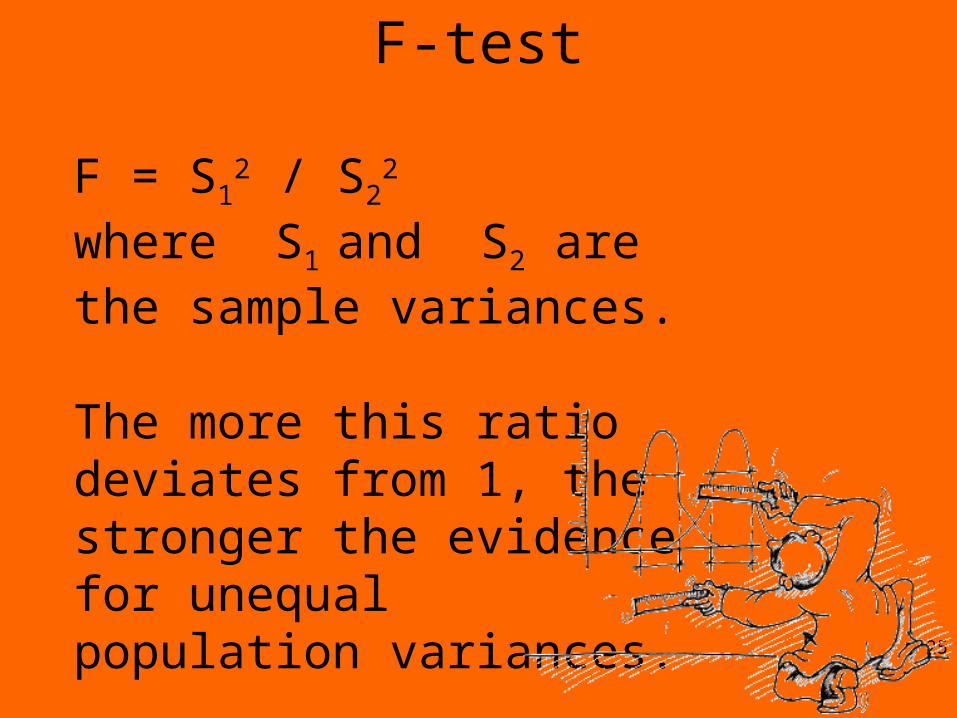
F-test
25
F = S12 / S2
2
where S1 and S2 are the
sample variances.
The more this ratio deviates from 1, the stronger the evidence for unequal population variances.
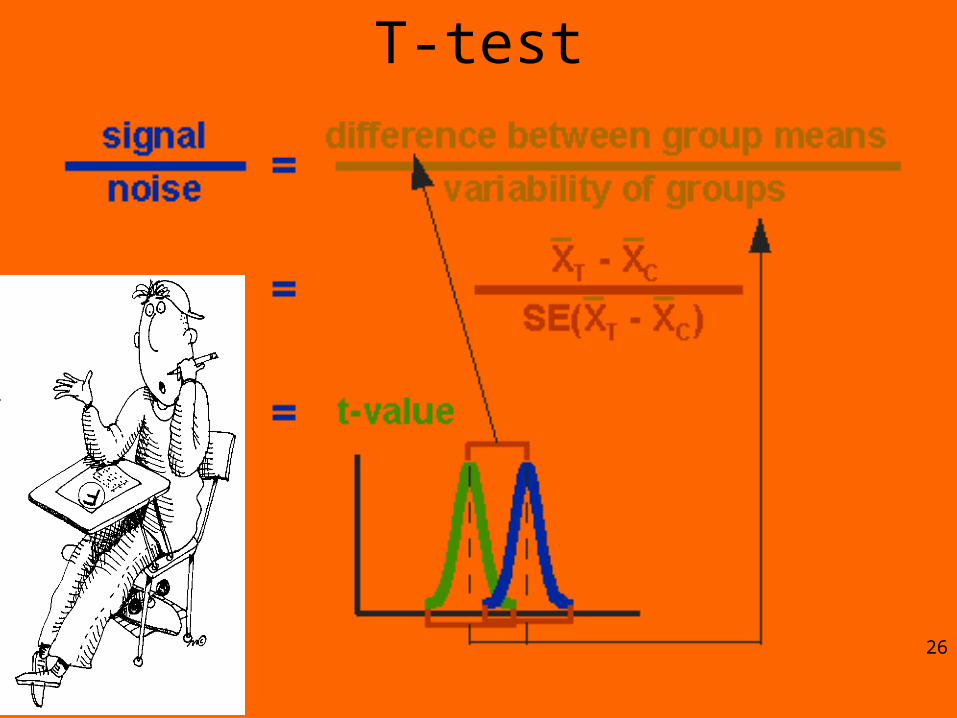
T-test
26
Note on Standard Error• Versus standard deviation = SD (i.e. from the
mean)• SE ~ SD/sample size
• So, as size increases SE << SD !! Big data
27
Frequencies v. Probabilities• Actual rate of occurrence in a sample or
population – frequency• Expected or estimate likelihood of a value or
outcome – probability
• Coin toss – two outcomes (binomial)– p=0.5 (of “heads”)
• Male/Female• Which US State you live in
28
Ranges: z, Percentiles, Quartiles• The standard score is obtained by subtracting
the mean and dividing the difference by the standard deviation. The symbol is z, which is why it's also called a z-score.
• Percentiles (100 regions)– The kth percentile is the number which has k% of
the values below it. The data must be ranked. • Quartiles (4 regions)
– The quartiles divide the data into 4 equal regions. – Note: The 2nd quartile is the same as the median.
The 1st quartile is the 25th percentile, the 3rd quartile is the 75th percentile.
29
Hypothesis1. Write the original claim and identify whether it is
the null hypothesis or the alternative hypothesis.2. Write the null and alternative hypothesis. Use the
alternative hypothesis to identify the type of test.3. Write down all information from the problem.4. Find the critical value using the tables5. Compute the test statistic6. Make a decision to reject or fail to reject the null
hypothesis. A picture showing the critical value and test statistic may be useful.
7. Write the conclusion.30
Hypothesis• What are you exploring?• Regular data analytics features ~ well defined
hypotheses– Big Data messes that up
• E.g. Stock market performance / trends versus unusual events (crash/ boom):– Populations versus samples – which is which?– Why?
• E.g. Election results are predictable from exit polls
31
Null and Alternate Hypotheses• H0 - null• H1 – alternate• If a given claim contains equality, or a
statement of no change from the given or accepted condition, then it is the null hypothesis, otherwise, if it represents change, it is the alternative hypothesis.
• It never snows in Troy in January• Students will attend their scheduled classes 32
P-value• One common way to evaluate significance,
especially in R output– approaches hypothesis testing from a different
manner. Instead of comparing z-scores or t-scores as in the classical approach, you're comparing probabilities, or areas.
• The level of significance (alpha) is the area in the critical region. That is, the area in the tails to the right or left of the critical values.
33
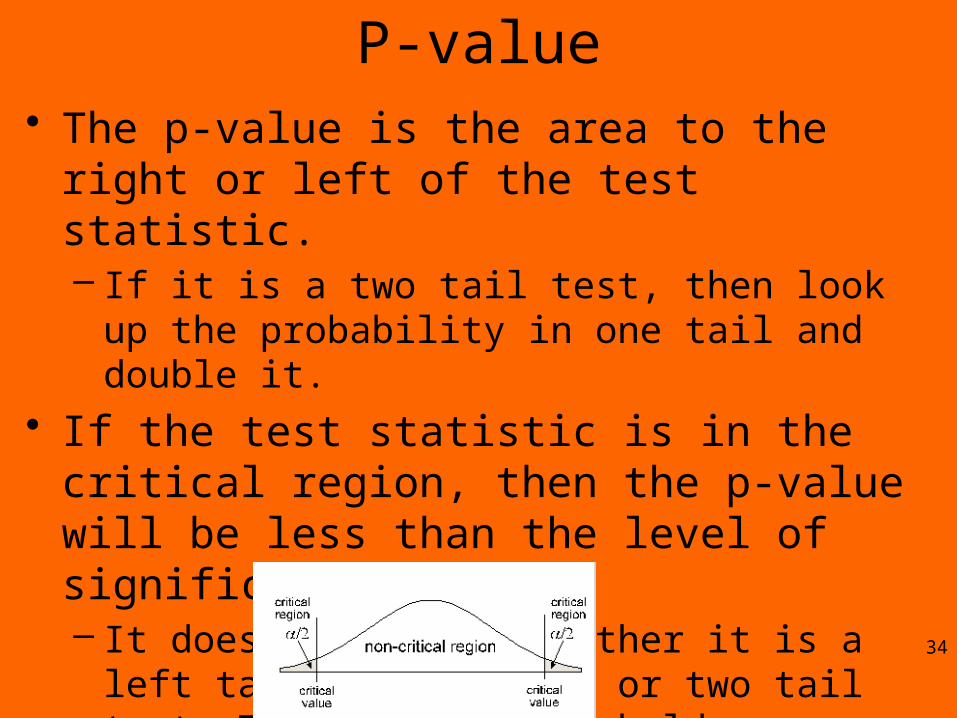
P-value• The p-value is the area to the right or left of
the test statistic. – If it is a two tail test, then look up the probability
in one tail and double it.• If the test statistic is in the critical region, then
the p-value will be less than the level of significance. – It does not matter whether it is a left tail, right tail,
or two tail test. This rule always holds.
34
Accept or Reject?• Reject the null hypothesis if the p-value is
less than the level of significance.
• You will fail to reject the null hypothesis if the p-value is greater than or equal to the level of significance. In English – you accept that there is no relation!
• Typical significance 0.05 (!) 35
36
Next?• Additional review material at:
– http://libproxy.rpi.edu/login?url=http://library.books24x7.com/library.asp?%5EB&bookid=72929
– http://libproxy.rpi.edu/login?url=http://library.books24x7.com/library.asp?%5EB&bookid=82386


