64
U PROJ ECT Definitive Feasibility Study Report Volume 1 - Executive Summary February 28, 2019 Keliber M

U
PROJ
ECT
Definitive Feasibility Study R e p o r t
Volume 1 - Executive Summary
February 28, 2019
Keliber M
Keliber Lithium Project
Volume 1 Revision 1 Page 2
Table of Contents
1. Executive Summary .......................................................................................................... 6
1.1 Introduction ................................................................................................................ 6
1.2 Economic Analysis ..................................................................................................... 6
1.3 Terms of Reference and Objectives of the Study ...................................................... 9 1.3.1 Study Contributors ........................................................................................... 9 1.3.2 Project Background and Project Description ................................................... 9 1.3.3 Effective Date and Declaration ........................................................................ 9 1.3.4 Sources of Information and Site Visits ........................................................... 10
1.4 Reliance on Other Experts ....................................................................................... 10
1.5 Property Description and Location........................................................................... 10 1.5.1 Location and Area of Property ....................................................................... 10 1.5.2 Mineral Tenures ............................................................................................. 11 1.5.3 Property Ownership and Agreements ............................................................ 11 1.5.4 Royalties ........................................................................................................ 11 1.5.5 Environmental Liabilities ................................................................................ 11 1.5.6 Permits required and Current Status ............................................................. 12 1.5.7 Risks to Access, Title and Operations ........................................................... 12
1.6 Accessibility, Climate, Local Resources, Local Infrastructure and Physiography ... 12 1.6.1 Accessibility .................................................................................................... 12 1.6.2 Physiography ................................................................................................. 13 1.6.3 Climate ........................................................................................................... 13 1.6.4 Local Resources and Infrastructure ............................................................... 13
1.7 History ...................................................................................................................... 14 1.7.1 Prior Ownership ............................................................................................. 14 1.7.2 Exploration History and Development Work .................................................. 14 1.7.3 Historical Resource Estimates ....................................................................... 15 1.7.4 Historical Reserve Estimates ......................................................................... 15
1.8 Geological Setting and Mineralisation ..................................................................... 15 1.8.1 Regional Geology........................................................................................... 15 1.8.2 Local Geology ................................................................................................ 16 1.8.3 Property Geology ........................................................................................... 17 1.8.4 Mineralisation ................................................................................................. 18 1.8.5 Mineralogy and Geometallurgy ...................................................................... 18
1.9 Exploration ............................................................................................................... 19 1.9.1 Background .................................................................................................... 19 1.9.2 Geological, Geochemical and Geophysical Surveys ..................................... 19 1.9.3 Endowment / Exploration Potential ................................................................ 20
1.10 Drilling ...................................................................................................................... 20 1.10.1 Historical Drilling ............................................................................................ 20 1.10.2 Drilling Methods ............................................................................................. 20 1.10.3 Geological Logging ........................................................................................ 20 1.10.4 Collar Surveys ................................................................................................ 21 1.10.5 Downhole Surveys ......................................................................................... 21 1.10.6 RC and Core Recovery .................................................................................. 21
1.11 Sample Preparation, Analysis and Security ............................................................ 21 1.11.1 Sample Logging and Preparation .................................................................. 21 1.11.2 Quality Assurance and Quality Control Procedures (QA/QC) ....................... 22 1.11.3 Core Lengths and Weight Checks ................................................................. 22 1.11.4 Analytical Methods and Laboratories ............................................................. 22 1.11.5 Analytical Standards and Blanks ................................................................... 22 1.11.6 Duplicates and Re-Analysis ........................................................................... 22
Keliber Lithium Project
Volume 1 Revision 1 Page 3
1.11.7 Specific Gravity Determination ....................................................................... 23
1.12 Data Verification ....................................................................................................... 23 1.12.1 Historical Data ................................................................................................ 23 1.12.2 Data Verification by the Competent Person (CP) .......................................... 23
1.13 Mineral Processing and Metallurgical Testing ......................................................... 24 1.13.1 Introduction .................................................................................................... 24 1.13.2 Historical Testing ............................................................................................ 24 1.13.3 Mineral Processing for Prefeasibility Study (PFS) & Definitive Feasibility
Study (DFS) ................................................................................................... 25 1.13.4 Optical Ore Sorting in 2018 (DFS) ................................................................. 26 1.13.5 Conversion ..................................................................................................... 26 1.13.6 Hydrometallurgical Processing To Produce Lithium Carbonate .................... 26 1.13.7 Hydrometallurgical Processing to Produce Lithium Hydroxide ...................... 27
1.14 Mineral Resource Estimate ...................................................................................... 27 1.14.1 Drill Hole Database and Data used for Resource Modelling ......................... 27 1.14.2 Orebody Model ............................................................................................... 28 1.14.3 Li2O_mod ....................................................................................................... 29 1.14.4 Basic Statistics ............................................................................................... 29 1.14.5 Compositing ................................................................................................... 29 1.14.6 Block Model .................................................................................................... 30 1.14.7 Grade Interpolation and Estimation ............................................................... 30 1.14.8 Block Model Validation ................................................................................... 31 1.14.9 Density ........................................................................................................... 31 1.14.10 Mineral Resource Classification ..................................................................... 31 1.14.11 Mineral Resource Statement ......................................................................... 32
1.15 Ore Reserve Estimate ............................................................................................. 32 1.15.1 Estimate Principles and Methodology ............................................................ 32 1.15.2 Geological Block Model ................................................................................. 32 1.15.3 Pit Optimisation Parameters .......................................................................... 33 1.15.4 Capital Investments........................................................................................ 33 1.15.5 Discount Rates ............................................................................................... 33 1.15.6 Royalties ........................................................................................................ 33 1.15.7 Capacity and Production Scenario ................................................................. 33 1.15.8 Processing Recovery ..................................................................................... 33 1.15.9 Mining and Transportation Costs ................................................................... 33 1.15.10 Processing Costs ........................................................................................... 33 1.15.11 Mining Throughput Limits ............................................................................... 34 1.15.12 Mining Dilution ................................................................................................ 34 1.15.13 Mining Recovery ............................................................................................ 34 1.15.14 Cut-Off ............................................................................................................ 34 1.15.15 Product Price .................................................................................................. 34 1.15.16 Open Pit Constraints ...................................................................................... 34 1.15.17 Specific Gravity .............................................................................................. 34 1.15.18 Open Pit Shell Selection Criteria .................................................................... 34 1.15.19 Optimisation Results ...................................................................................... 34 1.15.20 Ore Reserve Estimate .................................................................................... 35
1.16 Mining Methods ........................................................................................................ 35 1.16.1 Introduction .................................................................................................... 35 1.16.2 Open Pit Geotechnical Evaluation ................................................................. 36 1.16.3 Underground Geotechnical Evaluation .......................................................... 36 1.16.4 Pit and Underground Mine Design ................................................................. 36 1.16.5 Geotechnical Considerations of Production Sequencing ............................... 36 1.16.6 Production Schedule ...................................................................................... 37 1.16.7 Total Material Movements .............................................................................. 37
1.17 Recovery Methods ................................................................................................... 38
Keliber Lithium Project
Volume 1 Revision 1 Page 4
1.17.1 Overview of the Treatment Route to Produce Lithium Hydroxide ................. 38 1.17.2 Recoveries in the Lithium Hydroxide Production Process ............................. 40 1.17.3 Overall Mass Balance .................................................................................... 40 1.17.4 Spodumene Concentrator .............................................................................. 41 1.17.5 Kalavesi Site Services.................................................................................... 43 1.17.6 Tailings and Water Management at Kalavesi Site ......................................... 43 1.17.7 Lithium Hydroxide Production Plant ............................................................... 44 1.17.8 KIP Site Services ........................................................................................... 46
1.18 Project Infrastructure................................................................................................ 46
1.19 Market Studies and Contracts ................................................................................. 47 1.19.1 Global Lithium Reserves and Resources....................................................... 47 1.19.2 Lithium Supply and Outlook of Mine Production Capacity ............................. 47 1.19.3 Current and Historical Lithium Consumption ................................................. 47 1.19.4 Lithium Consumption Outlook 2017 – 2032 ................................................... 48 1.19.5 Market Balance: Outlook of Supply Demand Balance ................................... 48 1.19.6 Lithium Prices ................................................................................................. 48 1.19.7 By-Product Markets........................................................................................ 49 1.19.8 Contracts ........................................................................................................ 49
1.20 Environmental Studies, Permitting and Social or Community Impact ..................... 50 1.20.1 Introduction .................................................................................................... 50 1.20.2 Mine Areas ..................................................................................................... 50 1.20.3 Concentrator .................................................................................................. 52 1.20.4 Hydrometallurgical Plant ................................................................................ 54 1.20.5 Consultation ................................................................................................... 55 1.20.6 Land Acquisition & Livelihood Restoration .................................................... 56 1.20.7 Compliance Assessment ............................................................................... 56
1.21 Capital and Operating Costs .................................................................................... 56 1.21.1 Capital Cost Estimate..................................................................................... 56 1.21.2 Operating Cost Estimate ................................................................................ 58
1.22 Other Relevant Data and Information ...................................................................... 59 1.22.1 Schedule ........................................................................................................ 59 1.22.2 Project Execution Plan ................................................................................... 59
1.23 Conclusions and Recommendations ....................................................................... 61
Keliber Lithium Project
Volume 1 Revision 1 Page 5
List of Figure
Figure 1-1: Free Cash Flow Summary .................................................................................................... 8 Figure 1-2: IRR Sensitivity Post Tax ....................................................................................................... 8 Figure 1-3: Location of operations ........................................................................................................ 10 Figure 1-4: Locations of known lithium and REE pegmatites in Finland .............................................. 16 Figure 1-5: Geology and location of the main lithium pegmatite deposits and indications in the Kaustinen-Kokkola-Kruunupyy area ..................................................................................................... 17 Figure 1-6: Simplified flowsheet of the Keliber process route ............................................................... 24 Figure 1-7: Annual Ore and LiOH.H2O Production ............................................................................... 38 Figure 1-8: Simplified overall process block flow diagram to produce lithium hydroxide ..................... 39 Figure 1-9: Simplified Block Flow Diagram of Spodumene Concentrator ............................................ 42 Figure 1-10: Simplified Block Flow Diagram for the Chemical Plant .................................................... 45 Figure 1-11: Capital Expenditure .......................................................................................................... 58
List of Table
Table 1-1: Financial Evaluation Summary .............................................................................................. 7 Table 1-2: Core loss and RQD values of the deposits .......................................................................... 21 Table 1-3: Summary of drilling data used in the resource estimate...................................................... 28 Table 1-4: Composite Length ................................................................................................................ 30 Table 1-5: Block Model Framework ...................................................................................................... 30 Table 1-6: Interpolation Parameters ..................................................................................................... 30 Table 1-7: Block Model vs Composite Li2O grade ................................................................................ 31 Table 1-8: Density values assigned to the block model ........................................................................ 31 Table 1-9: Mineral Resource Statement 16 May 2018 ......................................................................... 32 Table 1-10: Ore Reserve Estimate ....................................................................................................... 35 Table 1-11: Recovery figures in the lithium hydroxide production ........................................................ 40 Table 1-12: Average Annual Overall Mass Balances ........................................................................... 40 Table 1-13: Summary of Capital Cost Estimate .................................................................................... 57 Table 1-14: Summary of Operating Costs ............................................................................................ 58
Keliber Lithium Project
Volume 1 Revision 1 Page 6
1. Executive Summary
1.1 Introduction
In June 2018 Keliber completed a definitive feasibility study (DFS) for a project to produce
11 000 tpa of battery grade lithium carbonate from spodumene-rich pegmatite deposits in
Central Ostrobothnia, Finland. However, following further market studies for lithium
products, especially the demand in Europe, it was decided to consider the production of
battery grade lithium hydroxide monohydrate (LiOHꞏH2O, for simplicity called here lithium
hydroxide) instead of lithium carbonate. A series of tests has been completed to
determine the production parameters to update the June 2018 DFS Report for the
production of lithium hydroxide from spodumene ore (the Project).
The study includes Mineral Resource and Ore Reserve estimates which comply with the
JORC Code 2012 and specifies the process treatment route. Capital and operating costs
have been determined and a discounted cash flow model developed to assess the project
economics. The current life of mines is 13 years but the project is extended to 20 years by
purchasing spodumene concentrates from third parties for 7 years after the mines, based
on the current resources, are exhausted. There exists significant exploration potential in
the area giving the possibility to continue the operation from Keliber’s own reserves after
the initial 13 years period.
Environmental and social aspects of the Project have been addressed to ensure that the
positive impacts are known and any potential negative impacts of the Project are
minimised and there is full compliance with all Finnish environmental regulations, permits
and international guidelines.
1.2 Economic Analysis
The economics of the project have been evaluated with an Excel-based real-basis
financial model developed in Euros to present the cost structure and the economic
evaluation of the project as a stand-alone entity. The lithium hydroxide price is based on
the Roskill market report information using the real inflation adjusted base case which
ranges from USD13 162 in 2021 to USD 15 742 in 2032; this value is used from 2032 to
the end of the Project. An exchange rate of 1.18 USD to Euro is used in the financial
evaluation. The project cash flows were assessed to 2040. The financial model has been
used to estimate future cash flows and evaluate the project on the basis of net present
value (NPV), internal rate of return (IRR) and payback period. In general, a conservative
approach has been taken in the evaluation of the Project. The results of the analysis are
provided in the Table 1-1.
The post tax values obtained for NPV (€384 M at 8% discount rate), IRR (24%) and the
payback period (4.1years) show that the Project is profitable.
The total operating cost for battery grade lithium hydroxide from Keliber’s own ores is
€4 125 per tonne which is equivalent to USD4 868 at an exchange rate of 1.18 (USD to
€).
The Project life is extended by purchasing concentrates from third parties when the
Keliber mines, based on the current resources, are exhausted. The extended project life
increases the Project NPV and IRR although the operating cost averaged over the project
Keliber Lithium Project
Volume 1 Revision 1 Page 7
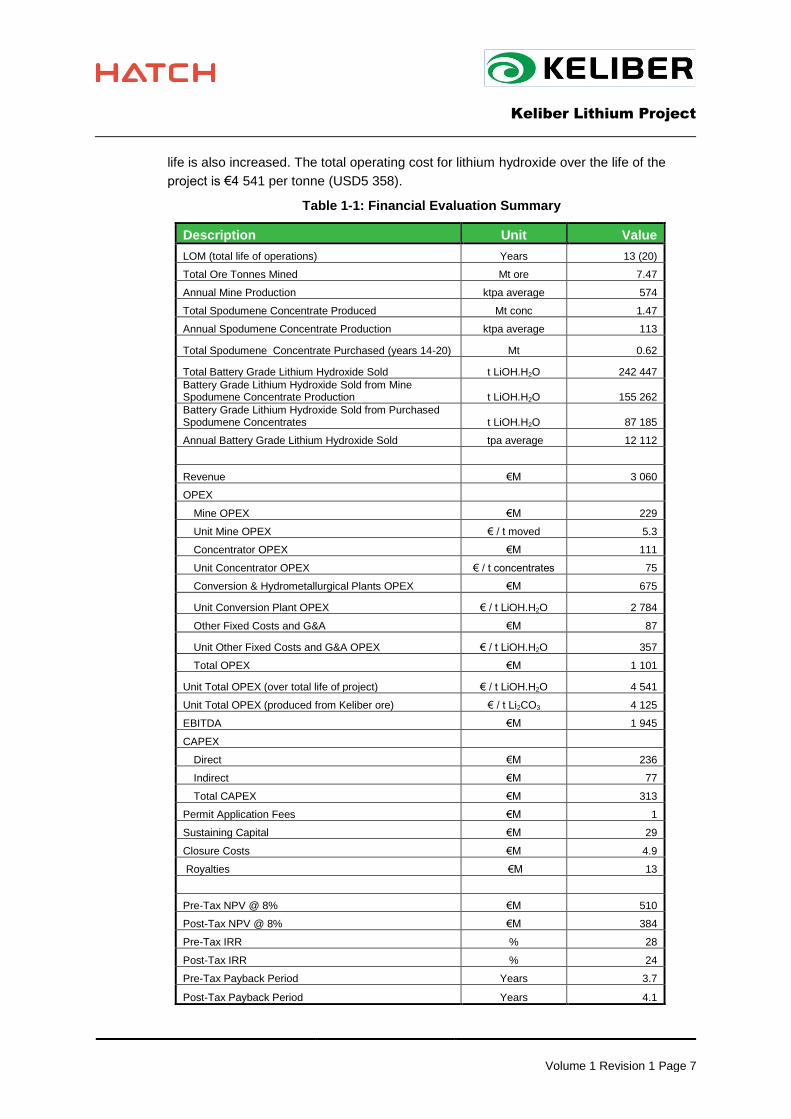
life is also increased. The total operating cost for lithium hydroxide over the life of the
project is €4 541 per tonne (USD5 358).
Table 1-1: Financial Evaluation Summary
Description Unit Value
LOM (total life of operations) Years 13 (20)
Total Ore Tonnes Mined Mt ore 7.47
Annual Mine Production ktpa average 574
Total Spodumene Concentrate Produced Mt conc 1.47
Annual Spodumene Concentrate Production ktpa average 113
Total Spodumene Concentrate Purchased (years 14-20) Mt 0.62
Total Battery Grade Lithium Hydroxide Sold t LiOH.H2O 242 447
Battery Grade Lithium Hydroxide Sold from Mine Spodumene Concentrate Production t LiOH.H2O 155 262
Battery Grade Lithium Hydroxide Sold from Purchased Spodumene Concentrates t LiOH.H2O 87 185
Annual Battery Grade Lithium Hydroxide Sold tpa average 12 112
Revenue €M 3 060
OPEX
Mine OPEX €M 229
Unit Mine OPEX € / t moved 5.3
Concentrator OPEX €M 111
Unit Concentrator OPEX € / t concentrates 75
Conversion & Hydrometallurgical Plants OPEX €M 675
Unit Conversion Plant OPEX € / t LiOH.H2O 2 784
Other Fixed Costs and G&A €M 87
Unit Other Fixed Costs and G&A OPEX € / t LiOH.H2O 357
Total OPEX €M 1 101
Unit Total OPEX (over total life of project) € / t LiOH.H2O 4 541
Unit Total OPEX (produced from Keliber ore) € / t Li2CO3 4 125
EBITDA €M 1 945
CAPEX
Direct €M 236
Indirect €M 77
Total CAPEX €M 313
Permit Application Fees €M 1
Sustaining Capital €M 29
Closure Costs €M 4.9
Royalties €M 13
Pre-Tax NPV @ 8% €M 510
Post-Tax NPV @ 8% €M 384
Pre-Tax IRR % 28
Post-Tax IRR % 24
Pre-Tax Payback Period Years 3.7
Post-Tax Payback Period Years 4.1
Keliber Lithium Project
Volume 1 Revision 1 Page 8
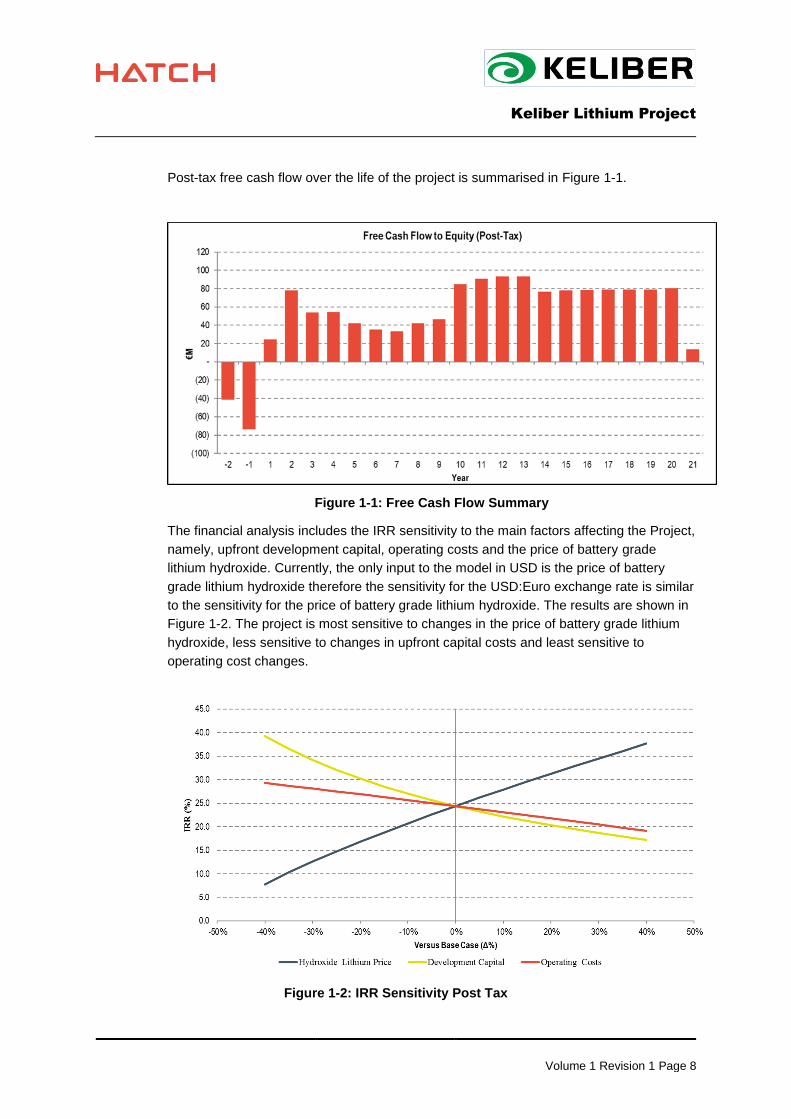
Post-tax free cash flow over the life of the project is summarised in Figure 1-1.
Figure 1-1: Free Cash Flow Summary
The financial analysis includes the IRR sensitivity to the main factors affecting the Project,
namely, upfront development capital, operating costs and the price of battery grade
lithium hydroxide. Currently, the only input to the model in USD is the price of battery
grade lithium hydroxide therefore the sensitivity for the USD:Euro exchange rate is similar
to the sensitivity for the price of battery grade lithium hydroxide. The results are shown in
Figure 1-2. The project is most sensitive to changes in the price of battery grade lithium
hydroxide, less sensitive to changes in upfront capital costs and least sensitive to
operating cost changes.
Figure 1-2: IRR Sensitivity Post Tax
Keliber Lithium Project
Volume 1 Revision 1 Page 9
1.3 Terms of Reference and Objectives of the Study
The scope of work includes the development of Mineral Resource and Ore Reserve
estimates of the lithium deposits, which comply with the JORC Code 2012, and
completion of engineering studies to treat the lithium ore by mineral processing,
conversion and chemical processing to produce 12 500 tpa of battery grade lithium
hydroxide (LiOHꞏH2O). The engineering studies are based on pilot scale test work carried
out in internationally recognised facilities. Subsequently capital and operating cost
estimates have been developed for the Project. The capital and operating cost estimates
are in line with AACE Class 3 estimates, with an order of accuracy of ±15%.
Environmental aspects of the Project are important and have been studied in depth to
ensure the impact of the Project is minimised and there is full compliance with all Finnish
environmental regulations, permits and international guidelines.
1.3.1 Study Contributors
The DFS report (the Report) was prepared by the Keliber project team, which comprises
several individuals and companies, and compiled by Hatch as the technical coordinator of
the DFS. In total twenty reputable parties have contributed to the Report, each having a
specific area of responsibility.
1.3.2 Project Background and Project Description
Keliber undertook its first drilling campaign in the area in 2004 and there has been on-
going exploration since this time. Over the years several metallurgical test work
programmes have been completed to advance the development of the Project and in
March 2016 a prefeasibility study (PFS) was completed. The PFS report indicated
sufficiently positive financial results to warrant proceeding to a definitive feasibility study.
The DFS report was completed in June 2018 for a project involving:
• Open pit mining of four deposits in the area, namely the Rapasaari, Syväjärvi, Länttä
and Outovesi deposits
• Extended underground mining in Rapasaari and Länttä and solely underground
mining in Emmes
• A conventional concentrator comprising crushing, optical sorting, grinding and
flotation to produce a spodumene concentrate
• Conversion of the spodumene concentrate from alpha to beta spodumene by roasting
in rotary kiln
• Soda leaching in an autoclave and hydrometallurgical processing including solution
purification, crystallisation and dewatering to produce lithium carbonate.
As stated above, subsequently it was decided to produce lithium hydroxide monohydrate
(LiOHꞏH2O, lithium hydroxide) instead of lithium carbonate. The production of lithium
hydroxide involves the same steps listed above but there are in total two crystallisation
steps (instead of one) to produce battery grade lithium hydroxide.
1.3.3 Effective Date and Declaration
This report is considered effective as of 28 February 2019. As stated earlier the estimates
of the Mineral Resources and Ore Reserves given in this report are in accordance with
Keliber Lithium Project
Volume 1 Revision 1 Page 10
the JORC Code 2012. The comments in this report reflect Keliber’s best judgement in the
light of the information available at time of the preparation of the Report.
1.3.4 Sources of Information and Site Visits
This Report is based, largely, on separate reports prepared by different specialists,
organisations, experts and Keliber’s internal reports and maps. Qualified Persons have
made numerous visits to the sites since 2010.
1.4 Reliance on Other Experts
The geological information for this report has been provided by Esa Sandberg and Pentti
Grönholm, while working as Chief Geologist at Keliber. Pekka Lóven and Markku
Meriläinen have prepared mineral resource estimates as Qualified Persons.
Ore reserve estimates have been prepared by Pöyry Finland Oy by competent persons
under the supervision of Ville-Matti Seppä MSc (Geology), Eur Geol acting as the
Qualified Person.
1.5 Property Description and Location
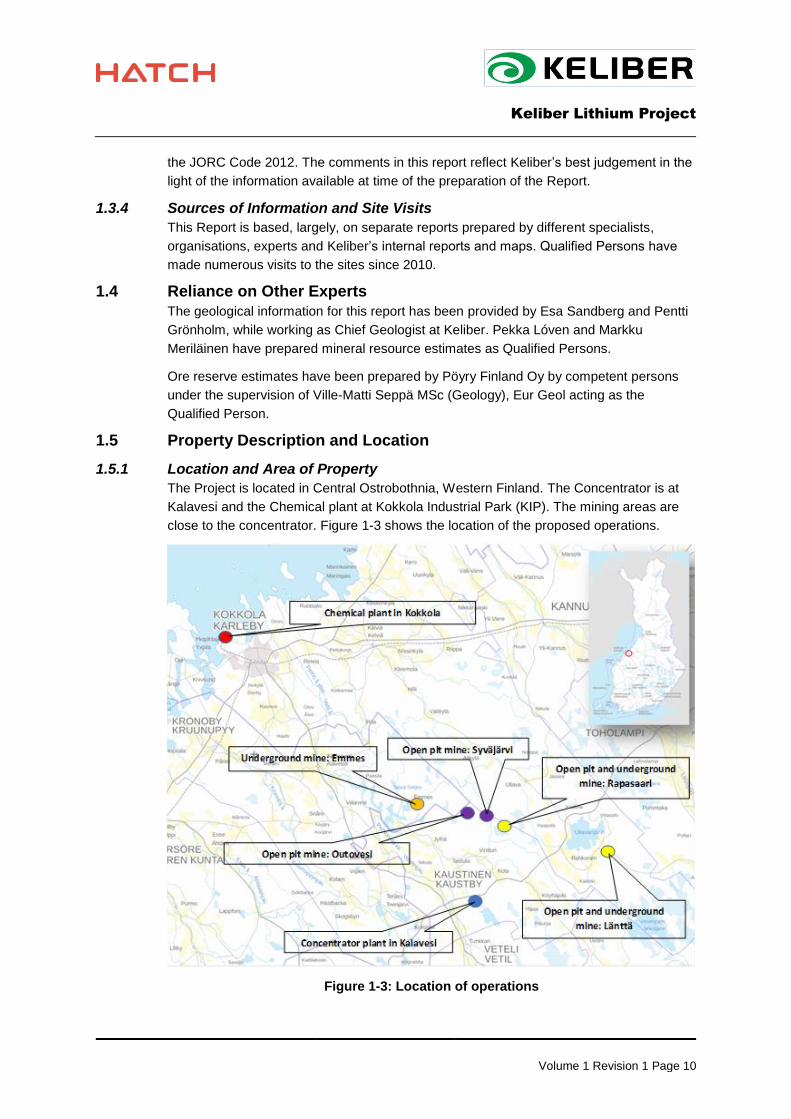
1.5.1 Location and Area of Property
The Project is located in Central Ostrobothnia, Western Finland. The Concentrator is at
Kalavesi and the Chemical plant at Kokkola Industrial Park (KIP). The mining areas are
close to the concentrator. Figure 1-3 shows the location of the proposed operations.
Figure 1-3: Location of operations

Keliber Lithium Project
Volume 1 Revision 1 Page 11
1.5.2 Mineral Tenures
Keliber has claim areas and exploration permit areas covering a total area of 974.94 ha
and holds two valid mining permits, one in Länttä and the other in Syväjärvi. These mining
permits are for an area totalling 219.87 ha. In addition, Keliber has reservations on an
area covering 577 km2. Keliber has also applied for exploration permits for 29 sites
covering a total area of 9 299 ha.
1.5.3 Property Ownership and Agreements
Exploration licences of Syväjärvi, Leviäkangas and Rapasaari areas were acquired from
the Government of Finland between 2012 and 2014. Keliber has 100% ownership of
41.73 ha of land area in Outovesi which was purchased from private landowners in 2011.
This land area covers approximately 20% of the current claim areas of Outovesi (209.67
ha).
In addition to mining at Outovesi, Keliber will conduct mining activities in other mine sites
in land areas owned by private landowners. The establishment of a mine and undertaking
of mining activity are subject to a mining permit. When a mining permit is granted, it
entitles Keliber to exploit the mining minerals found in the mining area and certain surface
materials as well as to perform exploration within the mining area. As a compensation to
landowners, Keliber will pay an annual excavation fee to the owners of land included in
the mining area. The annual amount of the excavation fee per property is 50 euros per
hectare. In addition, there are payments related to the value of the products mined
(0.15% of the value).
Part of the land area (approximately 24 ha) of the Kalavesi Concentrator area is owned by
the municipality of Kaustinen. The rest of the land area of the Kalavesi site is owned by
private landowners and organisations. Keliber has preliminary agreements for the
purchase of approximately 97% of the land area required.
1.5.4 Royalties
There is an agreement between the Government of Finland and Keliber concerning the
Leviäkangas, Syväjärvi and Rapasaari deposits (that were originally discovered by
Geological Survey of Finland and Keliber bought the rights in 2012 and 2014 respectively)
whereby Keliber shall pay to the Republic of Finland a royalty of EUR 0.5 per ore tonne
after the start of mining operations. This amount is subject to a periodic price adjustment
which has been defined in the agreement.
1.5.5 Environmental Liabilities
The old landfill site of the Kaustinen municipality, which operated between 1973 and 1996
and closed in 1997 is in the immediate vicinity of the Kalavesi site. Under the
Environmental Protection Act and in the Law on Replacing Environmental Damage the
responsibility for cleaning up the contaminated area can be transferred to the new owner.
However, in an agreement with the municipality of Kaustinen related to the acquisition of
land area, the old landfill site is excluded. Therefore, all liabilities associated with the past
activities which took place at the landfill site remain under the full responsibility of the
municipality of Kaustinen.

Keliber Lithium Project
Volume 1 Revision 1 Page 12
1.5.6 Permits required and Current Status
As of the effective date of this Report Keliber has two environmental permits and a mining
permit for the Länttä area. However, before mining can start Keliber will have to submit
supplementary information for the mining permit; this can only occur at the end of the EIA
procedures. Mining permits are required for each of the mining areas. Environmental
permits will also be needed for the mining areas. Keliber has to apply for an amendment
to the existing environmental permits for Länttä mine and Kalavesi Concentrator.
In addition, under the Water Act, Keliber is required to have a water permit for abstracting
and discharging water in the area; usually this is applied for simultaneously with the
environmental permit application. In addition, under the Water Act water permits are
required for draining Lake Syväjärvi and Lake Heinäjärvi.
A separate mining safety licence is also required for each mining operation.
Under the Regulation on the Control of Hazardous Chemicals Handling and Storage
(685/2015) Keliber must notify the authorities of the chemicals and the amount of
chemicals used as well as the handling and storage of these chemicals. A safety and
rescue plan related to these chemicals is also required.
Construction of buildings and structures requires a building permit granted by
municipalities in the project areas. The construction of new, privately-owned roads or the
upgrading of existing private roads requires a licence under Section 37 of the Road Act
(503/2005). Improving the existing private road connections also requires an application.
The Nature Conservation Act requires special provisions for the protection and
conservation of protected flora and fauna in the Project area. However, Keliber has
applied for permission to deviate from the provisions of this Act in relation to the moor frog
in Syväjärvi mine area. The permission to deviate from these provisions was granted in
February 2018 and the permissions became legally valid at the end of April 2018.
1.5.7 Risks to Access, Title and Operations
All the exploration permits, claims and mining permit of Länttä are registered in the name
of Keliber. As of the effective date of this Report, all tenures are in good standing. The
expiry date for some of the exploration permits is in the near future, however, as the
expiry dates approach an application is submitted to extend these. It is possible to extend
the permits and claims according to Finnish Mining Act.
1.6 Accessibility, Climate, Local Resources, Local Infrastructure and Physiography
1.6.1 Accessibility
The mine sites are accessible to the Kalavesi site via gravel roads, public roads and
highways. The distance by road between the mine sites and Kalavesi concentrator site
range from approximately 18 km to 25 km.
The Kalavesi Concentrator is in the municipality of Kaustinen and is approximately 5 km
from the municipality centre. The Kalavesi site has excellent road connection to the
Chemical Plant, which is about 55 km to the North, via Highway 13.
Keliber Lithium Project
Volume 1 Revision 1 Page 13
The Chemical Plant is in the Kokkola Industrial Park (KIP), which is approximately 6 km
from the centre of the city of Kokkola, with excellent road connections, railway
connections and it is 2 km from the port of Kokkola.
1.6.2 Physiography
The area of Central Ostrobothnia and the area of Keliber’s operations are characterised
by a relatively flat topography. The elevation of the mine sites ranges from between 82.7
m above mean sea level in Rapasaari to 122.0 m above mean sea level in Länttä. There
is no permafrost at these latitudes. Overburden cover at the mine sites ranges in depth
from 0 m to 20 m.
1.6.3 Climate
The climate in Finland is so-called intermediate climate, combining characteristics of both
a maritime and a continental climate. The annual average temperature in Central
Ostrobothnia area is circa plus 3˚C. The coldest time of the year is typically in January or
in February with the average temperature between minus 6 and minus 8˚C. The warmest
time of the year occurs, on average in July, with the average temperature of plus 16˚C.
The annual amount of precipitation in Central Ostrobothnia varies between 500 and
600 mm. In Central Ostrobothnia the number of days with snow cover varies between 110
to 155 days. Snow cover is deepest in late winter, typically in early March being 300 mm
to 400 mm.
1.6.4 Local Resources and Infrastructure
The Central Ostrobothnia province has a population of approximately 69 000 inhabitants
and Kokkola is the largest city of Central Ostrobothnia having around 48 000 inhabitants.
The municipality of Kaustinen has approximately 4 300 inhabitants. There are two
universities in the town of Kokkola and the social amenities normally associated with a
town of this size.
The KIP area has 700 hectares of land zoned for use by the heavy chemical industry.
Keliber’s Chemical Plant is immediately adjacent to several important resources such as
water, steam, electricity, heat, gas (e.g. CO2) and acids (e.g. sulfuric acid), which are all
produced in KIP area.
For international oversea shipments, the Port of Kokkola, is open all year round. It is the
largest port serving the mining industry in Finland and has an All Weather Terminal
(AWT). The Port of Kokkola also has the Deep Port for handling bulk cargoes. There is
regular container service from Kokkola to Antwerp.
The Kaustinen municipality water pipeline (potable water supply) is located immediately
adjacent to the Kalavesi site. The main power line, at 110 kV, reaches the centre of
Kaustinen municipality circa 4.2 km from the Kalavesi plant site.
Central Ostrobothnia is serviced by Kokkola-Pietarsaari airport and by regular Finnair
flights and charter flights. The area is also serviced by mobile phone networks from all the
main Finnish service providers as well as a fibre optic network from a local service
provider.

Keliber Lithium Project
Volume 1 Revision 1 Page 14
1.7 History
1.7.1 Prior Ownership
The first owner of the mining rights to the Länttä, Emmes, Jänislampi, Leviäkangas and
Syväjärvi deposits was "Suomen Mineraali Oy", followed by "Paraisten Kalkkivuori Oy"
and then "Partek Oy" from the early 1960s to the early 1980s. The mining rights to these
areas expired in 1992; between 1992 and 1999 the area was unclaimed. Olle Sirén, with
few private partners, established Keliber working group and claimed first the Länttä
deposit in 1999; later the Emmes and Jänislampi deposits were also claimed. The
Geological Survey of Finland (GTK) held the ownership of the Leviäkangas, Syväjärvi and
Rapasaari deposits in the period from 2003 to 2012.
Currently Keliber owns the mining rights to Länttä and claims/exploration permits to
Rapasaari, Syväjärvi, Outovesi, Emmes and Leviäkangas.
1.7.2 Exploration History and Development Work
Spodumene (LiAlSi2O6) was first identified as a mineral in the late 1950s in the Kaustinen
region. An intensive boulder hunting and drilling campaign was successful with the
discoveries of the Länttä, Syväjärvi, Leviäkangas, Jänislampi and Emmes deposits.
The Keliber working group started evaluation of the area for lithium in 1999. The first
drilling campaign by Keliber was undertaken at Länttä in 2004. In 2010 Keliber extended
its exploration to the whole of the KaustinenKokkola area.
GTK explored the area between 2003 and 2012. As a result, GTK prepared resource
estimates for the old Leviäkangas and Syväjärvi deposits, as well as discovering the new
Rapasaari deposit and some lithium deposit indications for future exploration.
The Länttä deposit was first drilled and investigated in the late 1970s by Partek Oy. The
project was considered uneconomic and Partek Oy relinquished the mining rights in 1992.
Keliber acquired the mining rights for the Länttä deposit in 1999 and started more detailed
exploration, exploitation and environmental studies, partly assisted by GTK. The main
drilling phases were in the periods 2004-2005 and 2011-2013.
The Syväjärvi deposit was discovered based on boulder indications in the 1960s and
investigations were continued in the 1980s. GTK undertook exploration and drilling of the
deposit between 2006 and 2010.
Keliber acquired the exploration rights for the Syväjärvi deposit in 2012 and started an
intensive inventory drilling programme. Two drilling campaigns were carried out, the first
in 2013 and the second in 2014. A few holes were also drilled in 2016 together with six
underground holes at the end of an exploration tunnel. In the autumn of 2017, 8 new
holes were drilled and 8 previously drilled holes were extended at the main and northern
areas of the deposit.
The Rapasaari deposit was discovered in 2009 by GTK, which carried out many
investigations including geological boulder mapping, a geophysical ground survey,
systematic till sampling, analytical and mineralogical studies and drilling.
Keliber acquired the mineral rights for the Rapasaari deposit in 2014 and carried out three
drilling campaigns, from 2014 to 2017, to clarify the deposit structure and to drill sufficient
Keliber Lithium Project
Volume 1 Revision 1 Page 15
holes to upgrade the resources to the indicated category. During the period of May 2017
to March 2018, a total of 33 new holes were drilled and 17 previously drilled holes were
extended at Rapasaari.
The Leviäkangas deposit was discovered in the 1960s and investigations continued into
the 1980s. GTK undertook exploration and drilling of the deposit between 2004 and 2008
then prepared a resource estimate in 2010.
Keliber acquired the exploration rights for the deposit in 2012 and started an inventory
and exploration drilling programme. In total, three drilling campaigns were carried out
between 2012 and 2014.
The Emmes deposit was found in the 1960s and early exploration continued until 1981.
Keliber acquired the exploration rights for the deposit in 2012 after which time it started to
re-log and re-analyse old drill core.
Keliber carried out a small drilling campaign in 2014. In the winter of 2018 extensive
drilling on the ice cover was possible. Four new holes were drilled to verify the previous
resource model and eight holes were drilled to check the extensions of the known
deposit.
The Outovesi deposit was discovered as a result of Keliber’s own exploration in 2010. A
few holes were drilled in 2012 and 2013 to test the extension of the known deposit and
possible new veins.
Keliber has continued exploration drilling in 2018 and 2019. A total of 21 953 meters have
been drilled at Rapasaari, Syväjärvi and Emmes deposits and Päiväneva target after
completion of the mineral resource and ore reserve updates related to the DFS.
1.7.3 Historical Resource Estimates
Resource estimates were prepared after exploration campaigns at various times but
before the work undertaken by GTK and Keliber the estimates were not classified.
1.7.4 Historical Reserve Estimates
No modern reserve estimates were made prior to the work by Keliber.
1.8 Geological Setting and Mineralisation
1.8.1 Regional Geology
The Kaustinen-Kokkola area belongs to the Paleoproterozoic Pohjanmaa Schist Belt,
which forms a 350 km long and 70 km wide arc-shaped belt between the Central Finland
Granite Complex in the east and the Vaasa Migmatite Complex in the west. The most
common rock types within the Pohjanmaa Belt are mica schists and gneisses, which are
intercalated with metavolcanic rocks. The supracrustal rocks have been divided into two
groups, the Evijärvi and the Ylivieska groups. The Kaustinen Lithium pegmatite area is
located at the northern continuation of the Evijärvi group with the metamorphic grade in
the Bothnian Schist Belt varying from low amphibolite facies in the eastern part to high
amphibolite facies towards the Vaasa Granite Complex. The metamorphic peak
conditions took place at about 1.89 to 1.88 Ga in amphibolite facies conditions. The U-Pb
age of manganocolumbite for the Länttä albitespodumene pegmatite is ca 1.79 Ga,
which is considered as the crystallisation age of the pegmatite.

Keliber Lithium Project
Volume 1 Revision 1 Page 16
Locations of known lithium and REE pegmatites in Finland are shown in Figure 1-4.
Figure 1-4: Locations of known lithium and REE pegmatites in Finland
1.8.2 Local Geology
More than ten separate pegmatite occurrences are known in the Kaustinen-Kokkola-
Kruunupyy area, however, none of the spodumene pegmatites are exposed at surface,
being covered by quaternary sediments, mainly till. The indications, quality and contact
relationships can often be seen only in erratic pegmatite boulders or in drill core.
Typically, the Paleoproterozoic country rocks which host the pegmatite veins are mica
schist with coarse grained metagreywackes, or intermediate or mafic metavolcanic rocks.
Sedimentary mica schist formations include some graphitic and sulphidic horizons,
varying from graphite mica schist to black schist. Both the metasedimentary and
metavolcanic rocks contain narrow skarnated inclusions or layers. Massive granite or
other intrusive bodies are not found close to the discovered lithium pegmatites.
Pegmatite veins or vein swarms are usually parallel to bedding/schistosity but can also
cross cut the country rock bedding/schistosity features. In cutting vein structures,

Keliber Lithium Project
Volume 1 Revision 1 Page 17
spodumene pegmatite is more homogenous, lacking the smaller veins. Pegmatite veins
also seem to be bundled to the regional folding structure which has been identified
aerially but is yet to be understood in detail.
Locations of the pegmatite veins in the Kaustinen-Kokkola-Kruunupyy area are shown in
Figure 1-5.
Figure 1-5: Geology and location of the main lithium pegmatite deposits and indications in the Kaustinen-Kokkola-Kruunupyy area
1.8.3 Property Geology
The property geology is based largely on the GTK exploration results because Keliber
has only carried out detailed geological, geochemical, mineralogical and geophysical
investigations on limited areas.
At Länttä, the bedrock is covered by basal till, varying in thickness from 1 m to about 7 m
with the pegmatite veins hosted by metavolcanic intermediate rocks, metagreywacke
schists and plagioclase porphyrite. The spodumene pegmatite consists of two veins
parallel to the host bedding and with a maximum thickness of the two veins of about
10 m. The total length of the veins is about 400 m based on drilling results from 2004 and
2005. In 2010 the spodumene pegmatite vein (ore) was exposed to enable bulk sampling
for metallurgical testing.
At Syväjärvi, bedrock is covered by sandy till with a mean thickness of about 5 m with the
pegmatite veins intruding and cross cutting host mica schist and metagreywacke in an
anticlinal structure. Metavolcanic rocks include metatuff, lapille metatuff, meta-
agglomerate and plagioclase porphyrite. The thickest drilled pegmatite intercepts are 20 -
Keliber Lithium Project
Volume 1 Revision 1 Page 18
30 m in true thickness. The pegmatite veins at Syväjärvi dip under Lake Syväjärvi and a
71 m tunnel was driven into the deposit from the lake edge to enable bulk sampling for
metallurgical testing.
At Rapasaari, the bedrock is covered by peat and till, varying in vertical thickness from
3 m to almost 20 m with the pegmatite veins intruding mica schist and metagreywackes in
a synclinal system. Metavolcanic rocks occur in the central area between Rapasaari East
and West and include metatuff or metatuffite and small zones of plagioclase porphyrite.
The thickest veins have a true thickness close to 20 m.
At Outovesi, the bedrock is covered by till with a mean thickness of 10 m with the
pegmatite veins being hosted by mica schist and metagreywacke. At Outovesi the length
of the deposit is almost 400 m. The thickest veins have a true thickness close to 13 m.
At Leviäkangas, the bedrock is covered by till with a mean thickness of 7 m with the
pegmatite veins being hosted by mica schist and metagreywacke. The main deposit is
about 250 m long and the maximum thickness is close to 15 m.
At Emmes, the bedrock is covered by till with a mean thickness of 10 m with the
pegmatite veins being hosted by mica schist and metagreywacke. The pegmatite vein is
about 400 m long and the maximum thickness is about 20 m. Drilled pegmatite
intersections reach over 28 m with the true thickness being 70-90% of the drilled
intersection.
1.8.4 Mineralisation
Pegmatites in this region have been classified into the albitespodumene subgroup of the
LCT (Li, Cs, Ta) pegmatite family. These Paleoproterozoic 1.79 Ga (U-Pb columbite age)
albite-spodumene pegmatites crosscut the Svecofennian 1.95 to 1.88 Ga supracrustal
rocks, which are composed of mica schists, metagreywackes and volcano-related
metasediments with some intercalations of sulphide-bearing black schists. The LCT-
pegmatites are younger than the 1.89 to 1.88 Ga peak of regional metamorphism. Large
pegmatite granites in the Kaustinen area have been interpreted as a potential source of
the albitespodumene pegmatites.
1.8.5 Mineralogy and Geometallurgy
The spodumene pegmatites of the Kaustinen area resemble each other
petrographically, mineralogically and chemically. They are typically coarse grained,
light coloured and mineralogically similar, having albite (37-41 wt%), quartz (26-
28 wt%), K-feldspar (10-16 wt%), spodumene (10-15 wt%) and muscovite (6-7 wt%)
as the main minerals and generally in this quantitative order. Pegmatites show small
variations in the distribution of the main minerals, but well-developed internal
zonation is mainly lacking. The only systematic texture observed is the perpendicular
orientation of spodumene crystals to the pegmatite vein contacts.
Studies show that the chemical, mineralogical and geometallurgical differences between
the six deposits are small. Currently, spodumene (LiAlSi2O6) is the only economic mineral
identified in the pegmatite veins; other lithium minerals for example petalite, cookeite,
montebrasite and sicklerite are found only as trace quantities. Columbite-tantalite is an
important accessory mineral having potentially some economic significance. The Li2O
content of spodumene is 7.0%, 7.21% and 7.22% for Syväjärvi, Rapasaari and
Keliber Lithium Project
Volume 1 Revision 1 Page 19
Leviäkangas, respectively. The main impurity in spodumene is iron, FeO content of the
mineral varying in the deposits between 0.3 and 1.2%.
Variation in the grindability between the deposits is small and geometallurgical studies
show that the hard component in the ores is spodumene and therefore the specific
grinding energy shows positive correlation with the lithium grade. In flotation response
deposits show small differences mainly due to variation in the lithium head grade.
Variation in the ore texture, spodumene grain size, colour or alteration does not have
impact on processability. The wall rock dilution has been found to have negative impact
for flotation lowering the concentrate grade. In this sense Syväjärvi, where the wall rock
dilution is plagioclase porphyrite, has proven to be slightly easier to process than other
deposits hosted by mica schist. Minimising the wall rock in flotation is important and
therefore selective mining and optical sorting will play a significant role in controlling the
flotation feed.
1.9 Exploration
1.9.1 Background
Throughout the exploration history in Central Ostrobothnia, pegmatite boulder hunting
and mapping have been the most effective methods of discovery. During exploration this
area was investigated by magnetic surveys and/or till geochemistry sampling before
drilling. Across the area lithogeochemistry is an important exploration method as a
pegmatite deposit often has a Li-Rb-Cs halo. The halo can be up to ten times larger than
the vein and is therefore easier to discover.
Most of the deposits were discovered in the 1960s using boulder hunting and tracing
boulder fans to the North-West that is the regional direction of glacier drifting.
Extensive exploration by GTK and Keliber has resulted in the discovery of several drilled
spodumene pegmatite veins and even more boulder indications of yet undiscovered
deposits. Large areas are covered by peat, sand or clay without boulders. These areas
are planned to be explored in the future using litho- or till geochemistry with detailed
geophysics.
1.9.2 Geological, Geochemical and Geophysical Surveys
All modern geodata has been surveyed using hand-held GPS or precision-GPS
equipment. The locations of historical data are based on topographic maps and the
surveyed field lines. The coordinate system used is the Finnish National coordinates
either KKJ2 or KKJ3.
Since very few outcrops exist in the exploration area geological mapping is limited to
boulder mapping and logging.
Large geochemical anomalies were discovered by GTK re-analysing the old till samples
collected in the Kaustinen-Kokkola-Kruunupyy area in the 1970s and 1980s. GTK also
sampled till on a local scale in the Rapasaari area which led to the discovery of that
deposit.
The whole area is covered by low-altitude magnetic and electro-magnetic measurements,
surveyed using aircraft by GTK, which enables structural interpretations. Magnetic data
Keliber Lithium Project
Volume 1 Revision 1 Page 20
have been utilised based on the non-magnetic character of pegmatites and the magnetic
nature of the country rocks.
For geotechnical studies, rock quality designation (RQD) is measured systematically for
all the drill holes during core logging. Based on orientated core bedding, jointing and
pegmatite contacts are defined in most of the drilled holes.
1.9.3 Endowment / Exploration Potential
Keliber has many untested target areas with boulder indications. Some target areas have
previous drilling indications of spodumene pegmatite, together with a large number of
boulders. The three clear targets of this type are Päiväneva, Heikinkangas and extension
of Leviäkangas. Since June 2018 Keliber has continued exploration drilling near the
Syväjärvi and Rapasaari deposits and also at Päiväneva. A total of 16.2 km of new
drilling has returned 87 new spodumene ore intercepts. The update of Syväjärvi mineral
resource estimation is now going on, and an update of Rapasaari will be started soon.
Geochemical lithium indications in till extend in all direction from the central deposit area.
There are many spodumene bearing boulders, both new and earlier discovered and the
bedrock source of many spodumene pegmatite boulders is still undiscovered. These
together with regional geological and air-borne geophysical data give an excellent base
for new economic discoveries which would enable the life of mine to be extended and
prolong the production of lithium hydroxide from Keliber’s concentrate.
1.10 Drilling
1.10.1 Historical Drilling
The first drilling programmes were undertaken in 1961 using small drill rigs and the core
diameter was 22 mm. From 1966 to 1981 a larger core diameter of 32 mm was used. The
core diameter in the drilling programmes by GTK from 2004 to 2012 is 42 mm. The drilling
programmes of Keliber in all the active deposits have been executed using similar core
sizes and drilling practices as described below. GTK has operated most of the non-
Keliber drilling in the Syväjärvi, Rapasaari and Leviäkangas deposits.
1.10.2 Drilling Methods
Keliber employed a Finnish drilling company for all its drilling. The rig type was the
wireline Onram 1000 and the casing size used was WL66 with a drill core diameter of
50.7 mm. A normal run (length of the core sample tube) is three meters.
An iron casing rod was left in the completed holes, which were capped using an
aluminium cap with the hole indication. These casings extend through the overburden into
the bedrock so that it is possible to extend the hole and undertake in-hole surveys.
The common drilling grid is 40 by 40 m, which is adequate for classification of resources
to the indicated category. Drilling was previously extended vertically mainly to a depth of
approximately 100 m, targeting only the open pit mineable resources. In 2017-2018, a few
deeper holes (250-370 m) were drilled at Rapasaari. Currently, the deposits are still open
at depth and the deepest intersection is at a vertical level of 220 meters.
1.10.3 Geological Logging
Drill cores are logged at the Keliber’s facilities in Kaustinen following the guidelines of
Keliber’s drill core logging manual.
Keliber Lithium Project
Volume 1 Revision 1 Page 21
During mineralogical logging attention was focused on spodumene by recording crystal
size, orientation, colour and estimated quantity. RQD was also measured. In the latest
drilling phases at Rapasaari in 2016-2018, the orientation of drill core was measured for
each three-meter run. Orientation of pegmatite contacts, general bedding and jointing
were measured when possible.
1.10.4 Collar Surveys
Collar coordinates were measured using was a Topcon Hiper Pro GL RTK and the
coordinate system used was the Finnish KKJ2 or KKJ3. The accuracy of the GPS-
measuring system is 2 to 3 cm. In 2016-2017, for drilling programmes in Rapasaari the
collars and start azimuths were surveyed by Ramboll Oy with a Trimble R 10 instrument.
Since September 2017, collar coordinates have been surveyed by Keliber staff with its
own precision-GPS, Leica GS16.
1.10.5 Downhole Surveys
The start azimuth was measured together with collar surveys by setting a rod with two
hanging strings into the drill hole rod, setting an orientation stick to 15 to 20 m by sighting
with the strings, measuring both collar and orientation stick coordinates and to the end
calculating the hole azimuth. Bending of the holes in short holes is usually insignificant
and most of the holes are orientated perpendicular to the vein deposit. The hole dip in the
shallow holes (less than 100 m) was measured using a DeviDip instrument. The
measuring interval of the dip is 10 m. In longer holes both the in-hole azimuth and dip
were surveyed using the DeviFlex instrument at intervals of 4 m.
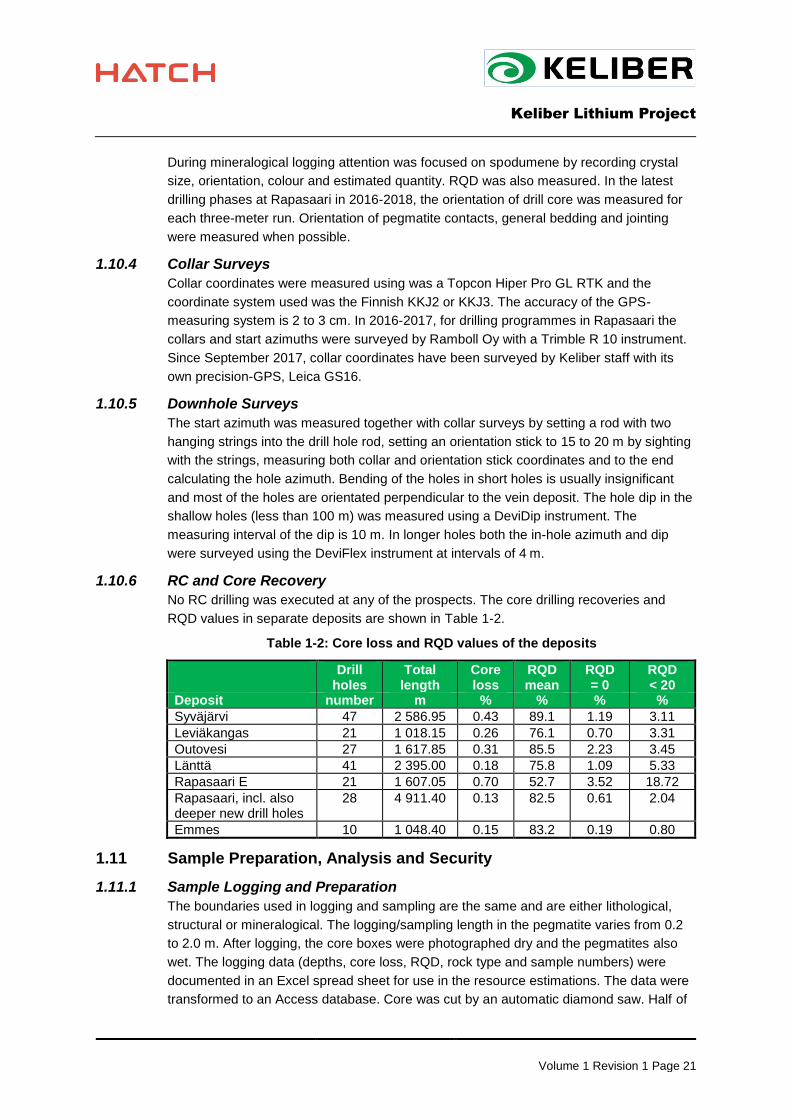
1.10.6 RC and Core Recovery
No RC drilling was executed at any of the prospects. The core drilling recoveries and
RQD values in separate deposits are shown in Table 1-2.
Table 1-2: Core loss and RQD values of the deposits
Drill Total Core RQD RQD RQD holes length loss mean = 0 < 20 Deposit number m % % % %
Syväjärvi 47 2 586.95 0.43 89.1 1.19 3.11
Leviäkangas 21 1 018.15 0.26 76.1 0.70 3.31
Outovesi 27 1 617.85 0.31 85.5 2.23 3.45
Länttä 41 2 395.00 0.18 75.8 1.09 5.33
Rapasaari E 21 1 607.05 0.70 52.7 3.52 18.72
Rapasaari, incl. also deeper new drill holes
28 4 911.40 0.13 82.5 0.61 2.04
Emmes 10 1 048.40 0.15 83.2 0.19 0.80
1.11 Sample Preparation, Analysis and Security
1.11.1 Sample Logging and Preparation
The boundaries used in logging and sampling are the same and are either lithological,
structural or mineralogical. The logging/sampling length in the pegmatite varies from 0.2
to 2.0 m. After logging, the core boxes were photographed dry and the pegmatites also
wet. The logging data (depths, core loss, RQD, rock type and sample numbers) were
documented in an Excel spread sheet for use in the resource estimations. The data were
transformed to an Access database. Core was cut by an automatic diamond saw. Half of
Keliber Lithium Project
Volume 1 Revision 1 Page 22
the core was subject to the following routine; dried, weighed, measured for specific gravity
(SG), dried again, packed into plastic bags and sent to the laboratory for preparation and
analysis. Keliber has updated quality manuals for drill core logging and cutting.
1.11.2 Quality Assurance and Quality Control Procedures (QA/QC)
The logging and sampling processes were subject to essential standardised QAQC
protocols. For each drilling campaign a separate QAQC document is compiled to ensure
accuracy of data.
The drill core to be used for analysis is cut by a diamond saw. A correlation is expected
between the sample length and weight, considering small differences in SG and broken,
non- homogenous core with possible core loss. Most of the pegmatite core is unbroken
with 100 % RQD and no loss of core recovery.
Accuracy and precision have been tested in the Keliber drilling programmes by using
every tenth sample for testing validation. A comprehensive system has been developed
by Keliber using replicate and duplicate samples to give good quantitative confidence to
the analytical results.
1.11.3 Core Lengths and Weight Checks
Sample length and weight are plotted on regression plots to check for any outliers. Some
variation exists in the regression plots but there are no clear indications, for example, of
samples being mixed.
1.11.4 Analytical Methods and Laboratories
Two separate laboratories (ALS and Labtium) were used for the analysis of samples
during the period from 2010 to 2018. The procedures for sample preparation and analysis
are specified and both laboratories have been subjected to checks and tests. In 2013
checks showed that results from ALS were 10-15% lower, based on certified reference
material, due to difference in analysis method. Labtium results have been consistently
good when measured against certified reference samples. Therefore, the mineralised
pegmatite samples were re-analysed at Labtium.
All the samples used in the resource estimation have been analysed by the same and
proven analytical method of Labtium. In some cases, details of the method of analysis are
not known and therefore the results from the analysis of these samples have not been
used in the resource estimation.
1.11.5 Analytical Standards and Blanks
In order to test the laboratory for analysis accuracy standard samples were prepared
using blasted and fresh spodumene ore samples from the Länttä deposit. The blank
sample is from homogenous Lumppio granite. The standard samples were prepared and
certified by Labtium.
1.11.6 Duplicates and Re-Analysis
Typically, the pegmatite contains 10-20% spodumene and it is therefore anticipated that
the nugget effect in pulp samples should be negligible. The spodumene crystal size is
large compared with the core size and for this reason precision was tested using core
replicates. The primary samples were half of the core and the replicate samples were an
additional quarter of the core. The laboratory re-analysed the pulp samples and the
Keliber Lithium Project
Volume 1 Revision 1 Page 23
results show that the mean grades are close to each other and to pulp duplicates. The
mean absolute differences of core replicates are much higher (0.14% Li2O) than that of
the of pulp duplicates (0.03% Li2O).
1.11.7 Specific Gravity Determination
Specific Gravity (SG) was measured using the classical immersion method. Most of
unbroken half core pieces were weighed and the weights varied between 0.5 and 4.0 kg
depending on the core length of the sample. Two SG standards were used, a
sedimentary rock core standard (SG 2.822 ± 0.003 kg/dm3) and an aluminium bar (SG
2.715 ± 0.003 kg/dm3. The standards measured consistently inside the variation limits
throughout the testing.
Specific gravity (SG) of spodumene pegmatites varies mainly depending on the
spodumene content. Depending on the ore grade (usually 10-20% spodumene) the SG
varies between 2.65 and 2.80 kg/dm3. Generally, the pegmatites are nonporous and
unbroken and therefore the wet and dry SG are identical.
The test work undertaken indicated at a Li2O grade of 7% (pure spodumene) the SG
would be about 3.15 kg/dm3, which is the general SG of spodumene. The variation of SG
in the spodumene pegmatites is small. It is therefore the case that the SG values used for
the resource estimates are robust.
1.12 Data Verification
1.12.1 Historical Data
Keliber has carried out several checks on historical data, including re-logging, re-
assaying, database validations and collar location verifications. Some of the historical drill
holes, whose collar locations could not be verified are not taken account in mineral
resource estimations. However, historical drill holes of the Emmes deposit from the1960s
which have unverified collar location have been used in mineral resource calculations
because details were validated by Keliber in 2014 and 2018.
Keliber has re-logged historical drill cores according to the company logging procedures
and manual. The historical drill cores are also partly re-assayed from Länttä deposit by
GTK in 2001 and from Emmes deposit by Keliber in 2014.
1.12.2 Data Verification by the Competent Person (CP)
During site visits by the Competent Persons several collar positions, both Keliber and pre-
Keliber, were field checked using a handheld GPS. These collar locations were found to
match the database locations within the accuracy of the GPS instrument.
Keliber’s QAQC procedures which have been followed since 2010 were verified and
considered to be adequate for project development.
The integrity of the digital drill core data used in resource estimation was verified. No
discrepancies or data entry errors were observed in the data records.
The CP has also verified the pegmatite vein type, style of spodumene mineralisation and
the contact features of spodumene pegmatite against the country rock through logging of
drill core and observations at the available outcrops of mineralisation in the Länttä test pit
Keliber Lithium Project
Volume 1 Revision 1 Page 24
and in the sampling tunnel of Syväjärvi. The geological mapping results support the
deposit modelling and resource estimation.
In addition, the database was audited using Surpac software; no overlapping or missing
sample errors in intervals used for grade estimations were found.
It was concluded that collar, survey, lithology and assay tables of drill hole databases in
each deposit are free of errors and are adequate for resource estimations
1.13 Mineral Processing and Metallurgical Testing
1.13.1 Introduction
There have been several stages of metallurgical test programmes undertaken to develop
a process for the beneficiation of the spodumene pegmatite deposits of Central
Ostrobothnia and the subsequent processing of the spodumene concentrate, initially, to
produce battery grade lithium carbonate as the final, saleable product. However, in late
2018 – early 2019 test work was undertaken to produce battery grade lithium hydroxide
as the final product. Early work was pre-2014 with more recent work undertaken during
the Pre-feasibility study 2014 to 2016 and for the Definitive Feasibility study 2016 to 2019.
Both laboratory and pilot plant tests have been completed since 2016.
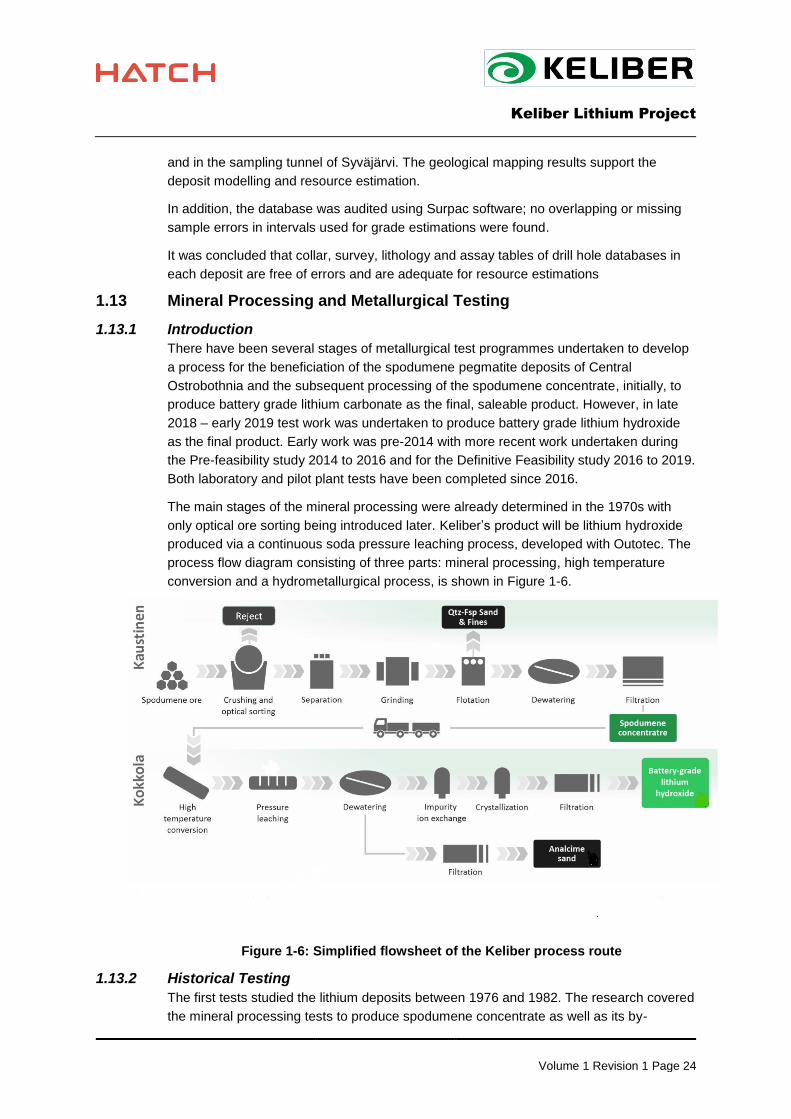
The main stages of the mineral processing were already determined in the 1970s with
only optical ore sorting being introduced later. Keliber’s product will be lithium hydroxide
produced via a continuous soda pressure leaching process, developed with Outotec. The
process flow diagram consisting of three parts: mineral processing, high temperature
conversion and a hydrometallurgical process, is shown in Figure 1-6.
Figure 1-6: Simplified flowsheet of the Keliber process route
1.13.2 Historical Testing
The first tests studied the lithium deposits between 1976 and 1982. The research covered
the mineral processing tests to produce spodumene concentrate as well as its by-
Keliber Lithium Project
Volume 1 Revision 1 Page 25
products: quartz, feldspar and mica concentrates. The work undertaken was adequate to
enable an investment decision to be made but the project was not pursued owing to the
low market demand at that time.
Keliber restarted metallurgical testing in 2003 which led to the preliminary engineering for
a spodumene concentrator and a lithium carbonate production plant. The mineral
processing included two-stage grinding, gravity separation, de-sliming, pre-flotation,
spodumene flotation and dewatering. Conversion from alpha to beta-spodumene was
undertaken in a rotary kiln and the hydrometallurgical process included pressure leaching
of beta-spodumene in a soda environment, solution purification with ion exchange, and
precipitation of lithium carbonate. Subsequent changes to the process route have been
relatively slight.
1.13.3 Mineral Processing for Prefeasibility Study (PFS) & Definitive Feasibility
Study (DFS)
The purpose of the mineral processing circuit is to produce spodumene concentrate for
the downstream process. Optimisation of the full production chain and the capability of
the chemical plant to treat concentrates of various grades has resulted in Keliber’s design
value for concentrate grade being 4.5% Li2O; however, the test work has been done for a
range of 4.0-6.0% Li2O.
In the PFS, Länttä samples were processed to produce spodumene concentrates which
were then treated to convert alpha spodumene to beta spodumene and used for
hydrometallurgical testing. The Länttä samples were processed in a pilot plant test
comprising dense media separation (DMS), rod mill grinding with gravity separation
followed by laboratory scale flotation. The best result achieved was a combined
concentrate grading 5.03% Li2O with a lithium recovery of 82.3%.
The processing of a Syväjärvi sample was also included in the PFS which confirmed that
it could be treated using a similar flowsheet as that for the Länttä sample, although higher
recoveries were realised for a concentrate with a Li2O grade of 4.5%. A further Syväjärvi
sample was included in the DFS tests with the full Keliber process being tested at pilot
scale. As Syväjärvi showed good behaviour in flotation and DMS produced elevated P2O5
concentration in the spodumene concentrate, which is undesirable, DMS was not
included in the pilot process. In this test work it was found that the biggest lithium losses
were in the primary de-sliming and the spodumene rougher tails, totalling 9 to 10%.
An optical ore sorting test programme was carried out which utilised a colour line scan
CCD camera and a near-infrared scanner. The technique was found to be practically
perfect in removing black plagioclase porphyrite waste rock from the feed with only 3% of
the Li2O being lost.
To determine the optimum flotation parameters for both Syväjärvi and Länttä ores, further
laboratory tests were carried out at the Geological Survey of Finland (GTK). Work was
carried out to attempt to recover spodumene from slimes by flotation, but the results were
poor.
The DFS also included a geometallurgical study of Syväjärvi, Länttä, Rapasaari and
Emmes deposits to determine the differences between the ore bodies and variation within
the deposits. The grindability of the samples was found to be a function of the spodumene

Keliber Lithium Project
Volume 1 Revision 1 Page 26
grade but no difference was found between the ores. The flotation performance was also
dependent upon the spodumene grade and inversely dependent upon wall rock dilution.
The flotation tests revealed a significant difference between the deposits with Syväjärvi
showing the best performance with a recovery of 92% followed by Länttä and Rapasaari.
Rapasaari is the biggest Keliber ore body and subsequent mineral processing testing in
2017-2018 showed that the recovery level was close to that for Syväjärvi.
Emmes ore showed a similar flotation response as Syväjärvi; with a 91.8% lithium
recovery at a 4.5% Li2O concentrate grade and 91.0% at a 5.0% Li2O grade.
In November 2018 a flotation test programme was started at GTK using ore from
Rapasaari and Outovesi. The work includes ore variability flotation tests and locked-cycle
tests. In addition, Bond rod and ball mill tests are to be undertaken to determine work
index values. The programme is ongoing and final results are not yet available.
1.13.4 Optical Ore Sorting in 2018 (DFS)
An ore sorting test programme was completed in the Binder+Co sorting test facility in
Gleisdorf, Austria. The focus of the tests was to remove black plagioclase porphyrite
waste rock from the plant feed. Sorting tests were conducted in November 2018 using of
Syväjärvi RoM ore (4 to 35 mm in size) spodumene rich material and black waste rock.
Ore sorting was found to be effective in removing black waste rock from the artificial
composite ore feed. Visually, the black rock removal was found to be almost perfect,
verifying the earlier tests by Tomra in 2016.
1.13.5 Conversion
PFS testing established that both the Länttä and Syväjärvi ores could be processed to
convert alpha-spodumene to leachable beta-spodumene. Further tests at the Metso
facility in Danville, PA, USA were conducted for the DFS over a temperature range of
1000 °C to 1075 °C; X-ray diffraction and Raman spectroscopy analyses confirmed that
over 95% alpha-to-beta conversion had taken place.
Subsequently further pilot plant tests were undertaken in a directly fired rotary-kiln at
FLSmidth Inc. Pyromet Technology testing facilities, Bethlehem, PA, USA. The sample
used was concentrate produced in a mineral processing pilot test at GTK. By holding the
concentrate at 1 100°C for 30 minutes a conversion degree of 97.5% was achieved.
1.13.6 Hydrometallurgical Processing To Produce Lithium Carbonate
The PFS hydrometallurgical testing began with the Länttä concentrate and incorporated
all the major process stages from the spodumene concentrate conversion to lithium
carbonate production. The samples were prepared to have an average grade of 4.5%
Li2O. The lithium yields in the leaching and bi-carbonation tests were low with 86% being
the best laboratory result. Higher lithium yields were, however, obtained in a pilot-plant
testing with the autoclaves able to deliver longer mixing times during the heating and
cooling periods. Decreasing the particle size of the beta-spodumene resulted in an
improvement in the lithium leaching. This delivered a lithium yield of 91%; lithium losses
were from the coarser particles.
Keliber Lithium Project
Volume 1 Revision 1 Page 27
Ion exchange was used to remove metal impurities from the leach solution to realise a
crystallised Li2CO3 product containing 17.3 to 18.6 weight-% lithium; the main impurities
were phosphorus and silica.
The PFS also tested Syväjärvi samples and the realised lithium leaching yield was 95.6%.
The tests were repeated in the DFS when lithium yields up to 95% lithium were achieved
in batch tests and up to 87% in the pilot plant. Ion exchange was again employed to
remove the metal impurities so that the crystallised Li2CO3 product contained 17.3 to 19.0
weight-% lithium.
The final test programme comprised laboratory testing of conversion, soda leaching,
bi-carbonation, ion exchange and crystallisation of lithium carbonate from Syväjärvi and
Rapasaari concentrates. Lithium yields of 90-96% for Syväjärvi and 88-95% for Rapasaari
concentrate were obtained. Lithium carbonate was crystallised from Syväjärvi samples
with a grade of over 99.5% without ion exchange being employed. The ion exchange,
however, decreased the calcium level from 0.02 – 0.05% to less than 0.01%.
1.13.7 Hydrometallurgical Processing to Produce Lithium Hydroxide
In late 2018 and early 2019 a test work programme to produce lithium hydroxide from
converted spodumene concentrate by soda pressure leaching was undertaken at
Outotec’s facilities in Finland. The changes in the process are relatively small compared
to carbonate production and are limited only to the hydrometallurgial part, thus no
changes are required in the mineral processing and conversion stages. In the
hydrometallurgial process to produce lithium hydroxide the soda pressure leaching stage
is similar to that for lithium carbonate production. The concentration of lithium in hydroxide
solution is lower compared with carbonate and therefore tanks and pipes need to be
somewhat bigger.
Initially batch tests were carried out for the soda leaching and the LiOH conversion
process step. The main objectives of these tests were to produce information for the
planning of a pilot operation and investigate the effects of many parameters in both soda
leaching and in LiOH conversion. Semi- continuous bench pilot scale tests were then
undertaken to operate the lithium hydroxide production process. This enabled data for
engineering and process design to be obtained and the production of samples of lithium
hydroxide product and analcime residue. These samples would be used for preliminary
marketing purposes.
This test programme produced good results with an 88% lithium extraction in lithium
hydroxide conversion.
1.14 Mineral Resource Estimate
The Mineral Resources have been estimated and reported in accordance with the
guidelines of the JORC Code 2012 by the independent consultants Markku Meriläinen
(MAusIMM) and Pekka Loven (MAusIMM, CP).
1.14.1 Drill Hole Database and Data used for Resource Modelling The data used for the geological modelling and grade estimation is summarised below in Table 1-3.

Keliber Lithium Project
Volume 1 Revision 1 Page 28
Table 1-3: Summary of drilling data used in the resource estimate
Deposit No. of Drill
Holes
Drill Spacing
(m)
Total Meters
No. of Assayed Intervals
Analyses
Syväjärvi 101 40 x 40 9,552.75 1,176 Li2O, Nb, Ta, BeO, Ta2O5,
Nb2O5
Rapasaari 166 40 x 40 23,463 7,897 Li2O and BeO
Länttä 105 30 x 30 to
50 x 50 8,733.38 821
Li2O, Al2O3, SiO2, K2O, CaO, Fe2O3, Rb, Nb, Ta,
BeO, Ta2O5
Outovesi 24
40 x 40 to 40 x 60
1751.7 476 Li2O, BeO
Emmes 54 30 x 40 to
40 x 60 6283.79 1,167 Li2O, BeO
Prior to the grade estimation, all data was validated using Surpac software for missing
and overlapping samples. No errors were discovered when creating the drill hole
database.
The coordinate system used was the national FIN KKJ2. The topographic and bedrock
surfaces were prepared using surveyed information (such as drill hole collar and other),
combined to national topographic data.
1.14.2 Orebody Model
For the orebody modelling, a cut-off grade of 0.5% Li2O was used in all cases with the
wireframes created acting as hard boundaries during the estimation of grade. The
orebody models created were used for coding the drill hole file into separate estimation
domains.
At Syväjärvi, the resource outlines were constructed on east-west cross sections at
intervals of 30 - 40 m. In cross section, the distance between the separate drill holes
varies from 10 m to 30 m in the main part of the largest spodumene pegmatite body and
from 20 m to 50 m in the more marginal zones of the main spodumene pegmatite body
and in the three smaller parallel veins.
One dominant spodumene pegmatite vein (lens like in a cross section) and four smaller
veins subparallel to the main vein were constructed. Only the spodumene pegmatite
veins, with dimensions that were sufficient for mining, with contacts reported to cut the
host rock layering in the specific angle, which prove it to be approximately in parallel
position with the main body, were modelled.
At the Rapasaari prospect, a total of 24 spodumene pegmatite veins were modeled using
both lithological and assay information. The direction of continuity is based on geological
logging information including the measured orientations of vein contacts. The resource
outlines were constructed based on the lithological and assayed intervals on cross
sections that were spaced at 20 - 50 m according to the drill hole spacing.
At Rapasaari Main, the modelled veins strike NNW-SSE and dip 40 - 60 degrees to the
west. The modelled veins strike NNE-SSW and E-W sub vertically at Rapasaari West and

Keliber Lithium Project
Volume 1 Revision 1 Page 29
North, respectively. Most of the modelled veins have intruded parallel to the primary
bedding of the supracrustal host rock.
At Länttä, the resource outlines were constructed on cross sections at drill hole profile
spacing of 5 - 50 m. Outlines of digitised veins are based on the lithological and assayed
intervals. Three separate, parallel veins, with dimensions sufficient for mining, were
modeled.
At Outovesi, the resource outlines were constructed on cross sections at intervals of
40 m based on the lithological and assayed intervals. The 3D model was continued
approximately 15 m from the last drilled cross section in the northeastern and
southwestern ends of the deposit. The model was continued at depth approximately 5 -
15 m from the lowermost drill hole information. One uniform spodumene pegmatite vein,
which dimensions were sufficient for mining, was modelled.
At Emmes, the resource outlines were constructed on cross sections at intervals of 20 -
40 m based on the lithological and assayed intervals. In some rare occasions it was
necessary to include material below the cu-toff to maintain the continuity of the structure.
Only one vein, which dimensions were sufficient for mining, was modelled.
1.14.3 Li2O_mod
Originally, a nominal cut-off grade of 0.5% Li2O was used for the unaltered spodumene
pegmatite vein to separate the recoverable resource from unrecoverable Li2O up to 0.2 -
0.4% found in the hanging wall and footwall contacts along with internal waste zones.
During the resource estimation, this unrecoverable Li2O was removed by creating so
called modified assay record (Li2O_mod), in which more than 50% waste rock type
containing assay intervals were marked as -1 (missing assay). During the resource
estimation, all assay intervals marked as -1 were treated as 0% Li2O.
1.14.4 Basic Statistics
A statistical study has been carried out at each deposit following the creation of the
spodumene orebody wireframes.
1.14.5 Compositing
Two sets of composites were created: “Li2O_diluted” where missing samples (waste
intervals) were calculated at zero grade and “Li2O_insitu” where missing samples were
totally ignored. Insitu grade represents the Li2O grade of spodumene pegmatite without
waste. The diluted grade represents the grade of mineral resource.
Compositing of the drill hole samples is carried out to standardise the database for the
further use in the grade estimation. This step eliminates any effects relating to the sample
length, which may exist in the data. The composite length chosen was based on the
dominant sample length at each deposit with Table 1-4 showing the composite length
selected.

Keliber Lithium Project
Volume 1 Revision 1 Page 30
Table 1-4: Composite Length
Deposit Composite Length
Syväjärvi 2.0 m
Rapasaari 1.5 m
Länttä 2.0 m
Outovesi 2.0 m
Emmes 2.0 m
1.14.6 Block Model
Block models were created using the orebody wireframes with the block model framework
being shown in Table 1-5 for each deposit.
Table 1-5: Block Model Framework
Deposit YXZ Minimum YXZ Maximum YXZ Max
Block Size YXZ Min
Block Size Rotation
Syväjärvi 7061900, 2490250, -90 7062700, 2490700, 90 10,10,5 5,5,2.5 -
Rapasaari 7060400, 2491700, -200 7061400, 2492800, 100 10,5,5 5,5,5 -
Länttä 7057700, 2506900, -100 7058400, 2507450, 125 10,5,5 10,5,5 45° Y
Outovesi 7066600, 3338350, -25 7067350, 3338650, 95 10,5,5 10,5,5 30° Y
Emmes 7063200, 2479500, -150 7063815, 2479900, 50 15,10,10 7.5,5,5 -45° Y
1.14.7 Grade Interpolation and Estimation
For all deposits, an Inverse Distance (IDW) cubed estimate has been used to interpolate
Li2O assays into the block mode created. Each domain was estimated separately using
the composites belonging to the respective orebody domains. The cubed IDW method
was chosen because some of the internal waste fragments have a random direction and
random length and it was therefore required to give a higher weight to the nearest
samples.
The interpolation parameters used in the IDW estimate is shown in Table 1-6.
Table 1-6: Interpolation Parameters
Deposit Pass 1,2,3 Search
Radii Min No. of Samples
Max No. of Samples
Ellipse Orientation (YXZ)
Syväjärvi 40m, 80m, - 3 15 315, -18, 0
Rapasaari 40m, 80m, - 3 15 Variable
Länttä 40m, 80m, - 3 15 45, 0, -65
Outovesi 40m, 80m, 160m 3 15 30, 0, 60
Emmes 40m, 80m, - 3 15 125, 0, -60

Keliber Lithium Project
Volume 1 Revision 1 Page 31
A geostatistical analysis for the Syväjärvi lithium deposit was prepared by Payne
Geological Services Pty Ltd. The parameters derived from the analysis were then used
for grade estimation of the deposit using inverse distance squared (ID2), inverse distance
cubed (ID3) and ordinary kriging (OK) interpolation methods.
Kriging neighbourhood analysis (KNA) results supported the block size and interpolation
parameters used in DFS resource model. The three interpolation algorithms (ID2, ID3,
OK) were used to estimate block grades within the resource block model. The results
were largely identical for the global estimates and at the 0.5% Li2O reporting cut-off.
1.14.8 Block Model Validation
The grade estimate has been validated through visual and statistical methods. The visual
validation of input composite grade and output block model grade did not show any
discrepancy.
Table 1-7 shows a comparison of the mean composite Li2O grades against the estimated
block model Li2O grades. As shown, only a small discrepancy is observed.
Table 1-7: Block Model vs Composite Li2O grade
Deposit Mean Li2O Composite Grade (%) Mean Li2O Block Model Grade (%)
Syväjärvi 1.20 1.22
Rapasaari 1.12 1.12
Länttä 1.05 1.04
Outovesi 1.39 1.43
Emmes 1.18 1.16
SWATH plots were also created for each deposit with a good correlation shown between
the composite grades and estimated assay grades for Li2O.
1.14.9 Density
Average density values were applied to the estimated resource models. Table 1-8 shows
the density values applied and number of samples tested. The density has been used to
determine the tonnage of each block and the deposit as a whole.
Table 1-8: Density values assigned to the block model
Deposit No. of Samples Average Density (tonne/m3)
Syväjärvi 444 2.73
Rapasaari 434 2.72
Länttä 57 2.72
Outovesi 34 2.72
Emmes 57 2.71
1.14.10 Mineral Resource Classification
The assignment of appropriate mineral resource classification category has primarily
been based on the geological understanding, geological complexity and associated drill
hole spacing. In general, the drill hole spacing and associated geology and assay
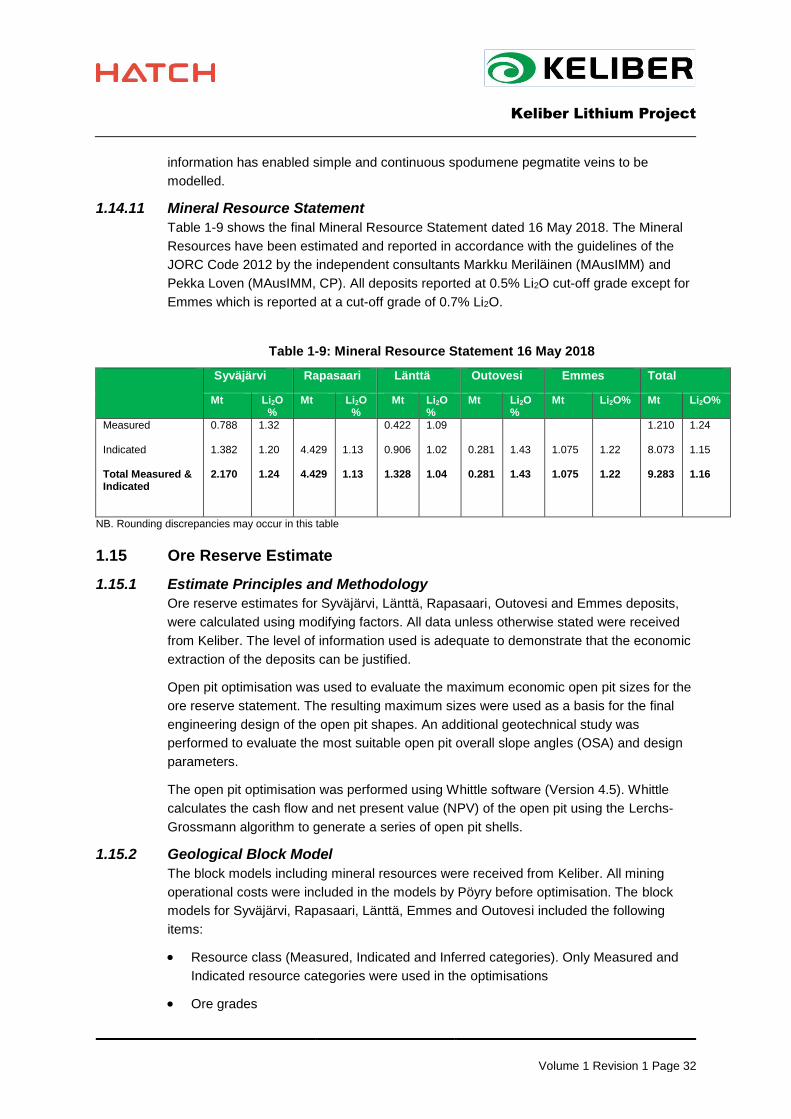
Keliber Lithium Project
Volume 1 Revision 1 Page 32
information has enabled simple and continuous spodumene pegmatite veins to be
modelled.
1.14.11 Mineral Resource Statement
Table 1-9 shows the final Mineral Resource Statement dated 16 May 2018. The Mineral
Resources have been estimated and reported in accordance with the guidelines of the
JORC Code 2012 by the independent consultants Markku Meriläinen (MAusIMM) and
Pekka Loven (MAusIMM, CP). All deposits reported at 0.5% Li2O cut-off grade except for
Emmes which is reported at a cut-off grade of 0.7% Li2O.
Table 1-9: Mineral Resource Statement 16 May 2018
Syväjärvi Rapasaari Länttä Outovesi Emmes Total
Mt Li2O%
Mt Li2O%
Mt Li2O%
Mt Li2O%
Mt Li2O% Mt Li2O%
Measured Indicated Total Measured & Indicated
0.788 1.382 2.170
1.32 1.20 1.24
4.429 4.429
1.13 1.13
0.422 0.906 1.328
1.09 1.02 1.04
0.281 0.281
1.43 1.43
1.075 1.075
1.22 1.22
1.210 8.073 9.283
1.24 1.15 1.16
NB. Rounding discrepancies may occur in this table
1.15 Ore Reserve Estimate
1.15.1 Estimate Principles and Methodology
Ore reserve estimates for Syväjärvi, Länttä, Rapasaari, Outovesi and Emmes deposits,
were calculated using modifying factors. All data unless otherwise stated were received
from Keliber. The level of information used is adequate to demonstrate that the economic
extraction of the deposits can be justified.
Open pit optimisation was used to evaluate the maximum economic open pit sizes for the
ore reserve statement. The resulting maximum sizes were used as a basis for the final
engineering design of the open pit shapes. An additional geotechnical study was
performed to evaluate the most suitable open pit overall slope angles (OSA) and design
parameters.
The open pit optimisation was performed using Whittle software (Version 4.5). Whittle
calculates the cash flow and net present value (NPV) of the open pit using the Lerchs-
Grossmann algorithm to generate a series of open pit shells.
1.15.2 Geological Block Model
The block models including mineral resources were received from Keliber. All mining
operational costs were included in the models by Pöyry before optimisation. The block
models for Syväjärvi, Rapasaari, Länttä, Emmes and Outovesi included the following
items:
• Resource class (Measured, Indicated and Inferred categories). Only Measured and
Indicated resource categories were used in the optimisations
• Ore grades
Keliber Lithium Project
Volume 1 Revision 1 Page 33
• Internal and external waste rock dilution
• Diluted lithium oxide head grade for optimisation.
The following items were not included in the block model:
• Overburden or air coding
• Specific gravity or density information (these were applied to the mining volumes in
post-calculations).
1.15.3 Pit Optimisation Parameters
The pit optimisation parameters include Mineral Resource estimation block model, all
necessary operational costs, time costs, processing costs and selling costs of the final
concentrate.
1.15.4 Capital Investments
All capital investments were excluded from the optimisation. The investments have no
direct impact on the open pit sizes in the optimisation.
1.15.5 Discount Rates
An annual discount rate of 8% was used in the optimisation procedure. No inflation was
applied to the production costs. The optimisations were performed in Real Euros.
1.15.6 Royalties
The optimisation was completed under the assumption that there are no royalties
associated with mining leases in Finland.
1.15.7 Capacity and Production Scenario
The annual ore feed to the processing plant was set at 600 000 t which would provide the
targeted production rate of approximately 12 500 tpa output of lithium hydroxide product
(11 000 LCE).
1.15.8 Processing Recovery
For the open pit optimisation, the mineral processing (flotation) recoveries were adjusted
based on the deposit being optimised while the Conversion and Chemical Plant recovery
was fixed.
1.15.9 Mining and Transportation Costs
All mine operating cost estimates are based on quotations from three contractors.
The operating costs used in the optimisation are calculated and coded to the geological
block model in Surpac.
1.15.10 Processing Costs
The processing costs used in the optimisation procedure were prepared by Keliber in
February 2018. The processing cost used as an input for the optimisation is 57 €/t ore.
The processing costs were updated in January 2019 and these updated costs were used
in cut-off breakeven calculation by Pöyry.
Small variations in the processing cost were tested in the open pit optimisation and it was
determined that these variations will not materially affect the open pit sizes and ore
reserves.
Keliber Lithium Project
Volume 1 Revision 1 Page 34
1.15.11 Mining Throughput Limits
The maximum annual ore mining rates for the optimisation was set to 600 000 tonnes in
all open pits. No mining rate maximum was applied to any waste rock mining. This was
done to avoid constraining ore mining due to waste rock mining.
1.15.12 Mining Dilution
Mining dilution is a sum of multiple factors including:
• Selected mining method in question
• Mining equipment type, size and minimum mining width
• Nature, extent and geometry of the ore body
• Quality of managed grade control.
All the geological resource block models include internal waste rock and external waste
dilution. Hence no additional dilution factors were applied during the open pit optimisation
phase.
1.15.13 Mining Recovery
The average mining recovery factor of 95% was applied to the optimisation, and for the
ore reserve calculation.
1.15.14 Cut-Off
A Li2O cut-off grade of 0.5% was used in all open pit optimisations. The cut-off grade was
estimated using breakeven cost/profit analysis. For the ore reserve conversion, a cut-off
of 0.40% Li2O was used to define reserves within the optimised pit shell.
1.15.15 Product Price
A price assumption from Roskill for the final lithium product was used in the open pit
optimisations. No selling costs were included in the open pit optimisation.
1.15.16 Open Pit Constraints
The only physical pit limit constraint that was added to the optimisations is in the Syväjärvi
deposit where the Lake Heinävesi is located at the east side of the planned open pit. The
open pit wall was constrained so that the lake will remain mostly unchanged.
1.15.17 Specific Gravity
For the optimisation and for the Reserve calculations a specific gravity of 2.73 was used
for Syväjärvi deposit, 2.72 for Länttä, Rapasaari, Outovesi and for Emmes 2.71. The
value was provided by Keliber and it has been discussed more detailed on PFS report.
Waste and ore have been reported with same specific gravity in each of deposit.
1.15.18 Open Pit Shell Selection Criteria
In the deposits, where only open pit mining is anticipated, the Whittle NPV result chart
was used to select the pit shell that maximises the open pit value. For combined
underground and open pit operations the open pit shell selection criteria also took into
consideration the underground mining plans.
1.15.19 Optimisation Results
Open pit optimisation indicated a profitable and feasible open pit mining scenario with a
good project value for all deposits.
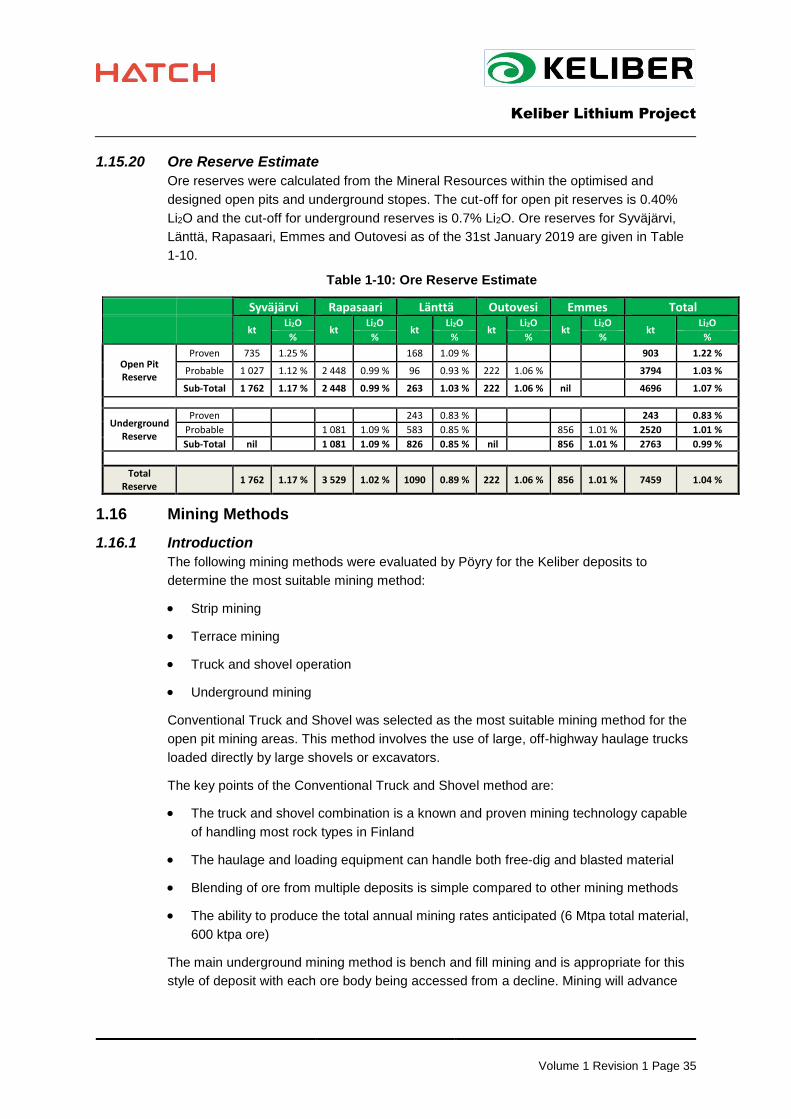
Keliber Lithium Project
Volume 1 Revision 1 Page 35
1.15.20 Ore Reserve Estimate
Ore reserves were calculated from the Mineral Resources within the optimised and
designed open pits and underground stopes. The cut-off for open pit reserves is 0.40%
Li2O and the cut-off for underground reserves is 0.7% Li2O. Ore reserves for Syväjärvi,
Länttä, Rapasaari, Emmes and Outovesi as of the 31st January 2019 are given in Table
1-10.
Table 1-10: Ore Reserve Estimate
Syväjärvi Rapasaari Länttä Outovesi Emmes Total
kt Li2O
kt Li2O
kt Li2O
kt Li2O
kt Li2O
kt Li2O
% % % % % %
Open Pit Reserve
Proven 735 1.25 % 168 1.09 % 903 1.22 %
Probable 1 027 1.12 % 2 448 0.99 % 96 0.93 % 222 1.06 % 3794 1.03 %
Sub-Total 1 762 1.17 % 2 448 0.99 % 263 1.03 % 222 1.06 % nil 4696 1.07 %
Underground Reserve
Proven 243 0.83 % 243 0.83 %
Probable 1 081 1.09 % 583 0.85 % 856 1.01 % 2520 1.01 %
Sub-Total nil 1 081 1.09 % 826 0.85 % nil 856 1.01 % 2763 0.99 %
Total Reserve
1 762 1.17 % 3 529 1.02 % 1090 0.89 % 222 1.06 % 856 1.01 % 7459 1.04 %
1.16 Mining Methods
1.16.1 Introduction
The following mining methods were evaluated by Pöyry for the Keliber deposits to
determine the most suitable mining method:
• Strip mining
• Terrace mining
• Truck and shovel operation
• Underground mining
Conventional Truck and Shovel was selected as the most suitable mining method for the
open pit mining areas. This method involves the use of large, off-highway haulage trucks
loaded directly by large shovels or excavators.
The key points of the Conventional Truck and Shovel method are:
• The truck and shovel combination is a known and proven mining technology capable
of handling most rock types in Finland
• The haulage and loading equipment can handle both free-dig and blasted material
• Blending of ore from multiple deposits is simple compared to other mining methods
• The ability to produce the total annual mining rates anticipated (6 Mtpa total material,
600 ktpa ore)
The main underground mining method is bench and fill mining and is appropriate for this
style of deposit with each ore body being accessed from a decline. Mining will advance
Keliber Lithium Project
Volume 1 Revision 1 Page 36
from bottom upwards in 20 m high mining lifts and back fill will be waste rock from the
open pit and development drives.
1.16.2 Open Pit Geotechnical Evaluation
The geotechnical conditions in all pits are considered to be very good. The intact rock
strength is medium to high and rock quality is good. Considering the small size of the
open pits this generally means that possible slope failures are mostly structurally
dominated small scale bench failures. Therefore, kinematic analyses are used to
determine optimal bench, berm and overall slope angles for each open pit
1.16.3 Underground Geotechnical Evaluation
It is noted that the focus of testing of the laboratory samples that have collected have
been biased towards obtaining better data on the deposits that are planned to be mined
during the first years of operations, rather than the later deposits. As a result, Syväjärvi
and Rapasaari are well understood and represented, whereas Länttä, Emmes and
Outovesi require more detailed sampling campaign during the next design phase.
In-situ stress measurements have not been carried out in the location of the project. The
stress field was estimated based on the closest measurements the team could access. In
the next study phases the in-situ stress field shall be analyzed in more detail.
1.16.4 Pit and Underground Mine Design
The assumptions and methodology used in the open pit design process for the Keliber
DFS and the proposed design parameters for all pits are listed and the proposed design
parameters used to create the final pit designs are detailed.
The geotechnical parameters apart from ramp width required for the pit design were
obtained from the Pöyry Geotechnical Study. The ramp width has been calculated using
2.5 times the width of the overall haul truck width. The haul truck used for the design was
the Caterpillar 777, which has an overall width of 6.4 m. A 16 m ramp width is used for all
pits except for Outovesi, which is a small-scale operation, so a narrower ramp can be
used. The 16 m ramp allows for drain ditches and safety berms to be constructed. The
final benches in the pit designs have been designed using single lane access which
allows the retrieval of extra ore at the base of the pits.
Design of the underground mines provides details of the declines (location, gradient etc.)
and the raises needed for ventilation and backfill. The stopes have been designed using
€100/t NSR block cut-off and a minimum mining width of 5 m.
Recommended parameters for open pit designs and layouts for each deposit together
with the underground layouts are provided
1.16.5 Geotechnical Considerations of Production Sequencing
The final pit excavations have been simulated for analysis of final stress patterns and
were modelled without any intermediate sequencing. The underground mines have been
simulated using 5 or 6 lifts, where backfill is placed in the sequence after mining, although
no scheduling was performed. The excavation of the crown pillars was also considered in
2 x 6m lifts.
Keliber Lithium Project
Volume 1 Revision 1 Page 37
The results of the simulations identify likely failure methods, such as toppling and
shearing, which can then be used to determine the optimum ground support
methodology.
In general, the open pits demonstrate little movement, with low risks of failure. The
interaction of the underground mines, the open pits, and the respective crown pillars, will
require more detailed analysis.
Based on numerical modelling of stress patterns, designs have been recommended for
the various excavations (access tunnels, production drives, drifts, stoping areas)
specifying varying degrees of bolts, cable bolts, mesh, swellex, and shotcrete, depending
on location. However, this evaluation is very preliminary and does not take rock mass
fractures into account. Modelled rock fractures may have significant effect to the ground
support evaluation using numerical methods
1.16.6 Production Schedule
The mine production schedule for the Keliber Project used the pit designs and reserves
from the pit designs to achieve:
• 12 500 tpa LiOHꞏH2O production
• Feed highest quality ore at the start of the schedule
• Minimise initial waste stripping
• No haulage was modelled
• No waste dumps were modelled.
The production schedule has been developed on an annual basis. The recommended
mining sequence is as follows:
1) Syväjärvi.
2) Rapasaari Open Pit
3) Länttä Open Pit
4) Rapasaari Underground
5) Outovesi
6) Länttä Underground
7) Emmes
1.16.7 Total Material Movements
Ore movements by open pit and underground mines, together with the production of
lithium hydroxide product are shown in Figure 1-7. There are sufficient Ore Reserves for
12 years of stable production although the first and last years are executed with a lower
production rate due to ramp-up and ramp-down phases of the mining operations thus
resulting in the mining operations to run for 13 years.

Keliber Lithium Project
Volume 1 Revision 1 Page 38
Figure 1-7: Annual Ore and LiOH.H2O Production
1.17 Recovery Methods
1.17.1 Overview of the Treatment Route to Produce Lithium Hydroxide
The treatment route to produce lithium hydroxide monohydrate from spodumene is based
on extensive test work, which was started in 2015 and undertaken, mainly, by GTK
Mintec, Outotec and Metso. The selected overall flowsheet comprises a conventional
spodumene concentrator, conversion of alpha to beta spodumene in a rotary kiln, a two-
stage leach and other hydrometallurgical processes to produce lithium hydroxide. A
simplified process block flow diagram is given in Figure 1-8.

Keliber Lithium Project
Volume 1 Revision 1 Page 39
Figure 1-8: Simplified overall process block flow diagram to produce lithium hydroxide
The process flowsheets developed are based on unit operations that are proven in the
mineral processing and chemical industries, although the soda pressure leach process (in
continuous mode) is not yet in commercial operation. However, the overall process has
been proven at pilot plant scale.
The key criteria for the Project are:
• The plant is designed for a nominal ore throughput of 500 000 tpa and a design value
of 600 000 tpa
• The annual lithium hydroxide production rate will be 12 500 tonnes (11 000 tonnes
LCE) at the selected nominal throughput rate
• Head grade of the spodumene ore will be 1.04 Li2O% over the life of mine
• Target Li2O content of the spodumene concentrate is 4.5% and the final product,
LiOHꞏH2O will be 99% pure (56.5% LiOH)

Keliber Lithium Project
Volume 1 Revision 1 Page 40
• A high level of automation will be utilised considering the relative complexity of the
flowsheet
• Equipment will be selected for reliable operation and ease of maintenance
• Layout engineering will be to ensure easy access to all equipment for operation and
maintenance purposes with a compact footprint to minimise construction costs
1.17.2 Recoveries in the Lithium Hydroxide Production Process
The typical lithium recovery figures for the different stages in the production of lithium
hydroxide are summarised in Table 1-11.
Table 1-11: Recovery figures in the lithium hydroxide production
Area Concentrate
grade%
Recovery% Basis
Minerals Processing 4.5%Li2O%
2.09%Li
87.3% Flotation test work in laboratory
and pilot scale. Recovery varies
by deposit and this is a typical
average value
Conversion 4.5%Li2O
2.09%Li
>95.0% Metso Minerals pilot test 2017
Leaching yield 4.5%Li2O
2.09%Li
87.7% Outotec pilot testing and design
criteria
From concentrate to
lithium hydroxide
product (including
conversion
- 83.3% Outotec pilot testing and design
criteria
Overall recovery
from ore to lithium
hydroxide product
- 72.4% Average calculated value.
Varies from one deposit to
another due to differences in
recovery in mineral processing
1.17.3 Overall Mass Balance
Table 1-12 gives the average annual overall mass balance of the plants from the ROM to
the lithium hydroxide:
Table 1-12: Average Annual Overall Mass Balances
Stream
Dry
flowrate
tonnes per
annum Li2O%
Lithium
distribution %
Run of mine (ROM) 600 000 1.04 100.0
Sorter reject 98 800 0.00 0.0
Grinding feed 501 200 1.23 100.0
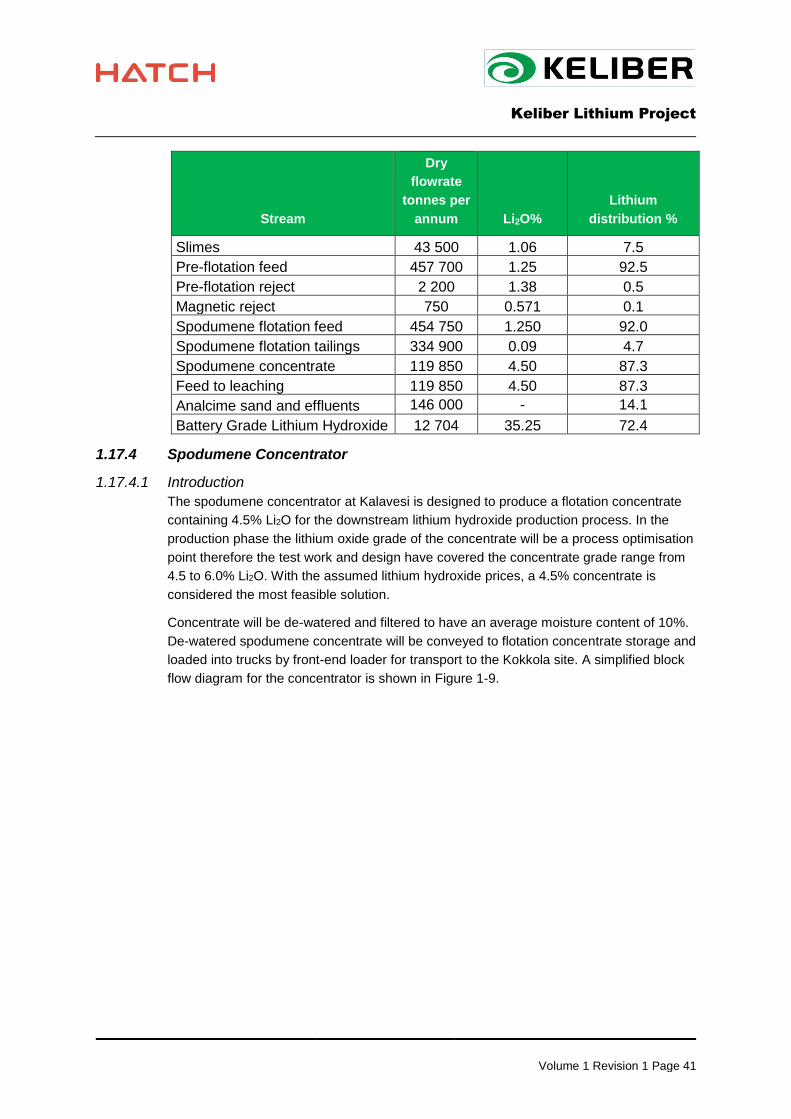
Keliber Lithium Project
Volume 1 Revision 1 Page 41
Stream
Dry
flowrate
tonnes per
annum Li2O%
Lithium
distribution %
Slimes 43 500 1.06 7.5
Pre-flotation feed 457 700 1.25 92.5
Pre-flotation reject 2 200 1.38 0.5
Magnetic reject 750 0.571 0.1
Spodumene flotation feed 454 750 1.250 92.0
Spodumene flotation tailings 334 900 0.09 4.7
Spodumene concentrate 119 850 4.50 87.3
Feed to leaching 119 850 4.50 87.3
Analcime sand and effluents 146 000 - 14.1
Battery Grade Lithium Hydroxide 12 704 35.25 72.4
1.17.4 Spodumene Concentrator
1.17.4.1 Introduction
The spodumene concentrator at Kalavesi is designed to produce a flotation concentrate
containing 4.5% Li2O for the downstream lithium hydroxide production process. In the
production phase the lithium oxide grade of the concentrate will be a process optimisation
point therefore the test work and design have covered the concentrate grade range from
4.5 to 6.0% Li2O. With the assumed lithium hydroxide prices, a 4.5% concentrate is
considered the most feasible solution.
Concentrate will be de-watered and filtered to have an average moisture content of 10%.
De-watered spodumene concentrate will be conveyed to flotation concentrate storage and
loaded into trucks by front-end loader for transport to the Kokkola site. A simplified block
flow diagram for the concentrator is shown in Figure 1-9.
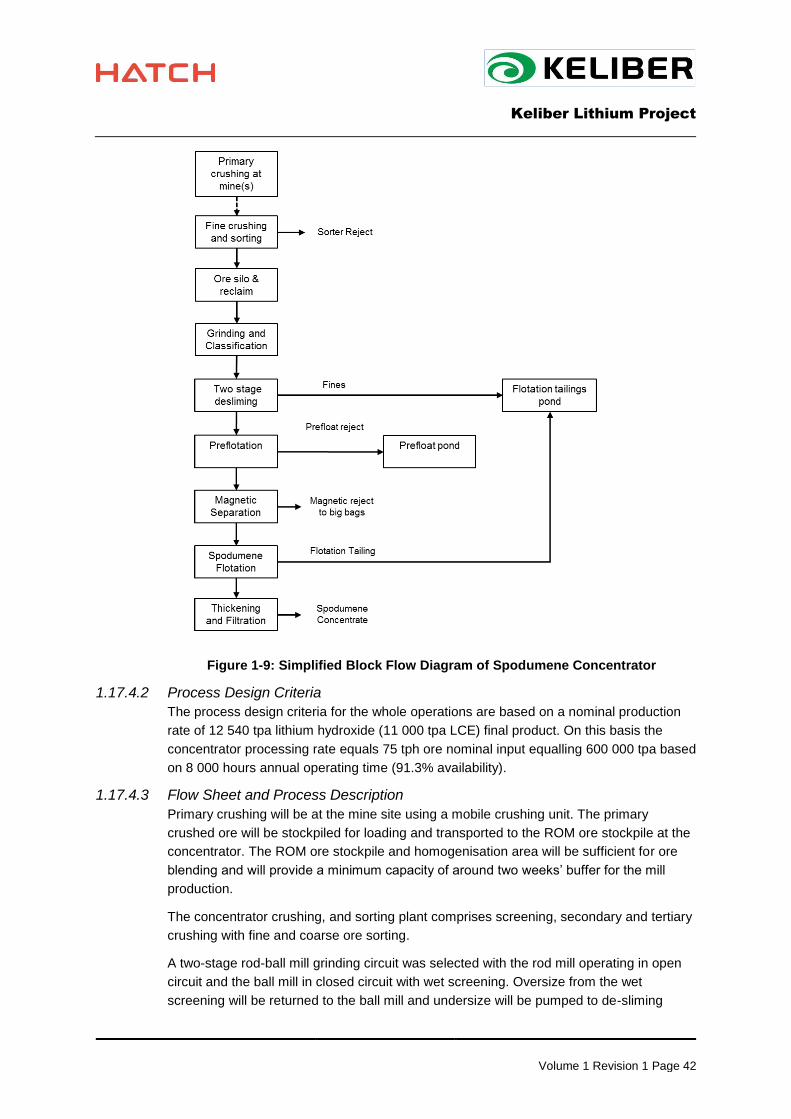
Keliber Lithium Project
Volume 1 Revision 1 Page 42
Figure 1-9: Simplified Block Flow Diagram of Spodumene Concentrator
1.17.4.2 Process Design Criteria
The process design criteria for the whole operations are based on a nominal production
rate of 12 540 tpa lithium hydroxide (11 000 tpa LCE) final product. On this basis the
concentrator processing rate equals 75 tph ore nominal input equalling 600 000 tpa based
on 8 000 hours annual operating time (91.3% availability).
1.17.4.3 Flow Sheet and Process Description
Primary crushing will be at the mine site using a mobile crushing unit. The primary
crushed ore will be stockpiled for loading and transported to the ROM ore stockpile at the
concentrator. The ROM ore stockpile and homogenisation area will be sufficient for ore
blending and will provide a minimum capacity of around two weeks’ buffer for the mill
production.
The concentrator crushing, and sorting plant comprises screening, secondary and tertiary
crushing with fine and coarse ore sorting.
A two-stage rod-ball mill grinding circuit was selected with the rod mill operating in open
circuit and the ball mill in closed circuit with wet screening. Oversize from the wet
screening will be returned to the ball mill and undersize will be pumped to de-sliming
Keliber Lithium Project
Volume 1 Revision 1 Page 43
cyclones. Cyclone overflow is pumped to the tailings facility and the cyclone underflow is
pumped to the flotation circuit.
Typically, the spodumene flotation is expected to recover 83% of the Li2O into a flotation
concentrate representing around 26% of the ore mass. The recovery will vary depending
on the deposit, the head grade and mass proportion of wall rock dilution (country rock).
The concentrate grade can vary between 4.5% and 6.0% and this is to be optimised
during operations.
1.17.4.4 Spodumene Concentrate Storage
The concenrate storage facility will provide sufficient storage for two days operation,
providing a buffer between the concentrator and conversion plant. Spodumene
concentrate will be loaded by a front-end loader and transported by truck to the KIP site.
1.17.4.5 Future Expansion
The concentrator has been designed to be able to treat up to 600 000 tpa of ore and the
layout of the plant allows for later installation of dense media separation and gravity
concentration circuits, if required.
1.17.4.6 Reagents and Consumables
Adequate stocks of reagents and consumables for the concentrator will be maintained on
site to ensure that the production at the concentrator is not disrupted.
1.17.5 Kalavesi Site Services
The main site services required are electric power, water and air. Electric power will be
supplied by Korpelan Voima Oy, a local grid company which is operating the power
distribution in the area.
Raw water will be pumped from Vissavesi lake located at a distance of 2.5 km and treated
on site to provide the required process and sealing water. Potable water will be taken
from the municipality water supply.
Fire water will be sourced from the fresh water pond and the process circulating water
pond and pumped through a ring pipeline with fire hydrants.
There will be a waste water treatment plant comprising facilities for clarification and pH
control to treat all water from the concentrator prior to being discharged
A compressor station will be sited at the concentrator to provide compressed air for
general use and for instrument air. Air for the flotation plant will be supplied by two
dedicated air blowers.
1.17.6 Tailings and Water Management at Kalavesi Site
At Kalavesi the tailings will be stored in two different ponds located close to the
concentrator. The fines and spodumene flotation tailings are stored together in the
flotation tailings pond and the pre-float reject in the pre-float pond. In addition, there will
be one water pond for storing fresh water and the process circulating water. The tailings
do not need any chemical treatment.
The flotation tailing pond will be built in two or more stages. The starter dam with three
years capacity will be built with moraine. After that the dams will be raised with the coarse
spodumene flotation tailing. The total area of the dam will be 46 ha. The pre-float pond
Keliber Lithium Project
Volume 1 Revision 1 Page 44
with and area of 6 hectares will be lined with geomembrane and the sealing structure
contains bentonite mat and a HDPE/LLDPE-liner.
The overall water balance of the Kalavesi plant area has been calculated with HSC
Chemistry Simulation software. A water management concept has been developed
together with the process designers and the environmental specialists. The water balance
model is based on preliminary process design information for the production plants, for
the tailings area, and for the fresh water treatment and power plant areas. Additional
sources of information include laboratory test and pilot plant test reports.
This water balance model has been used to define the quantity of fresh water needed.
Production processes define the requirements of process water, which are produced at
the fresh water treatment plant. The fresh water treatment plant produces chemically
purified water (low organic content and low solid content). Chemically purified water is
used as sealing water. Discharge waters from the fresh water treatment plant are treated
at the urban waste water treatment plant.
The water circulation concept has been defined together with the process designers. The
concentrator’s water recirculation rate is high (about 90%), and chemically treated water
is needed only at a few consumption points.
Due to fresh water intake and due to the large tailings pond surface areas, which receive
rain water, there is a need to release extra water to the environment from the minerals-
pond water balance area. Water quality has been analysed for concentrator process pilot
samples, and solubility tests have been performed for solid residues of the process.
Based on these results, and the simulation, the effluent is expected to contain mainly
sodium and sulphate. In addition, traces of other compounds can be found in the effluent.
This water is treated in a pH adjustment and clarification process. The tailings pond and
the water recirculation pond serve as buffer ponds, they ensure the availability of
recirculated water for the concentrator, and they can also be used to balance the effluent
flowrate to the receiving waters. There are seasonal variations in precipitation and natural
evaporation, and these variations will have an influence on pond water inventories and/or
the effluent flowrate.
Drainage waters will be segregated from process waters to prevent accumulation of water
to the process water circuit.
1.17.7 Lithium Hydroxide Production Plant
1.17.7.1 Introduction
Spodumene concentrate will be delivered by truck from Kalavesi and discharged at the
concentrate storage facility which has capacity sufficient for three days of operation.
1.17.7.2 Process Design Criteria
Metso and Outotec have developed the process design criteria for the Conversion Plant
and the Hydrometallurgical Plant, respectively, for a nominal production of 12 500 tpa of
lithium hydroxide final product. This level of production requires a feed of about 130 000
tpa of wet spodumene concentrate (10% moisture and 4.5% Li2O) to the Conversion
Plant based on the overall Chemical Plant operating 7 500 hrs pa (85.6% availability).
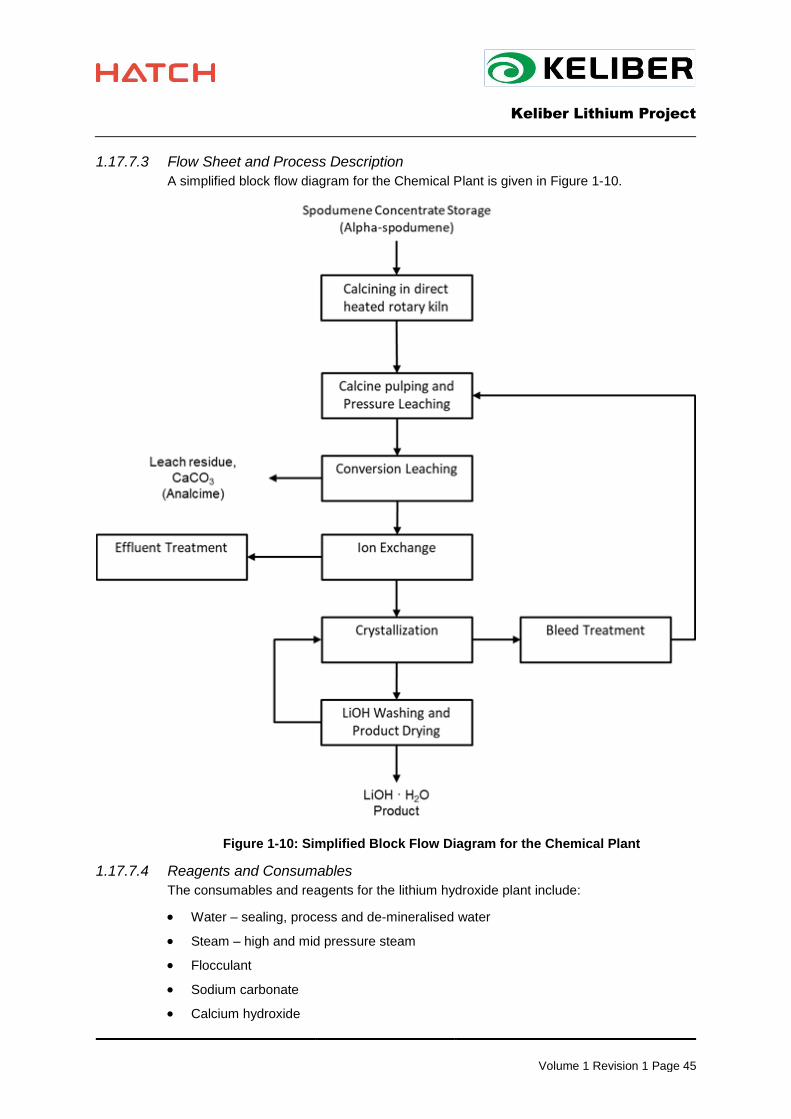
Keliber Lithium Project
Volume 1 Revision 1 Page 45
1.17.7.3 Flow Sheet and Process Description
A simplified block flow diagram for the Chemical Plant is given in Figure 1-10.
Figure 1-10: Simplified Block Flow Diagram for the Chemical Plant
1.17.7.4 Reagents and Consumables
The consumables and reagents for the lithium hydroxide plant include:
• Water – sealing, process and de-mineralised water
• Steam – high and mid pressure steam
• Flocculant
• Sodium carbonate
• Calcium hydroxide
Keliber Lithium Project
Volume 1 Revision 1 Page 46
• Sodium hydroxide
• Hydrochloric acid
• Carbon dioxide
Sufficient stocks of reagents will be maintained on site to ensure that any supply
interruptions do not impact production.
1.17.8 KIP Site Services
Many of the required site services, for example security and fire brigade, are available at
the KIP site and existing infrastructure is available to supply these.
1.18 Project Infrastructure
The major infrastructure for the project comprises the following items:
• Mines (Länttä, Rapasaari, Syväjärvi, Outovesi and Emmes):
The access roads from the mines to the concentrator
20 kV power transmission lines to mine sites: Länttä (200 m), Rapasaari (3.4 km),
Syväjärvi 3.3 km, Outovesi (3.4 km) and Emmes (200 m)
Mobile crushing unit
• Concentrator (Kalavesi):
Raw water pumping station at Vissavesi, piping and water treatment plant
2x 20 kV power transmission lines from the supplier substation to Kalavesi site
(4.8 km long)
Required infrastructure for the concentrator and equipment:
▪ crushed ore pile
▪ screening
▪ secondary crusher, sorting and tertiary crusher
▪ conveyors and ore silo
▪ grinding, flotation and dewatering
▪ concentrate storage
Tailing ponds: Two tailing ponds process residues and one water pond
Small power plant to produce heat
• Chemical Plant (KIP):
Required infrastructure for conversion and hydrometallurgical plant and
equipment:
▪ concentrate storage
▪ conversion plant
▪ hydrometallurgical plant
Keliber Lithium Project
Volume 1 Revision 1 Page 47
Effluent treatment plant
Liquefied petroleum gas (LPG) storage and handling facilities
• Auxiliary facilities all at sites:
Main switch station and electricity distribution at each site
Main gate, area fencing and weighbridges
Pipe bridges for pipelines
Office, laboratory and service / storage facilities
1.19 Market Studies and Contracts
To evaluate the market for its product Keliber commissioned the Roskill Consulting Group
Ltd. (Roskill) to undertake a lithium market overview and outlook study. Roskill provided
an updated report in early 2019, which describes the supply of lithium by current
producers as well the potential new suppliers. It also analyses lithium demand by
applications, with a special focus on the use of lithium in rechargeable batteries. Historic
prices for lithium hydroxide and the forecast price to the year 2032 for both for technical
and battery grade lithium hydroxide are also provided.
1.19.1 Global Lithium Reserves and Resources
In 2018, the USGS reported global lithium reserves to be 16 Mt Li (85 Mt LCE). The
USGS also reported lithium resources at 53 Mt Li (282 Mt LCE).
1.19.2 Lithium Supply and Outlook of Mine Production Capacity
Since 2000, growth in mine output has averaged 10% py; in 2017 the production of
lithium totalled 360 256 t LCE. Output in 2018 is expected to move significantly higher
again, at over 472 000t LCE. In 2017 the global mine capacity totalled nearly 375 000
LCE, this is forecast to increase to 1.0 Mtpy by 2022 and to 1.1 Mtpy by 2027.
Despite projects, expanded and under development, additional capacity will be required
by the mid-/late -2020s to match demand growth later in the decade and into the 2030s.
1.19.3 Current and Historical Lithium Consumption
Consumption of lithium is estimated to have increased by 7.4%py since 2000, reaching
224 000 t LCE in 2017 and based on estimates reached 253 200t LCE in 2018. Growth in
consumption has been led by increased use of lithium by the rechargeable battery
industry, growing at 17.7% py between 2000 and 2017. The rechargeable battery sector
accounted for 54% of lithium consumption in 2018.
Lithium carbonate is the most widely consumed product, finding application in
rechargeable batteries, ceramics, glass-ceramics, glass, metallurgical powders,
aluminium and other uses.
Industrial and battery-grade lithium hydroxide together represented 15% of total
consumption, with battery grade hydroxide showing the highest growth rate of all lithium
products since 2012 at 16% py.
Keliber Lithium Project
Volume 1 Revision 1 Page 48
Battery-grade carbonate and hydroxide together represented 54% of total consumption by
product in 2018, reflecting the share of the rechargeable battery market in the overall
lithium market.
China is the largest consumer of lithium, accounting for around 43% of total consumption
in 2017 followed by Japan and South Korea at 18% and 13% of the global market for
lithium respectively. Both Europe and North America are mature markets for lithium with
growth stagnating since the early 2010s. India, Russia and the CIS remain relatively small
markets.
1.19.4 Lithium Consumption Outlook 2017 – 2032
The short, medium and long-term outlook for lithium consumption appears strong, with
overall consumption growth forecast at 17.6% py to 2032. The market is forecast to reach
over 1.3 Mt LCE in 2027 and 2.5 Mt LCE in 2032. The consumption of lithium will
continue to be driven by the rechargeable battery sector, which is forecast to register
22.7% py growth through to 2032, reaching around 2.4 Mt LCE.
Corresponding with the growth in rechargeable battery lithium consumption, battery-grade
lithium carbonate and hydroxide demand could increase by 14.6% py and 28.9% py
respectively through to 2027 and from 2027 – 2032 to reach almost 600 000 t LCE and
785 000 t LCE respectively.
The rechargeable battery sector is largely Asia-based in terms of intermediates, so Asia,
in particular China, Korea and Japan, are expected to show the strongest gains in lithium
consumption to 2032.
1.19.5 Market Balance: Outlook of Supply Demand Balance
Roskill’s base-case forecast projects lithium consumption increasing by 17.6% py through
2032 to reach just over 2.55 Mt LCE, a seven-fold increase, in 2017.
The existing producers could raise mine capacity to 931 310tpy LCE by 2022 and
1.14Mtpy LCE by 2027. Significant volumes of additional mining capacity (including both
brine and hard rock production) will be required in the mid-2020s to match consumption
growth later in the decade and into the 2030s. Thus, in the long-term, the contribution to
mine supply by companies entering the market in 2018-2022 is necessary, unless further
expansion occurs at existing producers above.
Refined output of lithium will increase ahead of consumption as in a rapidly growing
market, customer requirement (demand) often outpaces consumption, especially in the
automotive market where there is a long lead time from raw material sourcing to the
vehicle sale. Nevertheless, the market is at risk of oversupply in the late-2010s and early-
2020s given the size of expansions and the number of new producers entering the
market. However, a significant volume of refined lithium supply will be required in addition
to announced production expansions at existing producers by the mid-2020s. Given a
history of underperformance on delivering supply to market, lithium’s past problems may
well cancel out the predicted shorter-term oversupply.
1.19.6 Lithium Prices
Lithium product prices respond to variations in supply, demand, and the perceived
supply/demand balance, costs and economic factors in a similar way to most other raw

Keliber Lithium Project
Volume 1 Revision 1 Page 49
materials. The three most commonly sold finished products are lithium carbonate, lithium
hydroxide, and mineral concentrate. Transactions are negotiated between the producer
(or agent / trader) and the consumer to suit individual circumstances. Lithium is not traded
on any exchange.
The Keliber Project is to produce and sell battery grade lithium hydroxide although some
industrial grade may be produced from time to time. Industrial and battery grade lithium
hydroxide are priced differently.
The industrial-grade lithium hydroxide price is closely aligned to the industrial-grade
lithium carbonate price, based on the additional cost for carbonate-based producers of
converting one lithium product to the other. The industrial-grade lithium hydroxide has
premium over technical grade carbonate.
Average annual prices for the industrial grade lithium hydroxide are forecast to rise to
USD15 000/t (nominal) by 2025 and USD19 000/t by 2032, although there is expected to
be a weakening in prices in the period 2019 - 2022.
Battery-grade lithium hydroxide consumption has grown quickly over the last decade.
Reflecting the more limited supply options, battery-grade hydroxide has carried an even
larger premium to lithium carbonate than industrial-grade lithium hydroxide. In 2017
premium fell and a discount to industrial-grade hydroxide was around US$2,900/t, due to
the structure of contracts for battery-grade limited to a smaller number of parties on long-
term contracts at lower prices. A premium is expected to re-emerge from 2018 as the
current high prices for industrial-grade hydroxide fall but battery-grade increases, with
prices falling into parity in the 2020s.
USD13 000/t is expected to be the new floor for average annual contract prices (nominal).
The nominal annual contract price for battery-grade lithium hydroxide is forecast to be
USD14 000/t in 2021 rising to USD21 000/t in 2032. Spot prices for battery-grade lithium
hydroxide in China are expected to be slightly higher, USD15 000/t in 2021 and
respectively USD22 000/t in 2032.
1.19.7 By-Product Markets
Keliber will obtain two by-products, namely analcime sand and quartz-feldspar sand,
which could potentially have a commercial value. Potentially analcime sand could be used
as a water treatment chemical, and as construction material, as a land fill material at the
Port of Kokkola.
Test work related to the use of the quartz-feldspar sand as filler material in concrete,
mortar, plaster and asphalt has been carried out and as raw material in foam glass and
geopolymer brick production.
The potential for using crushed and sized waste rock as aggregate in construction is also
being pursued.
No revenues from sale of by-products have been assumed in the DFS financial analysis.
1.19.8 Contracts
Keliber has initiated negotiations with several regional and global operators in the lithium
supply chain in both the battery and non-battery sectors. Strong interest has been
Keliber Lithium Project
Volume 1 Revision 1 Page 50
registered for Keliber’s product partly driven by the European location of the Project. The
release of the updated DFS will provide the basis for the next stage of offtake
negotiations.
Keliber has several Letters of Intent relating to process by-products namely analcime
sand, feldspar-quartz sand and waste rock aggregates. These may provide potentially
additional revenue in the future.
1.20 Environmental Studies, Permitting and Social or Community Impact
1.20.1 Introduction
Keliber is developing a mining and processing project in Finland which includes four open
pit mines located at Outovesi, Syväjärvi, Rapasaari and Länttä in Kaustinen with
extended underground mining in Rapasaari and Länttä and solely underground mining at
Emmes (Kruunupy). The mines are anticipated to yield approximately 600,000 tonnes of
ore annually. A Concentrator located in Kaustinen (Kalavesi) will process ore to produce
approximately 135 000 tonnes per year (tpa) of spodumene concentrate containing 4.5-
6.0% Lithium Oxide (Li2O) for downstream treatment. A Hydrometallurgical Plant in the
Kokkola Industrial Park (KIP) will produce approximately 12 500 tonnes of Lithium
Hydroxide (LiOHꞏH2O) annually.
1.20.2 Mine Areas
The EIA studies are complete for the for Outovesi, Syväjärvi, Länttä and Rapasaari
mines. For Emmes the EIA study is not required due to the small scale of the solely
underground mining operation. Keliber holds both mine permit and environmental permit
for Länttä. For Syväjärvi positive decision on mine permit was received in Q1/2019 and
proceedings establishing a mining area have been started. A positive decision on the
environmental permit of Syväjärvi was received Q1/2019 but the permit is not yet legally
valid. For Rapasaari the permit application was submitted Q1/2019. No permit application
for the Outovesi mine has been made to date.
Mining and crushing operations are planned to be undertaken during the day time from
7a.m. to 10p.m. and transport activities within the mining areas will operate 24hrs per day.
Dust emission impacts (PM10) caused by mining, crushing and processing rock are
considered minimal due to dispersion and variation in weather conditions and the
distance of the mines from residential properties.
The guideline value (45dB) of daytime average noise levels in holiday home areas is
likely to be exceeded at five holiday homes, during the operations of the Outovesi mine.
Vibration impacts are most likely to occur during the operational phase and impacts will
be at their highest when the blasting work is done in the surface layers during winter.
Damage to buildings caused by blasting work is unlikely.
In all mining areas the bedrock is covered by sandy moraine of varying thickness and, in
some places, covered by peat. Chemical analysis of soils identified locations where
concentrations of arsenic exceeded the threshold value but were below the lower
guideline value set for contaminated soils (PIMA).
The Lähdeoja ditch flows through the Länttä mine area and will be realigned around the
mine area to retain the existing flow into the Heinäperänlahti in the Ullavanjärvi Lake. The

Keliber Lithium Project
Volume 1 Revision 1 Page 51
ecological status of the lake is healthy with historical data indicating that it is slightly
acidic, dark in colour, rich in humus, solids and iron, and cloudy. Metal concentrations
were not elevated except for iron. The operations are not anticipated to have a significant
impact on the hydrological conditions of the area.
The Emmes underground mine is mainly located beneath the Emmes-Storträsket Lake,
from which water feeds through the Storträsket (Isojärvi Lake) into the Perhonjoki River.
The lake is shallow, humus-rich with a satisfactory ecological status of the lake and a less
than good chemical status. The operations are not anticipated to have a significant impact
on the hydrological conditions of the area.
No mine sites are located within a classified ground water area.
The Rapasaari mine area is approximately 900 m, and Syväjärvi approximately 2 km,
from the boundary of the Vionneva special protected area (SPA). Given that this SPA is a
designated Natura 2000 site, an Appropriate Assessment was undertaken to assess the
impact on habitats specified in the Habitats Directive, species listed in Annex I of the
Birds Directive and on other species of conservation interest. The Appropriate
Assessment confirmed that the impact of the project on the Vionneva SPA is moderate.
Baseline surveys were implemented in the open pit mine areas for flora, the moor frog,
toad, bats, Siberian flying squirrel, nesting avifauna, fish stock, diatoms and benthos.
Surveys did not cover the Emmes mine area. Keliber established five new ponds in the
area of Syväjärvi and Heinäjärvi to support existing moor frog habitat following discovery
of the moor frog during the nature surveys.
Syväjärvi, Heinäjärvi, Outovesi, and Harijärvi Lakes, as well as Näätinkioja ditch have
been classified, following the precautionary principle, as Grade III bat areas. In the mine
or their vicinity, no important feeding grounds or passage routes for bats were observed.
The growing stock structures and forestry type of most of the forestry plantations in the
project area are unsuitable habitats for the Siberian flying squirrel.
Keliber commissioned an operating plan to improve the quality of the golden eagle
territory within the Vionneva SPA area; including the construction of artificial nests outside
the disturbed area, artificial feeding during wintertime and ongoing satellite tracking of the
male eagle.
The water systems and lakes in the mining area offer recreational fishing and fishing for
household needs; and the lower reaches of the Perhonjoki River are fished for
commercial purposes. The Ullavanjoki River is a potential salmonoid breeding river.
The mines (Syväjärvi, Rapasaari, Länttä, Emmes and Outovesi) are in the municipalities
of Kaustinen, Kokkola and Kruunupyy. The principal land use is forestry with some peat
production undertaken. Permanent residences and holiday homes are scattered through
the mining areas; mostly at lakes where recreational activities such as a nature trail, berry
picking, mushroom gathering, hunting and fishing are popular.
Ore will be transported from the mining areas to the Concentrator at Kalavesi via a
combination of forest roads and Main Road 63 (Kauhava-Ylivieska). Rapasaari, Syväjärvi
and Outovesi mining areas will be accessed via a forest road which connects with Main
Keliber Lithium Project
Volume 1 Revision 1 Page 52
Road 63. The Läntta mine (Läntäntie) will be accessed via road (yt) 18097 which also
joins Main Road 63. Project-generated traffic is anticipated to cause a 27% increase over
existing traffic volumes. The significance of traffic impacts on the Main Road 63 caused
by ore transport is estimated to be minor, since the road in question is in good condition
and current traffic volumes on the road are low. Impacts on the forest road, connecting
the mines to Main Road 63, are considered to be minor.
Due to favourable mineralogical and chemical composition of country rock the risk for
acidic and metal bearing waters in mining areas is very small. The run-off water from
open pits will contain residues from nitrogen-containing explosive materials used in
mining. The quality of the water in the pits will be investigated before starting operations
and the results will be used to review and supplement the planned water treatment
method. After the end of the mining operations, the mine areas will continue to be
regularly monitored.
The closure plan will present separate action plans for each site area considering aspects
of public safety, the state of the environment and land use. For all site areas, the required
aftercare and closure measures have been defined in the mining or environmental
legislation.
1.20.3 Concentrator
The Concentrator will be located at Kalavesi, some 5 km to the northeast of the town of
Kaustinen. The EIA process for the Concentrator (Central Ostrobothnian Kalavesi)
commenced in 2016 and the environmental permit for the Kalavesi Concentrator was
granted in 2006. It is currently in the process of being amended and updated.
The modelling results indicated that threshold values for dust (PM10) are not exceeded at
the nearest receptors (permanent residential or holiday homes). The threshold value is
only exceeded in a small part of the plant, no significant residual effects are anticipated.
Crushers, conveyers, mills, blowers and other concentrator equipment are placed inside
buildings and therefore the noise and vibration they generate is minor; the most
significant noise emissions come from traffic on the main road. In general, noise impacts
from the concentrator are anticipated to be minor during the construction, operational and
closure phases.
The Concentrator is located within the Perhonjoki water basin. It is anticipated that there
will be some increases in sodium and sulphate levels in receiving waters associated with
wastewater emissions from the plant. There are no important groundwater areas in the
vicinity of the Concentrator; and the nearest Grade I area is the Oosinharju groundwater
area, located approximately 2.5 km to the west.
There are no old, natural forests in the area, but several commercial forests are present.
Vegetation surveys indicated advanced degradation and habitat change and impacts to
flora and local habitats are expected to be minor given the low level of sensitivity. The
closest Natura 2000 area to the Concentrator is the Pilvineva Ramsar Site (Wetland of
International Importance), located at a distance of 8.5 km therefore an Appropriate
Assessment has not been undertaken and no significant impacts are expected in relation
to protected areas.

Keliber Lithium Project
Volume 1 Revision 1 Page 53
Moor frogs were surveyed and, based on the habitat, the Iso-Kalavesi lake area (outside
the Concentrator site) is classified as a moor frog breeding and resting site, and therefore
protected under the Nature Conservation Act. The overall population of the lakes was
estimated to be several dozens of specimens.
The investigation did not reveal any breeding or resting sites for bats.
A Siberian flying squirrel observation was made in the investigation area but outside the
Concentrator site. Both the mixed forests of Pitkälampi and aspen forests of
Pitkälampinkangas provide suitable habitat for the species; the impact of human
movement and other disturbances on the species is considered to be minor.
Several otter tracks were observed at Iso Kalavesi, Pieni Kalavesi and Pitkälampi, as well
as along Kalavedenoja, near the Vissavesi artificial lake and at the upper and lower ends
of Kalavesi all located outside the Concentrator site. Breeding and resting sites were not
identified in the surveys. The significance of potential impacts is considered negligible.
Avifauna in the area is typical of coniferous forests in Finland. Most of the species, except
for the common crane, also nest in the area or its immediate vicinity. The overall impacts
on bird populations are considered negligible. No valuable, vulnerable presences are
threatened because of the project.
Impacts arising from the operation of the Concentrator are not expected to significantly
impact water quality in relation to fish stocks and fish health.
The area surrounding the Concentrator site is sparsely-populated, with the nearest urban
area of Kaustinen located approximately 5 km to the west. The nearest permanent
settlement is in the village of Kalavesi, located approximately 1000 m to the west. The
nearest holiday homes are also located in Kalavesi, about 200 m from the northern
boundary of the project area. There are no official recreational areas or routes within or
near the project area. The main industries in Kaustinen comprise forestry, agriculture,
retail, construction and small-scale manufacturing (wood, metal, food industry), in addition
to services, such as hotels and restaurant businesses. There are several fur farms and
some of the swamps are used for peat production. Services such as grocery stores, and
schools are available in Kaustinen.
The significance of traffic impacts on the Main Road 63 resulting from ore transport from
the mine sites to the Concentrator is considered to be minor. Impacts on the forest road,
connecting the mines to Main Road 63, are considered to be minor.
Raw water will be taken from the Vissavesi reservoir 2 km from the facility and transferred
via a newly constructed raw water pipeline with an average demand estimated to be
approximately 40 m3/h. Total water discharge is expected to be approximately 40 m3/h.
A closure plan will be prepared for the Concentrator and the pond areas during the
environmental licensing phase. The plan will outline the controlled closure of the entire
production site in stages. After closure, the production site will be used for other industrial
activity, or the buildings and installations will be dismantled where possible. The pond
areas will be brought to a safe condition and landscaped. Post-closure monitoring will be
initiated in accordance with a plan approved by the authorities.
Keliber Lithium Project
Volume 1 Revision 1 Page 54
1.20.4 Hydrometallurgical Plant
The hydrometallurgical plant site will be located within an existing industrial area, Kokkola
Industrial Park (KIP), located close to the harbour area of Kokkola on the west coast of
Finland. The industrial park has a low environmental and social sensitivity. The distance
to the Concentrator is 55 km along paved highway.
Air quality in Kokkola is monitored jointly by environmental officials and industrial facilities.
One monitoring station (Ykspihlaja) continuously measures sulphur dioxide (SO2) and
nitrogen oxides (NOx, NO and NO2) concentrations and respirable particulate matter
(PM10), fine particulates (PM2.5 and PM1) particulates in the KIP area. Nitrogen oxide
emissions from industry and energy production are higher than those from transport-
related emissions; in summer, dust levels increase during windy conditions.
Noise impacts arising from industrial activities are largely confined within the industrial
areas, and the noise levels do not exceed the reference values in adjacent residential
areas. Noise generation will be abated through the application of standard mitigation
measures which is expected to bring noise levels within guideline values. Rail traffic (not
to be increased by Keliber operations) is the second most significant source of noise;
according to estimates. According to the modelling for the EIA, no significant impacts are
expected in relation to ambient noise emissions.
The project is located in the coastal region of the Bothnian Bay. Coastal waters off
Kokkola are part of the water management area of Kokemäenjoki river-Archipelago Sea-
Bothnian Sea. There are two classified groundwater areas in the immediate vicinity of the
planned production area: Patamäki and Harrinniemi. Only the Patamäki water intake
station is actively used now and in recent years, the amount of water pumped from
Patamäki has been approximately 6,700 m3/d and the groundwater table at the water
intake station has been dropping since 2000. The Harrinniemi groundwater area is
classified as suitable for water abstraction but there are no water intake stations in the
groundwater area.
Kokkola belongs to the transient zone between the central and southern boreal areas.
Trees in the area are predominantly pine. The industrial nature of the area is reflected in
the current status of the forest stands where the pines are quite stunted, and algae are
found on many tree trunks.
The nature conservation area nearest to the KIP is the Rummelö-Harrbåda site located
approximately 2.2 km north of the project area, which is classified as a protection area
(SPA) in accordance with the Habitats Directive (SCI) and Birds Directive. The area
covers 236 ha. In addition, the area is included in the national wetland protection
programme. The Harrbåda-Rummelö area is also part of a nature conservation area
established by the City of Kokkola and is an important breeding and feeding ground for
many birds. The nearest important bird area is the Ykspihlaja Pond used by industry for
condensate water. It is eutrophic and its shores are covered by large reed beds. The
pond is used, particularly, by waterfowl as a nesting area. The site is not protected under
Finnish legislation.
The KIP area is industrialised and not a suitable habitat for endangered species or
species included in the Habitats Directive. The project area is not significant for avifauna
Keliber Lithium Project
Volume 1 Revision 1 Page 55
as there are no old-growth forests, spruce stands or any significant numbers of standing
dead trees, which could increase the area’s value in terms of avifauna.
At the end of 2016, Kokkola had a population of approximately 47,700. In 2020, the
population is expected to be about 48,600, in 2025 about 49,600 and in 2030 about
50,300. Kokkola’s economic structure is based on several industries, including chemicals,
metals, boat-making, logistics, fur production, agriculture, forestry and fishing.
The route from the Concentrator to the Hydrometallurgical Plant passes from Kaustinen
via the Toholammintie road (Main Road 63) through the centre of Kaustinen to
Jyväskyläntie (Highway 13), a distance of about 55 km; being fully paved. In Kokkola, the
route continues from Jyväskyläntie to Eteläväylä in the west. After the roundabout, the
route continues along Satamatie road until, within the KIP area, it turns from the
roundabout to the Kemirantie road in a northern direction. The incremental increase in
daily traffic volume associated with the hydrometallurgical plant operation is expected to
be 1% (all traffic) and 7% (heavy traffic).
The production of Lithium Hydroxide results in the generation of solid waste called
Analcime sand. Keliber has reached an agreement in principle with the Kokkola Harbour
Authority for the disposal of Analcime sand in the sections of the harbour expansion
program currently under construction; and that the sulphide-bearing mica schist from
Syväjärvi mine can be used in the infill sections’ banks. The precondition for the
acceptance by the Harbour Authority is confirmation that the material is considered inert
waste. If the Analcime sand does not meet statutory requirements, or the Harbour
Authorities are not satisfied, then an alternative arrangement for disposal will be found. If
necessary, the potentially acid generating material can be stockpiled in the mine site.
Once operations at the Hydrometallurgical Plant cease, the plant area will be used for
other industrial activities. If necessary, the installations and buildings will be dismantled. A
soil and groundwater survey will be carried out in the area and any contaminated areas
will be cleaned and brought to a normal, non-hazardous state. Post-closure monitoring
will be initiated in accordance with a plan approved by the authorities.
1.20.5 Consultation
Stakeholder engagement activities are integrated into the national regulatory EIA process,
applications for mining licenses, and related environmental permits and consents. A
Social Impact Assessment included a questionnaire sent to land owners, inhabitants in
proximity to the mining sites and the Concentrator and along the public roads used for the
transport of ore. The results of the questionnaire indicated that most respondents (60%)
supported the project and 27% did not approve. The remainder of the respondents (13%)
indicated that the mining project is not expected to impact them, and they did not indicate
their support or opposition. Concerns raised included potential impacts associated with
the road transportation of ore, generation of noise from blasting, and potential impacts to
birds and the moor frog.
A grievance mechanism has been designed and is currently being implemented. All
grievances received will be recorded, investigated and monitored until resolved. Contact
details for the grievance mechanism will be disclosed during future engagement activities.
Keliber Lithium Project
Volume 1 Revision 1 Page 56
1.20.6 Land Acquisition & Livelihood Restoration
Land within the Concentrator area is currently being purchased by Keliber on a ‘willing
buyer, willing seller’ arrangement. A brief review of the electronic cadastral map of the
area within which the project facilities are to be located, suggests that the total number of
land owners affected by the entire project could be high. In the location of the mine sites,
Keliber owns only small parcels of the Outovesi mine footprint. However, a Mine Permit
allows Keliber to use the areas required for mining operations, with appropriate
compensation. In the KIP area, the site for the Hydrometallurgical plant is rented from the
Town of Kokkola.
1.20.7 Compliance Assessment
A compliance assessment has been conducted against the Equator Principles and IFC
Performance Standards. Non-compliances identified in term of the International Finance
Corporation (IFC) performance standard include the lack of a formal policy defining the
environmental and social objectives and principles to guide the project to achieve sound
environmental and social performance; and the development of environmental and social
monitoring and review procedure as part of the ESMS. These issues will be addressed at
the earliest opportunity.
1.21 Capital and Operating Costs
1.21.1 Capital Cost Estimate
The capital cost estimate has been prepared based on the input and quotations from the
service providers, major equipment and technology suppliers for the Project with Sweco
compiling the final cost estimate. Sweco also provided capital cost estimates for some
parts of the Project. All costs are presented in Euros. However, the Metso conversion
plant equipment supply was quoted in USD and this has been converted to Euros. The
accuracy of the capital cost estimate, given the current state of design and procurement,
is expected to be within ±15% of final project cost and is therefore in line with AACE
Class 3 estimates.
The capital cost estimate is broken down into direct and indirect costs with the direct
costs comprising the main areas of the Project and the general services which are
common to many areas. The mining cost estimate is relatively low because mining is to
be contracted out so there is no mining fleet included. Indirect costs include EPCM fees,
Owners’ costs and contingency.
A summary of the capital cost estimate for the project development is provided in Table
1-13.
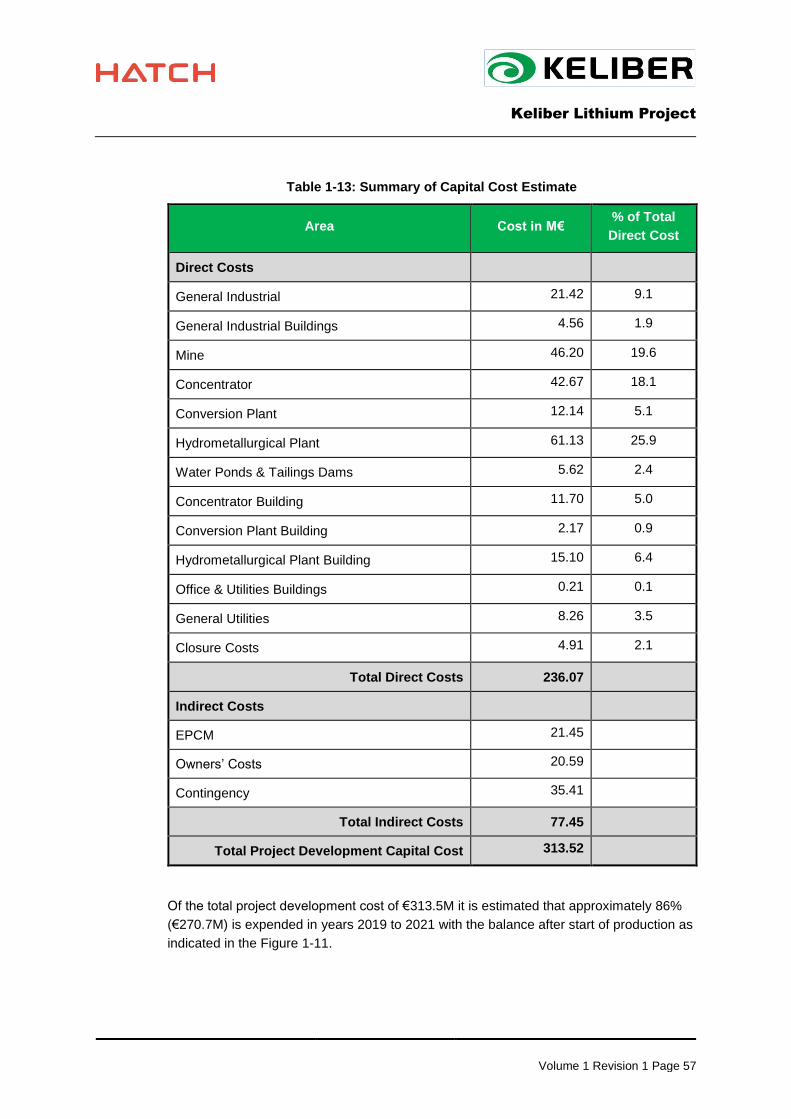
Keliber Lithium Project
Volume 1 Revision 1 Page 57
Table 1-13: Summary of Capital Cost Estimate
Area Cost in M€ % of Total
Direct Cost
Direct Costs
General Industrial 21.42 9.1
General Industrial Buildings 4.56 1.9
Mine 46.20 19.6
Concentrator 42.67 18.1
Conversion Plant 12.14 5.1
Hydrometallurgical Plant 61.13 25.9
Water Ponds & Tailings Dams 5.62 2.4
Concentrator Building 11.70 5.0
Conversion Plant Building 2.17 0.9
Hydrometallurgical Plant Building 15.10 6.4
Office & Utilities Buildings 0.21 0.1
General Utilities 8.26 3.5
Closure Costs 4.91 2.1
Total Direct Costs 236.07
Indirect Costs
EPCM 21.45
Owners’ Costs 20.59
Contingency 35.41
Total Indirect Costs 77.45
Total Project Development Capital Cost 313.52
Of the total project development cost of €313.5M it is estimated that approximately 86%
(€270.7M) is expended in years 2019 to 2021 with the balance after start of production as
indicated in the Figure 1-11.
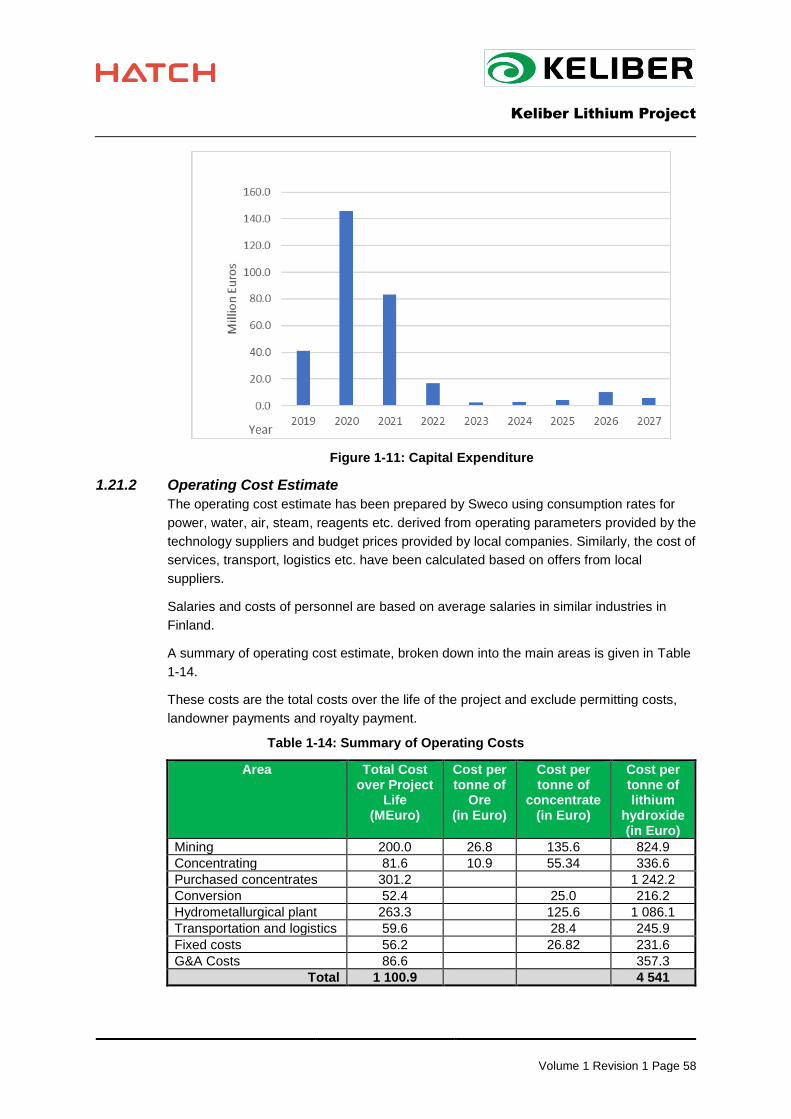
Keliber Lithium Project
Volume 1 Revision 1 Page 58
Figure 1-11: Capital Expenditure
1.21.2 Operating Cost Estimate
The operating cost estimate has been prepared by Sweco using consumption rates for
power, water, air, steam, reagents etc. derived from operating parameters provided by the
technology suppliers and budget prices provided by local companies. Similarly, the cost of
services, transport, logistics etc. have been calculated based on offers from local
suppliers.
Salaries and costs of personnel are based on average salaries in similar industries in
Finland.
A summary of operating cost estimate, broken down into the main areas is given in Table
1-14.
These costs are the total costs over the life of the project and exclude permitting costs,
landowner payments and royalty payment.
Table 1-14: Summary of Operating Costs
Area Total Cost over Project
Life (MEuro)
Cost per tonne of
Ore (in Euro)
Cost per tonne of
concentrate (in Euro)
Cost per tonne of lithium
hydroxide (in Euro)
Mining 200.0 26.8 135.6 824.9
Concentrating 81.6 10.9 55.34 336.6
Purchased concentrates 301.2 1 242.2
Conversion 52.4 25.0 216.2
Hydrometallurgical plant 263.3 125.6 1 086.1
Transportation and logistics 59.6 28.4 245.9
Fixed costs 56.2 26.82 231.6
G&A Costs 86.6 357.3
Total 1 100.9 4 541
Keliber Lithium Project
Volume 1 Revision 1 Page 59
1.22 Other Relevant Data and Information
1.22.1 Schedule
1.22.1.1 Master Schedule
A preliminary master schedule has been prepared for the execution of the Project, it is
targeted to have the environmental permits approved in Q3 2019 after which, when
financing is arranged, the project go-a-head decision will be made. It is expected that the
project execution phase will be approximately 21 months. After installation has been
completed there will be a period of about 2 months of test runs before continuous
production is achieved.
1.22.1.2 Detailed Project Schedule
The most critical activity is the completion of site levelling, earthworks and civil
construction at the Kalavesi concentrator site to enable the start of the erection/
installation of the mechanical equipment as planned.
The equipment with long delivery times for the hydrometallurgical plant are the autoclaves
and evaporators, at approximately 13 months from the date of order. The rotary kiln has a
delivery time of approximately 14 months. Installation of the bearing housing for the kiln
will be started before arrival of the kiln parts to be able to complete the installation in
accordance with the schedule.
The process ramp-up will be started after a test run period. Initially the throughput rate will
be low so that stable operations are established then the throughput rate will be
progressively increased. The ramp-up period is targeted to be approximately 6 months
and will comprise five steps from producing about 100 tonnes lithium hydroxide in month
one to about 800 tonnes in month six.
1.22.2 Project Execution Plan
1.22.2.1 Introduction
It is assumed that the same group of project parties from the DFS phase will continue with
their scope of works in the execution phase. This is to ensure that the knowledge gained
is retained for the execution phase.
The principles of the execution plan are the same both for both Kalavesi Concentrator
and KIP Chemical Plant. The main difference is that in KIP most of the utilities are
available close to the plant compared with Kalavesi where all these must be installed.
1.22.2.2 Objectives
The project can be divided two sections in terms of the execution strategy:
• Section 1: Outotec supply portion, all departments with Outotec equipment but
excluding HVAC, building electrification and civil work. Outotec will be responsible for
the concentrator and the hydrometallurgical plant. An EP+S contract will be awarded
to Outotec for this work which will include:
supply of all equipment, piping, process electrification, instrumentation,
automation and including also erection,
erection supervision and
Keliber Lithium Project
Volume 1 Revision 1 Page 60
commissioning and plant start-up.
• Section 2: Balance of plant (BOP) consisting of items not included in Section 1.
Conversion plant, power boiler, water and effluent treatment plants, HVAC, civil works
and buildings in production plants are included in this section.
1.22.2.3 Approach
An EPCM contractor will be selected to manage the project including project
management, procurement, time scheduling, cost control, engineering co-ordination, part
of the engineering work and construction management.
1.22.2.4 Engineering
The scope of work for the EPCM contractor would include the engineering work for
earthworks, concrete structures, buildings, HVAC, underground piping, building
electrification, piping, electrification and instrumentation not included in equipment
packages and engineering of utilities.
1.22.2.5 Procurement
Although a large portion of the project procurement activities is included in the Outotec,
and Metso packages the portion of the budget for balance of plant is also a significant
sum. Close to 50% of this portion is related to civil works and buildings and the remaining
50% is divided mainly into equipment, piping, HVAC and electrical. Procurement activities
are planned to be co-ordinated by a procurement engineer.
1.22.2.6 Construction Management
The construction manager will manage the construction and erection activities at site
together with his team. This includes quality, safety, cost and schedule management of
the works.
Although there may be shared resources at Kalavesi and KIP construction sites it will be
necessary to have a construction manager at each site.
1.22.2.7 Contracting
Project activities will be grouped into defined purchase packages. The target is that the
purchase packages are such that medium size contractors would also be able to
participate in the bidding process. Potential bidders will be selected from EU countries
which are qualitied to perform the works in the bidding package. Model contracts from
applicable Finnish associations will be used where possible.
1.22.2.8 Construction Quality Control
Quality requirements for construction works will be in accordance with the Finnish
regulations and standards. Applicable regulations and standards will be defined in each
contract. The appointed contractors will be responsible for quality control and its
monitoring including keeping quality records. The construction management team will
undertake systematic checks of the records.
In addition to inspections by the contractors and Keliber staff there will be inspections
from the city inspectors covering buildings, tailings dam structures and pressure vessels.
Keliber Lithium Project
Volume 1 Revision 1 Page 61
1.22.2.9 Cost Control
A cost control engineer will be engaged for the project and be responsible for all cost
control activities.
1.22.2.10 Project Personnel and Organisation
The Project team comprises personnel from Keliber, the main suppliers, EPCM
contractor, civil contractor and MEI-contractor. Detailed plans for project organisation will
be made at the beginning of the project execution.
1.23 Conclusions and Recommendations
The work carried out for evaluating the feasibility of Keliber’s lithium project has followed
industrial practices used in mining and chemical technology. Mineral Resource and Ore
Reserve estimates of the lithium deposits comply with the JORC Code 2012. The
engineering studies are based on test work carried out in internationally recognised
facilities using commonly accepted practices. The capital and operating cost estimates
developed for the project are in line with AACE Class 3 estimates, with an order of
accuracy of ±15%.
Environmental aspects of the Project are important and have been studied in depth to
ensure the impact of the Project is minimised and there is full compliance with all Finnish
environmental regulations, permits and international guidelines.
The DFS report has been prepared by the Keliber project team, which comprises several
individuals and companies, and edited by Hatch as the technical coordinator of the DFS.
In total twenty parties have contributed to the Report, each having a specific area of
responsibility.
Capital and operating costs have been determined and a discounted cash flow model
developed to assess the project economics. The current life of mines is 13 years, but the
project is extended to 20 years by purchasing spodumene concentrates from third parties
for 7 years after the mines are exhausted. Exploration continues in the existing mine
areas and there are good indications of further mineral resources which could extend the
period of mining and the production of spodumene concentrates from Keliber operations.
The values obtained for the key post tax figures, listed below, show that the Project is
profitable.
• NPV at 8% discount - €384 M
• IRR – 24%
• Payback period – 4.1 years These are sensitive mostly to the price of lithium hydroxide and currency fluctuations.
The project risks have been evaluated in workshops and a risk register has been
developed. Risk mitigation plans exists. The summary of the risk assessment by area is
listed below:
Mineral resources and ore reserves:
• The risks related to mineral resources are regarded as very small. The continuity of
the spodumene pegmatite veins is good and a conservative approach has been
Keliber Lithium Project
Volume 1 Revision 1 Page 62
adopted. The ore boundaries are mostly geological even though the cut-off grade has
been applied
• For the ore reserves the biggest risk in the modified factors is the lithium hydroxide
price. Risks related to other modifying factors such as mining, metallurgy, marketing,
legal, environment, social and governmental are regarded as low or very low
• The ore variability risk is regarded as low because the ore bodies show low variability
between and within the deposits as demonstrated by the variability studies. Small
differences between the lithium recoveries between the deposits in minerals
processing are mainly due to differences in the head grade and wall rock dilution. All
these factors have been considered in the developed recovery function which is part
of economic model.
Technical risk related to selected and designed process:
• The design of the process is based on representative samples and a considerable
number of metallurgical studies of different scales. The whole process has been
tested several times at a pilot scale. In the forecasts on lithium recovery a
conservative approach has been selected.
• The designed process is largely based on existing and proven technology which is
widely used in the mining and lithium industry. Optical sorting in lithium mining has
only been applied to a limited extent but is commonly used in other mining industry.
• Soda pressure leaching has been used at an industrial scale as a batch process
whereas the application in continuous mode is novel. However, similar autoclave
processes are common for example in the processing of gold ores, and the
technology has been tested three times at a pilot scale. Outotec, which has
developed the process together with Keliber, has tested the technology successfully
with other lithium ores. Therefore, the technology risk related to soda pressure leach
is regarded as low to medium.
• The process has been designed, sized and the equipment has been selected by
Outotec and Metso, both internationally recognised technology providers. Both have
offered technology packages with process guarantees on throughput, process
recoveries and product quality. These factors lower the technical risk related to
equipment.
Country, social and environmental risks:
• Finland has been continuously ranked as one of the best countries in the world
related to mining jurisdiction (Frazer Institute). Therefore, the country risk is regarded
very minor.
• Keliber’s Project is well supported by the communities, surrounding society
landowners and other stakeholder. Social risks is regarded as very small.
• Aspects related to environmental impact assessment and permit applications have
been discussed carefully and in depth with the authorities. Keliber has received a
special attention as it is the first mining company in Finland accepted for prior
consultancy process in environmental and other permitting already in 2016.

Keliber Lithium Project
Volume 1 Revision 1 Page 63
• In Finland and especially in the Kokkola area there exist educational programmes for
chemical technology from vocational schools to higher education. In the Kokkola area
several large metallurgical and chemical technology companies have substantial
production facilities. Therefore, the risk for not being able to engage a skilled
workforce is low.
Capital and operating costs:
• Capital and operating costs are based on offers from different credible operators.
Technology providers Outotec and Metso have completed careful basic engineering
for Keliber to provide reliable cost estimates.
Project schedule:
• The risks related to project schedule are highest for starting the Project according to
the planned schedule. Here especially permitting and project financing may take
longer than anticipated.
• The project itself has a reasonably tight schedule and delay risks are moderate. The
delay risks exist for the long leading items, managing the project with seasonal
climate challenges and availability of certain subcontractor and human resources.
Economic risks:
• The main economic risks are related to the lithium hydroxide price and exchange rate
(EUR vs. USD) as the project key figures are sensitive to these. Market studies and
Keliber’s position as the first European lithium hydroxide producer support the
forecasts for robust lithium hydroxide price level for the life of mine.
• Risks related to delayed start-up, long ramp-up time and capacity and quality are
estimated to be moderate. Several risk mitigation actions have been planned and are
already in place for lowering the risks.
The recommendations for further work include normal engineering and design work
related to the detailed engineering phase. No major trade-off studies are needed. Recent
test work and development in the hydrometallurgical process indicate that the process
could be made more efficient and operational costs could be lowered; for example, by
processing higher grade concentrate. Verification of these potential savings require
additional test work and piloting. These studies are recommended.
The Project has upside potential in many areas and it is recommended that these are
studied:
• The Central Ostrobothnia Lithium Province has high exploration potential for lithium.
Keliber has successfully increased its mineral resources in recent years and
intensifying the exploration is recommended to locate additional resources. This will
provide additional concentrates, so the processing plants can operate with Keliber
concentrates for a longer period than calculated here.
• Nb-Ta grades are moderate in the deposits and Nb-Ta concentrates are commonly
produced from spodumene pegmatites. Keliber’s test work in the production of Nb-Ta
concentrate has been limited and this should be increased in future.

Keliber Lithium Project
Volume 1 Revision 1 Page 64
• Dense media separation has been tested with Keliber ores and the technique
combined with flotation provides higher lithium recoveries than flotation alone. The
test work should be continued especially for the deposits lower in phosphorous than
in Syväjärvi.
• In the work to date the production planning and economic evaluation are based on
the production of a relatively low-grade concentrate, 4.5% Li2O. Test work has
extended to 6% concentrate and it is recommended that an optimisation model is
developed to be used for economical optimisation of the production.
• In the Chemical plant there are several areas where there exists potential for lowering
the operating costs. It is recommended that these areas are investigated further in
laboratory and pilot test work.
• Analcime sand and quartz-feldspar sand have potential for higher value by-products.
It is recommended that these investigations should be continued.


